Dust/ISM scaling relations \righttitleBogdan A. Pastrav
2022 \volno373 \jnlDoiYr2022 \doival00.0000/xxxxx \aopheadtitleProceedings IAU Symposium
Intrinsic dust and star-formation scaling relations in nearby galaxies
Abstract
Following from our recent work, we present results of a detailed analysis of a representative sample of nearby galaxies. The photometric parameters of the morphological components are obtained from bulge-disk decompositions, using GALFIT software. The previously obtained method and library of numerical corrections for dust, decomposition and projection effects, are used to correct the measured (observed) parameters to intrinsic values. Observed and intrinsic galaxy dust and star-formation related scaling relations are presented, to emphasize the scale of the biases introduced by these effects. To understand the extent to which star-formation is distributed in the young stellar disks of galaxies, star-formation connected relations which rely on measurements of scale-lengths and fluxes / luminosities of H images, are shown. The mean dust opacity, dust-to-stellar mass and dust-to-gas ratios of the sample, together with the main characteristics of the intrinsic relations are found to be consistent with values found in the literature.
keywords:
Galaxy: disk, Galaxy: fundamental parameters, galaxies: ISM, galaxies: spiral, galaxies: structure, (ISM:) dust, extinction, radiative transfer1 Introduction
Accurate dust and star-formation scaling relations are essential in studies of interstellar medium (ISM) evolution, star-formation and galaxy evolution studies, or related to the duty cycle of dust and gas in galaxies. These relations can be affected by numerous biases. Among these, it is known that dust introduces the most significant effects and degeneracies in the observed (measured) photometric and structural parameters of galaxies and their main constituents - discs and bulges, with inclination (projection) and decomposition effects having a non-negligible contribution. These effects are stronger at shorter wavelengths and higher disc inclinations (Tuffs et al. 2004, Pastrav et al. 2013a,b). Obtaining intrinsic relations and show the extent of biases introduced in their characteristic parameters (zero-point, slope, correlation coefficient), is thus very important for the previously mentioned studies.
2 Method
A more detailed and complete description of the method is given in Pastrav (2020). Here we only briefly summarise the main steps. For this study we considered the images of all the unbarred late-type galaxies and lenticulars included in the SINGS (Spitzer Infrared Nearby Galaxies Survey; Kennicutt et al. 2003) and KINGFISH (Key Insights on Nearby Galaxies: a Far-Infrared Survey with Herschel; Kennicutt et al. 2011) surveys, in B band and for H line - in total of 24 galaxies. The B band images were already analysed in Pastrav (2020) and Pastrav (2021). All the images were extracted from the NASA/IPAC Infrared Science Archive (IRSA) and NASA IPAC Extragalactic Database (NED). We then used GALFIT data analysis algorithm (Peng et al. 2010), for the structural analysis of this sample (bulge-disk decomposition). To fit the disc and bulge surface brightness profiles, we used the exponential and Sérsic functions available in GALFIT, and the ”sky” function for an initial estimation of the image background. A complex star-masking routine was used and the integrated fluxes of the galaxies and their main constituents were also calculated, together with all the photometric parameters of interest (see Pastrav 2020). In the next step, central face-on dust opacities (, ) for B band and H line were derived using the empirical correlation found by Grootes et al. (2013), between the face-on dust opacity and stellar mass surface density (see Eq. (5)). This parameter is essential when determining and applying the corrections for dust effects. Further on, the dust masses were calculated with Eqs. (2), (3) in Grootes et al. (2013) (see also Eqs. A1-A5), which rely on Popescu et al. (2011) model for the dust geometry, model which takes into account Draine (2003) dust model. Next, the chain of numerical corrections for projection, dust & decomposition effects and the method described in Pastrav et al. (2013a, b) were applied to the measured parameters to derive all the intrinsic parameters involved in the analysed dust/ISM and star-formation scaling relations. Subsequently, the dust-to-stellar mass ratios and dust-to-gas ratios (observed and corrected) were calculated, using stellar and gas masses found in the literature (e.g. Rémy-Ruyer et al. 2014 & Grossi et al. 2015).
3 Results

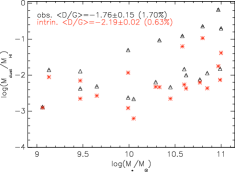
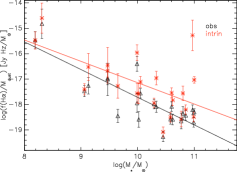
We show in Fig. 1 some of the scaling relations derived and analysed in this study. A more complete
discussion will be presented in a forthcoming paper. On the upper row, in the lefthand plot one can
see an increase in (similar trend for H line) with stellar mass ,
as also recently found by van der Giessen et al. (2022) analysing a much larger sample of galaxies from SDSS & GAMA surveys.
The derived average of the sample, , is consistent with studies done on much larger samples
(e.g Driver et al. 2007 found ; van der Giessen et al. 2022 found 4.1), while our dust mass
values are within the error limits of those derived by Rémy-Ruyer et al. (2014) and Aniano et al. (2020) using completely different methods.
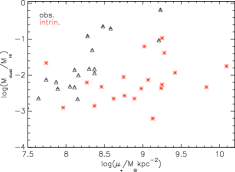
The increasing trends in the vs (upper right plot, with being the neutral hydrogen gas mass,
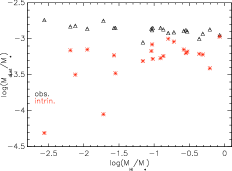
taken from the literature) and vs (middle right) is recovered after applying the corrections,
with the average value for dust-to-gas ratios of -2.19 (or 0.63%) consistent with the one found by Cortese et al. (2012) of -2.1 for
HI normal galaxies; the rms for the former is low (0.15 - obs. & 0.03 - intrin.) while the corresponding correlation coefficient
r=0.55 (obs)/0.36 (intrin) is consistent with found in Cortese et al. (2012). Practically no correlation is observed for the corrected
vs stellar mass surface density (middle left plot), in line with what was found by Cortese et al. (2012) -
r=0.07 vs 0.05. A weaker correlation is found for the vs relation, with .
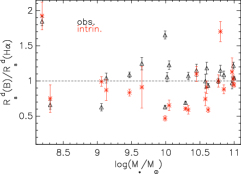
Another scaling relation is shown in the lower right panel, the ratio between the integrated flux (or luminosity) and vs.
, a consequence of and relations, with a derived slope of (obs.)
/ (intrin). In the lower left plot, the ratio of the intrinsic disc scale-lengths seen in optical B band and in line
as a function of stellar mass is shown, with values generally lower than 1.0 as expected, only after applying the numerical corrections.
A mildly increasing trend can be observed. This shows the extent of optical emission in the disc compared with the extent to which star-formation is distributed
in the young stellar discs of galaxies.
Our study underlines the importance of having accurate, unbiased scaling relations in models and studies of ISM evolution and star-formation.
References
- Aniano et al. (2020) Aniano, G., Draine, B. T., Hunt, L. K., Sandstrom, K., Calzetti, D. et al. 2020, ApJ 889, 150
- Cortese et al. (2012) Cortese, L., Ciesla, L., Boselli, A. et al. 2012, A&A, 540, A52
- Draine (2003) Draine, B.T. 2003, ARAA, 41, 241
- Grootes et al. (2013) Grootes, M., Tuffs, R.J., Popescu, C.C. et al. 2013, ApJ, 766, 59
- Grossi et al. (2015) Grossi, M., Hunt, L. K., Madden, S. C. et al. 2015, A&A, 574, A126
- Kennicutt et al. (2003) Kennicutt, R. C., Armus, L., Bendo, G. et al. 2003, PASP, 115, 928
- Kennicutt et al. (2011) Kennicutt, R. C., Calzetti, D., Aniano, G. et al. 2011, PASP, 123, 1347
- Pastrav et al. (2013a) Pastrav, B. A., Popescu, C. C., Tuffs, R. J., Sansom, A. E., 2013a, A&A, 553, A80
- Pastrav et al. (2013b) Pastrav, B. A., Popescu, C. C., Tuffs, R. J., Sansom, A. E. 2013b, A&A, 557, A137
- Pastrav (2020) Pastrav, B. A. 2020, MNRAS, 493, 3580
- Pastrav (2021) Pastrav, B. A. 2021, MNRAS, 506, 452
- Peng et al. (2010) Peng, C. Y., Ho, L. C., Impey, C. D., Rix, H.-W. 2010, AJ, 139, 2097
- Popescu et al. (2011) Popescu, C. C., Tuffs, R. J., Dopita, M. A. et al. 2011, A&A, 527, A109
- Rémy-Ruyer et al. (2014) Rémy-Ruyer, A., Madden, S.C., Galliano, F., Galametz, M., Takeuchi, T. T. et al. 2014, A&A 563, A31
- Rémy-Ruyer et al. (2015) Rémy-Ruyer, A., Madden, S. C., Galliano, F. et al. 2015, A&A, 582, A121
- Tuffs et al. (2004) Tuffs, R. J., Popescu, C. C., Völk, H. J., Kylafis, N. D., Dopita, M. A. 2004, A&A, 419, 821
- van der Giessen et al. (2022) van der Giessen, S. A., Leslie, S. K., Groves, B., Hodge, J. A., Popescu, C. C. et al. 2022, A&A 662, A26