Formation and Eruption of Hot Channels during an M6.5 Class Solar Flare
Abstract
We investigate the formation and eruption of hot channels associated with the M6.5 class flare (SOL2015-06-22T18:23) occurring in NOAA AR 12371 on 2015 June 22. Two flare precursors are observed before the flare main phase. Observations in 94 Å and 131 Å by SDO/AIA have revealed the early morphology of the first hot channel as a group of hot loops, which is termed as seed hot channel. A few seed hot channels are formed above the polarity inversion line (PIL) and the formation is associated with footpoint brightenings’ parallel motion along the PIL, which proceeds into the early stage of the flare main phase. During this process, seed hot channels build up and rise slowly, being accelerated at the peak of the second precursor. They merge in the process of acceleration forming a larger hot channel, which then forms an “inverted ” shape kinking structure. Before the flare peak, the second kinking hot channel with negative crossing appears near the first kinking hot channel that has erupted. The eruption of these two hot channels produce two peaks on the main flare’s GOES light curve. The footpoint brightenings’ propagation along the PIL indicate that the first kinking hot channel may be formed due to zipper reconnection. The occurrence of merging between seed hot channels observed by AIA is supported by the extrapolated nonlinear force-free field models. The observed writhing motion of the first kinking hot channel may be driven by the Lorentz force.
1 Introduction
Solar flares, prominence/filament eruptions and coronal mass ejections (CME) are the three most intense solar activities. The high-speed magnetized plasma contained in magnetic flux ropes (MFRs) released during these solar activities may interact with the magnetosphere and ionosphere, and seriously affect the safety of human high-tech infrastructures. The MFR, a set of helical magnetic field lines wrapping around a common axis, is generally considered to be the fundamental structure in the CME/flare dynamical process (Shibata et al., 1995; Zhang et al., 2012; Cheng & Ding, 2016; Liu, 2020).
The formation of MFR is still an ongoing debate (Patsourakos et al., 2020). Some studies believe that the MFR is present before the eruption (Kopp & Pneuman, 1976; Forbes & Priest, 1995; Titov & Démoulin, 1999). This pre-existent MFR may be formed in the convection zone, but it is forced by magnetic buoyancy to emerge into the corona (Rust & Kumar, 1994; Fan & Gibson, 2003; Fan, 2009; Aulanier et al., 2012). Or it is formed due to the slow magnetic reconnection between sheared arcades in the low corona (Green & Kliem, 2009; Liu et al., 2010; Green et al., 2011; Patsourakos et al., 2013), that is, the shear motion in the photosphere leads to the evolution of the potential field into sheared magnetic field, and as the magnetic field shear increases, the sheared arcades reconnect and the MFR is formed after multiple reconnections (van Ballegooijen & Martens, 1989). Other studies suggest that the MFR is formed during the eruption process. In this case, only sheared arcades exist before eruption. During the eruption, an MFR is formed due to magnetic reconnection between sheared arcades, which then continuously increases the magnetic flux of the MFR (Antiochos et al., 1999; Moore et al., 2001; Karpen et al., 2012). Recent studies demonstrate that there may exist a “hybrid” scenario, in which a seed MFR forms within the sheared arcades via tether-cutting reconnection before eruption, and builds up via flare reconnection during the eruption (Gou et al., 2019; Liu, 2020). Patsourakos et al. (2020) also suggest the pre-eruptive configuration as a “hybrid” state consisting of both sheared arcades and MFRs, with different configurations at different evolutionary stages.
According to whether the magnetic reconnection is involved or not, the triggering mechanism of MFR eruption can be divided into two types. One is magnetohydrodynamic (MHD) instability, including torus instability (TI, Kliem & Török 2006) and kink instability (KI, Fan & Gibson 2003, 2004; Török et al. 2004). In addition, the double arc instability (DAI) is considered to be able to drive the early stage of the eruption (Ishiguro & Kusano, 2017; Kusano et al., 2020). The other type is based on magnetic reconnection. Magnetic reconnections occurring above and below the MFR, correspond to the break-out model (Antiochos et al., 1999; Lynch et al., 2008) and the tether-cutting model (Moore et al., 2001; Jiang et al., 2021), respectively. The formation time of MFR is also different in these mechanisms. In the MHD model, the MFR already exists before the eruption. In the tether-cutting model, the MFR is formed prior to the slow rise phase and grows up in the acceleration phase (Moore et al., 2001). While the MFR is not formed until the acceleration phase in the break-out model (Karpen et al., 2012; Cheng & Ding, 2016).
There are many observational structures in the solar atmosphere related to MFRs, including the sigmoids (Green & Kliem, 2014), filaments and filament channels (van Ballegooijen et al., 1998; Mackay et al., 2010; Su & van Ballegooijen, 2012), hot channels (Cheng et al., 2011; Zhang et al., 2012) and coronal cavities (Low & Hundhausen, 1995). As a new evidence of MFR observation, hot channels usually appear as EUV blobs in the high temperature bands and as dark cavities in the low temperature bands (Cheng & Ding, 2016; Cheng et al., 2017). The height evolution of the hot channel can be fitted with a function consisting of linear and exponential components, which corresponds to the slow rise and the impulsive acceleration of the hot channel, respectively.
The hot channel shows a remarkable morphological evolution in the early stage of the eruption. It often appears as a twisted and/or writhed sigmoidal structure, and then transforms into a semi-circular shape in the slow rise phase, after which the impulsive accelerate begins (Zhang et al., 2012). Writhe is related to the rotation of erupting MFR, and the mechanism governing this rotation has received extensive attention. When the KI occurs, the axis of the MFR rotates rapidly, transforming part of the twist into writhe (Baty, 2001; Török et al., 2014). While recent MHD simulations find that writhe can be transformed into twist along with the rotation of MFR (Zhou et al., 2022). In addition, the external sheared field can also contribute to the rotation of the MFR (Isenberg & Forbes, 2007; Lynch et al., 2009). And the rotations caused by these two mechanisms point in the same direction. The rotation by the external sheared field tends to distribute across a larger height range, and if the sources of the external stabilizing field have a smaller distance than the footpoints of the erupting flux, the external sheared field yields the major contribution to the rotation. The rotation due to twist relaxation tends to work mainly in the low corona with a height range up to several times of the distance between the footpoint of the MFR (Kliem et al., 2012). In addition, magnetic reconnection with the surrounding magnetic field (Shiota et al., 2010), the straightening from the initial S-shape (Török et al., 2010), and the asymmetric deflection of the rising flux during propagation through the overlying field can all contribute to the rotation of the MFR (Yurchyshyn et al., 2009; Panasenco et al., 2011; Kliem et al., 2012).
The formation, eruption and rotation of the MFR are accompanied by the motion of footpoint brightenings, which has been comprehensively studied in a few decades. Su et al. (2006) shows that the footpoint brightenings observed by TRACE widely separate along the PIL in the initial stage, and then move away from the PIL gradually during the impulsive phase. A statistical study of footpoint motion of 50 X and M class two-ribbon flares indicates that both shear motion of conjugate footpoints and ribbon separation are common features in two-ribbon flares (Su et al., 2007). Following the eruption, post-flare loops and their footpoints propagate along the PIL are also observed, and the separation of the flare ribbons perpendicular to the PIL occurs at the same time or immediately after that (Tripathi et al., 2006; Li & Zhang, 2009). In addition, hard X-ray (HXR) kernel motions parallel and perpendicular to the PIL have also been reported in previous studies (Krucker et al., 2005; Liu et al., 2006; Yang et al., 2009). Qiu (2009) terms the two distinct stages of the flare ribbons evolution as stages of “parallel elongation” and “perpendicular expansion”, which can be well explained by the two stages of three-dimensional (3D) reconnection of the erupted flux ropes (3D “zipper reconnection” and quasi-2D “main phase” reconnection) proposed by Priest & Longcope (2017).
The M6.5 class flare occurred on 2015 June 22 in active region NOAA 12371 is a complex flare which contains many physical processes including the tether-cutting reconnection, DAI and TI as suggested by Kang et al. (2019). It has been the subject of numerous studies. Main progresses include the sudden flare-induced rotation of a sunspot and the association with the back reaction of the flare-related restructuring of coronal magnetic field (Liu et al., 2016a), the rotational motions of the photospheric magnetic flux and shear flows (Bi et al., 2017; Wang et al., 2018a), the evidence of a large-scale, long-duration, slipping-type reconnection (Jing et al., 2017), flare-ribbon-related photospheric magnetic field changes and the first evidence of the HXR coronal channel (Liu et al., 2018; Sahu et al., 2020). Wang et al. (2017) studies the two precursors of this flare, and finds the low-atmospheric precursor emissions are closely related to the onset of the main flare.
In our previous paper (Liu et al. 2022, hereafter Paper 1), we have studied the footpoint rotation and writhe of the two hot channels in the M6.5 class flare on 2015 June 22. However, the formation mechanism of the hot channels and their relationship with the two flare precursors are still unclear. The causes of the footpoint rotation and writhe of the hot channels also need further investigation. Therefore, these questions will be addressed in this study. Data set is introduced in Section 2. In Section 3, we present the observations results. We carry out magnetic topology analysis in Section 4. We summarize major findings and discuss the results in Section 5.
2 Data Set
The data used in this study are mainly from the Solar Dynamics Observatory (SDO, Pesnell et al. 2012). The Atmospheric Imaging Assembly (AIA, Lemen et al. 2012) onboard SDO can simultaneously provide full-disk observations in EUV and UV passbands with temporal cadence of 12 and 24 seconds respectively, and the pixel size is 0.′′6. AIA observations in 131 Å, 304 Å, 1600 Å are used to understand the hot channels, filaments, bright kernels and flare ribbons in this region (O’Dwyer et al., 2010). The magnetograms are provided by the Helioseismic Magnetic Imager (HMI, Schou et al. 2012) aboard SDO with a spatial resolution of 0.′′5/pixel, and a cadence of 45 seconds for line of sight (LOS) magnetograms (hmi.M45s series) and 720 seconds for vector magnetograms (hmi.sharpcea720s series). During 16:25–22:50 UT on June 22, 2015, the 1.6-meter Goode Solar Telescope (GST, Cao et al. 2010) at the Big Bear Solar Observatory (BBSO) took observations of the NOAA AR 12371 under excellent seeing conditions. The Visible Imaging Spectrometer (VIS) observations in H (6563 Å) line center with the time cadence of 28 seconds and pixel size of 0.′′03 are used to study the fine-scale structures at the chromosphere in unprecedented detail (Jing et al., 2016). The soft X-ray (SXR) emission of the flare has been recorded by GOES.
3 Observations
3.1 Event Overview
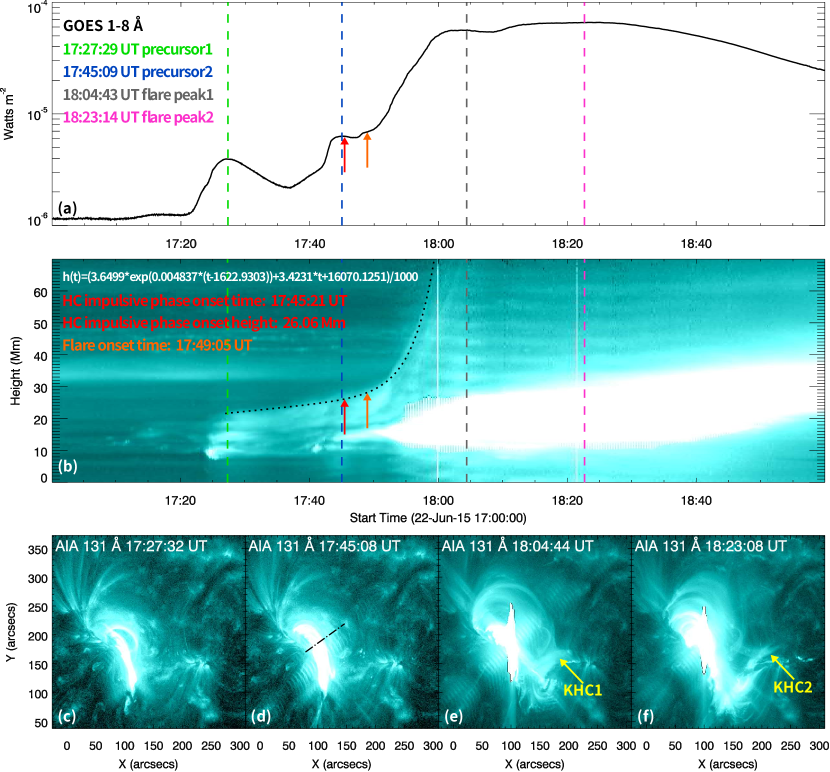
A C1.1 class flare occurs in AR 12371, which is a confined flare without CME (Awasthi et al., 2018), and the peak time is 16:45 UT. Then two flare precursors are observed prior to the main phase of the M6.5 class eruptive flare (Wang et al., 2017). The peak times of the two flare precursors (17:27 UT and 17:45 UT) are marked by the green and blue vertical dashed lines in the GOES light curve shown in Figure 1(a). During the first precursor, seed hot channels build up and rise slowly, being accelerated at the peak of the second precursor, as shown in Figures 1(b)-(d).
The observed height-time plot of the hot channel along the erupting direction (marked as black dash-dotted line in Figure 1(d)) is fitted by an analytic approximation with the combination of linear (slow rise) and exponential (fast rise) functions developed by Cheng et al. (2020), which is shown as the black dotted line in Figure 1(b). Because this active region is close to the solar disk, the estimation of the heights, velocities, and accelerations of the hot channels may be significantly influenced by the projection effect, but the characteristics of the temporal profile of the hot channels are not affected (Cheng et al., 2020). The fitting results show that the onset time of impulsive acceleration phase is 17:45:21 UT ( m, marked by the red arrows in Figures 1(a)-(b)). A comparison of Figures 1(a) and 1(b) shows that the onset of the impulsive acceleration of the seed hot channels is earlier than the flare onset (marked by the orange arrows in Figures 1(a)-(b)). After that, the seed hot channels rise rapidly while the filaments in AIA 304 Å and VIS H images stay behind. After the flare onset, two hot channels form one after another (marked by the yellow arrows in Figures 1(e)-(f)), and they both exhibit a kinking structure with negative crossing. The eruption of these two hot channels produce two peaks (marked by the gray and magenta vertical dashed lines in Figure 1(a)) on the flare’s GOES light curve. The morphological evolution and footpoint motion of these two hot channels are studied in Paper 1.
3.2 Formation and Buildup of the Seed Hot Channels
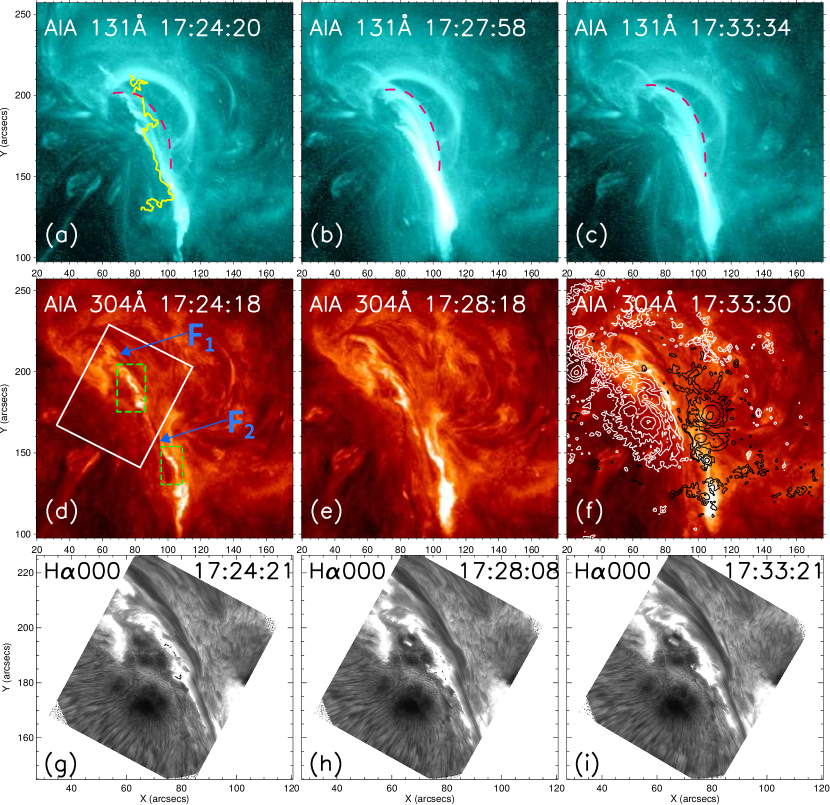
After a high-resolution investigation of the two flare precursors before the M6.5 class flare, Wang et al. (2017) has concluded that the eruption of the main flare is resulted from the successive reconnection between the sheared loops. In this study we focus on the relationship between the flare precursors and the hot channels. The morphological evolution of the two successive episodes of precursors observed by AIA/SDO and VIS/GST is presented in Figures 2-3. At the beginning of these two precursors, brightenings appear on the two sides of the PIL at around 17:24 UT (marked by the green boxes in Figure 2(d)) and 17:42 UT (marked by the green boxes in Figure 3(d)) respectively. Starting from 17:24 UT, a few hot loops are observed in 131 Å by AIA (Figures 2(a)-(c)), which are the early morphology of the hot channel, thus termed as seed hot channels. These seed hot channels are manifested as a group of brightened branches in high-temperature passbands, and the magenta dashed lines in Figures 2(a)-(c) mark the outer edge of them. As more and more hot branches brighten, the shape of the seed hot channels become clear. Two filaments can be identified in the corresponding AIA 304 Å images (pointed by the blue arrows in Figure 2(d)) and the VIS/GST H line center images (Figures 2(g)-(i)), the field of view (FOV) of which is shown in the white box in Figure 2(d). The shape and location of these two filaments remain unchanged during the first flare precursor.
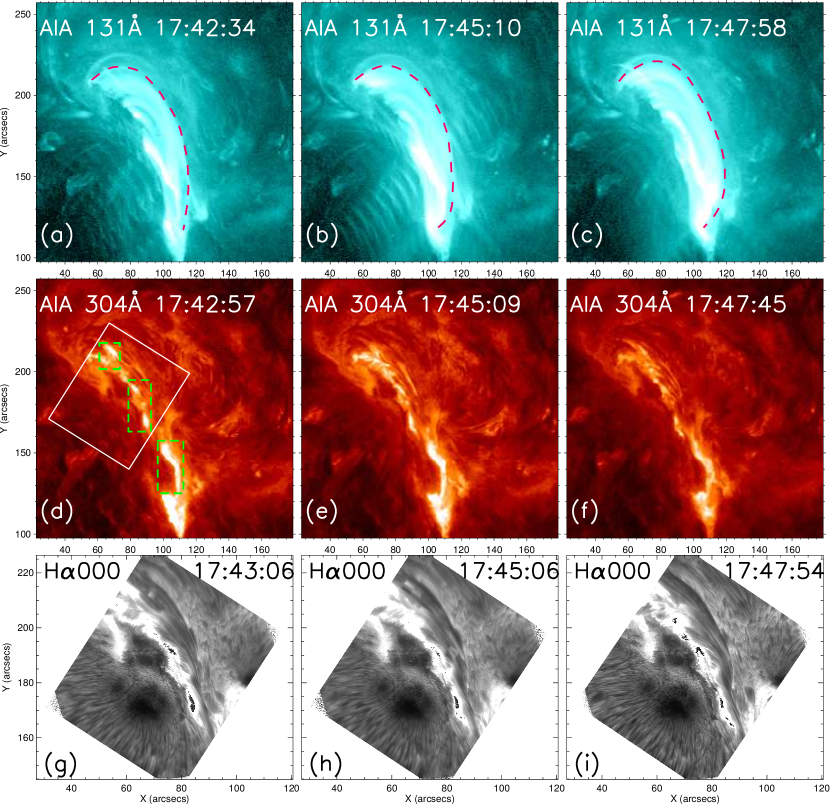
A comparison of Figure 2 and Figure 3 shows that, the brightenings in AIA 131 Å, 304 Å, and VIS H images (Figure 3) during the second flare precursor are brighter than those in the first precursor. At the second precursor, the outer edge of the seed hot channels (marked by the magenta dashed lines in Figures 3(a)-(c)) becomes higher and longer, and the two end points almost connect the two distant ends of the two filaments. As the surrounding brightenings increase, the filaments cannot be clearly recognized in 304 Å by AIA. As shown in the corresponding H images in Figures 3(g)-(i), brightenings and motions of filament materials are identified and the filament becomes wider, which is similar to the seed hot channels.
The seed hot channels appear during the first flare precursor, and becomes significantly larger after the second flare precursor. Their footpoint brightenings are observed at both sides of the PIL during the precursors which is different from the flare ribbons observed during the flare main phase. As we mentioned before, the outer edge of the seed hot channels doesn’t change obviously during the first precursor, and the two footpoints only extend for about 2′′ (Figures 2(a)-(c)). Before the onset of the second precursor, the northern footpoints of the seed hot channels continue to move northward for 2′′, and the southern footpoints expand southward by about 38′′, then the seed hot channels are clearly larger. The locations of the two footpoints hardly change during the second precursor, but the width of the seed hot channels increases significantly. In other words, the observations indicate a buildup process of the seed hot channels from the first precursor to the second precursor.
3.3 Propagation of the Footpoint Brightenings
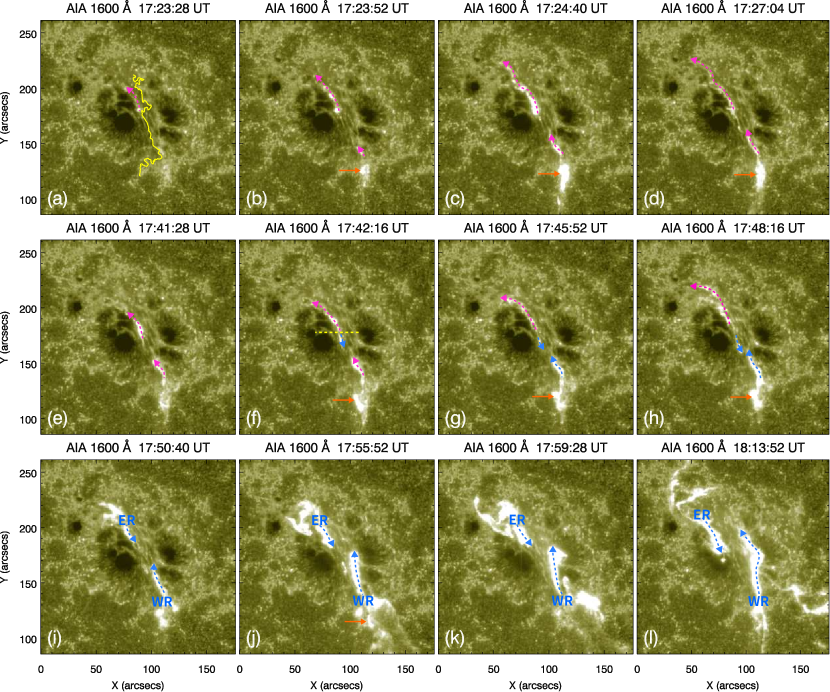
In this subsection, we focus on the propagation direction of the brightenings during the two precursors and the flare main phase. The bright kernels in AIA 1600 Å are shown in Figure 4. At the onset of the first precursor, the bright kernels first appear at the east side of the PIL, and they are tracked by the magenta dashed arrow in Figure 4(a), and the bright kernels gradually move northward (see Figures 4(a)-(b)). Subsequently, a bright kernel appears on the west side of the PIL, which also moves northward parallel to the PIL (see Figures 4(b)-(d)). At the west side of the PIL another bright kernel appears at the south end and gradually extends southward, then evolves into a southward jet (marked by orange arrows in Figures 4(b)-(d)), while the northward propagating bright kernels gradually disappear at the end of the first flare precursor.
At the beginning of the second flare precursor, bright kernels reappear on both sides of the PIL and are more widely distributed than those at the beginning of the first flare precursor (see Figure 4(e)). Immediately, these bright kernels expand and spread toward the north (see Figure 4(f)). Next, the west bright ribbon almost stops moving while the east bright ribbon splits into two parts (northern and southern parts, separated by the yellow dashed line in Figure 4(g)) that move northward and southward, respectively (see Figures 4(f)-(g)). And the southern part of the east bright ribbon almost stops moving after two minutes. After the peak of the second flare precursor, the west bright ribbon and the southern part of the east bright ribbon start converging along the PIL. The northern part of the east bright ribbon keeps moving northward during this process (see Figures 4(f)-(h)). During the second flare precursor, there is also a bright kernel at the southern end of the west bright ribbon, which gradually expands and then evolves into a southward jet (marked by orange arrows in Figures 4(f)-(h)).
After the beginning of the flare main phase, the southern part of the east bright ribbon disappears, and the northern part begins to strengthen significantly, forming a flare ribbon (labeled ‘ER’ in Figures 4(i)-(l)) and gradually moving southward. Another flare ribbon (labeled ‘WR’ in Figures 4(i)-(l)) evolved from the west bright ribbon moves northward obviously. The subsequent southward jet from the western flare ribbon is more intense than those during the two flare precursors (marked by orange arrow in Figure 4(j)). From about 17:56:40 UT, the anti-parallel motion of the two flare ribbons begins to accompany the separation motion, which lasts about ten minutes. Then, with the appearance of flare loops, the two flare ribbons only move away from each other in the direction perpendicular to the PIL (see Figures 4(k)-(l)).
In general, the bright kernels on both sides of the PIL mainly show northward parallel motion during the first precursor. The brightenings show prominent parallel motion toward the north and converging motion along the PIL during the second precursor. During the flare main phase, the brightenings first display converging motion along the PIL, and then expand with converging along the PIL, finally move perpendicular to the PIL.
3.4 Formation and Evolution of the Two Hot Channels
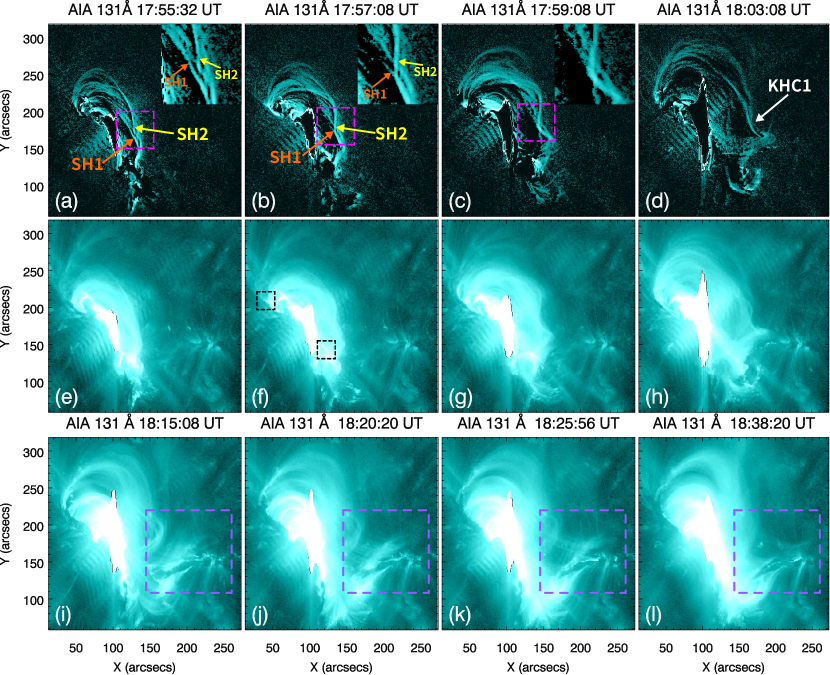
After the onset of the impulsive phase, the seed hot channels expand rapidly. The AIA images in 131 Å show that the seed hot channels consist of multiple branches, which can be seen more clearly from the running-difference images (see Figure 5). Parallel flux tubes with the same twist can merge into a single flux tube near the point of contact (Linton et al., 2001). At 17:55:32 UT, two seed hot channels marked by the orange and yellow arrows (labeled ‘SH1’, ‘SH2’) in Figure 5(a) are identified. These two seed hot channels are close together, but there is a clear gap between them (see Figure 5(a) and its inset). With the expansion of the hot channel, SH1 and SH2 gradually intersect (see Figures 5(b)-(c)), accompanied by the appearance of footpoint brightenings of the seed hot channels (marked by the black boxes in Figure 5(f)), which suggest the occurrence of merge reconnection. In the process of impulsive acceleration, the different branches of the seed hot channels continuously merge, and at 17:59:08 UT, a longer and more twisted hot channel (i.e., the first kinking hot channel, labeled ‘KHC1’ in Figure 5(d)) forms, which subsequently appears as a kinking structure (see Figure 5(d)). About three minutes later, the kinking structure disappears and both footpoints of the first kinking hot channel display an apparent clockwise rotation during the unwrithing of this hot channel, which has been studied in detail in Paper 1.
During the unwrithing of the first kinking hot channel (KHC1), another hot channel (KHC2) appears near the right leg of KHC1 with a kinking structure (marked by the purple box in Figure 5(i)), which can only be barely distinguished at this time due to the envelope of KHC1’s leg. By 18:20:20 UT, the footpoint rotation of KHC1 ends, the kinking structure of KHC2 can be clearly observed, and obvious brightening can be seen at its right footpoint (see Figure 5(j)). Immediately, the left and right footpoints of KHC2 begin to move northward and westward, respectively. The movement of the right footpoint is more obviously, and the KHC2 gradually unwrithes as the right footpoint slides to the west (see Figures 5(j)-(k)). By 18:38:20 UT, the kinking structure almost disappears, and only the brightening at the right footpoint can be seen (see Figure 5(l)).
4 Magnetic Field Modeling
To understand the 3D topology of the source regions of this events, we analyze the magnetic field characteristics of this active region based on the nonlinear force-free field (NLFFF) extrapolations by Awasthi et al. (2018). The vector magnetograms at different times are remapped at the original resolution by the Lambert (cylindrical equal area; CEA) projection method. Then a “pre-processing” procedure is used to remove the net force and torque of the photospheric field to best fit the force-free condition (Wiegelmann et al., 2006). Finally, these “preprocessed” magnetograms are input into the NLFFF code proposed by Wiegelmann (2004) as boundary conditions, and the “weighted optimization” method is applied to obtain the time series of the NLFFF models. The MFR can be identified through mapping magnetic connectivities and computing the twist number () for each individual field line (Liu et al., 2016b). measures the number of turns of a field line winding, and it is calculated by integrating the local density of , , along each field line (Awasthi et al., 2018; Liu et al., 2018).
4.1 Twist Evolution of the Flux Ropes in the NLFFF Extrapolations
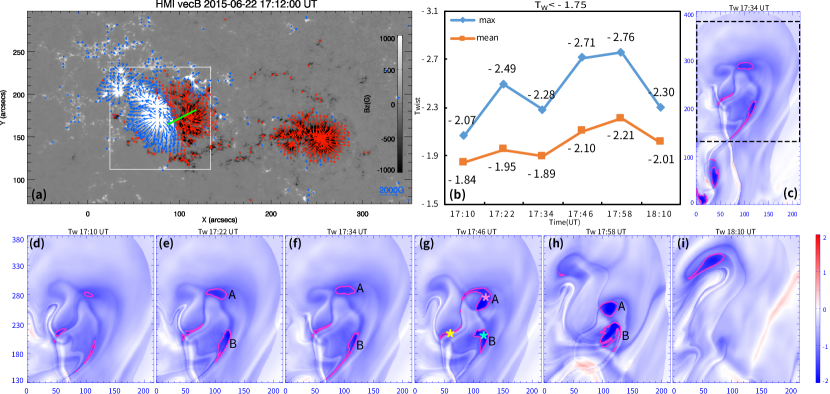
Using the method proposed by Liu et al. (2016b), we calculate the distribution of twist number in this active region. The photospheric vector magnetogram at 17:12 UT is presented in Figure 6(a). The cross sections of the maps in the X-Z plane along the green line marked in Figure 6(a) are presented in Figures 6(c)-(i), in which the contour with is outlined in magenta. At 17:10 UT, the absolute values in three regions exceed 1.75 (see Figure 6(d)). With the beginning of flare precursors, the area of these three regions increases, and the increase of the upper (marked as ‘A’) and right (marked as ‘B’) regions are more obvious (see Figures 6(e)-(f)). At the later stage of the second flare precursor (Figure 6(g)), the left region becomes slender, the area of the upper and right regions increases. Next, the upper and right regions gradually approach. At 18:10 UT, there is only one larger area with on the left (see Figures 6(h)-(i)).
Based on the coronal magnetic field obtained by NLFFF extrapolation, we calculate the variation of mean and maximum values of over time in the area where is lower than in Figures 6(d)-(i), and the calculation results are shown in Figure 6(b). The calculated maximum and mean increase during the flare precursors (except during 17:22 UT-17:34 UT), reach the maximum at 17:58 UT, and then begin to decline.
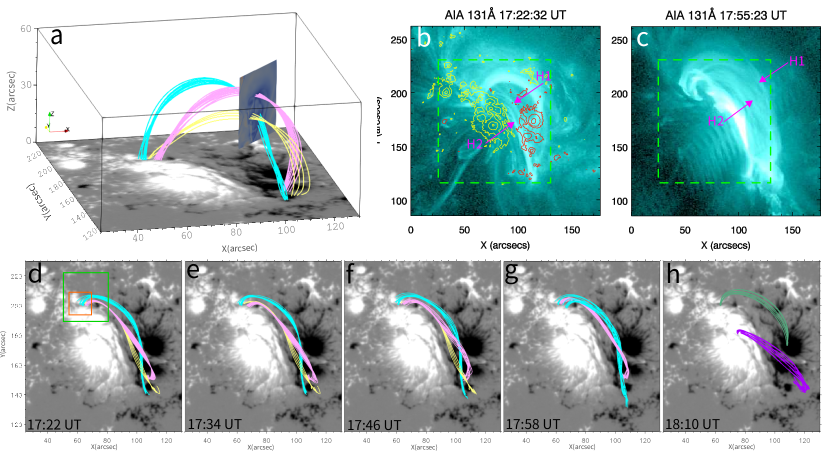
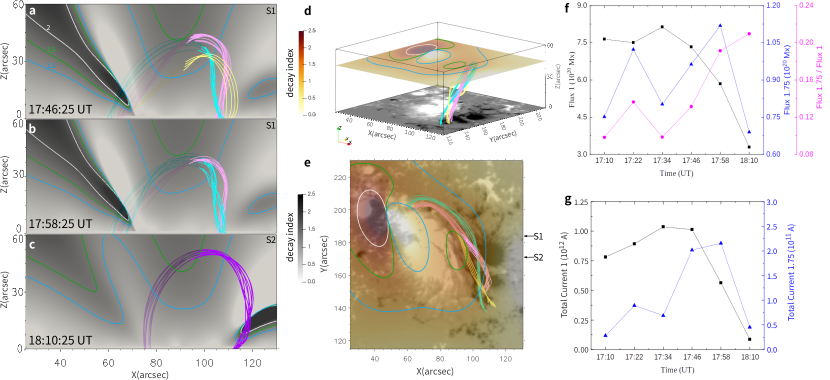
We trace the magnetic field lines passing through these regions with high at different times, and the results are presented in Figure 7. A 3D view of selected magnetic field lines of the NLFFF at 17:34 UT is shown in Figure 7(a), the map in the X-Z plane is also shown in this panel. Yellow, pink and cyan lines represent the flux ropes passing through the strong regions on the left, upper and right sides. We select the central area of the active region (marked by the white box in Figure 6(a)) to study the evolution of these twisted flux ropes. The flux ropes represented by the same color are displayed with the same resolution at different times. From 17:22 UT to 17:58 UT, the projections of pink and cyan flux ropes on the X-Y plane are getting closer and closer, while the yellow flux rope disappears at 17:58 UT. The shape and relative positions of the cyan and pink flux ropes at 17:22 UT and 17:58 UT are similar to the seed hot channels H1 and H2 (marked by magenta arrows in Figures 7(b)-(c)) observed in AIA 131 Å at the corresponding time. The FOV of images in panels (d)-(h) is marked by the green boxes in panels (b) and (c). It can be seen that the height and length of the extrapolated magnetic field lines are smaller than those of the observed hot channels. This may be caused by uncertainties of the magnetic field measurements or over-smoothing of the vector field by the extrapolation preprocessing. Because the flux ropes during the eruption process is under Lorentz force, it is difficult to be well reproduced by NLFFF (Cheng & Ding, 2016). At 18:10 UT, only one new twisted flux rope can be identified (purple line in Figure 7(h)), and its X-Z cross section corresponds to the area surrounded by the magenta contour in Figure 6(i). The right footpoint of this new flux rope is near the right footpoint of the disappeared pink flux rope, but the left footpoint is far away from the left footpoint of the original flux rope.
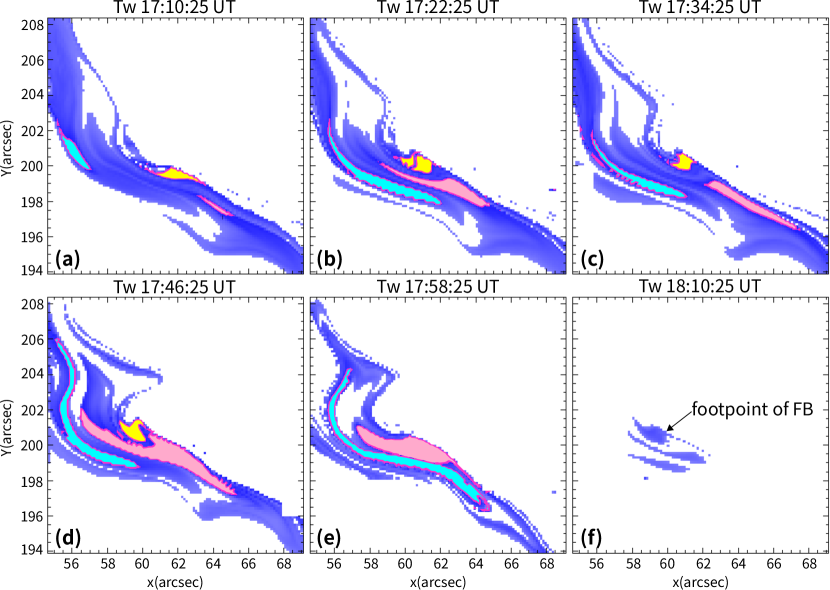
In order to study the footpoint motion of these flux ropes during the flare, we select the area surrounded by the orange box in Figure 7(d) to show the temporal evolution of the left footpoint of these flux ropes, and the results are presented in Figure 8. To better show the evolution, only the twist distribution at the locations with is shown, and the twist values at other locations are set to zero. The magenta contours represent the at -1.75. The footpoints of the cyan, yellow and pink flux ropes are filled with corresponding colors respectively. At 17:10:25 UT, these three flux ropes are separated from each other (see Figure 8(a)). The footpoint areas (especially the cyan and pink areas) increase significantly with the beginning of the first precursor (see Figure 8(b)), so they appear to close to each other. At the end of the first precursor (see Figure 8(c)), the footpoints seem to separate from each other again, which may be caused by the decrease of the yellow areas and the deformation of the pink areas. During the second precursor, with the significantly increase of the cyan and pink areas (see Figure 8(d)), the three footpoints gather together again. The yellow footpoint is surrounded by the pink footpoint at 17:46:25 UT. By 17:58:25 UT, the yellow footpoint area disappears, the cyan and pink footpoint areas connect together. At 18:10:25 UT, the footpoints of the original flux ropes disappear (see Figure 8(f)), and a flux bundle represented by the green lines (see Figure 7(f)) appears with the same left footpoint position as the original flux rope and smaller twist.
4.2 Torus Instability of the Extrapolated Flux ropes
As we mentioned before, the onset of the fast rise of the seed hot channels is earlier than the flare onset, which suggests that the initiation of the impulsive acceleration of the seed hot channels is unlikely caused by flare reconnection. The torus instability occurs when the inward tension force generated by the background magnetic field decreases faster than the outward hoop force (Kliem & Török, 2006; Fan & Gibson, 2007). TI is quantified by the decay index n, which is defined by . Here, B denotes the background magnetic field strength and z denotes the height above the solar surface (Cheng et al., 2013a). Previous studies suggest that the threshold value of decal index is lie in a range of 1.1-2, and normally 1.5 for a toroidal flux rope (Török & Kliem, 2005; Kliem & Török, 2006; Aulanier et al., 2010). To investigate the initiation mechanism of the impulsive acceleration of the seed hot channels, we calculate the decay index of the background magnetic field, the background field is obtained from the potential field model. Since the vertical component does not contribute to the downward constraining force applied to the flux rope, only the horizontal component of the coronal magnetic field is considered in the calculation of the decay index (Cheng et al., 2013b).
The relationship between the position of the magnetic flux ropes and the distribution of decay index at different times are shown in Figure 9. The blue, green and white contours represent the values of decay index at 1.1, 1.5 and 2, respectively. Panels (d) and (e) show two different 3D views at 17:46:25 UT, where the orange plane represents the distribution of the decay index on the X-Y plane above the highest flux rope. It can be seen that the flux ropes are very close to the contour of the decay index 1.5. From the positions of the top of the flux rope closest to the contour at different times, we show the X-Z plane that cuts the X-Y plane at S1 (Figure 9(e)) for the time 17:46:25 UT and 17:58:25 UT, and the X-Z plane at S2 for 18:10:25 UT. The distribution of the decay index of the three different planes and the position of the flux ropes are shown in Figures 9(a)-(c). The highest pink flux ropes do not intersect with the contour of until 18:10:25 UT, so the extrapolation results suggest that the seed hot channels do not reach the threshold of torus instability before the impulsive acceleration. Combined with the fact that the onset of the seed hot channels acceleration starts earlier than the associated flare, the fast “flare reconnection” unlikely triggers the hot channels acceleration (Cheng et al., 2020). In summary, the reconnection during the second flare precursor perhaps contributes to the initiation of the hot channels impulsive rise.
4.3 Driving Mechanisms of the Observed Writhing Motion
When the twist of the MFR exceeds the critical value (approximately 3.5 , i.e. 1.75 turn, but changes with different aspect ratio of the loops involved), the kink instability will occur and part of the twist of the MFR will be transformed into writhe (Baty, 2001; Török et al., 2014). In a data-constrained MHD simulation, Inoue et al. (2018) have found that a series of small flux ropes reconnect with each other in the early stage of the eruption, forming a large and highly twisted flux rope, which is similar to the first kinking hot channel in our event. Both hot channels in this event show a writhing motion during the eruption. We calculate the photospheric magnetic flux of the area surrounded by the green box in Figure 7(d), which is large enough to include the whole left footpoint area of the flux rope. The temporal evolution of magnetic flux in the region with and , and the evolution of the ratio of magnetic flux in the region with to that in the region with are shown in Figure 9(f). The results show that the magnetic flux in the region with increases rapidly after 17:34:25 UT, while the magnetic flux in the region with decreases after 17:34:25 UT. The ratio of the magnetic flux in the region with to the magnetic flux in the region with increases obviously, but the proportion in the region with does not exceed 30 both before and after the writhing motion of the flux rope. Therefore, KI may not be the main driver of writhing motion of the first kinking hot channel in this event (Inoue et al., 2018).
Once the flux rope starts to rise up, it is out of its initial equilibrium, and the Lorentz force becomes non-zero and can act on the MFR and rotate it (Isenberg & Forbes, 2007). This can be reflected by the increase of the total current in the cross section of the flux rope during its rising (Inoue et al., 2018). Figure 9(g) shows that the evolutions of total current vertically crossing the footpoint of the MFR (marked by the green box in Figure 7(d)) in the region with and , which are similar to the evolution of magnetic flux. The total current in the region with begins to increase rapidly at 17:34 UT and decreases rapidly after the writhing motion of the hot channel. This suggests that the Lorentz force might contribute to the writhing motion of MFR. In addition, during the rise of the flux rope, the magnetic tension of the twisted magnetic fields will be released, and whether KI is triggered or not, the release of magnetic tension can also contribute to the writhing of the flux rope axis (Kliem et al., 2012). Therefore, the writhing motion of the first kinking hot channel may be driven by a combination of these two mechanisms.
5 Summary and Discussions
We investigate the formation and eruption of hot channels during the M6.5 class flare occurring on 2015 June 22 using both observations and NLFFF extrapolations. There are two precursors before the flare main phase. The seed hot channels appear after the onset of the first precursor and grow gradually. During the second precursor, the footpoints’ position of the seed hot channels hardly changes, but the width of the seed hot channels increases significantly. After the peak of the second precursor, the impulsive acceleration of the hot channels begins. In the process of acceleration, merge reconnection between different seed hot channels likely occurs, forming a longer and more twisted flux rope. The newly formed hot channel soon evolves into an obvious kinking structure. After the first kinking hot channel disappears, the second hot channel appears with an existing kinking structure at an adjacent location. The eruption of these two hot channels produce two peaks on the flare’s GOES light curve, which is similar to Wang et al. (2018b). In this study we focus on the formation and writhing motion of the first hot channel, and those of the second hot channel is unclear due to the strong background emission.
With the appearance and buildup of the hot channels, footpoint brightenings motion parallel to and perpendicular to the PIL are observed by SDO/AIA. Priest & Longcope (2017) proposed that magnetic reconnection has two phases: the 3D “zipper reconnection” between sheared arcades related to the elongation of the flare ribbons along the PIL, and the quasi-2D “main phase reconnection” of unsheared fields around the flux rope related to the expansion of flare ribbons away from the PIL. In the current event, the motion of brightenings along the PIL is observed during two flare precursors and the beginning of the flare main phase, and the expansion of brightening perpendicular to the PIL is observed after the onset of the flare main phase. During the first precursor of this event, the brightenings on the two sides of the PIL mainly show parallel motion toward the north, which may correspond to the “simple zippettes” reconnection between sheared arcades, and leads to the formation of flux ropes (Priest & Longcope, 2017). The brightenings on the two sides of the PIL mainly show parallel motion toward the north during the second precursor, and this observation may be due to the occurrence of “helical zippettes” reconnection on the foundation of the flux rope formed during the first precursor, which results in the further twist accumulation in the flux ropes. From the late stage of the second flare precursor to the impulsive rise of the flare, the observed simultaneous southward and northward converging motion of footpoint brightenings may correspond to the occurrence of “converging reconnection” between the flux ropes formed during the two flare precursors. That is, these flux ropes reconnect into a new flux rope which is much longer and has a much stronger twist (Priest & Longcope, 2017). The converging reconnection is similar to the “rr-fr” reconnection that involves two flux-rope field lines that reconnect in to another multi-turn flux-rope field line and a flare loop proposed by Aulanier & Dudík (2019). In addition to the footpoint motion, the three jets observed during the two flare precursors and flare main phase accompanying the footpoint motion also support the occurrence of magnetic reconnection.
We have constructed a series of NLFFF extrapolations based on the single, isolated vector magnetograms observed by SDO/HMI before and during the eruption. The extrapolations incorporate no information about the prior evolution of the photospheric and coronal magnetic field (Cheung & DeRosa, 2012). One important condition for using NLFFF is that the magnetic field must evolve slowly compared to the Alfv’en crossing time (Savcheva et al., 2012). Therefore, our NLFFF extrapolations can model the buildup phase of a flux rope before the eruption, but they fail in correctly describing the intrinsic dynamic evolution of the magnetic configuration and plasma properties, since these magnetic fields are independent of each other (Kliem et al., 2013; Jiang et al., 2014). Our NLFFF extrapolations show that the mean and maximum values of in the region with increase significantly during both flare precursors and main phases, and reach a maximum after the onset of the flare main phase. These results suggest the continuous twist accumulation through difference phases, which is consistent with the increase of twist of the flux rope in the envisaged zipper reconnection process. A series of NLFFF extrapolations show that two flux ropes with negative twist gradually widen and hence approach each other and only one flux rope is identified after the eruption onset. In the mean time, the AIA 131 Åobservations show that seed hot channels gradual approach and merge into a much longer and more twisted hot channel, which is consistent with the theory that parallel flux tube with the same twist can merge into a single flux tube (Linton et al., 2001). Thus both observations and extrapolations imply the occurrence of zipper reconnection and merging between seed hot channels.
The impulsive acceleration of the hot channels begins after the peak of the second flare precursor, which suggests that magnetic reconnection may contribute to the initiation of the impulsive acceleration of the hot channels. The relative position between the selected flux rope filed lines and the decay index distribution on the X-Z section indicates the height of flux rope does not reach the critical height of TI until about 20 minutes after the beginning of impulsive acceleration. Therefore, the onset of impulsive acceleration of the hot channels is unlikely driven by TI, which is consistent with the conclusion of Kang et al. (2019). Their study also suggests that the system is unstable against the DAI caused by the additional upward Lorentz force on the bent of double-arc current loop, and it can happen even if the system does not reach the critical of TI (Ishiguro & Kusano, 2017; Kusano et al., 2020). However, our study suggests that magnetic reconnection during the flare precursors may also play an important role in the onset of the impulsive acceleration of the hot channels.
Our results can be summarized as follows: (1) The seed hot channels appear and build up during the two flare precursors, and at these stages the footpoint motion parallel to the PIL suggests the occurrence of zipper reconnection. (2) “Simple zippettes” reconnection during the first flare precursor leads to the formation of the seed hot channels and contributes to the continuous buildup. “Helical zippettes” reconnection during the second flare precursor plays an important role in the onset of the impulsive acceleration of the hot channels. (3) The merging between the seed hot channels leads to the substantial twist buildup of the first kinking hot channel, which shows writhing motion during its fast rise. The increase of Lorentz force is identified associated with the writhing motion, which may be driven by the combined effect of the Lorentz force induced by the external sheared field and the magnetic tension release of the twisted field. (4) Unlikely driven by TI, the impulsive acceleration of the hot channels may be attributed to magnetic reconnection during the second flare precursor.
References
- Antiochos et al. (1999) Antiochos, S. K., DeVore, C. R., & Klimchuk, J. A. 1999, ApJ, 510, 485, doi: 10.1086/306563
- Aulanier & Dudík (2019) Aulanier, G., & Dudík, J. 2019, A&A, 621, A72, doi: 10.1051/0004-6361/201834221
- Aulanier et al. (2012) Aulanier, G., Janvier, M., & Schmieder, B. 2012, A&A, 543, A110, doi: 10.1051/0004-6361/201219311
- Aulanier et al. (2010) Aulanier, G., Török, T., Démoulin, P., & DeLuca, E. E. 2010, ApJ, 708, 314, doi: 10.1088/0004-637X/708/1/314
- Awasthi et al. (2018) Awasthi, A. K., Liu, R., Wang, H., Wang, Y., & Shen, C. 2018, ApJ, 857, 124, doi: 10.3847/1538-4357/aab7fb
- Baty (2001) Baty, H. 2001, A&A, 367, 321, doi: 10.1051/0004-6361:20000412
- Bi et al. (2017) Bi, Y., Yang, J., Jiang, Y., et al. 2017, ApJ, 849, L35, doi: 10.3847/2041-8213/aa960e
- Cao et al. (2010) Cao, W., Gorceix, N., Coulter, R., et al. 2010, Astronomische Nachrichten, 331, 636, doi: 10.1002/asna.201011390
- Cheng & Ding (2016) Cheng, X., & Ding, M. D. 2016, ApJS, 225, 16, doi: 10.3847/0067-0049/225/1/16
- Cheng et al. (2017) Cheng, X., Guo, Y., & Ding, M. 2017, Science China Earth Sciences, 60, 1383, doi: 10.1007/s11430-017-9074-6
- Cheng et al. (2013a) Cheng, X., Zhang, J., Ding, M. D., Liu, Y., & Poomvises, W. 2013a, ApJ, 763, 43, doi: 10.1088/0004-637X/763/1/43
- Cheng et al. (2013b) Cheng, X., Zhang, J., Ding, M. D., et al. 2013b, ApJ, 769, L25, doi: 10.1088/2041-8205/769/2/L25
- Cheng et al. (2020) Cheng, X., Zhang, J., Kliem, B., et al. 2020, ApJ, 894, 85, doi: 10.3847/1538-4357/ab886a
- Cheng et al. (2011) Cheng, X., Zhang, J., Liu, Y., & Ding, M. D. 2011, ApJ, 732, L25, doi: 10.1088/2041-8205/732/2/L25
- Cheung & DeRosa (2012) Cheung, M. C. M., & DeRosa, M. L. 2012, ApJ, 757, 147, doi: 10.1088/0004-637X/757/2/147
- Fan (2009) Fan, Y. 2009, ApJ, 697, 1529, doi: 10.1088/0004-637X/697/2/1529
- Fan & Gibson (2003) Fan, Y., & Gibson, S. E. 2003, ApJ, 589, L105, doi: 10.1086/375834
- Fan & Gibson (2004) —. 2004, ApJ, 609, 1123, doi: 10.1086/421238
- Fan & Gibson (2007) —. 2007, ApJ, 668, 1232, doi: 10.1086/521335
- Forbes & Priest (1995) Forbes, T. G., & Priest, E. R. 1995, ApJ, 446, 377, doi: 10.1086/175797
- Gou et al. (2019) Gou, T., Liu, R., Kliem, B., Wang, Y., & Veronig, A. M. 2019, Science Advances, 5, 7004, doi: 10.1126/sciadv.aau7004
- Green & Kliem (2009) Green, L. M., & Kliem, B. 2009, ApJ, 700, L83, doi: 10.1088/0004-637X/700/2/L83
- Green & Kliem (2014) Green, L. M., & Kliem, B. 2014, in Nature of Prominences and their Role in Space Weather, ed. B. Schmieder, J.-M. Malherbe, & S. T. Wu, Vol. 300, 209–214, doi: 10.1017/S1743921313010983
- Green et al. (2011) Green, L. M., Kliem, B., & Wallace, A. J. 2011, A&A, 526, A2, doi: 10.1051/0004-6361/201015146
- Inoue et al. (2018) Inoue, S., Shiota, D., Bamba, Y., & Park, S.-H. 2018, ApJ, 867, 83, doi: 10.3847/1538-4357/aae079
- Isenberg & Forbes (2007) Isenberg, P. A., & Forbes, T. G. 2007, ApJ, 670, 1453, doi: 10.1086/522025
- Ishiguro & Kusano (2017) Ishiguro, N., & Kusano, K. 2017, ApJ, 843, 101, doi: 10.3847/1538-4357/aa799b
- Jiang et al. (2014) Jiang, C., Wu, S. T., Feng, X., & Hu, Q. 2014, ApJ, 780, 55, doi: 10.1088/0004-637X/780/1/55
- Jiang et al. (2021) Jiang, C., Feng, X., Liu, R., et al. 2021, Nature Astronomy, 5, 1126, doi: 10.1038/s41550-021-01414-z
- Jing et al. (2017) Jing, J., Liu, R., Cheung, M. C. M., et al. 2017, ApJ, 842, L18, doi: 10.3847/2041-8213/aa774d
- Jing et al. (2016) Jing, J., Xu, Y., Cao, W., et al. 2016, Scientific Reports, 6, 24319, doi: 10.1038/srep24319
- Kang et al. (2019) Kang, J., Inoue, S., Kusano, K., Park, S.-H., & Moon, Y.-J. 2019, ApJ, 887, 263, doi: 10.3847/1538-4357/ab5582
- Karpen et al. (2012) Karpen, J. T., Antiochos, S. K., & DeVore, C. R. 2012, ApJ, 760, 81, doi: 10.1088/0004-637X/760/1/81
- Kliem et al. (2013) Kliem, B., Su, Y. N., van Ballegooijen, A. A., & DeLuca, E. E. 2013, ApJ, 779, 129, doi: 10.1088/0004-637X/779/2/129
- Kliem & Török (2006) Kliem, B., & Török, T. 2006, Phys. Rev. Lett., 96, 255002, doi: 10.1103/PhysRevLett.96.255002
- Kliem et al. (2012) Kliem, B., Török, T., & Thompson, W. T. 2012, Sol. Phys., 281, 137, doi: 10.1007/s11207-012-9990-z
- Kopp & Pneuman (1976) Kopp, R. A., & Pneuman, G. W. 1976, Sol. Phys., 50, 85, doi: 10.1007/BF00206193
- Krucker et al. (2005) Krucker, S., Fivian, M. D., & Lin, R. P. 2005, Advances in Space Research, 35, 1707, doi: 10.1016/j.asr.2005.05.054
- Kusano et al. (2020) Kusano, K., Iju, T., Bamba, Y., & Inoue, S. 2020, Science, 369, 587, doi: 10.1126/science.aaz2511
- Lemen et al. (2012) Lemen, J. R., Title, A. M., Akin, D. J., et al. 2012, Sol. Phys., 275, 17, doi: 10.1007/s11207-011-9776-8
- Li & Zhang (2009) Li, L., & Zhang, J. 2009, ApJ, 690, 347, doi: 10.1088/0004-637X/690/1/347
- Linton et al. (2001) Linton, M. G., Dahlburg, R. B., & Antiochos, S. K. 2001, ApJ, 553, 905, doi: 10.1086/320974
- Liu et al. (2006) Liu, C., Lee, J., Deng, N., Gary, D. E., & Wang, H. 2006, ApJ, 642, 1205, doi: 10.1086/501000
- Liu et al. (2016a) Liu, C., Xu, Y., Cao, W., et al. 2016a, Nature Communications, 7, 13104, doi: 10.1038/ncomms13104
- Liu et al. (2018) Liu, L., Cheng, X., Wang, Y., et al. 2018, ApJ, 867, L5, doi: 10.3847/2041-8213/aae826
- Liu (2020) Liu, R. 2020, Research in Astronomy and Astrophysics, 20, 165, doi: 10.1088/1674-4527/20/10/165
- Liu et al. (2010) Liu, R., Liu, C., Wang, S., Deng, N., & Wang, H. 2010, ApJ, 725, L84, doi: 10.1088/2041-8205/725/1/L84
- Liu et al. (2016b) Liu, R., Kliem, B., Titov, V. S., et al. 2016b, ApJ, 818, 148, doi: 10.3847/0004-637X/818/2/148
- Liu et al. (2022) Liu, Y., Su, Y., Liu, R., et al. 2022, ApJ, 930, 130, doi: 10.3847/1538-4357/ac63ac
- Low & Hundhausen (1995) Low, B. C., & Hundhausen, J. R. 1995, ApJ, 443, 818, doi: 10.1086/175572
- Lynch et al. (2008) Lynch, B. J., Antiochos, S. K., DeVore, C. R., Luhmann, J. G., & Zurbuchen, T. H. 2008, ApJ, 683, 1192, doi: 10.1086/589738
- Lynch et al. (2009) Lynch, B. J., Antiochos, S. K., Li, Y., Luhmann, J. G., & DeVore, C. R. 2009, ApJ, 697, 1918, doi: 10.1088/0004-637X/697/2/1918
- Mackay et al. (2010) Mackay, D. H., Karpen, J. T., Ballester, J. L., Schmieder, B., & Aulanier, G. 2010, Space Sci. Rev., 151, 333, doi: 10.1007/s11214-010-9628-0
- Moore et al. (2001) Moore, R. L., Sterling, A. C., Hudson, H. S., & Lemen, J. R. 2001, ApJ, 552, 833, doi: 10.1086/320559
- O’Dwyer et al. (2010) O’Dwyer, B., Del Zanna, G., Mason, H. E., Weber, M. A., & Tripathi, D. 2010, A&A, 521, A21, doi: 10.1051/0004-6361/201014872
- Panasenco et al. (2011) Panasenco, O., Martin, S., Joshi, A. D., & Srivastava, N. 2011, Journal of Atmospheric and Solar-Terrestrial Physics, 73, 1129, doi: 10.1016/j.jastp.2010.09.010
- Patsourakos et al. (2013) Patsourakos, S., Vourlidas, A., & Stenborg, G. 2013, ApJ, 764, 125, doi: 10.1088/0004-637X/764/2/125
- Patsourakos et al. (2020) Patsourakos, S., Vourlidas, A., Török, T., et al. 2020, Space Sci. Rev., 216, 131, doi: 10.1007/s11214-020-00757-9
- Pesnell et al. (2012) Pesnell, W. D., Thompson, B. J., & Chamberlin, P. C. 2012, Sol. Phys., 275, 3, doi: 10.1007/s11207-011-9841-3
- Priest & Longcope (2017) Priest, E. R., & Longcope, D. W. 2017, Sol. Phys., 292, 25, doi: 10.1007/s11207-016-1049-0
- Qiu (2009) Qiu, J. 2009, ApJ, 692, 1110, doi: 10.1088/0004-637X/692/2/1110
- Rust & Kumar (1994) Rust, D. M., & Kumar, A. 1994, Sol. Phys., 155, 69, doi: 10.1007/BF00670732
- Sahu et al. (2020) Sahu, S., Joshi, B., Mitra, P. K., Veronig, A. M., & Yurchyshyn, V. 2020, ApJ, 897, 157, doi: 10.3847/1538-4357/ab962b
- Savcheva et al. (2012) Savcheva, A. S., van Ballegooijen, A. A., & DeLuca, E. E. 2012, ApJ, 744, 78, doi: 10.1088/0004-637X/744/1/78
- Schou et al. (2012) Schou, J., Scherrer, P. H., Bush, R. I., et al. 2012, Sol. Phys., 275, 229, doi: 10.1007/s11207-011-9842-2
- Shibata et al. (1995) Shibata, K., Masuda, S., Shimojo, M., et al. 1995, ApJ, 451, L83, doi: 10.1086/309688
- Shiota et al. (2010) Shiota, D., Kusano, K., Miyoshi, T., & Shibata, K. 2010, ApJ, 718, 1305, doi: 10.1088/0004-637X/718/2/1305
- Su et al. (2007) Su, Y., Golub, L., & Van Ballegooijen, A. A. 2007, ApJ, 655, 606, doi: 10.1086/510065
- Su & van Ballegooijen (2012) Su, Y., & van Ballegooijen, A. 2012, ApJ, 757, 168, doi: 10.1088/0004-637X/757/2/168
- Su et al. (2006) Su, Y. N., Golub, L., van Ballegooijen, A. A., & Gros, M. 2006, Sol. Phys., 236, 325, doi: 10.1007/s11207-006-0039-z
- Titov & Démoulin (1999) Titov, V. S., & Démoulin, P. 1999, A&A, 351, 707
- Török et al. (2010) Török, T., Berger, M. A., & Kliem, B. 2010, A&A, 516, A49, doi: 10.1051/0004-6361/200913578
- Török & Kliem (2005) Török, T., & Kliem, B. 2005, ApJ, 630, L97, doi: 10.1086/462412
- Török et al. (2014) Török, T., Kliem, B., Berger, M. A., et al. 2014, Plasma Physics and Controlled Fusion, 56, 064012, doi: 10.1088/0741-3335/56/6/064012
- Török et al. (2004) Török, T., Kliem, B., & Titov, V. S. 2004, A&A, 413, L27, doi: 10.1051/0004-6361:20031691
- Tripathi et al. (2006) Tripathi, D., Isobe, H., & Mason, H. E. 2006, A&A, 453, 1111, doi: 10.1051/0004-6361:20064993
- van Ballegooijen et al. (1998) van Ballegooijen, A. A., Cartledge, N. P., & Priest, E. R. 1998, ApJ, 501, 866, doi: 10.1086/305823
- van Ballegooijen & Martens (1989) van Ballegooijen, A. A., & Martens, P. C. H. 1989, ApJ, 343, 971, doi: 10.1086/167766
- Wang et al. (2017) Wang, H., Liu, C., Ahn, K., et al. 2017, Nature Astronomy, 1, 0085, doi: 10.1038/s41550-017-0085
- Wang et al. (2018a) Wang, J., Liu, C., Deng, N., & Wang, H. 2018a, ApJ, 853, 143, doi: 10.3847/1538-4357/aaa712
- Wang et al. (2018b) Wang, Y., Su, Y., Shen, J., et al. 2018b, ApJ, 859, 148, doi: 10.3847/1538-4357/aac0f7
- Wiegelmann (2004) Wiegelmann, T. 2004, Sol. Phys., 219, 87, doi: 10.1023/B:SOLA.0000021799.39465.36
- Wiegelmann et al. (2006) Wiegelmann, T., Inhester, B., Kliem, B., Valori, G., & Neukirch, T. 2006, A&A, 453, 737, doi: 10.1051/0004-6361:20054751
- Yang et al. (2009) Yang, Y.-H., Cheng, C. Z., Krucker, S., Lin, R. P., & Ip, W. H. 2009, ApJ, 693, 132, doi: 10.1088/0004-637X/693/1/132
- Yurchyshyn et al. (2009) Yurchyshyn, V., Abramenko, V., & Tripathi, D. 2009, ApJ, 705, 426, doi: 10.1088/0004-637X/705/1/426
- Zhang et al. (2012) Zhang, J., Cheng, X., & Ding, M.-D. 2012, Nature Communications, 3, 747, doi: 10.1038/ncomms1753
- Zhou et al. (2022) Zhou, Z., Jiang, C., Liu, R., et al. 2022, ApJ, 927, L14, doi: 10.3847/2041-8213/ac5740