Growth and characterization of thorium-doped calcium fluoride single crystals
Abstract
We have grown 232Th:CaF2 and 229Th:CaF2 single crystals for investigations on the VUV laser-accessible first nuclear excited state of 229Th. To reach high doping concentrations despite the extreme scarcity (and radioactivity) of 229Th, we have scaled down the crystal volume by a factor 100 compared to established commercial or scientific growth processes. We use the vertical gradient freeze method on 3.2 mm diameter seed single crystals with a 2 mm drilled pocket, filled with a co-precipitated CaF2:ThF4:PbF2 powder in order to grow single crystals. Concentrations of cm-3 have been realized with 232Th with good (10%) VUV transmission. However, the intrinsic radioactivity of 229Th drives radio-induced dissociation during growth and radiation damage after solidification. Both lead to a degradation of VUV transmission, limiting the 229Th concentration to cm-3.
.1 Introduction
The radioisotope thorium-229 has a unique nuclear structure in which the first excited state is long-lived and exceptionally low in energy: few electron volts (eV), instead of the common keV-MeV range for nuclear excited states Von der Wense (2017). The radiative lifetime of this isomeric state (229mTh) is expected to exceed 1000 seconds Tkalya et al. (2015) for the bare nucleus. Owing to its low energy in the range of electronic shell transitions, an interaction between the nucleus and its chemical environment is expected Tkalya (2011); Borisyuk et al. (2019); Bilous et al. (2017); Nickerson et al. (2020, 2021). Studying the interaction of the nucleus with its chemical surrounding presents a unique research opportunity.
The 229Th nucleus has attracted many ideas for applications Tkalya et al. (1996), most of them based on nuclear laser spectroscopy. Our main interest is to perform optical nuclear spectroscopy of vacuum ultraviolet (VUV) transparent single crystals containing 229Th as a dopant Dessovic et al. (2014).
The energy of this nuclear isomer state was indirectly measured only recently by two independent methods Seiferle et al. (2019); Sikorsky et al. (2020) to eV (averaged). This corresponds to a wavelength of nm, which is in the VUV range and thus absorbed in air. The measurements of the isomer energy used internal conversion (IC) and gamma emissions from the nucleus respectively. Internal conversion is a common nuclear decay process, where the energy of the excited nucleus is transferred to a shell electron which is ejected if the decay energy exceeds the binding energy. The internal conversion decay channel can have a dramatically different lifetime compared to the radiative decay. The IC lifetime of s was measured for neutral 229mTh on a metal surface von der Wense et al. (2016).
To exploit the many prospects of the 229Th system, internal conversion and other non-radiative decay channels need to be suppressed. For solid-state approaches, this requires the bandgap of the 229Th-doped crystal material to exceed the isomer excitation energy. Hehlen et al. categorized, which large bandgap materials would be suitable, pointing out the relevance of fluoride crystals Hehlen et al. (2013). Excitation and fluorescence of commercially grown, 232Th-containing crystals was explored by Rellergert et al. (2010) (Th:NaYF, Th:YLF, Th:LiCAF, Na2ThF6, Th:LiSAF) to investigate VUV irradiation induced background and optical transparency.
The approach in our laboratory is to use CaF2 crystals with an 11.8 eV direct bandgap Rubloff (1972). The cutoff of this material is however dominated by a broad indirect exciton bound state at 11.2 eV Letz et al. (2009) which diminishes the VUV transmission for photons with energy above 9.8 eV or wavelength below 126 nm. These exciton states are higher in energy than the 8.15 eV isomer energy and thus non-radiative de-excitation should be prevented.
Crystal doping will ensure a high amount of addressable nuclei, of the order of 1019 cm-3. The presence of the dopant will however modify the band structure of the host crystal and lead to additional electronic defect states Dessovic et al. (2014). Interactions between the nucleus and the local crystal fields will lead to line shifts and broadenings Kazakov et al. (2012).
In this work, we describe the in-house growth and characterization of 229Th-doped CaF2 single crystals. Severe challenges are connected with the inherent radioactivity of the dopant (on the order of 106 Bq), its extreme scarcity (milligrams) and general purity requirements of the used materials. To accommodate these, we developed a modified vertical gradient freeze (VGF) machine to grow small-volume crystals ( cm-3) in vacuum with minimal losses. We demonstrate that the doped material maintains VUV transparency in the range of the expected isomer excitation wavelength and investigate the relation between VUV transmission and the effect of different doping concentrations on both surface and bulk absorption. These crystals are currently used in several attempts to excite the 229Th using X-ray irradiation Masuda et al. (2019) or VUV irradiation Jeet et al. (2015); Stellmer et al. (2018).
.2 Preparation of 229ThF4:PbF2:CaF2 growth material
In an exemplary fashion, the following describes the preparation of 45 mg of 229ThF4:PbF2:CaF2 powder for growing 3 crystals (15 mg each) with 3.2(1) mm diameter and 11(1) mm length. PbF2 acts as a scavenger for oxygen removal (see below) and as a carrier that facilitates the handling of the minuscule (micrograms) amounts of 229ThF4 during the wet chemistry preparation process.
229Th (7.9 MBq, Oak Ridge National Laboratory, in dried nitrate form) was dissolved in 0.1 M HNO3 Suprapure grade (Sigma Aldrich) prior to use. All reagents CaF2 (Alfa Aesar), Pb(NO3)2 (Sigma Aldrich), PbF2 (Alfa Aesar), 40 % HF (Sigma Aldrich) were purchased from commercial suppliers in trace metal grade and were used as received. Water was purified in-house by triple distillation. Using higher quality CaF2 powder increased the VUV transmission of the grown crystals.
In a centrifugation vial, lead(II) nitrate (2.9 mg) was added to and dissolved in a solution of 229Th in 0.1 M HNO3 (9 mL, 5.5 MBq). Subsequently, 229ThF4:PbF2 was precipitated by addition of hydrofluoric acid (40 %, 1 mL). A white precipitate appeared immediately and was allowed to rest overnight. The supernatant was carefully removed using a pipette after centrifugation and the precipitate was washed with triple distilled water (2 mL, 6 times). After the fourth washing step, the supernatant was tested for remaining free fluoride ions by adding a small portion of an aqueous solution of CaCl2. No appearance of any white material confirmed the absence of free fluoride ions, and two additional washing steps were performed.
The 229ThF4:PbF2 was then poured into an aluminum container to avoid powder sticking to the wall, reducing losses when the powder is transferred into the crystal growing machine later. A small portion of water was added and the whole was then dried in an oven at 80 ℃ until weight was constant (4 days). Then CaF2 (28.3 mg) was added to the 229ThF4:PbF2, mixed thoroughly and measured via -spectroscopy. The -spectroscopy was performed with a 151 cm3 HPGe detector from Canberra Industries (1.8 keV resolution at the 1332 keV 60Co peak; 50.1 % relative efficiency), connected to a PC-based multi-channel analyzer with preloaded filter and Loss-Free Counting (LFC) system.
The powder was then combined with a previous batch of 229ThF4:PbF2:CaF2 (15 mg, containing 0.3 MBq 229Th) to give a total amount of 45 mg 229ThF4:PbF2:CaF2 with a weight ratio of 0.33:1:14 and a total activity of 5.8 MBq 229Th used. The previous batch originated from a trial run of above mentioned method. The stock powder was then split in 3 parts of equal amounts by weight (15 mg) to give three aluminum containers with equivalent material (No. 1, No. 2, No. 3). All vials were measured with -spectroscopy in the same geometry to check the distribution of activity between the containers (0.33:1:14, as above) and stored in a desiccator until used. Due to losses during the process 4.7 MBq out of 5.8 MBq 229Th were obtained as usable powder.
.3 Preparation of 232ThF4:PbF2:CaF2 growth material
For calibration purposes, process optimization, and many measurements, which do not probe nuclear properties (e.g. VUV transmission measurements), commercially available 232Th can be used as a proxy.
Two different methods for the 232ThF4:PbF2:CaF2 sample preparation were used. Method A was used to prepare 232Th containing powder analogous to the 229Th powder. Then conditions (ratios between components, water content, contamination, etc.) were kept constant between growing 232Th:CaF2 and growing 229Th:CaF2. Method B was used when different ratios between components should be tested. This approach avoided the lengthy coprecipitation which allowed for quick testing. Losses of Th were not important in this method due to the use of the abundant 232Th isotope. The two methods were:
-
A:
The sample was prepared analogous to the 229ThF4:PbF2:CaF2 procedure described above using 232ThNO3 instead of 229ThNO3. A small amount of 229ThF4:PbF2:CaF2 was added (1 kBq of 229Th) to the 232ThF4:PbF2:CaF2 powder for tracing purposes.
-
B:
The sample was prepared by mixing commercially available CaF2, PbF2 and 232ThF4. Then 1 kBq of 229ThF4 was added by letting a spoon touch first the produced 229ThF4 then the 232ThF4 for tracing the location of the dopant after growth.
.4 Vertical gradient freeze growth process
To grow 3.2 mm diameter, 11 mm long crystals, we use a modified vertical gradient freeze method. It was first developed in 1924 by Stöber Stöber (1924), inspired on the Bridgman method. This method was adapted to our needs in cooperation with the Fraunhofer institute for integrated systems and device technology (IISB) to grow crystals with minimal dopant losses Schreitl (2016). The main advantage of the VGF method over other methods like Czochralski is that the growth speed is decoupled from the crystal diameter. Very small diameter crystals and hence high (1018 cm-3) doping concentrations can be realized with the extremely scarce 229Th isotope while maintaining low growth speed (0.5 mm/h) which promotes high quality crystals and improved VUV transparency.
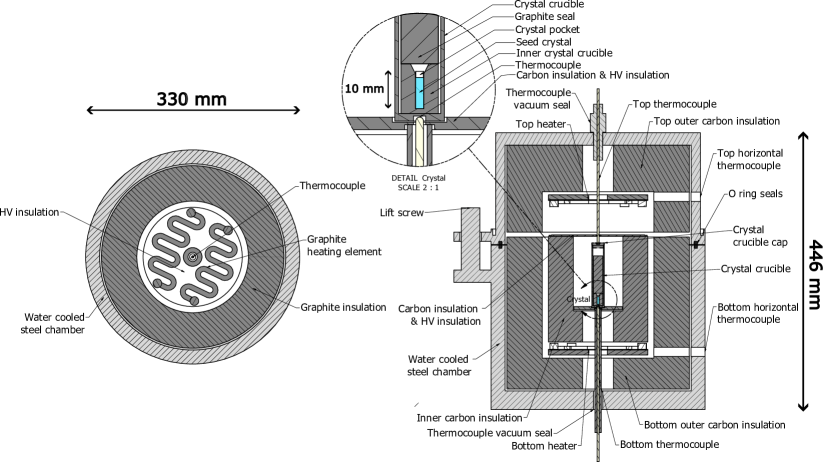
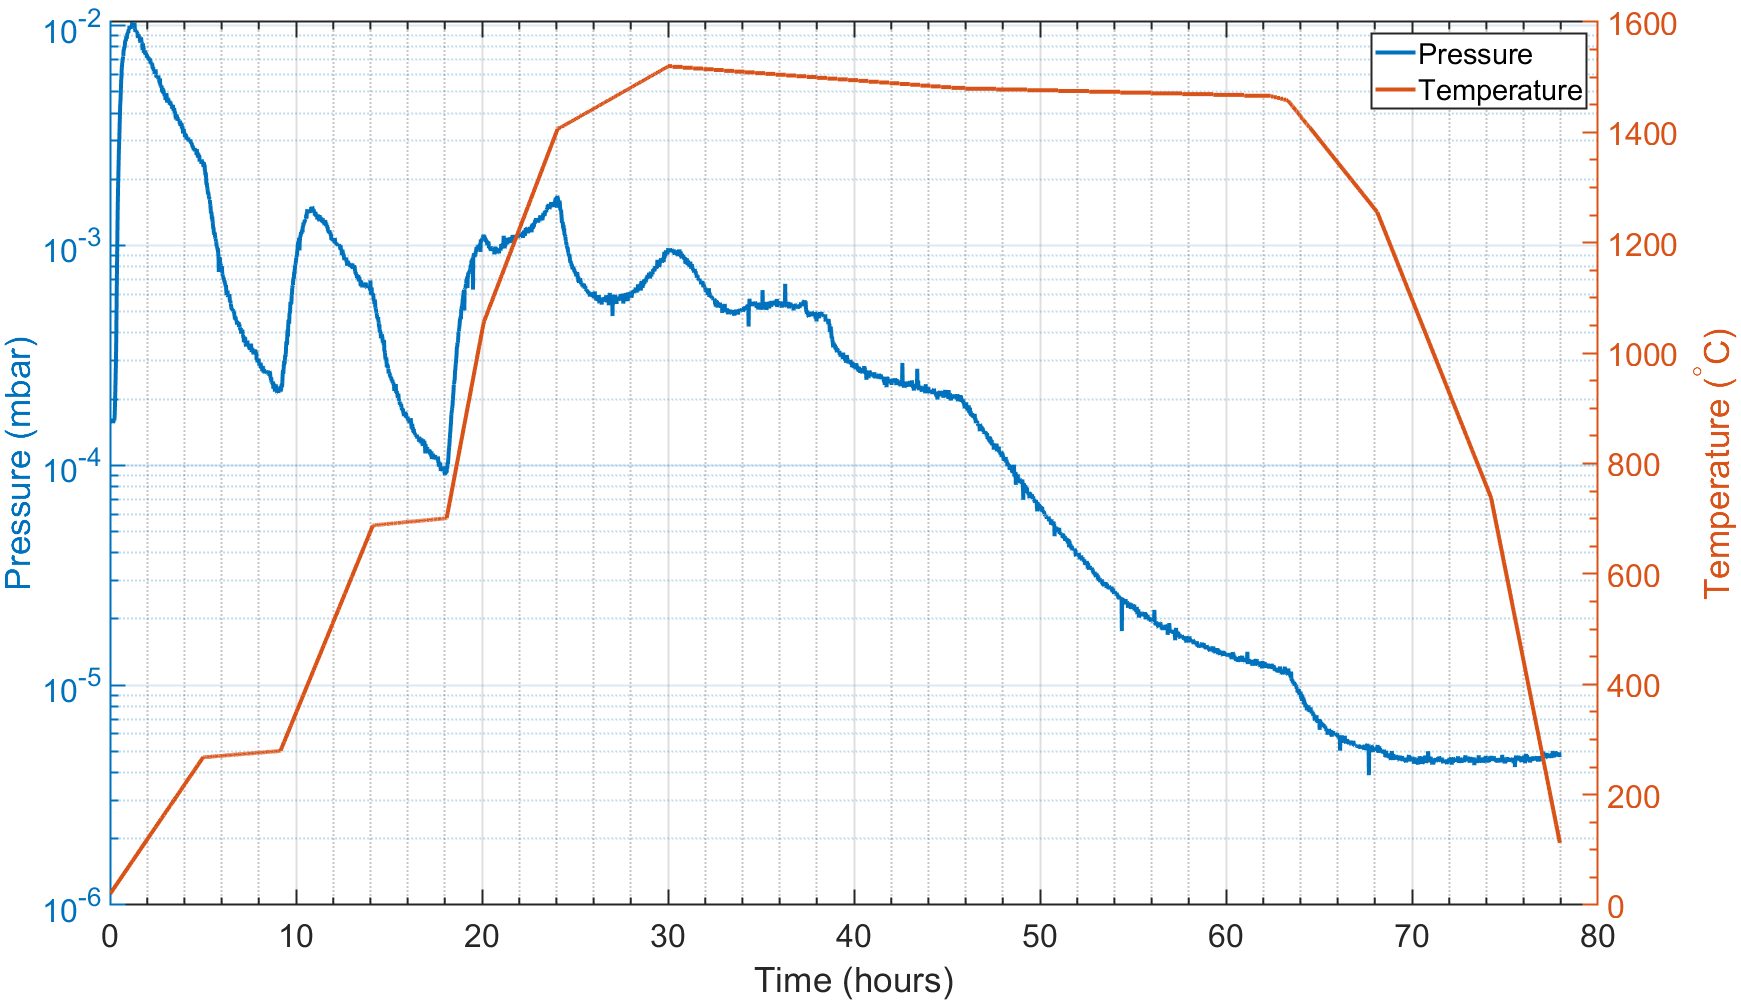
In the vertical gradient freeze method, a temperature gradient is slowly driven across the starting growth material (powder and seed) to control the liquid-solid interface, as illustrated in figure 1. In our implementation, sub-millimeter control of this interface layer is required, imposed by the small crystal dimensions (see figure 2). The gradient is realized by electronically controlling the currents in two ohmic heaters on top of and below the crucible containing powder and seed (see figure 3). The entire system is kept under vacuum during the growth process, approximately 10-4 mbar at the start of the growth (see figure 5). The vacuum prevents oxidation of the graphite and CaF2 powder. Inert gases could also be used for this purpose, however achieving a steep temperature gradient (20 K/cm) is then very challenging.
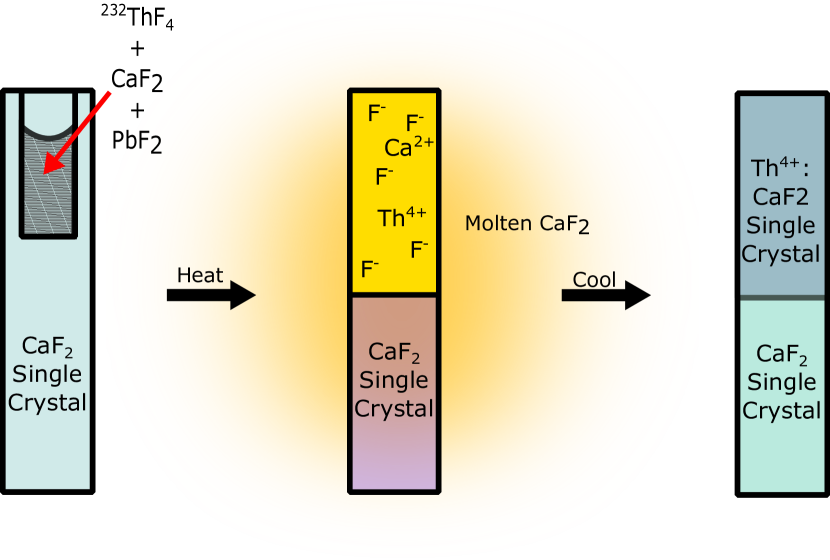
A stationary graphite crucible is filled with a CaF2 seed crystal together with the starting material in the seed pocket. A temperature gradient of 20 ℃/cm should be around the melting temperature of the chosen material, which is 1418 ℃ for CaF2. In this way, the powder in the pocket of the seed crystal can be molten together with the top part of the seed. Due to the rather steep gradient the bottom of the seed does not melt. The freezing interface is then slowly moved upward such that the melt can crystallize on top of the seed crystal, and thus grow a single crystal following the orientation of the seed.
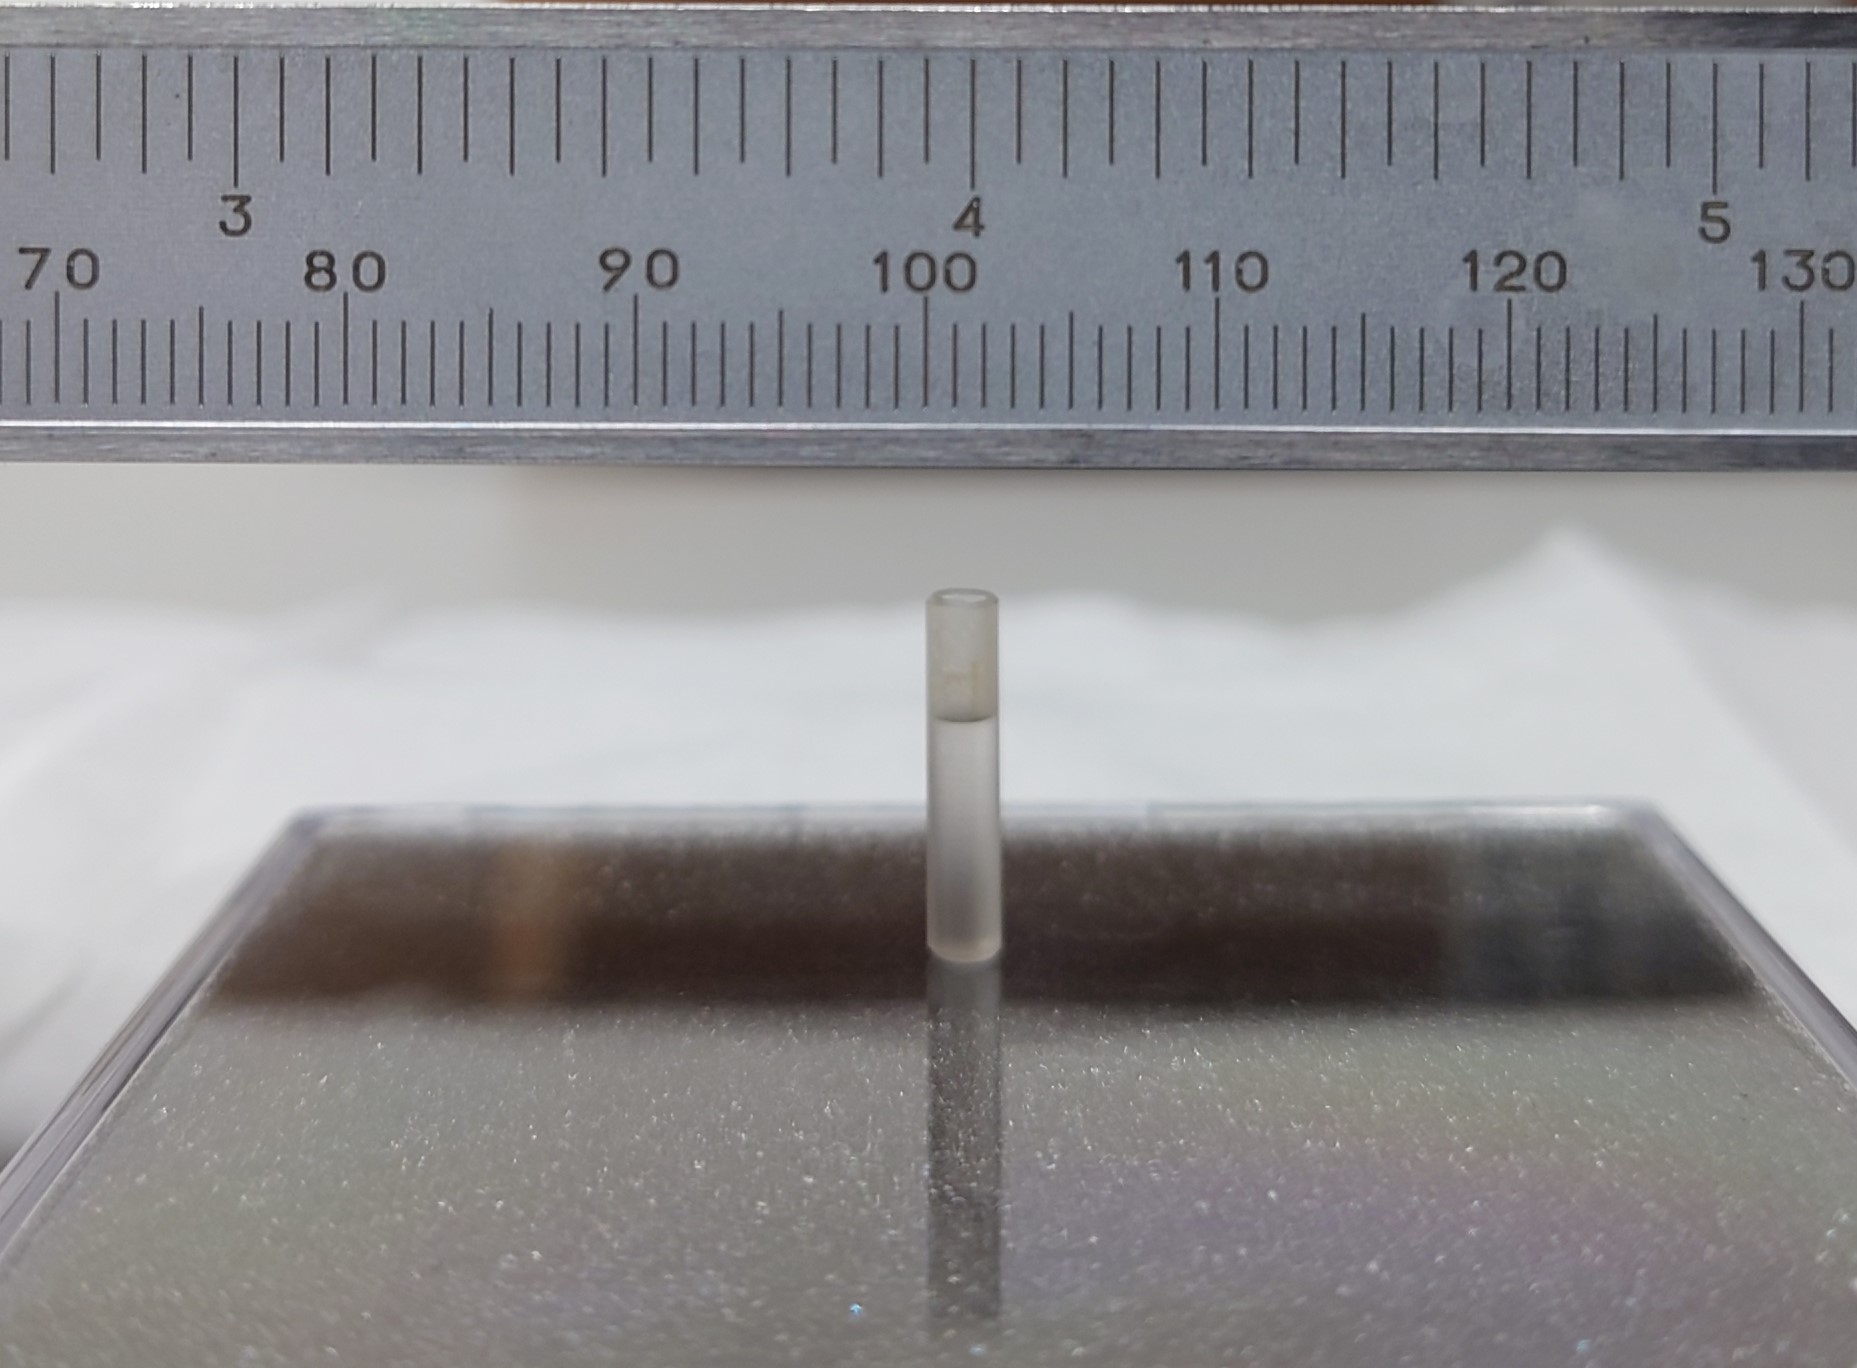
The diameter and length of the crystals grown in our laboratory has been successively reduced from 17 mm to 3.2 mm and from 40 mm to 11 mm, respectively, by careful calibration and using smaller seeds. This implements a volume reduction and corresponding concentration increase by a factor 100. Seed crystals of 5 mm diameter (with different, single crystal orientations) were purchased from Korth, Matek, and Alkor. Hyperion Optics milled the seeds down from 5 mm to 3.2 mm diameter and drilled a 2 mm diameter hole (5 mm deep) into the top, to accommodate the doping material. Figure 2 shows a photograph of such a prepared seed, and the DETAIL in figure 3 shows the positioning of the seed inside the graphite crucible.
The pocket is filled with the co-precipitated growth material. Special care was taken to use metallic funnels just as the containers to avoid material losses due to electrostatic adsorption to the wall. The pocket within the seed ensures minimal losses and easy handling of the crystals before starting the VGF process. The filled seed is placed into the VGF furnace (figure 3) inside of a carbon crucible. The phase diagram of CaF2 and ThF4 at low vacuum has not been measured to our knowledge, but we observe evaporation. Fluorine was detected by using a Pfeiffer quadrupole mass spectrometer and traces of radioactive Th and U in the graphite show that these partly evaporate during growth. The volume above the seed in which material can be evaporated is small in our setup. We observed that this small volume increases doping efficiency as opposed to a larger volume or direct connection to the vacuum pump. We hypothesize that when the vapor is actively pumped away more of the material is evaporated which reduces doping concentration.
The seed is then grown to a single crystal: Two ohmic carbon heaters (see left side of figure 3) are used to create the steep temperature gradient over the crystal, partially melting it. Short-term temperature stability is maintained with short horizontal alsint-insulated thermocouples close to the heaters and absolute calibration is done with long vertical thermocouples close to the crucible.
The temperature at the crystal pocket is not exactly the same as the one indicated by the bottom thermocouple, thus we employ an iterative temperature calibration process to ensure that the temperature is such that the crystal only melts midway. Important here is to carefully monitor the in and outside temperature of the thermocouples to get an accurate temperature measurement and avoid drifts in the system (e.g. by room temperature or cooling water). The graphite thermal isolation and alsint isolation of the thermocouples must not touch, since at high temperatures these two chemically react, which slowly degrades the casing of the thermocouples which can create vacuum leaks.
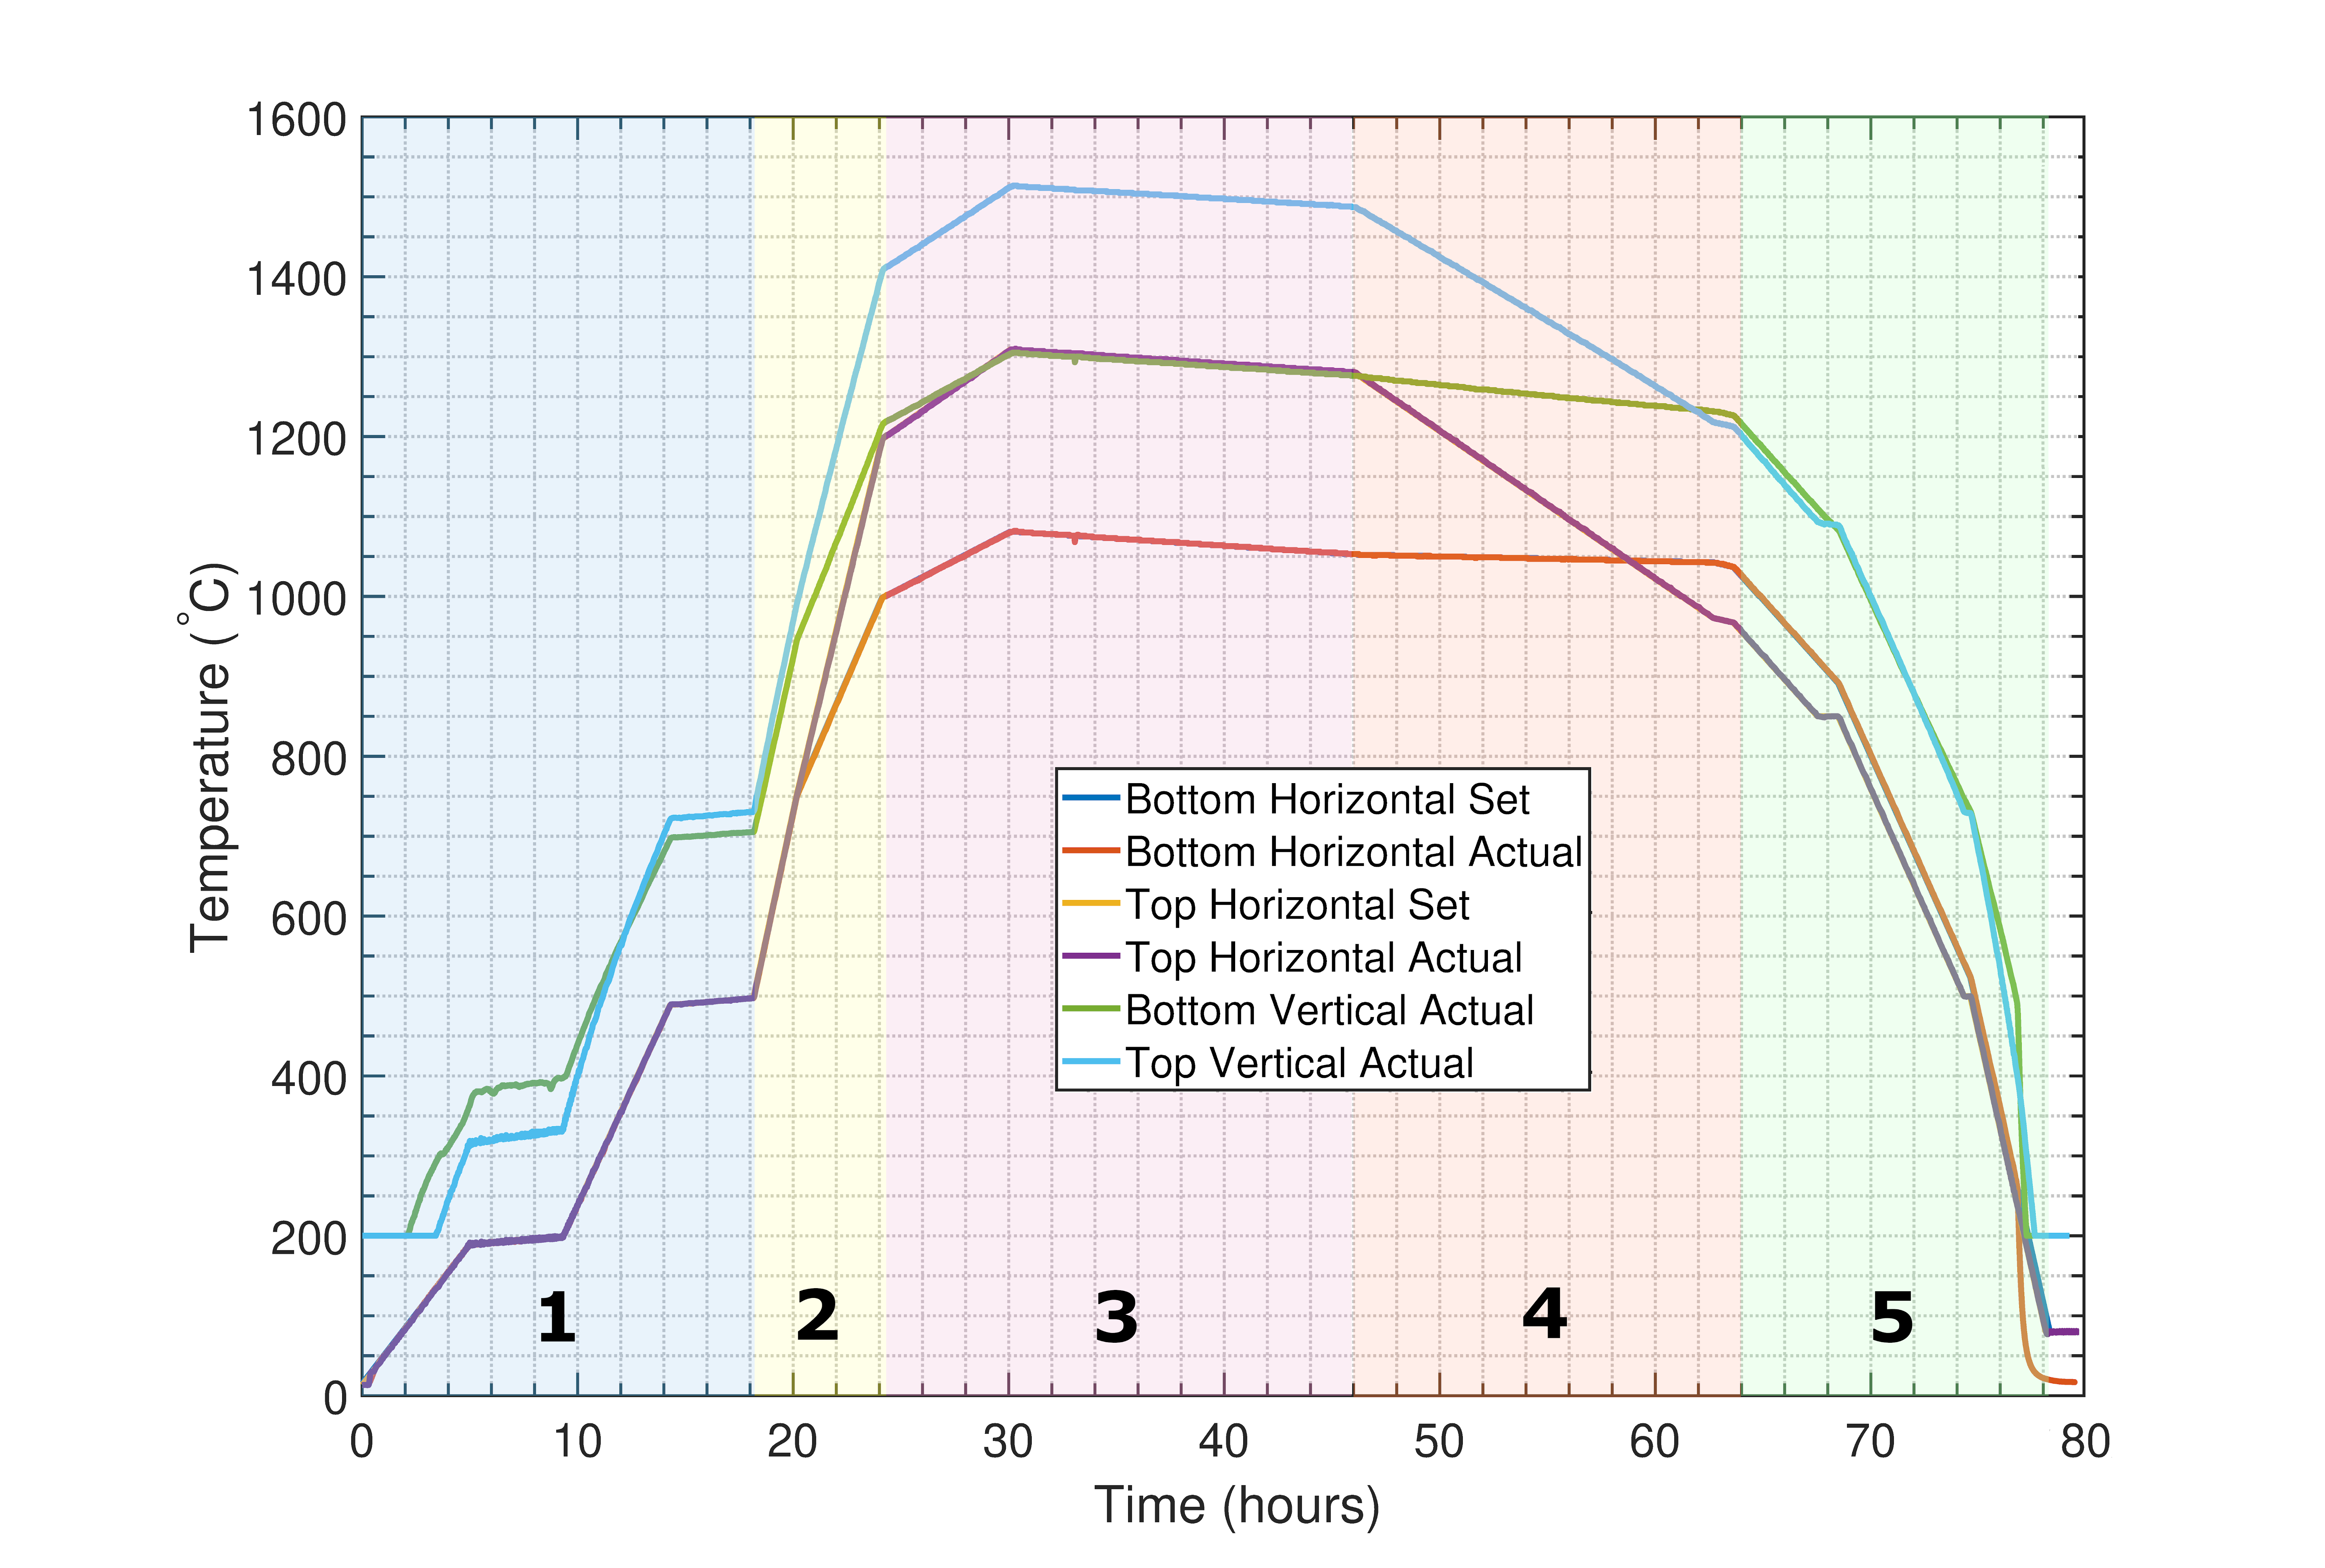
The temperature cycle of the growing process (shown in figure 4) is divided into five sections: 1) 18 hours of heating up the system, outgassing, and restoring pressure (see figure 5) 2) 6 hours of scavenging oxygen through reaction with PbF2 3) 22 hours of melting the top half of the crystal and also slowly freezing it 4) 18 hours of annealing the crystal 5) 14 hours of cooling down. A vacuum of at least 10-4 mbar is obtained before growth. During growth (especially during section 1) the pressure can go up to 10-2 mbar. The complete growth process typically takes 3 days.
Due to the radioactive nature of the dopant, special security measures are implemented in the growth process. On the pre-pump, carbon filters are installed to absorb any evaporated material. The dopant material also is absorbed into the graphite insulation, which becomes radioactive after several growth cycles. In every growth, the insulation absorbs and also releases some dopant; cross-contamination of dopants was observed in a pure CaF2 crystal, grown after growth of a radioactively doped crystal. The growth of undoped crystals can be used to reduce cross-contaminations by absorbing them, we observe a reduction of roughly a factor 10 per growth process.
One important aspect in growing CaF2 crystals is the probability of incorporating oxygen, especially at higher temperatures Molchanov et al. (2005); Ko et al. (2001). Oxygen contamination is known to reduce the transparency of CaF2, especially in the VUV region. At elevated temperatures, the carbon crucible should react with any background gaseous O2 and H2O to form CO in the system. The H2O that is adsorbed on the surface of the crystal powder, however, will first react with the CaF2. The H2O will react with the CaF2 to CaO (Tmelt=2613 ℃ Haynes et al. (2016)) and HF according to
| (1) |
To mitigate this, oxygen scavengers are used: Fluoride compounds (PbF2 Tmelt=830 ℃ Haynes et al. (2016)) in the powder that before melting CaF2 react preferentially with oxygen and water to volatile oxygen containing compounds (PbO Tmelt=887 ℃ Haynes et al. (2016)) which are evaporated at higher temperatures and transported away such that the oxygen is replaced by fluoride:
| (2) |
| (3) |
The gaseous lead(II) oxide will then react with cooler carbon in the insulation walls where they form metallic lead (Tmelt=328 ℃ Haynes et al. (2016)) and CO (not CO2 according to the Boudouard equilibrium)
| (4) |
.5 Temperature calibration
Melting a mixture of CaF2 and ThF4 will lead to a modified melting temperature compared to the separate constituents, as investigated in Capelli et al. (2015). Since the amount of available 229Th will not allow growing doping concentrations higher than 0.05 wt % (1 MBq) to 0.5 wt % (10 MBq) we do not expect (and did not observe) significant changes in the melting temperatures. The temperature calibration could be used independent of the doping concentration, and a partial phase transition into CaThF6 occurring at 19 wt % can be ignored.
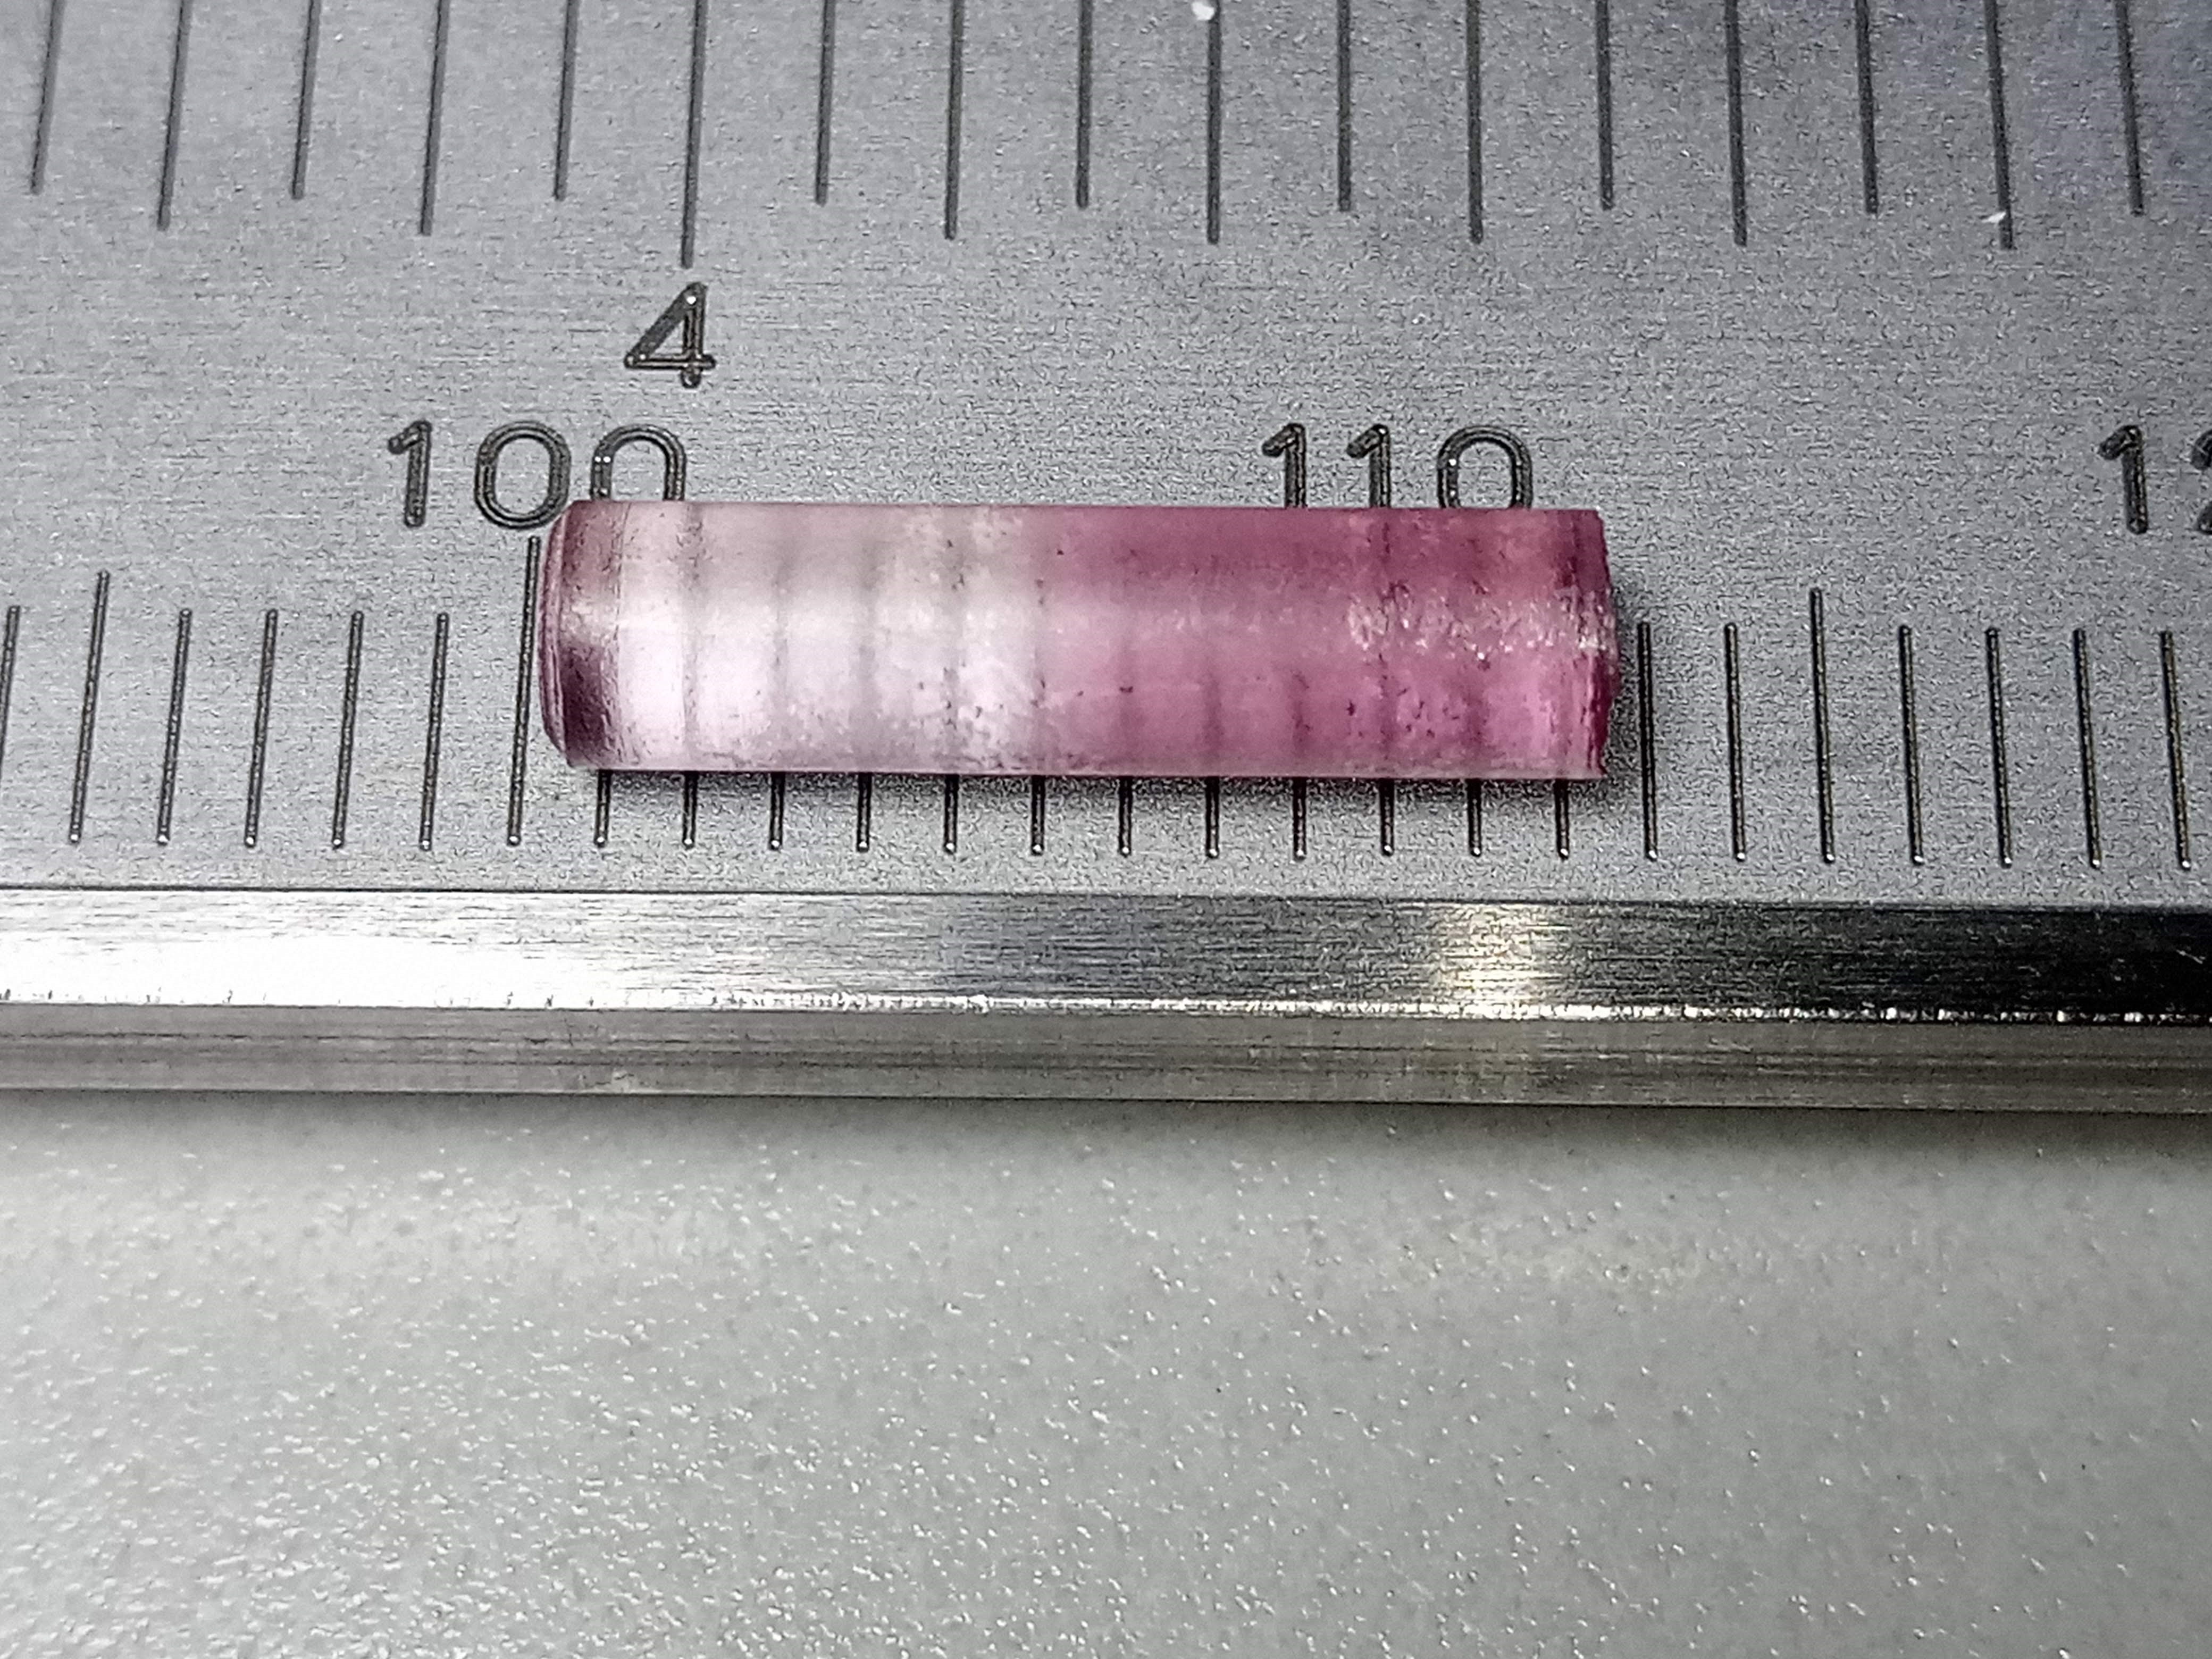
To finely adjust the temperature settings of the growth process, low concentrations of uranium-238 were used as a colorant. As shown in figure 6, the coloring allows to accurately determine the lowest position of the liquid-solid interface, in other words, how deeply the melting progressed into the seed crystal. For a typical gradient of 20 ℃/cm and a peak (set) offset temperature of 1418 ℃, the precision (reproducibility) of the melting boundary is 1 mm with a change in 2.5 ℃ in set temperature shifting by 1 mm. The calibration can be transferred from uranium to thorium without adaptation due to the low doping concentrations. The calibration is obtained in an iterative process involving 5-10 growth processes. The temperature interval between obtaining a fully molten crystal and not melting the seed at all is about 15 K, the temperature relation is not fully linear and the drilled top part of the seed crystal containing the growth material is more susceptible to melting than the lower bulk of the seed crystal.
Crystals grown with 229Th and 232Th doping are optically fully transparent, so it is less obvious to determine the melting depths. Here, the radioactivity of 229Th can be used to extract spatial information on the doping distribution (see below). For doping with 232Th, which is used as a proxy in experiments not focusing on nuclear properties, the growth material is ”spiked” with a low (few Bq) activity of 229Th to produce a measurable signal on a -detector. Both thorium isotopes are chemically identical and therefore distribute identically during the growth process.
.6 Doping efficiency and homogeneity
Before and after growth, 229Th-doped crystals are measured on a -spectrometer in a reproducible geometry (in the crucible) to determine the efficiency of the doping process by comparing the intensity of the 193 keV -line. We observe a 20-30% doping efficiency of the starting material where we attribute the losses to evaporation. The highest doping concentration realized so-far was with a 229Th activity of 1 MBq (3.6 nuclei) in the starting material, reaching a concentration of 2.4 cm-3 (see figure 11).
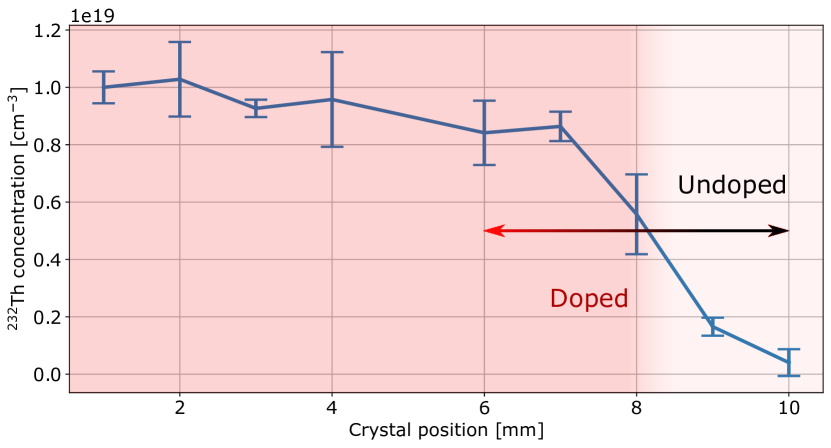
The doping concentration is homogeneous over the molten part of the crystal and decays over 2-3 mm in the interface to the not molten seed, as illustrated in figure 7. For this investigation, a crystal doped with 232Th, spiked with 229Th, was grown. After growth the crystal was cut into 1 mm disks and each disk was measured in a reproducible geometry in the gamma-detector. Again, the 193 keV line activity was detected and from this the concentration was calculated by measuring a reference sample. The seed crystal was molten to a depth of around 6 mm, in which the concentration is approximately homogeneous (within 2 as seen in figure 7). Beyond, we observe diffusion of dopant into the not molten part on a length scale of about 2 mm, until no doping can be detected in the not molten region of the seed crystal.
.7 VUV transmission
Good transmission of the obtained crystals in the VUV range around 150 nm is imperative for all attempts to optically manipulate (or detect) the 229Th isomeric state. We therefore performed a series of characterization experiments described below, with a special emphasis on the behavior of the VUV absorption with doping concentration.
Doping Th into the CaF2 matrix should not reduce the bandgap and therefore the optical transmission window significantly, as theoretically calculated Dessovic et al. (2014) and measured Schreitl (2016). However, additional electronic states (often referred to as color centers or defect states) can emerge within the bandgap Nickerson et al. (2020).
In order to measure the VUV transmission, the crystals were cut and polished. Cutting was done using a Wiretec DWS100 with a 0.08 mm diamond coated wire. Facets cut with the wire saw were flat enough to be polished in a 1-step process. Polishing was done with a Buehler crystal polishing machine and a Buehler SiC P4000 grit Silicon Carbide polishing paper. The polishing paper was wetted with isopropanol. As CaF2 is hygroscopic and adsorbed water decreases transmisson, the polishing paper was wetted with isopropanol instead of water Reiterov et al. (1980).
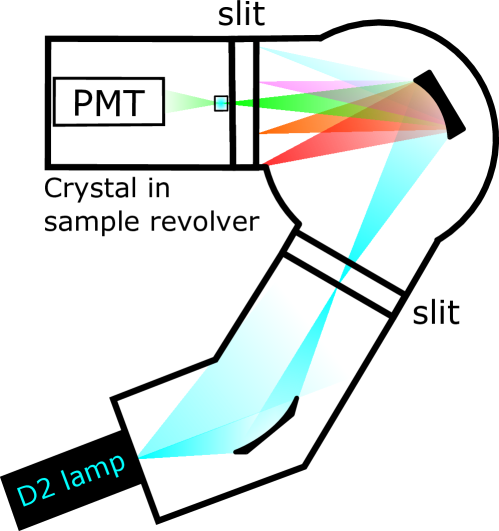
Transmission measurements were performed using a dedicated setup as schematically depicted in figure 9. The light of a Hamamatsu L15094 D2 lamp is focused with a toroidal mirror onto the entrance slit of a McPherson 234/302 monochromator. Part of the light does not hit the focusing mirror. The light is separated into its spectral components by the grating and is focused onto the exit slit. By rotating the grating the exit wavelength can be selected. The exit slit cuts out a small portion of the spectrum effectively creating a narrow wavelength light source with a linewidth down to 0.1 nm. The linewidth can be changed by changing the entrance/exit slit width (0.01 mm to 2.50 mm). This light travels through the crystal, and is recorded by a Hamamatsu R6835 head-on CsI photomultiplier tube (PMT) which is mounted close to the crystal.
Although conceptually simple, measuring a wavelength-dependent absolute absorption is burdened with several experimental challenges. These are connected with geometrical changes in the beam paths due to the presence of the sample (beam shifts and astigmatism), strong spectral intensity modulations and overall intensity instabilities in the VUV source (deuterium lamp). These lead to an overall systematic error on the following transmission measurements of 5 %.
To compare measurement results between different samples, we account for the thickness of the crystal, surface reflections, and absorption at the surface by normalizing the absorption coefficient to pure (undoped) CaF2. This relative absorption coefficient then is a measure for the absorption caused by Th doping in the bulk and at the surface. Although generally relevant in CaF2, we expect two-photon absorption processes to be negligible in these measurements, due to the very low intensities used. It is also assumed that surface quality is similar for all measured crystals. However, this is hard to guarantee due to the hygroscopic nature of calcium fluoride, which leads to water adsorption Denks et al. (2000)
The relative absorption coefficient is defined as
| (5) |
where is the transmission, the transmission of pure CaF2 and the thickness of the crystal. We measure the transmission and subsequently calculate the relative absorption of 229/232Th:CaF2, for the wavelength region of interest 120-160 nm.
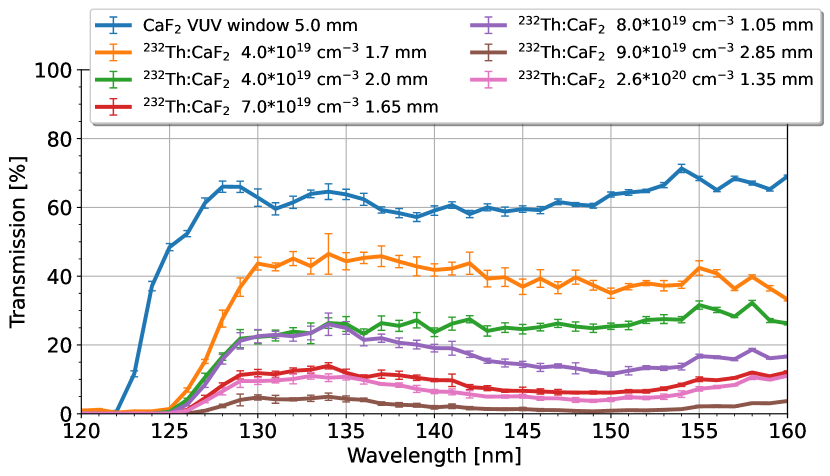
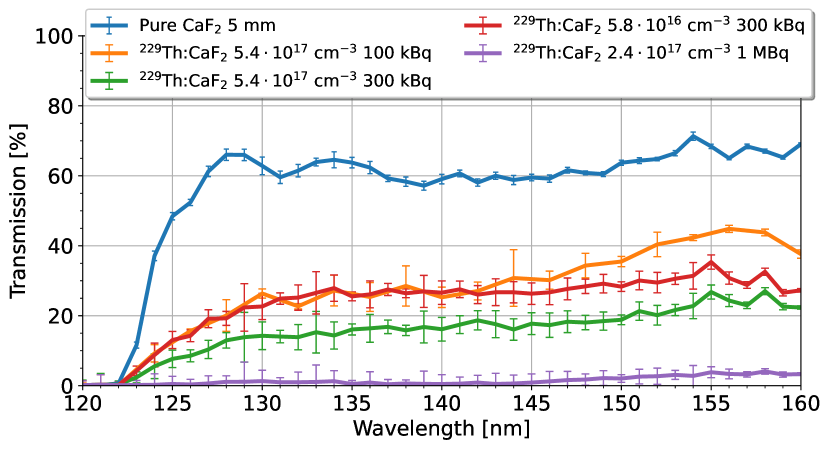
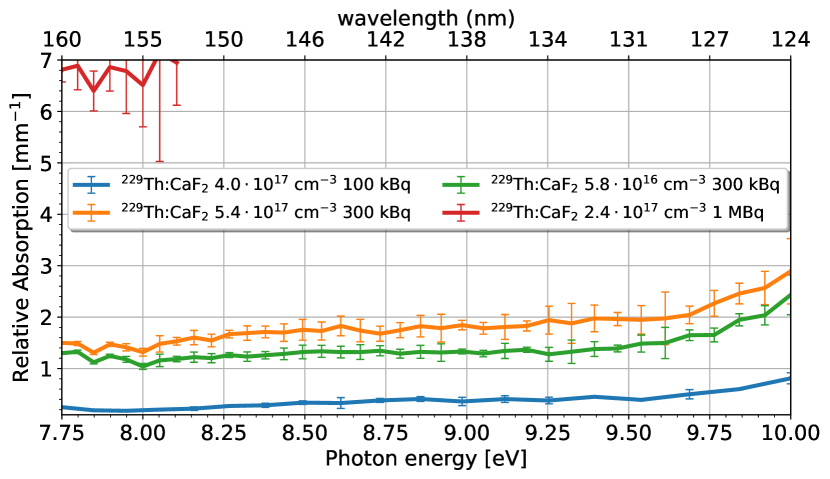
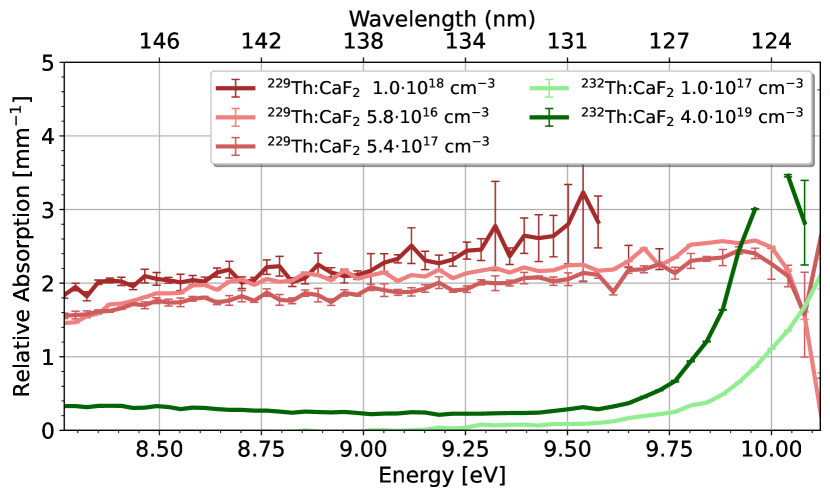
Non-normalized transmission measurements for 232Th- and 229Th-doped crystals can be seen in figures 10 and 11, respectively. Figures 12 and 13 show the corresponding relative absorption coefficients.
From figures 10 and 11 it can clearly be seen that all grown single crystals have a transmission above 1 % around 150 nm, some reaching 40 %. In cases where the seed crystal was fully molten during the growth process, we obtain completely VUV-opaque samples (transmission , independent of doping concentration). We conjecture that in these cases, a polycrystal is formed, which suppresses VUV transmission due to the presence of grain boundaries.
Doping concentrations up to 2.61020 cm-3 for 232Th and up to 5.41017 cm-3 229Th were grown with good transparency.
The 232Th doped crystals often show an absorption around 150 nm, which we attribute to Ca metallic particles Rix et al. (2011). In undoped CaF2 they absorb around 160 nm but the presence of Th changes the refractive index of the crystal, thereby changing the absorption wavelength of these centers. Higher doping concentrations generally seem to lead to more absorption.
In Angervaks et al. (2018), sharp absorption bands around 160-170 nm were observed and attributed to calcium metallic precipitates or colloids incorporated in the CaF2 matrix. These precipitates can form due to crystal damage or a deficiency of fluoride.
All grown Th:CaF2 crystals seem to absorb starting from 130 nm and have very low transmission below 125 nm, earlier than the transmission edge of CaF2 which starts at 125 nm and has little transmission below 122 nm.
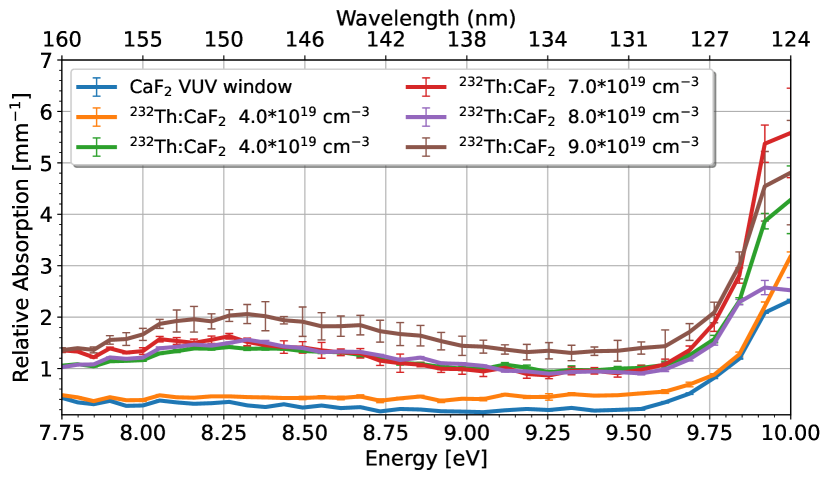
In the absorption of 232Th (figure 12) it can be seen that crystals with similar concentrations have similar absorption. Three features can again be identified: Increasing absorption around 150 nm or 8.2 eV, a general increase of absorption with increasing doping concentration and very strong absorption starting at 130 nm or 9.5 eV. These features are all compared to pure CaF2, so they are an effect of the dopant.
In figure 11 it can be seen that the 229Th doped crystals are transparent up until the transmission edge of undoped CaF2. The overall transmission of these crystals is lower. In the absorption of 229Th:CaF2 (figure 13) some common features can be detected. Similar concentration does not give similar absorption and the absorption profile is flat. The measurement of the crystal grown with the highest activity is uncertain due to its strong absorption. Following the spectral absorption of the other crystals we can expect its profile to be flat as well with a relative absorption higher than 6 mm-1. From figure 13 it can be concluded that crystals grown using similar activity have similar absorption and at these low concentrations (compared to figure 12) the absorption does not heavily depend on concentration.
The 229Th doped crystals display a different behavior from the 232Th doped crystals, which can be clearly seen when comparing figure 10 and 11. This was not expected as it is assumed that different isotopes behave identically concerning the electronic interactions. Most probably, the isotope itself does not change the characteristics but the radioactivity of the isotope does. The 229Th doped crystals only stop transmitting at the bandgap edge of CaF2, the 125 nm absorption is not observed. The absorption around 150 nm seems to have disappeared. The general transmission of the 229Th doped crystals is lower, despite the lower doping concentration.
To confirm the different absorption spectra of 229Th and 232Th doped crystals, drifts and changes between measurements of the VUV transmission setup were excluded. For this, a low doped 232Th:CaF2, a high doped 232Th:CaF2 and a high doped 229Th:CaF2 were measured in the same experimental run. The results are seen in figure 14. Here we can see several effects. There seems to be an activity-related broadband VUV absorption, independent of doping concentration. The 229Th:CaF2, just as undoped CaF2, heavily absorbs at 10 eV, the transmission edge of CaF2. The 232Th:CaF2 absorbs heavily at 9.5 eV, earlier than the other crystals. The intensity of this absorption is concentration-dependent, whereas the absorption of the radioactive crystals is almost concentration independent.
If we now combine the information contained in all figures, a few observations can be made:
-
•
Crystals grown with increasing activity have an activity-dependent broadband VUV absorption, independent of Th concentration. This is clearly seen in the absorption of 229Th doped crystals and even in 232Th doped crystals probably due to the small amounts of added 229Th in combination with the weak activity of 232Th. The activity of the crystal with the highest 232Th doping concentration is still only 1 Bq.
-
•
Thorium doping with low activity creates a concentration-dependent absorption around 150 nm and a strong absorption around 122 nm. This is mainly visible for crystals with doping concentration of 71019 cm-3.
The thorium-related absorption around 122 nm does not seem to be present in crystals grown with high activities. It is conjectured, that the thorium is in a different electronic state, either oxidation state or paired with a defect, if a crystal is grown in the presence of high radioactivity. Because of this change in electronic state, the absorption around 122 nm disappears. The hypothesis connected with this observation is that the radioactivity induces loss of fluoride which produces non-stoichiometric, or fluoride-deficient crystals.
.8 Fluoride deficiency
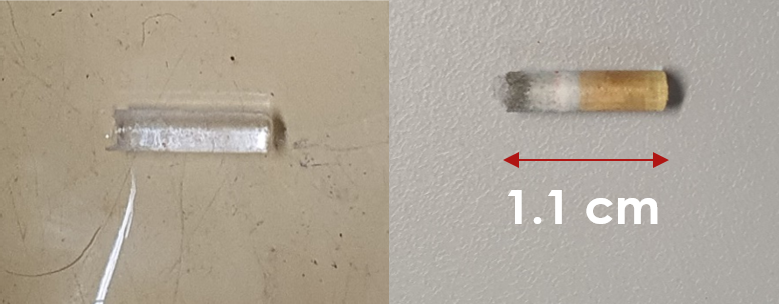
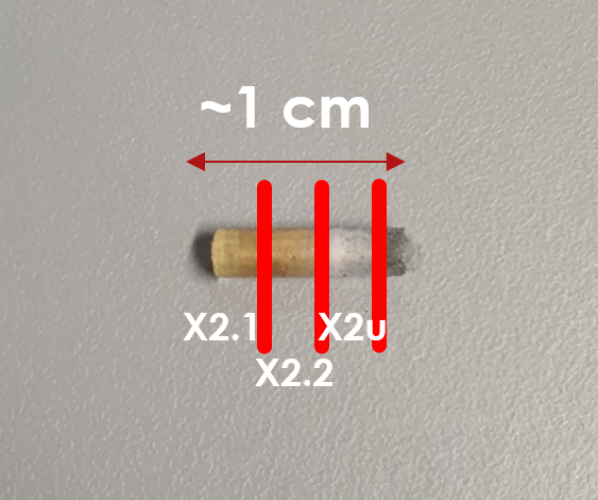
The strongest evidence for a fluoride deficiency in the 229Th:CaF2 crystals was the transmission of the crystal named X2, containing a high activity of 1 MBq. A thin slice taken from the undoped side of X2, named X2u (see figure 15), was measured to be completely VUV opaque. At first the suspicion was radiation damage: Annealing to 600 ℃ did not decrease VUV absorption of any part of X2 whereas it should remove radiation damage. The annealing did however remove the orange color of parts X2.1 and X2.2 in figure 15, the healing of F centers. Not responding to annealing indicated that the VUV opaqueness of X2u was not radiation induced damage in the crystal. Another observation hinting towards fluoride-deficiency was that when growing CaF2 crystals in vacuum (doped or not) outgassing of F2 was measured by a mass spectrometer.
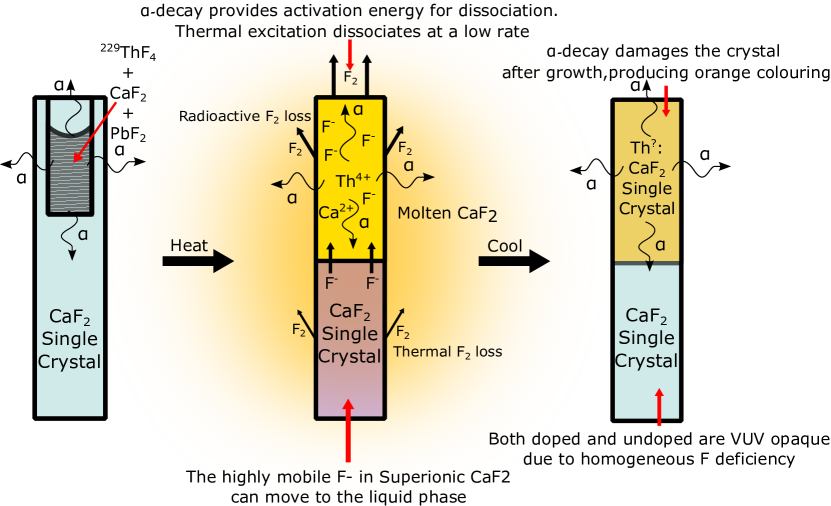
Our conjecture of the process that leads to the fluoride deficient crystals is depicted and detailed in figure 16. By growing CaF2 with radioactive materials, the loss of fluoride in the liquid phase is enhanced and non-stoichiometric crystals are produced. The dissociation of fluoride compounds to produce gaseous F2 through radioactivity, radiolysis, has been observed in UF6 Dmitrievskii and Migachev (1960). The nuclear chemical reaction describing this process is
| (6) |
where the metallic Ca is dissolved in the solid phase, and F2 leaves the liquid melt as a gas. The energy for a chemical reaction is eV, the energy of -decays is MeV. Because of this, every single -decay could drive many chemical reactions. In a conservative estimate, if 1 % of all reactions with an particle drive radiolysis, which costs 10 eV per reaction, then 5000 dissociation events can take place per -decay. At an activity of 1 MBq of 229Th this would mean at least 5 radiolysis events per second. In a growing cycle where a part of the crystal is molten for 22 hours, there are 2 radiolysis events as compared to the F atoms in the crystal. This would lead to a defect concentration of 4 cm-3, which should indeed be visible in a transmission measurement.
Between 1370 K and 1450 K Voronin and Volkov (2001); Derrington et al. (1975), the solid CaF2 undergoes a phase transition into the superionic state. Therefore, the superionic part of the crystal becomes fluoride deficient due to fluoride transfer to the melt. In the superionic state, the fluorides are highly mobile inside the crystal Ca+ matrix. The highly mobile F- can migrate from the superionic phase to the molten phase, where the radioactivity induces further dissociation. After freezing, the entire crystal is left fluoride deficient. The crystal compensates for F- loss by producing Ca metallic colloids which increase the VUV absorption. The top liquid thus loses fluoride supplied by the bottom solid. The mobile superionic fluorides evenly spread throughout the solid and liquid crystal, causing homogeneous fluoride-deficiency throughout the crystal explaining our observations. This fluoride deficiency causes a strong broadband absorption in the VUV spectral range.
.9 Cherenkov radiation
A second characterization was performed where the radioluminescence of the 229Th:CaF2 crystal, grown with 100 kBq of 229Th, was measured in the VUV spectral range. This crystal was chosen due to its high concentration and transparency. The inherent radioactivity of the 229Th produces two main types of luminescence: Luminescence of CaF2 by creating electron-hole pairs which form self-trapped excitons (STE) Rodnyi (1997) and Cherenkov radiation through beta emission with energies larger than 158 keV. Stellmer et al. Stellmer et al. (2016) measured both these emission types by using undoped CaF2 and a solid 233U sample. The Cherenkov radiation dominates the low wavelength region up until 200 nm. Above 200 nm the luminescence of the STEs dominate. Both can produce a background for further experiments and thus merit characterization.
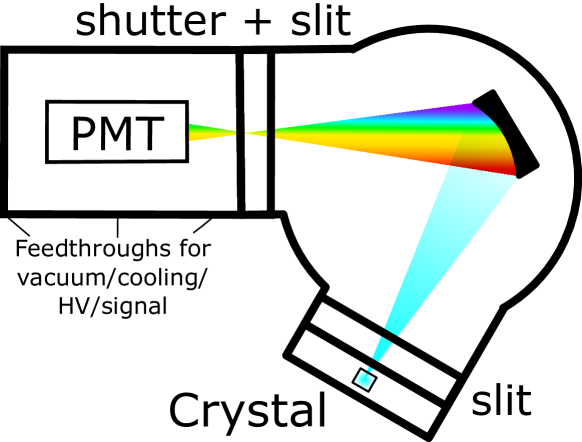
For the luminescence measurement, the chosen crystal was placed in the focal point of the entrance of a 234/302 McPherson spectrometer as depicted in figure 17. Any radioluminescence was then spectrally resolved and imaged on a Hamamatsu R7639 PMT cooled to -30 °C. The PMT is cooled to reduce dark noise to 0.5 cps, otherwise Cherenkov radiation could not be detected. A shutter was used to take continuous dark measurements while the signal was integrated for 9 hours per wavelength setting. The result of this measurement for a 1 mm long 3.2 mm diameter 229Th:CaF2 crystal with a concentration of 5.4 cm-3 can be seen in figure 18.
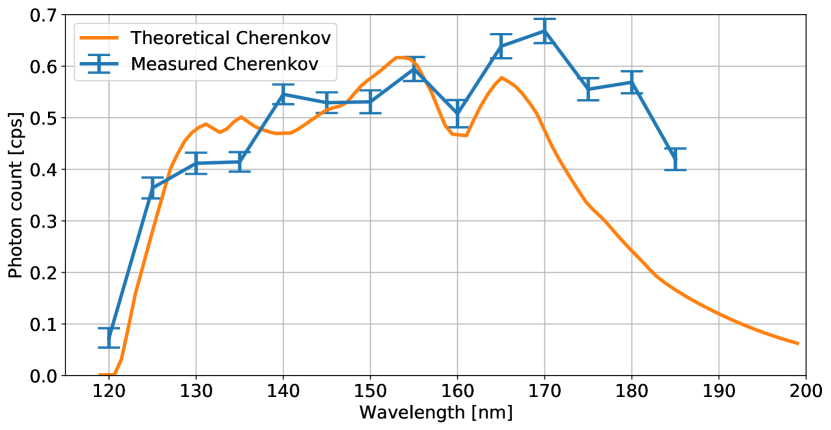
The Cherenkov background at 150 nm was measured to be 0.5 cps. As can be calculated Stellmer et al. (2016), every single decay event (1 Bq) of 229Th produces 0.1 Cherenkov photon per second at 150 nm in a 1 nm bin. Considering 9.4 kBq (the amount of nuclei visible through a narrow slit) of 229Th, and 0.05 % total efficiency of the spectrometer system, the Cherenkov flux at 150 nm would be 0.4 cps. The small discrepancy between prediction and measurement can be due to the (lack of) accuracy in the measured amount of 229Th in the crystal, or the characterization of the numerous experimental efficiencies. In this spectral efficiency the measured transmission of the crystal, the efficiency of the grating with its MgF2 coating and the efficiency of the PMT with its MgF2 window were considered.
The calculated Cherenkov spectrum does not fully reproduce the measured values for higher wavelengths 170 nm. This could be caused by measurement errors in the transmission of the crystal, which is used in the calculation of the spectrum. The mismatch can also be VUV luminescence of color centers induced by the radioactivity, radioluminescence. It is known that due to the scavenger, all crystals are slightly contaminated with Pb which has a luminescence peak at 180 nm Babin et al. (2004). A more detailed investigation on the luminescence properties (radioluminescence and VUV-induced) is under way with the aim to identify contaminants as well as the additional electronic levels (defect centers) connected to Th doping in different charge states.
.10 Discussion and Conclusion
We have grown highly doped ( cm-3) 229Th:CaF2 crystals with low absorption ( = 0.9 mm-1 or 20 % transmission at 150 nm and 2 mm thickness) and highly active (1 MBq) 229Th:CaF2. This was done by careful co-precipitation of ThF4 and PbF2 and mixing with CaF2 to form a powder of growth material. The powder was then placed in a specially machined, millimeter-scale single CaF2 seed crystal which was used to grow a single Th:CaF2 crystal on top of the seed crystal using the vertical gradient freeze method. At high activities, these crystals seem to lose VUV transmission due to radioactivity-induced fluoride losses during the growth process (radiolysis). Even the not molten and undoped parts of this crystal lose transparency due to the high mobility of fluoride in the superionic state realized during crystal growth. Still, even at 1 MBq total doping activity, a transmission of several percent remains. In the future, attempts will be made to regain the undoped CaF2 transmission profile by re-feeding fluoride during growth or by annealing after growth.
The thorium-related spectral absorption feature at 122 nm decreased for radioactive crystals and the same crystals showed unidentified emission features. It is highly likely this is caused by a change in the electronic configuration of Th due to fluoride deficiency. By adding fluoride to the crystal it is expected that the electronic configuration changes to one similar to the non-radioactive crystals with high transparency. The highly active 229Th:CaF2 crystals emit Cherenkov radiation which was quantified in this work, as it which will constitute a constant background for the future nuclear spectroscopy of 229Th in the crystal matrix.
.11 Acknowledgements
Acknowledgements.
We acknowledge the tireless support for over a decade by Kurth Semmelroth, Rainer Apelt, and the scientific and technical staff of the Fraunhofer Institute for Integrated Systems and Device Technology IISB. We also thank Reinhard Uecker from the Institute for Crystal Growth for first explorations into Th:CaF2 and invaluable advice. We are grateful to Mauro Tonelli from University of Pisa and the team from MEGA Materials for sharing their experience and insights. This work received funding from the European Research Council (ERC) under the European Union’s Horizon 2020 research and innovation programme under the ThoriumNuclearClock grant agreement No. 856415. The research was supported by the Austrian Science Fund (FWF) Projects: I5971 (REThorIC) and P 33627 (NQRclock).References
- Von der Wense (2017) L. Von der Wense, On the direct detection of 229mTh (Springer, 2017).
- Tkalya et al. (2015) E. V. Tkalya, C. Schneider, J. Jeet, and E. R. Hudson, Phys. Rev. C 92, 054324 (2015).
- Tkalya (2011) E. Tkalya, Physical review letters 106, 162501 (2011).
- Borisyuk et al. (2019) P. V. Borisyuk, N. N. Kolachevsky, A. V. Taichenachev, E. V. Tkalya, I. Y. Tolstikhina, and V. I. Yudin, Phys. Rev. C 100, 044306 (2019).
- Bilous et al. (2017) P. V. Bilous, G. A. Kazakov, I. D. Moore, T. Schumm, and A. Pálffy, Phys. Rev. A 95, 032503 (2017).
- Nickerson et al. (2020) B. S. Nickerson, M. Pimon, P. V. Bilous, J. Gugler, K. Beeks, T. Sikorsky, P. Mohn, T. Schumm, and A. Pálffy, Phys. Rev. Lett. 125, 032501 (2020).
- Nickerson et al. (2021) B. S. Nickerson, M. Pimon, P. V. Bilous, J. Gugler, G. A. Kazakov, T. Sikorsky, K. Beeks, A. Grüneis, T. Schumm, and A. Pálffy, Physical Review A 103, 053120 (2021).
- Tkalya et al. (1996) E. Tkalya, V. Varlamov, V. Lomonosov, and S. Nikulin, Physica Scripta 53, 296 (1996).
- Dessovic et al. (2014) P. Dessovic, P. Mohn, R. Jackson, G. Winkler, M. Schreitl, G. Kazakov, and T. Schumm, Journal of Physics: Condensed Matter 26, 105402 (2014).
- Seiferle et al. (2019) B. Seiferle, L. von der Wense, P. V. Bilous, I. Amersdorffer, C. Lemell, F. Libisch, S. Stellmer, T. Schumm, C. E. Düllmann, A. Pálffy, and P. G. Thirolf, Nature 573, 243 (2019).
- Sikorsky et al. (2020) T. Sikorsky, J. Geist, D. Hengstler, S. Kempf, L. Gastaldo, C. Enss, C. Mokry, J. Runke, C. E. Düllmann, P. Wobrauschek, et al., Physical Review Letters 125, 142503 (2020).
- von der Wense et al. (2016) L. von der Wense, B. Seiferle, M. Laatiaoui, J. B. Neumayr, H.-J. Maier, H.-F. Wirth, C. Mokry, J. Runke, K. Eberhardt, C. E. Düllmann, N. G. Trautmann, and P. G. Thirolf, Nature 533, 47 (2016).
- Hehlen et al. (2013) M. P. Hehlen, R. R. Greco, W. G. Rellergert, S. T. Sullivan, D. DeMille, R. A. Jackson, E. R. Hudson, and J. R. Torgerson, Journal of Luminescence 133, 91 (2013), 16th International Conference on Luminescence ICL’11.
- Rellergert et al. (2010) W. G. Rellergert, S. T. Sullivan, D. DeMille, R. R. Greco, M. P. Hehlen, R. A. Jackson, J. R. Torgerson, and E. R. Hudson, IOP Conference Series: Materials Science and Engineering 15, 012005 (2010).
- Rubloff (1972) G. W. Rubloff, Phys. Rev. B 5, 662 (1972).
- Letz et al. (2009) M. Letz, A. Gottwald, M. Richter, and L. Parthier, Phys. Rev. B 79, 195112 (2009).
- Kazakov et al. (2012) G. A. Kazakov, A. N. Litvinov, V. I. Romanenko, L. P. Yatsenko, A. V. Romanenko, M. Schreitl, G. Winkler, and T. Schumm, New Journal of Physics 14, 083019 (2012).
- Masuda et al. (2019) T. Masuda, A. Yoshimi, A. Fujieda, H. Fujimoto, H. Haba, H. Hara, T. Hiraki, H. Kaino, Y. Kasamatsu, S. Kitao, K. Konashi, Y. Miyamoto, K. Okai, S. Okubo, N. Sasao, M. Seto, T. Schumm, Y. Shigekawa, K. Suzuki, S. Stellmer, K. Tamasaku, S. Uetake, M. Watanabe, T. Watanabe, Y. Yasuda, A. Yamaguchi, Y. Yoda, T. Yokokita, M. Yoshimura, and K. Yoshimura, Nature 573, 238 (2019).
- Jeet et al. (2015) J. Jeet, C. Schneider, S. T. Sullivan, W. G. Rellergert, S. Mirzadeh, A. Cassanho, H. P. Jenssen, E. V. Tkalya, and E. R. Hudson, Phys. Rev. Lett. 114, 253001 (2015).
- Stellmer et al. (2018) S. Stellmer, G. Kazakov, M. Schreitl, H. Kaser, M. Kolbe, and T. Schumm, Phys. Rev. A 97, 062506 (2018).
- Stöber (1924) F. Stöber, Zeitschrift für Kristallographie - Crystalline Materials 61, 299 (1924).
- Schreitl (2016) M. Schreitl, Growth and characterization of (doped) calcium fluoride crystals for the nuclear spectroscopy of Th-229, Ph.D. thesis, Wien (2016).
- Molchanov et al. (2005) A. Molchanov, J. Friedrich, G. Wehrhan, and G. Müller, Journal of crystal growth 273, 629 (2005).
- Ko et al. (2001) J. Ko, S. Tozawa, A. Yoshikawa, K. Inaba, T. Shishido, T. Oba, Y. Oyama, T. Kuwabara, and T. Fukuda, Journal of crystal growth 222, 243 (2001).
- Haynes et al. (2016) W. M. Haynes, D. R. Lide, and T. J. Bruno, CRC handbook of chemistry and physics (CRC press, 2016).
- Capelli et al. (2015) E. Capelli, O. Benes, P. Raison, M. Beilmann, C. Kunzel, and R. Konings, Journal of Chemical & Engineering Data 60, 3166 (2015).
- Beeks and Schumm (2022) K. Beeks and T. Schumm, The Nuclear Excitation of Thorium-229 in the CaF2 Environment, Ph.D. thesis, TU Wien (2022).
- Reiterov et al. (1980) V. Reiterov, L. Trofimova, and L. Shishatskaya, SOV. J. OPT. TECH. 47, 284 (1980).
- Denks et al. (2000) V. Denks, T. Savikhina, and V. Nagirnyi, Applied surface science 158, 301 (2000).
- Rix et al. (2011) S. Rix, U. Natura, F. Loske, M. Letz, C. Felser, and M. Reichling, Applied Physics Letters 99, 261909 (2011).
- Angervaks et al. (2018) A. E. Angervaks, A. V. Veniaminov, M. V. Stolyarchuk, V. E. Vasilev, I. Kudryavtseva, P. P. Fedorov, and A. I. Ryskin, J. Opt. Soc. Am. B 35, 1288 (2018).
- Dmitrievskii and Migachev (1960) V. Dmitrievskii and A. Migachev, Journal of Nuclear Energy. Part A. Reactor Science 12, 185 (1960).
- Voronin and Volkov (2001) B. Voronin and S. Volkov, Journal of Physics and Chemistry of Solids 62, 1349 (2001).
- Derrington et al. (1975) C. Derrington, A. Lindner, and M. O’Keeffe, Journal of Solid State Chemistry 15, 171 (1975).
- Rodnyi (1997) P. A. Rodnyi, Physical processes in inorganic scintillators, Vol. 14 (CRC press, 1997).
- Stellmer et al. (2016) S. Stellmer, M. Schreitl, G. A. Kazakov, J. H. Sterba, and T. Schumm, Phys. Rev. C 94, 014302 (2016).
- Babin et al. (2004) V. Babin, K. D. Oskam, P. Vergeer, and A. Meijerink, Radiation Measurements 38, 767 (2004), proceedings of the 5th European Conference on Luminescent Detectors and Transformers of Ionizing Radiation (LUMDETR 2003).