Computational design of novel MAX phase alloys for potential hydrogen storage media combining first principles and cluster expansion methods
Abstract
Finding a suitable material for hydrogen storage at ambient atmospheric conditions is challenging for material scientists and chemists. In this work, using a first principles based cluster expansion approach, the hydrogen storage capacity of Ti2AC (A = Al, Ti, Cr, Mn, Fe, Co, Ni, Cu, and Zn) MAX phase and its alloys were studied. We found that hydrogen is energetically stable in Ti-A layers in which the tetrahedral site consisting of one A atom and three Ti atoms is energetically more favorable for hydrogen adsorption than other sites in the Ti-A layer. Ti2CuC has the highest hydrogen adsorption energy than other Ti2AC phases. We find that 83.33% Cu doped Ti2AlxCu1-xC alloy structure is both energetically and dynamically stable and can store 3.66 wt% hydrogen at ambient atmospheric conditions, which is higher than both Ti2AlC and Ti2CuC phase. These findings indicate that the hydrogen capacity of the MAX phase can be significantly improved by doping an appropriate atom species.
IKST] Indo-Korea Science and Technology Center (IKST), Jakkur, Bengaluru 560065, India KIST] Electronic Materials Research Center, Korea Institute of Science and Technology, Seoul 02792, Republic of Korea KIST2]Energy Materials Research Center, Korea Institute of Science and Technology, Seoul 02792, Seoul, Republic of Korea. KIST] Electronic Materials Research Center, Korea Institute of Science and Technology, Seoul 02792, Republic of Korea IKST] Indo-Korea Science and Technology Center (IKST), Jakkur, Bengaluru 560065, India
Keywords: MAX phase, Hydrogen storage, First-principles calculations, Cluster expansion
1 Introduction
Over the past decade, the MAX phase materials which are mainly composed of layered ternary carbides and nitrides are getting huge attention due to their unique properties that arise from the presence of both covalent and metallic bonds in the structure 1, 2. The MAX phases (Mn+1AXn, where M is early transition metals, A is a representative elements, X is C or N, and n = 1,2,3 ) are ternary carbides and nitrides with a family of more than 80 members 3. MAX consists of early transition metals and group A elements, which are highly abundant and not hazardous to the environment. The wide availability and nontoxic nature of building elements of the MAX phase make the MAX phase cost-effective and environmentally friendly. These materials have a wide range of possible applications, including structural materials for high temperature applications, protective coatings and bond-coats for gas turbines, fuel cladding, solar receivers, electrical contacts, catalysts, and many more. Depending on the different property between M-A (metallic) and M-X (covalent) bonding, MAX phases exhibit both ceramic and metallic property, including high electrical conductivity, oxidation resistance, catalysis, electronics, gas sensing, and energy storage 4, 5, 6. Some MAX phases, such as Ti3AlC2, Ti2AlC, Cr2AlC, also show exceedingly good oxidation resistance and oxidation-induced self-healing ability 7, and can be used as high-temperature structural materials. Moreover, MAX phase materials are expected to be applied to cladding and structural materials of the rapid reactor for molten lead cooling due to excellent resistance to neutron and He, Ar, Kr, I, Xe, Au plasma irradiation damage ability and excellent resistance to molten lead corrosion 8. Also, some MAX phase films, for example, Ti3SiC2 films, are able to be applied to the surface of metal bipolar plates to improve the corrosion resistance and conductivity of metal bipolar plates as well a considerable application prospect in commercial fuel cells9. MAX phases contain two alternately stacked fundamental structural units: the non-stoichiometric transition metal carbide or nitride slabs in NaCl-type crystal structure and the close-packed A-group atomic plane 10.
MAX phase has been mostly studied with metal hydride to enhance the hydrogen storage capacity or production. 7 wt% Ti3AlC2 MAX-phase composition with Mg significantly reduce dehydrogenation temperature of the composite 11. Liu et al. show Ti3AlC2/Pd catalyst with 3 wt% Pd loading had a much higher capacity for hydrogen production than conventional Pd nanoparticles 12. MAX phase behaves as a support structure for palladium nanoparticles for the hydrogen generation from alkaline formaldehyde solution at room temperature. The layered structures of the MAX phase can also be useful in the hydrogen storage field. Very few studies are available on the hydrogen storage performance of the MAX phase or MXene. Hydrofluoric acid incompletely etched multilayered MXene phase shows wt% hydrogen storage capacity at ambient condition and Ti2CTx (T is a functional group) can store 8.8 wt% at room temperature and 60 bar H2 13. Single layer MXene can store up to 8.6 wt% hydrogen by chemisorption of the H atom (1.7 wt %), physisorption of the H2 molecule (3.4 wt %), and Kubas-type binding of the H2 molecule (3.4 wt %) 14. Ding et al. studied the hydrogen incorporation mechanism into the MAX phase Ti3AlC2 by first-principles simulation and find out Ti-Al layers are suitable for hydrogen incorporation 15.
Among all phases, Ti2AlC is one of the most light-weight and oxidation-resistant layered ternary carbides and it has been extensively studied by many researchers 16, 17, 18. Light-weight material can enhance hydrogen storage capacity in any structure. In this work, we investigate the hydrogen storage capacity of Ti2AlC in MAX phase and also possible doped 211 MAX structure with higher hydrogen storage capacity. We have employed first-principles simulation along with cluster expansion approach to find out possible doped MAX structures. We find that Hydrogen can be only incorporated in Ti-Al layers. Hydrogen in Ti-C layers is unstable and easily migrate to Ti-Al layers. 83.33% doped TiAlxCu1-xC structure has higher hydrogen storage capacity than Ti2AlC and Ti2CuC structure. In addition, the doped TiAlxCu1-xC structure is very stable in nature and can be synthesized experimentally.
2 Computational details
2.1 ab-initio calculations
All first-principles calculations have been performed using the density functional theory (DFT) as implemented in the Vienna Ab initio Software Package (VASP) 19, 20. For the core and valence electrons, projected augmented wave (PAW) potentials and plane-wave basis sets were used with the Perdew–Burke–Ernzerhof (PBE) functional to get the electronic energy 21, 22. Corrections were made to account for long-range interactions using the semi-empirical Grimme D2 dispersion method and for non-spherical contributions to the PAW potentials that were built into the code 23. All energies converged within a cutoff of 500 eV. The conjugate gradient algorithm is used for structural optimization 24. The convergence criteria for energy and force are 10-7 eV and 0.01 eVÅ-1, respectively. In all calculations, spin polarisation was enabled, with the only exception of the isolated H2 closed shell molecule.
The adsorption energy (Eads) of hydrogen on the different MAX structure were calculated by:
| (1) |
where EMAX+nH is the energy of the hydrogenated MAX structure, EMAX and EH2 are the energies of the pristine structure and isolated H2, respectively, and n is the number of hydrogen atoms involved in the adsorption.
The atomic charges for all structures were calculated by Bader charge analysis, as suggested by Henkelman and co-workers 25, 26. The formation energy of Ti2AlxCu1-xC structure at different Cu concentration ere calculated by:
| (2) |
where E is the energy of the pure or doped structure and x is the atomic fraction in the doped structure.
In order to estimate the release temperature, the chemical potential of the hydrogen in the solid phase and in the gas phase needs to be evaluated. The chemical potential energy of hydrogen as a function of temperature (T) and pressure (p) was obtained using standard statistical thermodynamics, via the formula 27:
| (3) |
where Eel and EZPE are the electronic and zero point energy of the hydrogen molecule as derived from DFT, H0 and S0 is enthalpy and entropy at standard pressure p0 = 1 bar. The values of enthalpy and entropy at standard pressure can be found in JANAF thermochemical tables 28. The critical hydrogen chemical potential, , at which the different MAX structure release hydrogen from the structure is given by 29.
2.2 Calculation of formation energies of the solid solutions using the Cluster expansion approach
A DFT-based technique cannot efficiently scan the energies of the immensely large configuration space that includes doped materials. A simple but efficient way is to construct an effective Hamiltonian using a relatively smaller database of DFT energies for these systems, which can then be used to scan a large configuration space. The cluster expansion method is an widely used method and can be used to calculate the energy of a large number of doped structures 30, 18. The total energy of an alloy with configuration is calculated by constructing the so called cluster expansion effective Hamiltonian which is given by 31, 32, 33
| (4) |
Here J is known as the effective cluster interactions (ECI). J0 represents ECI of an empty cluster. can represent a single (point), pair or triplet cluster of sites. Each lattice site (i) is assigned an occupation variable depending on whether it is occupied by an Al or Cu atom. are the cluster correlation functions. To create a DFT database of Cu-doped Ti2AlC structures, the DFT energy of Cu doped 155 random structures of Ti2AlxCu1-xC was calculated. Of these, 140 configurations were used to train the cluster expansion model and the remaining 15 were used to test the model. We performed 10-fold cross-validations to avoid over-fitting the data.
To obtain the ECI’s and the model we use the least absolute shrinkage and selection operator (LASSO) approach where the following minimization is performed to obtain the optimal ,
| (5) |
Here is the regularization term and is an hyper-parameter. To obtain new stable Cu-doped materials we follow the following strategy: first we fit the DFT energies in a satisfactory way to the cluster expansion Hamiltonian given by Eq.4, next we generate a large pool of doped configurations (1000 ) and calculate the total energies of such (Ti2AlxCu1-xC) configurations using the fitted cluster expansion Hamiltonian. These energies for different compositions are then further used to calculate the formation energies. The formation energy of all compositions was calculated using equation 2.
3 Results and Discussion
In Ti2AlC has several interstitial sites and all of them fall into two parts: the interstitial sites in the Ti-Al and Ti-C layers. To find out possible hydrogen adsorption sites, all possible interstitial sites are considered. Figure 1 shows the possible H occupation sites in both Ti-Al and Ti-C layers. There are three kinds of interstitial sites in Ti-Al layers: the tetrahedral interstitial site Itetr-1 consists of three Al atoms and one Ti atom, the tetrahedral interstitial site Itetr-2 consists of three Ti atoms and one Al atom, and the octahedral interstitial site Ioct-3 consists of three Al atoms and three Ti atoms. The Ti-C layers have two tetrahedral interstitial sites Itetr-4 and Itetr-5 consisting of three Ti atoms and one Ti atom from different Ti-C layers. The interstitial sites are designated as 1, 2, 3, 4, and 5, respectively in Fig. 1.
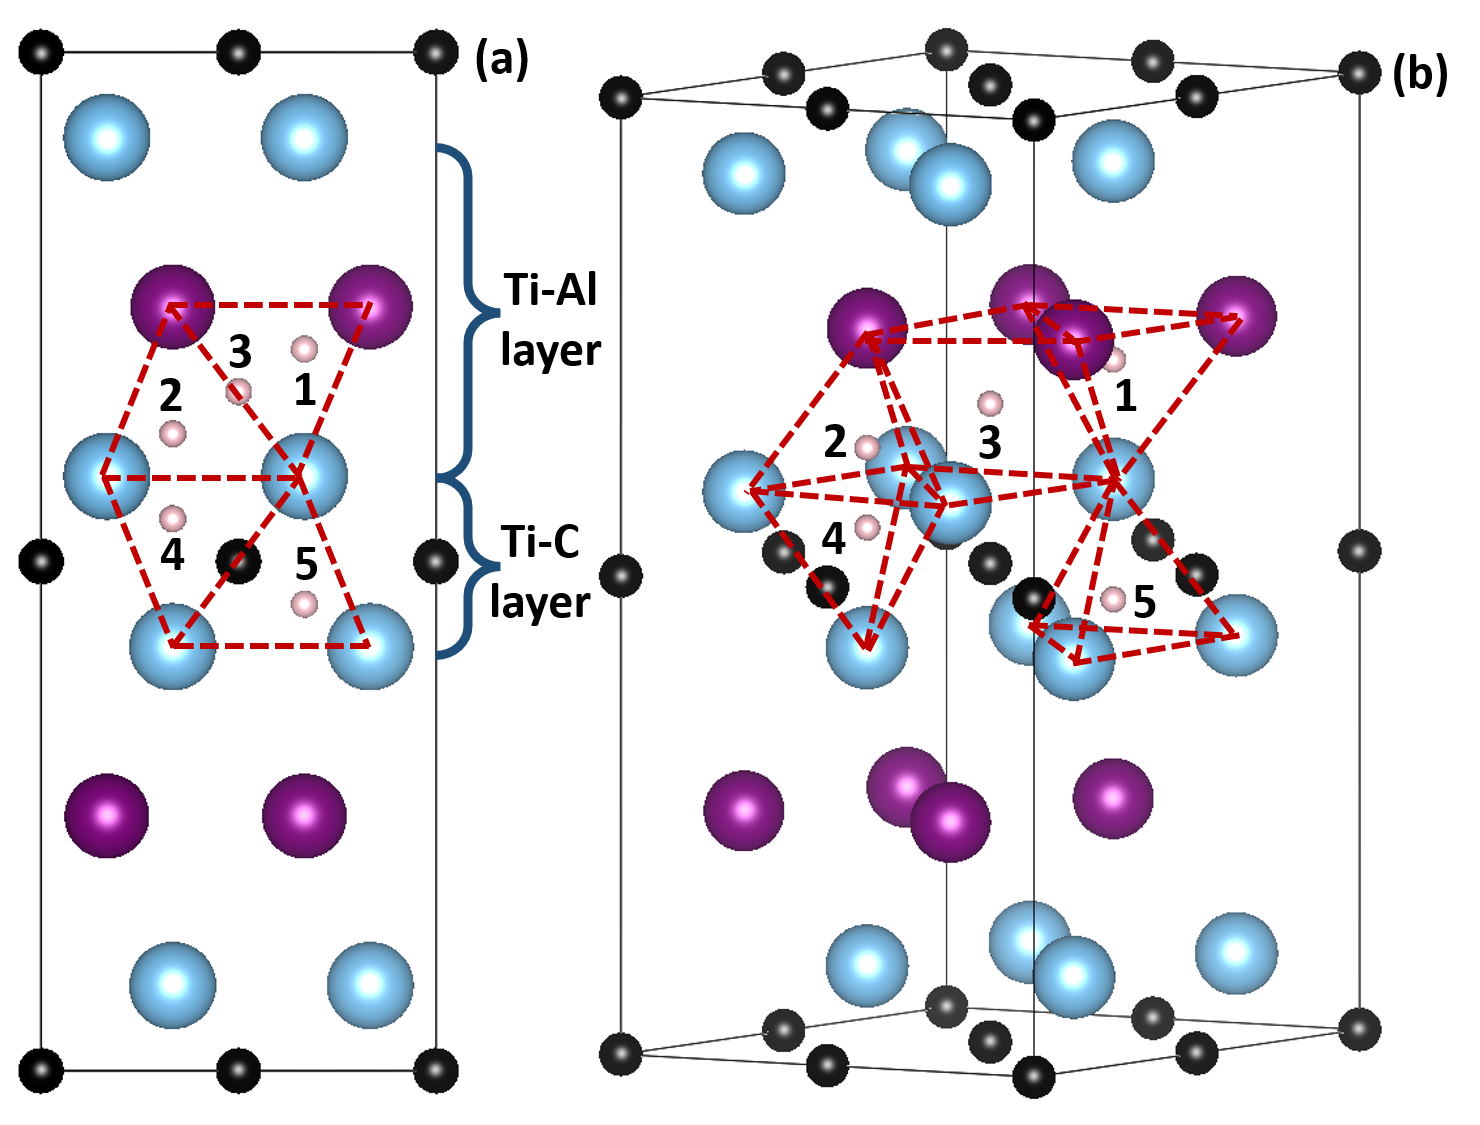
The Hydrogen adsorption energy at different sites is calculated by Equation 1 and the results are shown in Table 1. Hydrogen atoms are exothermically adsorbed at all interstitial sites in Ti-Al layers. Among all interstitial sites in Ti-Al layers, Itetr-2 is more stable than Ioct-3 and Itetr-1. In a relaxed structure, the H atom at Itetr-1 moves to the Al layers and locates in the center of the triangular interstitial site consisting of three atoms. In one Ti2AlC formula unit, a total of 6 interstitial sites are present in Ti-Al layers. Among 6 interstitial sites, two of each interstitial type (Itetr-1, Itetr-2, and Ioct-3) are present. H atom in Ti-C layers is unstable and H atom move to Itetr-2 interstitial site after relaxation from Itetr-4 and Itetr-5.
| Sites of hydrogen | Ti-AL layer | Ti-C layer | ||||
| Itetr-1 | Itetr-2 | Ioct-3 | Itetr-4 | Itetr-5 | ||
| Eads(eV) | -0.06 | -0.40 | -0.23 | unstable | unstable | |
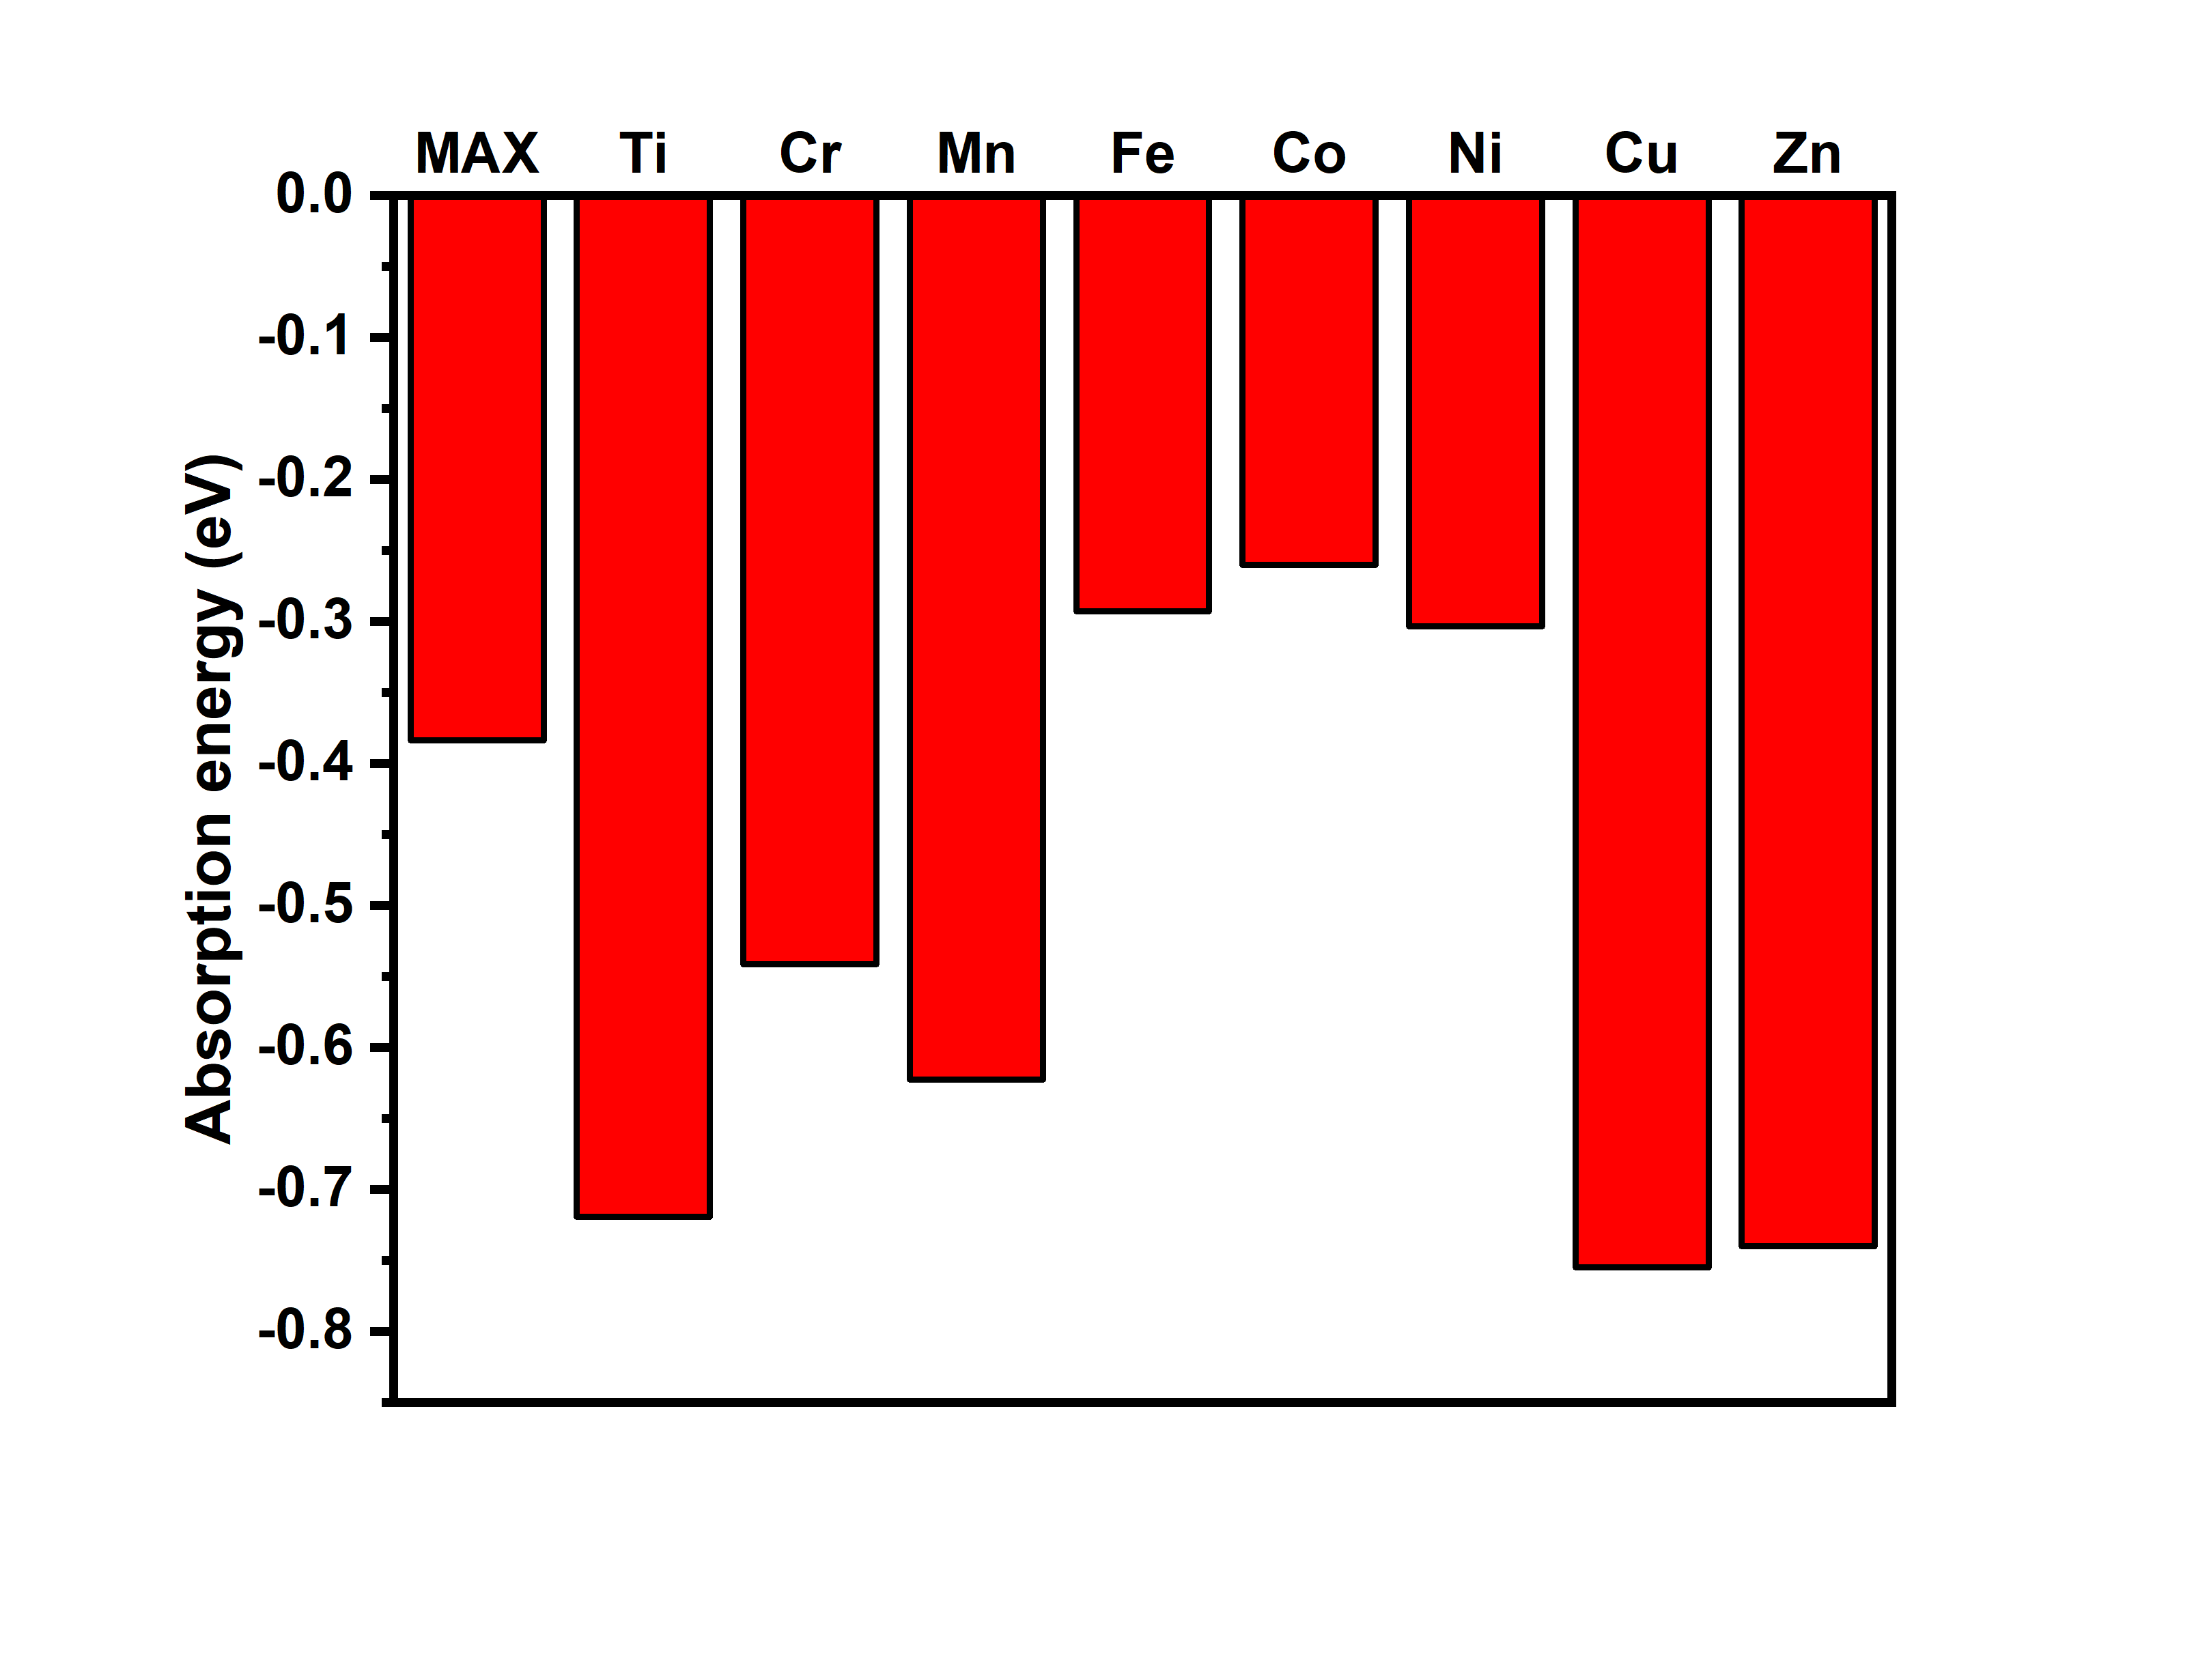
In the current study, we examined how the performance of hydrogen storage is affected when aluminium (Al) in the MAX phase is replaced with 3d-transition metals such as Ti, Cr, Mn, Fe, Co, Ni, Cu, and Zn atoms. Hydrogen adsorption energy was calculated by placing one hydrogen atom at Itetr-2 site in different Al substituted MAX phase. Figure 2 shows adsorption energy of different 211 MAX phase. Among all MAX phase Ti2CuC has the highest hydrogen adsorption energy of -0.76 eV/H. For hydrogen storage calculation, we compared hydrogen capacity between Ti2AlC and Ti2CuC phase.
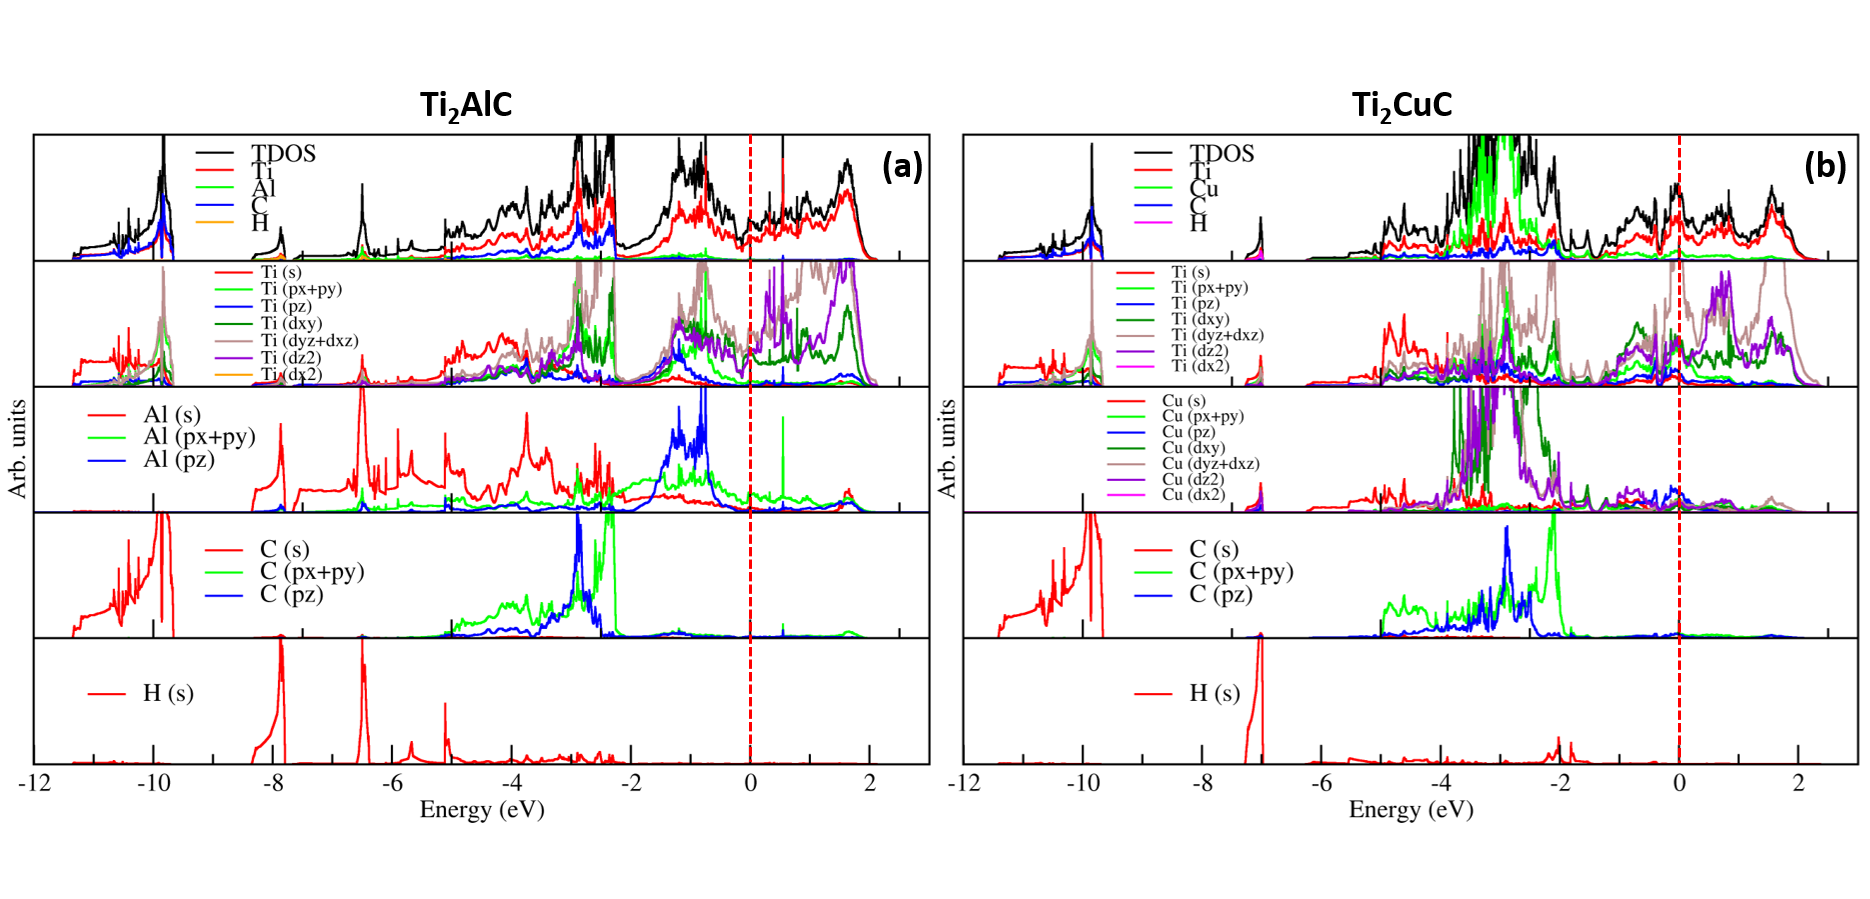
Next, we calculated electronic structure of Ti2AlC and Ti2CuC phase. As Ti has lower electronegativity and high oxidation states electron may transfer from Ti2C layer to Al or Cu atom. Figure 3 shows total electronic density of states (DOS) and projected DOS of atomic orbitals of Ti2AlC and Ti2CuC MAX phases. In Ti2AlC phase, the Fermi level is contributed by not only Ti 3d but also Al 3s and Al 3p orbitals (fig. 3 (a)). With increasing atomic number in the MAX phase, the contribution of Cu atom to the Fermi level decreases. The band center of s, p, and orbitals of Cu is located much deeper than Al (fig. 3 (b)). The Ti 3d orbital of Ti2CuC phase contributed more to the Fermi level.
To find out the hydrogen adsorption mechanism, electron transfer between the hydrogen atom and MAX phase was calculated. The Bader charge analysis of Ti2AlC, Ti2CuC, and their hydrides a listed in Table 2. In the MAX phase, hydrogen is negatively charged because it accepts electron from neighboring atoms. The electron transfer to H is mostly contributed by Al and Cu atoms in Ti2AlC and Ti2CuC phase, respectively. In Ti3A tetrahedral, hydrogen present as H- anion. Hydrogen in Itetr-2 site shows a greater stabilization effect through the Coulomb interaction. Hydrogen in Ti2CuC accepts lesser electrons than hydrogen in the Ti2AlC phase, which indicates the hydrogen bonding characteristic in the MAX phase changes from ionic to metallic. The bonding of hydrogen in the Ti2AlC phase is more ionic in nature, whereas in the Ti2CuC phase the bonging is metallic in nature.
| Ti | Al | C | H | ||
|---|---|---|---|---|---|
| Ti2AlC | Ti4Al2C2 | 2.03 | -1.21 | -2.84 | |
| Ti4Al2C2H1/2 | 2.03 | -1.06 | -2.82 | -1.34 | |
| Ti | Cu | C | H | ||
| Ti2CuC | Ti4Cu2C2 | 2.03 | -1.31 | -2.75 | |
| Ti4Cu2C2H1/2 | 2.04 | -1.21 | -2.77 | -0.79 |
To incorporate hydrogen in the material, the diffusion path of hydrogen in the material is necessary as the adsorption energy of the hydrogen in the materials. Ding et al. 15 shows hydrogen diffusion in Ti-A layers of Ti3AlC2 phase is following. Hydrogen firstly diffused from Itetr-1 to a nearest Itetr-2 (Path I), then diffused to a nearest Ioct-3 (Path II), and finally to nearest Itetr-1 site (Path III). In this study same path is followed to find out the suitable MAX phase for easier diffusion of hydrogen among Ti2AlC and Ti2CuC. Figure 4 (a) shows the H energy diffusion barrier for Ti2AlC. The energy diffusion barrier between Itetr-1 and Itetr-2 site is 0.53 eV. However, the opposite direction has a higher diffusion energy barrier of 0.87 eV. The diffusion energy barrier for Itetr-2 to Ioct-3 is 0.32 eV, whereas the opposite path is easier with energy barrier of 0.15 eV. The path between Ioct-3 and Itetr-1 is also easier than the path I. The energy barrier between Ioct-3 and Itetr-1 is 0.44 eV and the opposite path is much easier with barrier energy 0.27 eV. Based on the energy barrier value, Ioct-3 behaves as an intermediate position for hydrogen adsorption and desorption in Ti2AlC. The H atom of both Itetr-1 and Itetr-2 first diffuse to nearby Ioct-3, then move to other Itetr-1 and Itetr-2 site. The activation energy of hydrogen diffusion in Ti-Al layers of Ti2AlC is much lower than -Ti and TiC 34, 35, which could be useful for the hydrogen insertion mechanism in Ti2AlC.
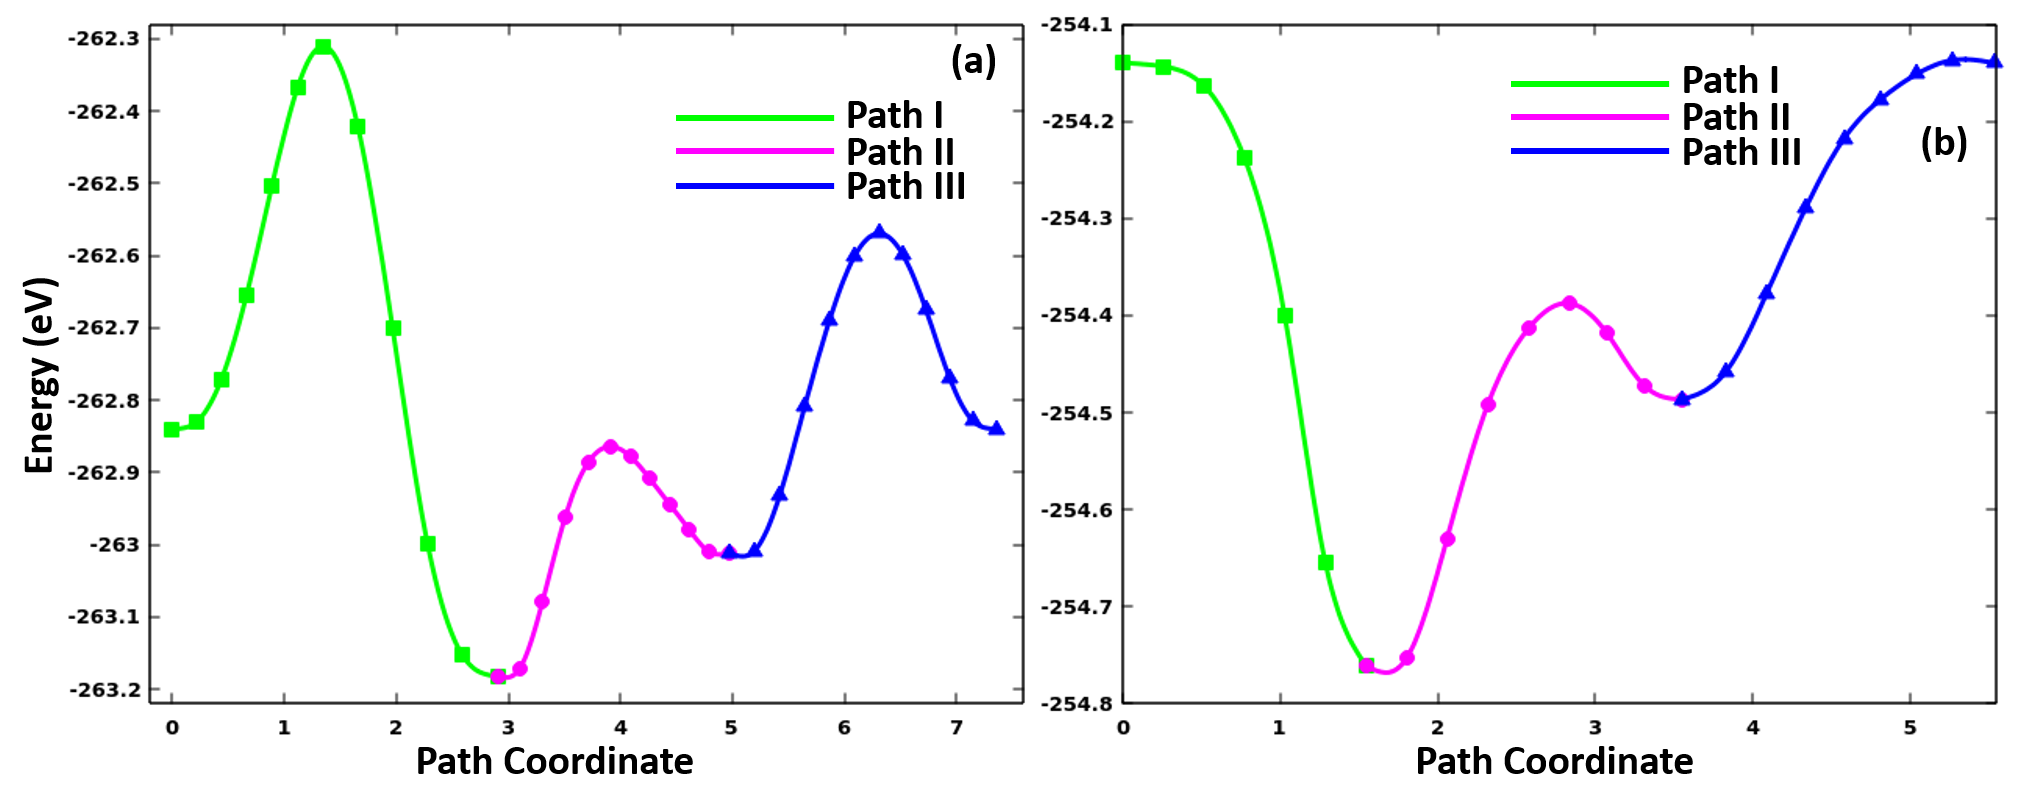
Figure 4 (b) shows the H energy diffusion barrier for Ti2CuC. The path between Itetr-1 and Itetr-2 site has very negligible energy barrier. However, the opposite direction has a higher diffusion energy barrier of 0.62 eV. The diffusion energy barrier for Itetr-2 to Ioct-3 is 0.37 eV, whereas the opposite path is easier with energy barrier of 0.10 eV. The path between Ioct-3 and Itetr-1 is also easier than the path I. The energy barrier between Ioct-3 and Itetr-1 is 0.28 eV and the opposite path is much easier with barrier energy 0.003 eV. Similar to Ti2AlC structure in Ti2CuC Ioct-3 behave as an intermediate position. But in the Ti2CuC structure, the H atom at Itetr-1 directly move to Itetr-2 (instead of Ioct-3) since the energy barrier is negligible.
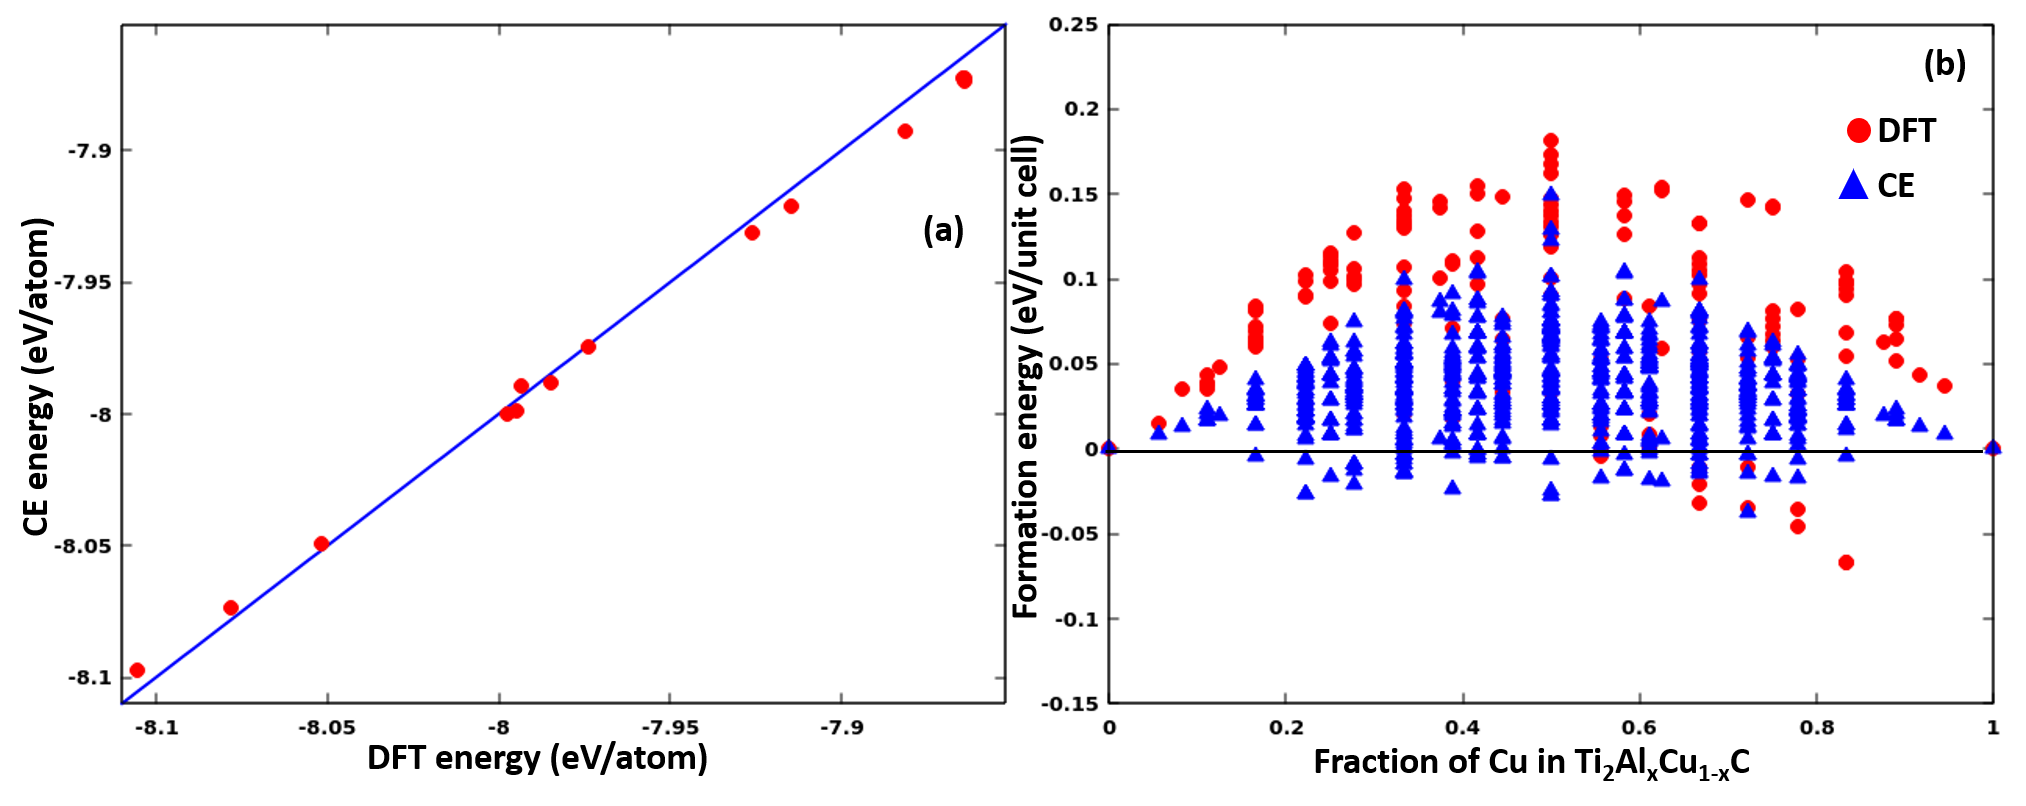
The formation energy of Ti2CuC is higher than Ti2AlC. To find out the stable structures with copper substituted in Ti2AlC, cluster expansion (CE) Hamiltonian described in Eq.4 was utilized to fit the DFT database of energies of Ti2AlxCu1-xC alloys. The accuracy of the CE model was verified by comparing it with DFT calculated energy of Cu doped Ti2AlC structure. The resulting CE energy is reasonably good at predicting DFT energy as the data points are clustered around the y=x line as shown in Fig. 5 (a). The root-mean-square error (RMSE) of the fit was 0.0065 eV/atom. Using the fitted CE model, the formation energy of Cu doped Ti2AlC structures were calculated by increasing doped concentration by 5.56%. Figure 5 (b) shows the changes in formation energy in different Cu concentration obtained from both DFT calculation and CE. At 83.33% doping concentration, the Ti2AlxCu1-xC structure has the lowest formation energy, which is - 66.75 meV/unit cell (Fig. 7 (a)). The 83.33% doped structure was relaxed by first-principles calculation before calculating hydrogen storage capacity and the dynamic stability of the structure was checked by phonon calculation. The 83.33% Cu doped Ti2AlxCu1-xC alloy structure is also dynamically stable in nature.
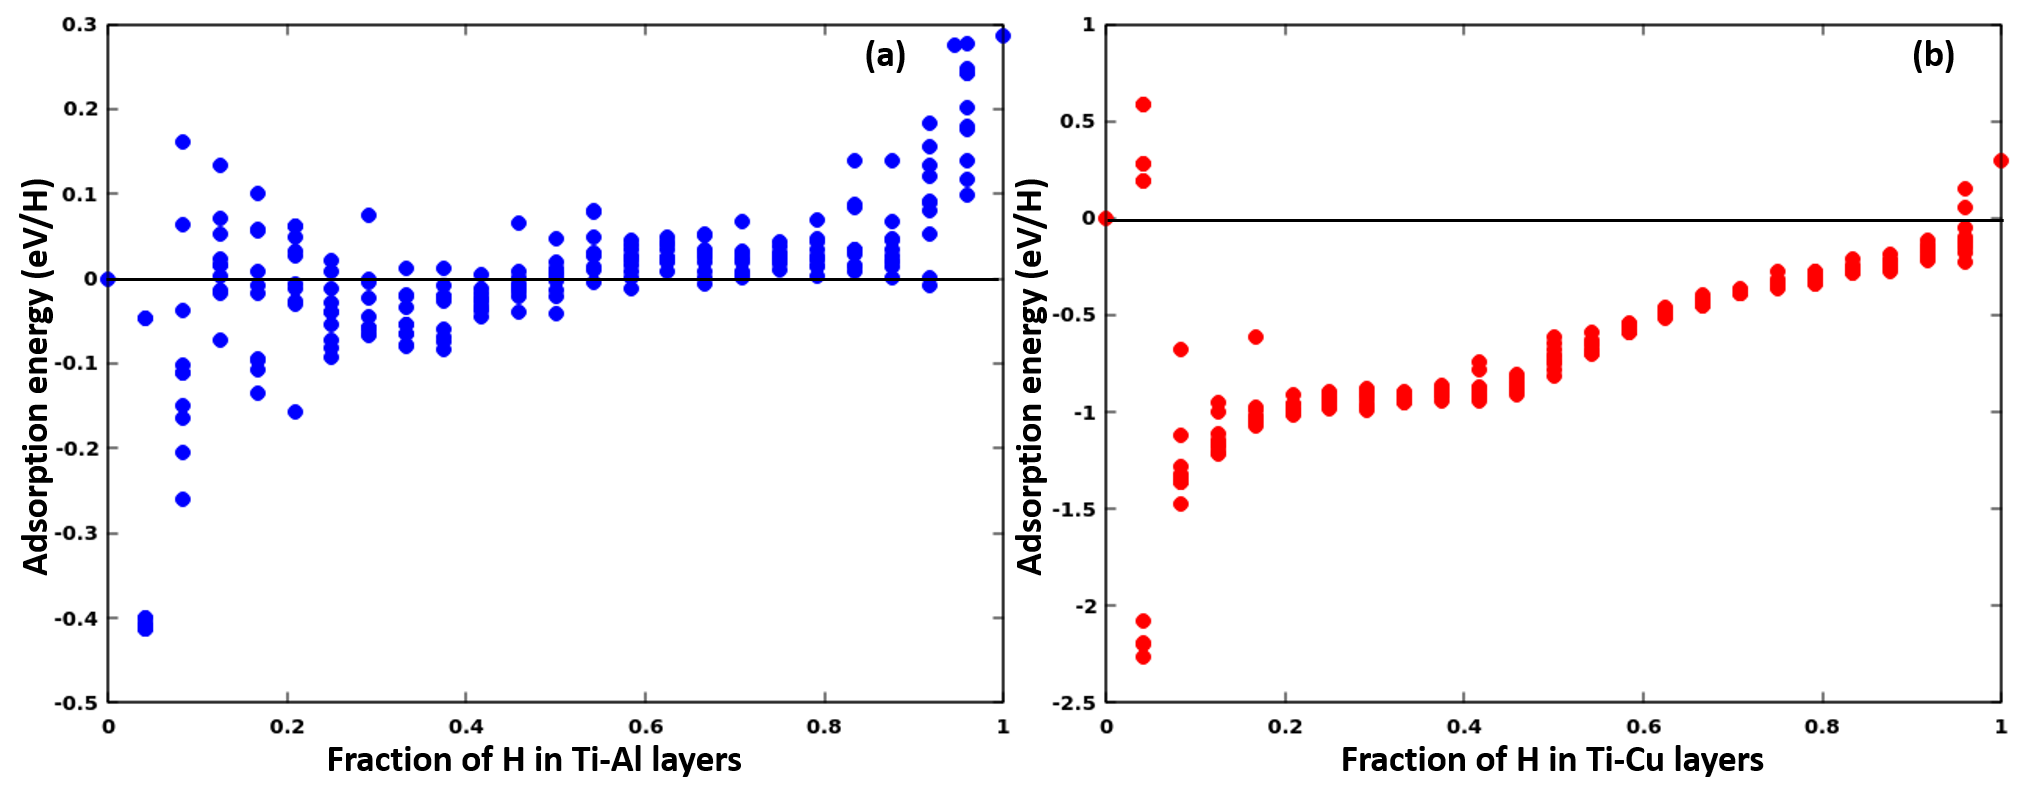
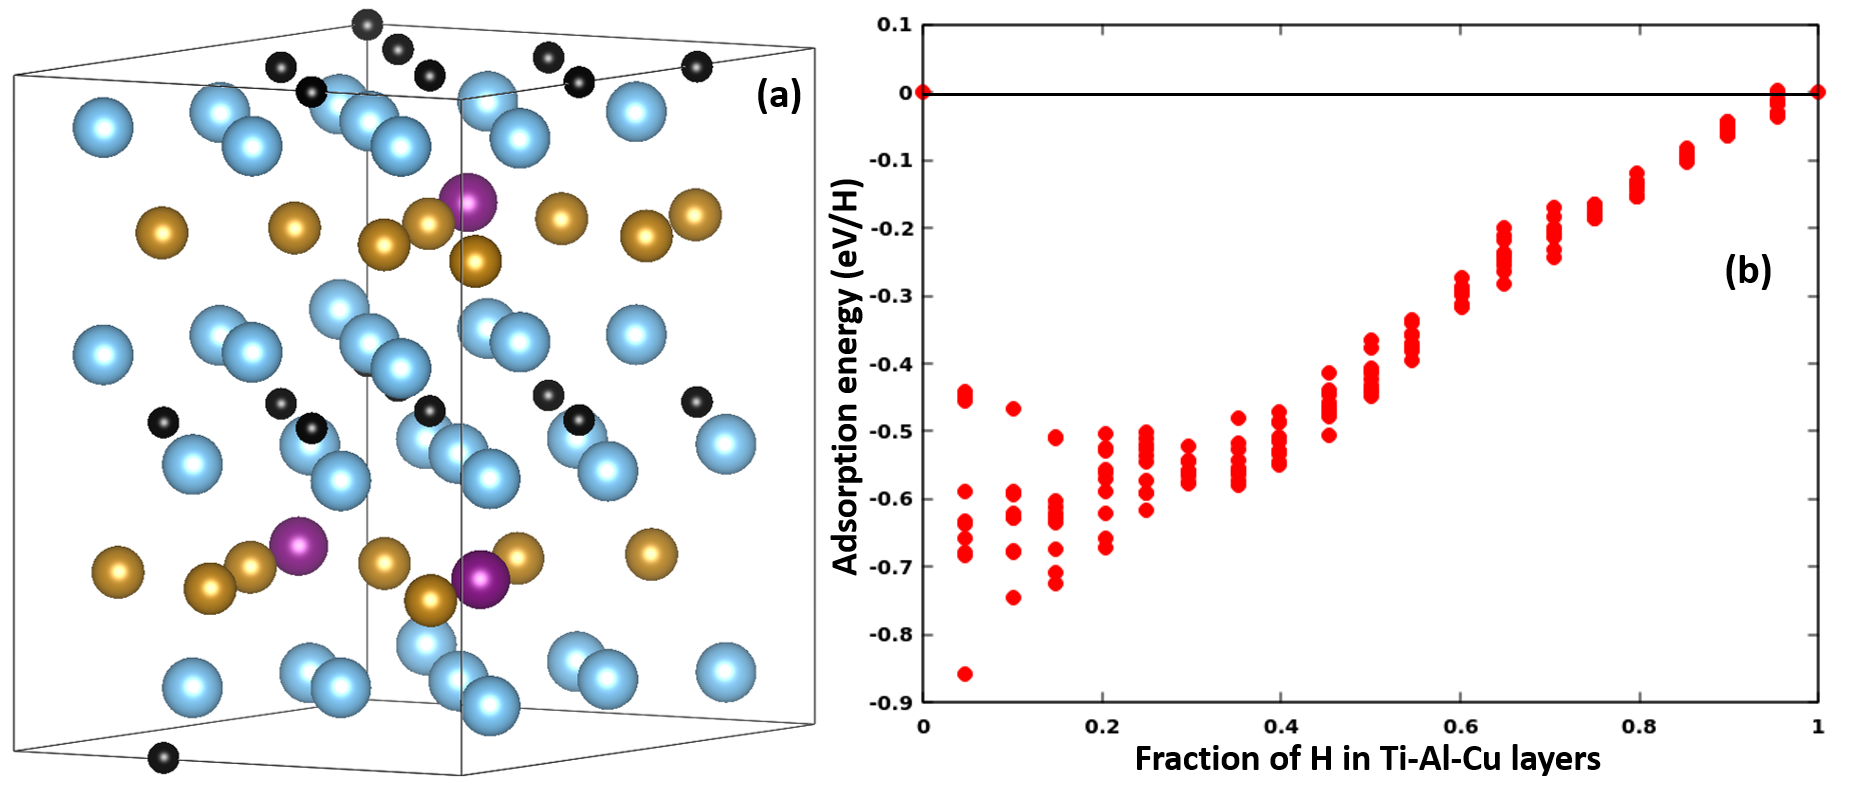
To find out the hydrogen storage capacity of Ti2AlC, Ti2CuC, and TiAlxCu1-xC, all interstitial sites in the Ti-A layer are filled increasingly with the hydrogen atom and calculate the adsorption energy. Figure 6 shows the changes in adsorption energy with increasing H concentration in Ti-A layer in Ti2AlC and Ti2CuC structure. In Fig. 6, all tetrahedral and octahedral sites in Ti-A layers filled with hydrogen atoms is designated as a 1.0 fraction of hydrogen H in Ti-A layers and a 0.0 fraction of hydrogen H in Ti-A layers implies no hydrogen atom present in the structure. The hydrogen adsorption energy was calculated by increasing the hydrogen number continuously in all structures and at which highest fraction of hydrogen the adsorption energy negative was considered as the maximum hydrogen capacity of the structure. The hydrogen weight percentage was calculated at that fraction of hydrogen for each structure. On the basis of hydrogen adsorption energy, Ti2AlC has a maximum hydrogen storage capacity of 2.62 wt%, which is higher than previously reported chemisorbed H capacity in MAXene 14. In the case of Ti2CuC structure, hydrogen storage capacity in Ti-Cu increases by 3.38 wt%. Figure 7 (b) shows the changes in adsorption energy with increasing H concentration in Ti-Al-Cu layer in 83.33% Cu doped Ti2Al0.17Cu0.83C structure. The Ti2Al0.17Cu0.83C has highest hydrogen storage capacity of 3.66 wt% and Ti2Al0.17Cu0.83CH5.72 phase. In the Ti2Al0.17Cu0.83CH5.72 phase, all Itetr-2 sites are filled by hydrogen atoms and 94.44% and 91.67% of Ioct-3 and Itetr-1 sites are occupied by hydrogen atoms, respectively.
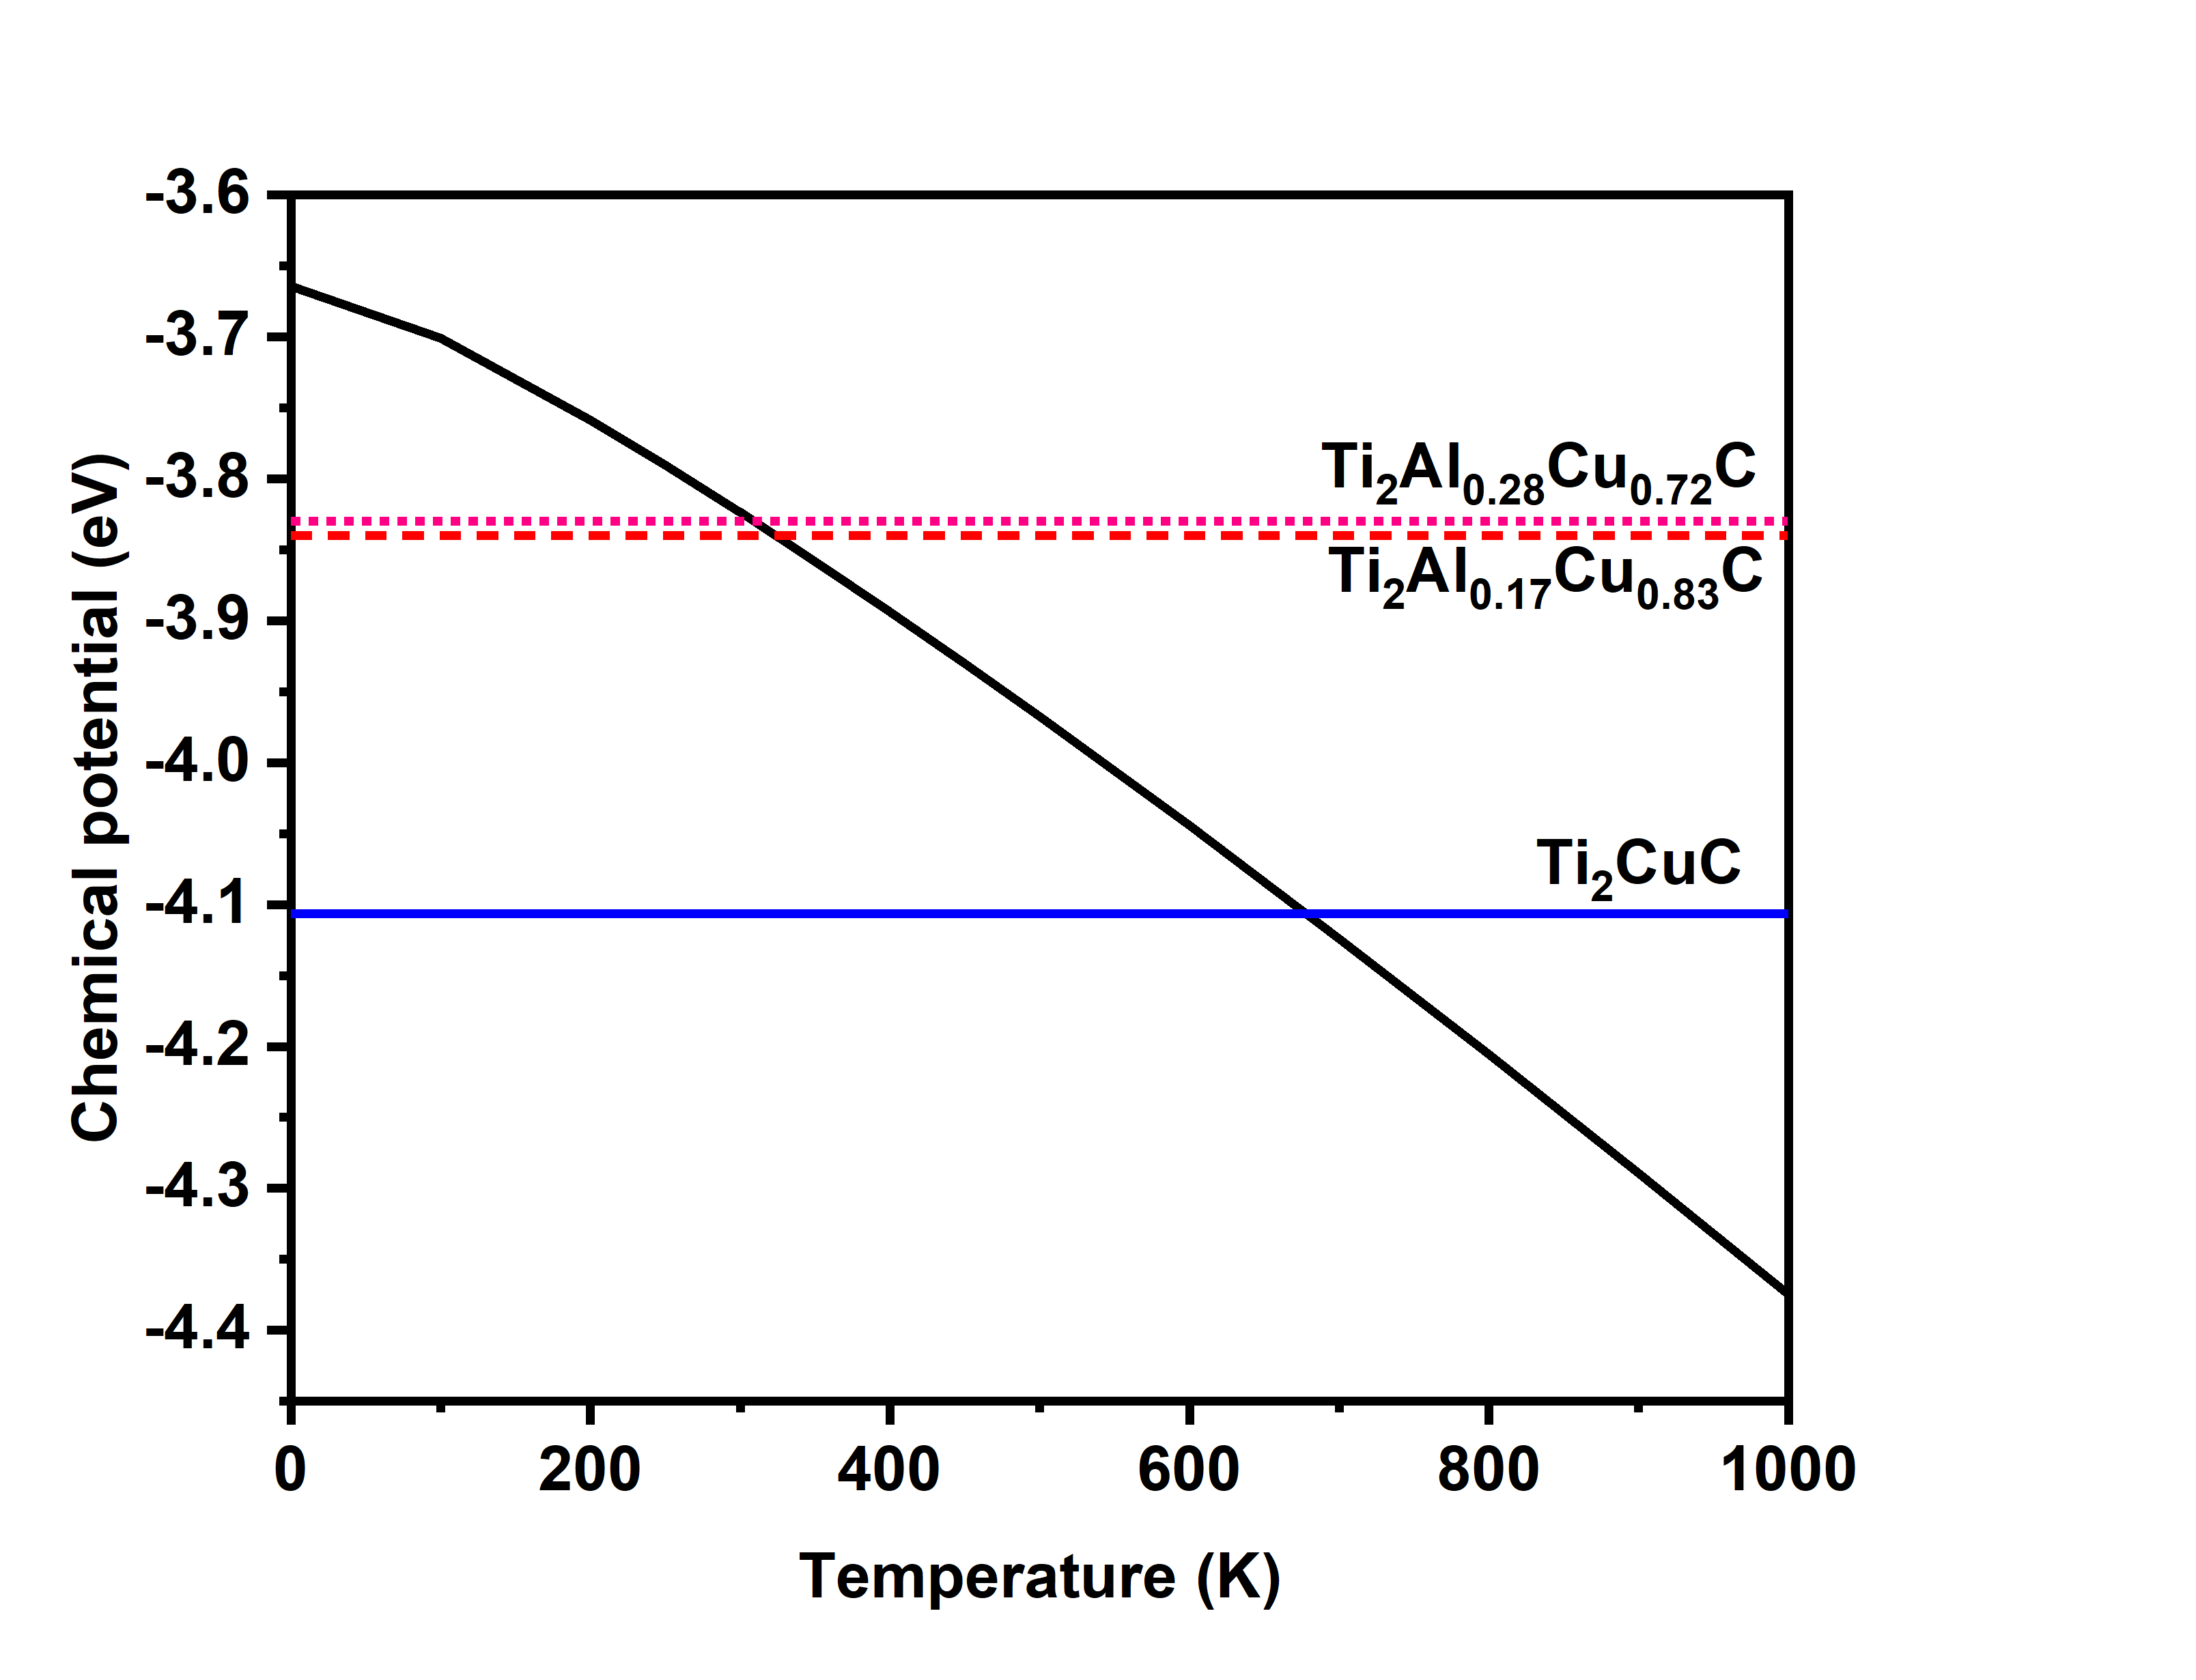
The thick black curve in Fig 8 shows the variation of the chemical potential of hydrogen atoms with the temperature at 1 bar pressure. The value of for different MAX phases at 50% storage capacity is plotted by horizontal lines. The intersection between the these lines and the hydrogen chemical potential curve indicates the corresponding critical temperature of hydrogen release from the particular surface at 1 bar pressure 29. At 50% storage capacity, Ti2AlC phase has a very low critical hydrogen chemical potential (-3.41 eV). Whereas, the hydrogen release temperature of Ti2CuC phase was 677 K, which is quite higher than the operating temperature of the hydrogen fuel cell 36. The Ti2Al0.17Cu0.83C alloy structure has a 326 K hydrogen release temperature, which is ideal for hydrogen storage applications. The hydrogen release temperature of the lowest energy structure, Ti2Al0.28Cu0.72C obtained using CE method was also calculated. The Ti2Al0.28Cu0.72C structure has a hydrogen release temperature of 311K, which is lower than Ti2Al0.17Cu0.83C structure.
4 Conclusions
In summary, we performed first-principles based cluster expansion calculation to study the hydrogen storage capacity in the MAX phase. The hydrogen atom is thermodynamically stable in Ti-A layers of Ti2AC phase. Hydrogen atoms located in the Ti-C layer moved to the Ti-A layers. Among three interstitial sites in Ti-A layers, Itetr-2 site is most favorable for hydrogen storage. DFT calculation shows among different Ti2AC phases. Ti2CuC has the highest hydrogen adsorption energy due to the deeper p-orbital position of the Cu atom. Also, this phase is more preferable for the hydrogen release in comparison to Ti2AlC due to lower Coulomb interaction. The diffusion of hydrogen in Ti2CuC phase is more easier than Ti2AlC due to the lower energy barrier. The most stable Cu doped Ti2AlC alloy has been found by the cluster expansion model. The 83.33% Cu doped Ti2AlxCu1-xC alloy structure is both energetically and dynamically stable and can store 3.66 wt% hydrogen at ambient atmospheric conditions, which is higher than both Ti2AlC and Ti2CuC phase. The 83.33% Cu doped Ti2AlxCu1-xC alloy structure is a promising 211 MAX phase for hydrogen storage application.
5 Acknowledgement
This work was supported by the Korea Institute of Science and Technology (Grant number 2E31851), GKP (Global Knowledge Platform, Grant number 2V6760) project of the Ministry of Science, ICT and Future Planning.
References
- Barsoum 2000 Barsoum, M. W. The MN+1AXN phases: A new class of solids: Thermodynamically stable nanolaminates. Progress in Solid State Chemistry 2000, 28, 201–281
- Jeitschko et al. 1964 Jeitschko, W.; Nowotny, H.; Benesovsky, F. Carbides of formula T2MC. Journal of the Less Common Metals 1964, 7, 133–138
- Hadi 2020 Hadi, M. Superconducting phases in a remarkable class of metallic ceramics. Journal of Physics and Chemistry of Solids 2020, 138, 109275
- Okubo et al. 2018 Okubo, M.; Sugahara, A.; Kajiyama, S.; Yamada, A. MXene as a Charge Storage Host. Accounts of Chemical Research 2018, 51, 591–599
- Seh et al. 2016 Seh, Z. W.; Fredrickson, K. D.; Anasori, B.; Kibsgaard, J.; Strickler, A. L.; Lukatskaya, M. R.; Gogotsi, Y.; Jaramillo, T. F.; Vojvodic, A. Two-Dimensional Molybdenum Carbide (MXene) as an Efficient Electrocatalyst for Hydrogen Evolution. ACS Energy Letters 2016, 1, 589–594
- Gogotsi and Anasori 2019 Gogotsi, Y.; Anasori, B. The Rise of MXenes. ACS Nano 2019, 13, 8491–8494
- Farle et al. 2017 Farle, A.-S. M.; Stikkelman, J.; van der Zwaag, S.; Sloof, W. G. Oxidation and self-healing behaviour of spark plasma sintered Ta2AlC. Journal of the European Ceramic Society 2017, 37, 1969–1974
- Liu et al. 2018 Liu, Y.; Zhu, D.; Grasso, S.; Hu, C. Microstructure and mechanical properties of gel casted Ti3AlC2. Ceramics International 2018, 44, 23254–23258
- Hanson et al. 2019 Hanson, W. A.; Patel, M. K.; Crespillo, M. L.; Zhang, F.; Zinkle, S. J.; Zhang, Y.; Weber, W. J. Ionizing vs collisional radiation damage in materials: Separated, competing, and synergistic effects in Ti3SiC2. Acta Materialia 2019, 173, 195–205
- Bentzel et al. 2015 Bentzel, G.; Ghidiu, M.; Anasori, B.; Barsoum, M. On the interactions of Ti2AlC, Ti3AlC2, Ti3SiC2 and Cr2AlC with silicon carbide and pyrolytic carbon at 1300°C. Journal of the European Ceramic Society 2015, 35, 4107–4114
- Lakhnik et al. 2022 Lakhnik, A.; Kirian, I.; Rud, A. The Mg/MAX-phase composite for hydrogen storage. International Journal of Hydrogen Energy 2022, 47, 7274–7280
- Liu et al. 2022 Liu, X.; Chen, W.; Zhang, X. Ti3AlC2/Pd Composites for Efficient Hydrogen Production from Alkaline Formaldehyde Solutions. Nanomaterials 2022, 12
- Liu et al. 2021 Liu, S.; Liu, J.; Liu, X.; Shang, J.; Xu, L.; Yu, R.; Shui, J. Hydrogen storage in incompletely etched multilayer Ti2CTx at room temperature. Nature Nanotechnology 2021, 16, 331–336
- Hu et al. 2013 Hu, Q.; Sun, D.; Wu, Q.; Wang, H.; Wang, L.; Liu, B.; Zhou, A.; He, J. MXene: A New Family of Promising Hydrogen Storage Medium. The Journal of Physical Chemistry A 2013, 117, 14253–14260
- Ding et al. 2016 Ding, H.; Glandut, N.; Fan, X.; Liu, Q.; Shi, Y.; Jie, J. First-principles study of hydrogen incorporation into the MAX phase Ti2AlC2. International Journal of Hydrogen Energy 2016, 41, 6387–6393
- Wang et al. 2021 Wang, Z.; Ma, G.; Li, Z.; Ruan, H.; Yuan, J.; Wang, L.; Ke, P.; Wang, A. Corrosion mechanism of Ti2AlC MAX phase coatings under the synergistic effects of water vapor and solid NaCl at 600 °C. Corrosion Science 2021, 192, 109788
- Badie et al. 2021 Badie, S.; Dash, A.; Sohn, Y. J.; Vaßen, R.; Guillon, O.; Gonzalez-Julian, J. Synthesis, sintering, and effect of surface roughness on oxidation of submicron Ti2AlC ceramics. Journal of the American Ceramic Society 2021, 104, 1669–1688
- Badie et al. 2021 Badie, S.; Sebold, D.; Vaßen, R.; Guillon, O.; Gonzalez-Julian, J. Mechanism for breakaway oxidation of the Ti2AlC MAX phase. Acta Materialia 2021, 215, 117025
- Kresse and Furthmüller 1996 Kresse, G.; Furthmüller, J. Efficiency of ab-initio total energy calculations for metals and semiconductors using a plane-wave basis set. Computational Materials Science 1996, 6, 15–50
- Kresse and Furthmüller 1996 Kresse, G.; Furthmüller, J. Efficient iterative schemes for ab initio total-energy calculations using a plane-wave basis set. Phys. Rev. B 1996, 54, 11169–11186
- Kresse and Joubert 1999 Kresse, G.; Joubert, D. From ultrasoft pseudopotentials to the projector augmented-wave method. Phys. Rev. B 1999, 59, 1758–1775
- Blöchl 1994 Blöchl, P. E. Projector augmented-wave method. Phys. Rev. B 1994, 50, 17953–17979
- Grimme 2006 Grimme, S. Semiempirical GGA-type density functional constructed with a long-range dispersion correction. Journal of Computational Chemistry 2006, 27, 1787–1799
- Perdew et al. 1996 Perdew, J. P.; Burke, K.; Ernzerhof, M. Generalized Gradient Approximation Made Simple. Phys. Rev. Lett. 1996, 77, 3865–3868
- Henkelman et al. 2006 Henkelman, G.; Arnaldsson, A.; Jónsson, H. A fast and robust algorithm for Bader decomposition of charge density. Computational Materials Science 2006, 36, 354–360
- Tang et al. 2009 Tang, W.; Sanville, E.; Henkelman, G. A grid-based Bader analysis algorithm without lattice bias. Journal of Physics: Condensed Matter 2009, 21, 084204
- Khan et al. 2016 Khan, M. E.; Zhang, P.; Sun, Y.-Y.; Zhang, S. B.; Kim, Y.-H. Tailoring graphene magnetism by zigzag triangular holes: A first-principles thermodynamics study. AIP Advances 2016, 6, 035023
- Chase et al. 1982 Chase, M. W.; Curnutt, J. L.; Downey, J. R.; McDonald, R. A.; Syverud, A. N.; Valenzuela, E. A. JANAF Thermochemical Tables, 1982 Supplement. Journal of Physical and Chemical Reference Data 1982, 11, 695–940
- Williamson et al. 2004 Williamson, A. J.; Reboredo, F. A.; Galli, G. Chemisorption on semiconductor nanocomposites: A mechanism for hydrogen storage. Applied Physics Letters 2004, 85, 2917–2919
- Wolverton and de Fontaine 1994 Wolverton, C.; de Fontaine, D. Cluster expansions of alloy energetics in ternary intermetallics. Phys. Rev. B 1994, 49, 8627–8642
- Laks et al. 1992 Laks, D. B.; Ferreira, L.; Froyen, S.; Zunger, A. Efficient cluster expansion for substitutional systems. Physical Review B 1992, 46, 12587
- Van der Ven and Ceder 2005 Van der Ven, A.; Ceder, G. Vacancies in ordered and disordered binary alloys treated with the cluster expansion. Physical Review B 2005, 71, 054102
- Semidey-Flecha and Sholl 2008 Semidey-Flecha, L.; Sholl, D. S. Combining density functional theory and cluster expansion methods to predict H 2 permeance through Pd-based binary alloy membranes. The Journal of chemical physics 2008, 128, 144701
- Papazoglou and Hepworth 1968 Papazoglou, T.; Hepworth, M. The diffusion of hydrogen in titanium. Trans Met Soc AIME 1968, 242
- Hatano et al. 2006 Hatano, Y.; Nozaki, T.; Homma, H.; Matsuyama, M. Diffusion behaviour of hydrogen in TiC: in: Annual Report of Hydrogen Isotope Research Center: Vol. 26: Toyama University. 2006
- Eberle et al. 2012 Eberle, U.; Müller, B.; von Helmolt, R. Fuel cell electric vehicles and hydrogen infrastructure: status 2012. Energy Environ. Sci. 2012, 5, 8780–8798