AGN quenching in simulated dwarf galaxies
Abstract
We examine the quenching characteristics of isolated dwarf galaxies within the Romulus25 cosmological hydrodynamic simulation. Using mock observation methods, we identify isolated dwarf galaxies with quenched star formation and make direct comparisons to the quenched fraction in the NASA Sloan Atlas (NSA). Similar to other cosmological simulations, we find a population of quenched, isolated dwarf galaxies below not detected within the NSA. We find that the presence of massive black holes (MBHs) in Romulus25 is largely responsible for the quenched, isolated dwarfs, while isolated dwarfs without an MBH are consistent with quiescent fractions observed in the field. Quenching occurs between , during which the available supply of star-forming gas is heated or evacuated by MBH feedback. Mergers or interactions seem to play little to no role in triggering the MBH feedback. At low stellar masses, , quenching proceeds across several Gyr as the MBH slowly heats up gas in the central regions. At higher stellar masses, , quenching occurs rapidly within Gyr, with the MBH evacuating gas from the central few kpc of the galaxy and driving it to the outskirts of the halo. Our results indicate the possibility of substantial star formation suppression via MBH feedback within dwarf galaxies in the field. On the other hand, the apparent over-quenching of dwarf galaxies due to MBH suggests higher resolution and/or better modeling is required for MBHs in dwarfs, and quenched fractions offer the opportunity to constrain current models.
1 Introduction
Over the past two decades, large sky surveys have found a bimodality in galaxy properties that separate actively star-forming galaxies from quiescent galaxies as far back as (Giallongo et al., 2005; Brammer et al., 2009; Willmer et al., 2006; Cassata et al., 2008; Muzzin et al., 2013; Ilbert et al., 2013). Galaxies occupy distinct regions in color-magnitude (or similarly color-color, star formation rate-mass) space, where star-forming galaxies exhibit younger, bluer stellar populations in rotation-dominated morphologies, while quiescent galaxies exhibit older, redder populations in dispersion-dominated morphologies (Strateva et al., 2001; Kauffmann et al., 2003a; Bell et al., 2003; Baldry et al., 2004; Balogh et al., 2004; Baldry et al., 2006; Wyder et al., 2007; Gallazzi et al., 2008; Ilbert et al., 2010; McGee et al., 2011; Wetzel et al., 2012; López Fernández et al., 2018).
Observations by Peng et al. (2010) have shown that galaxies may cease star formation through two distinct quenching pathways: through environmental quenching (Kauffmann et al., 2004; Baldry et al., 2004; Bahé & McCarthy, 2015) via galaxy harrassment (Feldmann et al., 2010), tidal stripping, or ram-pressure stripping (Tonnesen et al., 2007; Weinmann et al., 2009); or through mass/internal quenching (Kauffmann et al., 2003b) via, e.g, halo quenching in massive halos (Rees & Ostriker, 1977; Kauffmann et al., 1993) or starvation (Larson, 1974; Dekel & Silk, 1986) in both low- and high-mass halos. Internal quenching mechanisms also include the physical removal or heating of star-forming gas via feedback from stars and active galactic nuclei (AGN; e.g, Choi et al., 2015, 2018). The standard paradigm explains that the low-mass end of the galaxy stellar mass function is suppressed by reonization (Efstathiou, 1992; Okamoto et al., 2008; Fitts et al., 2017; Rey et al., 2019, 2020; Applebaum et al., 2021; Munshi et al., 2021) and supernova (SN) feedback (Larson, 1974; Dekel & Silk, 1986; Mori et al., 2002), while the high-mass end is regulated by AGN feedback (Binney & Tabor, 1995; Di Matteo et al., 2005; Bower et al., 2006; Croton et al., 2006; Sijacki et al., 2007; Cattaneo et al., 2008).
Among low-mass galaxies in particular, it is well-known that high-density environments may quench star formation through environmental quenching processes (e.g, van den Bosch et al., 2008; Smith et al., 2012; Wetzel et al., 2013, 2014; Weisz et al., 2015; Bahé & McCarthy, 2015; Tinker et al., 2017; Simpson et al., 2018; Akins et al., 2021; Samuel et al., 2022, though, see Emerick et al. (2016)), and indeed quenched dwarf galaxies are thought to be exceedingly rare in the field (Geha et al., 2012). Only in recent years have internal processes been observed to quench dwarf galaxies in isolation (Janz et al., 2017). It is worth noting that among the lowest mass dwarfs , there is observational evidence that cosmic reionization may have quenched low-mass dwarfs around (Weisz et al., 2014; Brown et al., 2014; Bettinelli et al., 2018, e.g,), though other work finds no such signal Monelli et al. (2010); Hidalgo et al. (2011); Skillman et al. (2017).
Observational evidence is building that suggests AGN feedback may impact star formation in dwarf galaxies (Silk, 2017). Using MaNGA observations of quenched galaxies with stellar masses , Penny et al. (2018) identify six quenched galaxies that exhibit offsets between star and gas kinematics alongside strong AGN-like ionization, indicative of star formation suppression driven by AGN feedback. Bradford et al. (2018) use unresolved H i measurements to identify a population of galaxies with quiescent star formation, gas depletion, and strong AGN-like ionization. Manzano-King et al. (2019) present the first direct detection of high velocity, AGN-driven ionized gas outflows within a sample of optically-selected dwarf galaxies with . Of these galaxies, six have AGN-like line ratios alongside outflow velocities exceeding the escape velocity of the host halo. Dickey et al. (2019) perform follow-up optical spectroscopy of the lowest-mass quiescent dwarfs known to exist in isolation, finding that of the observed quiescent dwarfs show signs of strong AGN-like line ratios. They find that the AGN fraction among isolated, quiescent galaxies is significantly higher than for quiescent dwarfs in group environments.
Some simulations and analytic models of low-mass galaxies have also begun to find that AGN feedback may have a greater impact on star formation than previously thought. By assuming standard MBH scaling relations, Dashyan et al. (2018) use analytic models to show that feedback from AGN may be even more successful than SNe in driving out gas from galaxies below a critical halo mass threshold. Using a suite of cosmological simulations run with various MBH and SN feedback models, Barai & de Gouveia Dal Pino (2019) find that gas-rich dwarf galaxies at can quench at from early AGN feedback, and only the hosts of the most massive MBHs show signatures of AGN-driven outflows. Sharma et al. (2020) explores the impact of MBHs in isolated dwarfs in Romulus25, finding that efficiently accreting MBHs are more likely than inefficient accretors to be found within diffuse, gas depleted, quiescent galaxies. Within the FABLE cosmological simulations, Koudmani et al. (2021) find that over-massive (relative to the BH mass – Mstar relation) MBHs in galaxies are able to drive hotter, faster outflows which drive material out of the host halo. They find that outflows from over-massive MBHs are strong enough to suppress star formation at high redshift, driving misalignment of the stellar and ionized gas kinematics. At , their AGN exhibit lower accretion rates on average, and SN feedback becomes the more dominant driver of star formation suppression. Using a suite of cosmological zoom simulations of a halo, Koudmani et al. (2022) find that feedback from over-massive MBHs may regulate star formation with effects ranging from minor suppression to catastrophic quenching. Their MBHs are capable of driving ejective outflows that deplete (or partially deplete) the star-forming gas reservoir. Quiescence is maintained through the AGN heating the circumgalactic medium and suppressing future cold gas accretion into the galaxy.
On the other hand, some simulations find that MBH feedback is sub-dominant to SN feedback in impacting star formation. Habouzit et al. (2017) find that SN-driven winds within low-mass SuperChunky halos can remove dense, star-forming gas, and inhibit gas accretion onto the central MBH. Koudmani et al. (2019) test various AGN and SN feedback models in high-resolution simulations of a dwarf galaxy. They find that AGN can drive hotter, higher velocity outflows in-line with results from Penny et al. (2018), but alone are unable to drive global changes in star formation. In their simulations, it is the combination of AGN feedback and SN feedback that can impact star formation.
Cosmological simulations have only in recent years achieved the resolutions and complexity to be able to accurately study quenching in galaxies at Milky Way masses and below (e.g, Kimm et al., 2015; Sanchez et al., 2021; Joshi et al., 2021; Davies et al., 2022). In the past, simulations have struggled to generate consistent fractions of quenched satellite galaxies (Font et al., 2008; Kimm et al., 2009; Weinmann et al., 2006; Hirschmann et al., 2014; Somerville & Davé, 2015). Now, simulations can better reproduce the observed bimodal distributions in star formation rate (Feldmann et al., 2017), morphology (Snyder et al., 2015), and color (Nelson et al., 2018; Akins et al., 2021). However, Dickey et al. (2021) find that large-scale cosmological simulations tend to over-predict the numbers of isolated, quiescent galaxies between . Even when accounting for observational and selection biases as well as differences in resolution, cosmological simulations tend to quench dwarf galaxies more often than observed in the optical.
In this work, we analyze the characteristics of isolated, quiescent dwarf galaxies in the Romulus25 cosmological hydrodynamical simulation. We select our sample using the mock observation process introduced in Dickey et al. (2021), allowing us to make direct comparisons with optical observations and other mock-observed simulations. In Section 2 we outline the relevant physics in the simulation, as well as the mock observation procedure used in this work. In Section 3, we explore the differences in star formation histories, stellar morphology, gas content, and gas evolution between quiescent and star-forming dwarfs between . We further investigate the quenching mechanism in our isolated dwarfs, assessing the impact of both environment and feedback effects on star formation suppression. Romulus25 is well-equipped for this analysis as one of few large-scale cosmological simulations capable of resolving the growth and dynamics of MBHs in low-mass galaxies, allowing us to accurately assess their importance to low-mass galaxy quenching.
2 Methods
2.1 Simulation
Here we summarize the relevant aspects of the Romulus25 cosmological hydrodynamical simulation. The full description of the physical prescriptions can be found in Wadsley et al. (2017); Tremmel et al. (2017).
The Romulus suite of cosmological hydrodynamic simulations were run with the Tree+SPH code ChaNGa (Menon et al., 2015; Wadsley et al., 2017). In the Romulus25 ( Mpc)3 uniform-resolution volume, dark matter particles have masses of while gas particles have masses of . Particles have a Plummer equivalent force softening of pc. Romulus25 contains more dark matter particles than gas in order to better resolve the dynamics of MBHs (Tremmel et al., 2015). Romulus25 uses a Planck 2014 CDM cosmology, with , , , and , (Planck Collaboration et al., 2014).
Star formation is governed by the star formation efficiency, SN feedback efficiency, and the gas density threshold for star formation. Star formation follows a Kroupa (2001) initial mass function. These free parameters were tuned in Tremmel et al. (2017) with a suite of zoom simulations of halos with halo masses . Star formation parameters were chosen by their ability to reproduce local scaling relationships between stellar mass, halo mass, H i gas mass, and angular momentum (Moster et al., 2013; Obreschkow & Glazebrook, 2014; Cannon et al., 2011; Haynes et al., 2011), resulting in the following star formation parameters:
-
•
Star formation efficiency ,
-
•
SN feedback efficiency ,
-
•
Gas density threshold mp cm-3.
Romulus25 also contains models for metal diffusion (Shen et al., 2010), thermal diffusion (Governato et al., 2015), and low-temperature radiative cooling (Guedes et al., 2011).
MBHs are seeded similar to a direct-collapse model (Haiman, 2013; Greene et al., 2020), using properties of local, pre-collapse gas. Gas particles form MBH seeds if they follow these criteria:
-
•
Low metallicity, ,
-
•
Gas density threshold, mp cm-3,
-
•
Temperature, K,
which were chosen to restrict BH seeding to form gas that is both collapsing rapidly and cooling slowly. These criteria approximate the seeding environments from theoretical estimates (Begelman et al., 2006; Volonteri, 2012). Once the gas particle meets these criteria, it seeds an MBH with mass , gathering mass from nearby gas particles if necessary. These criteria restrict nearly all MBH seeding to above redshift .
Dynamical friction prescriptions are employed in Romulus25 in order to realistically model MBH sinking timescales (Tremmel et al., 2015). Dynamical friction sub-grid models allow MBHs in large halos to stay centered (Kazantzidis et al., 2005; Pfister et al., 2017) without forced MBH re-centering. This prescription also allows for “wandering” MBHs, which move more freely throughout shallow potentials, as has been discovered in recent work (Bellovary et al., 2019; Reines et al., 2020; Ricarte et al., 2021b, a). The oversampling of dark matter, the high MBH seed mass, and the dynamical friction prescription together mitigate unrealistic numerical heating of MBHs, ensuring accurate MBH dynamics.
Feedback from MBHs follows a modified blastwave SN feedback model Stinson et al. (2006), where thermal energy is isotropically injected into the nearest gas particles within some time, , following:
| (1) |
where is the injected thermal energy, the radiative efficiency, the energy injection efficiency, and the MBH accretion rate. MBH accretion in Romulus25 follows a modified Bondi-Hoyle prescription that accounts for angular momentum on resolved spatial scales, while enforcing Eddington-limited accretion. Accretion is handled on the smallest simulation time resolution element, typically yr.
The free parameters for MBH accretion and feedback were tuned through an additional zoom simulations of the same halos used for star formation parameter tuning. Instead, the star formation parameters were fixed while the MBH parameters were allowed to vary in order to match the observed BH mass - stellar mass relation (Schramm & Silverman, 2013).
In this work, we use the Amiga Halo Finder (Knollmann & Knebe, 2009) to extract gravitationally bound dark matter halos, sub-halos, and their corresponding baryonic content. AHF defines the virial radius, , and virial mass, , using a spherical top-hat collapse technique. Each halo center is estimated using a shrinking spheres approach (Power et al., 2003). When discussing halo masses, we define
| (2) |
where is the cosmic critical density and is the halo radius.
2.2 Mock Observations
In order to make direct comparisons of simulation results with observations, we use the mock observation package orchard 111https://github.com/IQcollaboratory/orchard (Dickey et al., 2021). The orchard package was designed to allow direct comparisons of galaxy quenched fractions between uniform cosmological simulations and observations. By adding realistic noise and observational limits to synthetic spectra, orchard accounts for the effects of observational incompleteness, finite signal-to-noise, and imprecise distance information for galaxies in a wide-field survey. In the following sections, we outline the mock-observation procedure.
2.2.1 Synthetic Spectra
Following Dickey et al. (2021), we first generate synthetic spectra for each target galaxy using stellar population synthesis models from FSPS (Conroy et al., 2009; Conroy & Gunn, 2010) with the Python interface python-fsps (Dan Foreman-Mackey et al., 2014). When generating spectra, we use a Chabrier (2003) initial mass function to match the assumed IMF from Dickey et al. (2021). For each galaxy at , we bin the total stellar mass across a uniform grid of formation age and stellar metallicity. Formation age bins increase linearly with lookback time, , between Gyr. Metallicity bins run between with bin size at low metallicity, increasing to near . To avoid resolution effects on the most recent star formation, we calculate star formation rates (SFRs) younger than Myr using the expected instantaneous SFR from the gas particles that meet the temperature and density criteria necessary to form stars.
Nebular emission lines are calculated by FSPS within each metallicity bin using a CLOUDY lookup table (Byler et al., 2017) with gas metallicity set to the bin metallicity. We also include the effects of dust on our synthetic spectra. We use the Villaume et al. (2015) dust emission model for asymptotic giant branch stars. We use the two-component dust model from Charlot & Fall (2000), with power-law dust attenuation index and normalization . Stars younger than Myr have additional attenuation, with index and normalization . To produce a galaxy spectrum, we sum the spectra of all stellar populations in each bin of the grid, weighting by the stellar mass formed.
2.2.2 Mock Survey
We next generate a mock survey emulating SDSS observing characteristics using basic halo properties along with the synthetic spectra. The detailed steps are outlined in Dickey et al. (2021), which we summarize as follows:
-
1.
Select a random location Mpc outside the simulation volume to place a mock observer.
-
2.
Calculate apparent SDSS - and -band magnitudes, radial velocity, and projected distance for all galaxies as the observer would see them on the sky.
-
3.
Convolve each noise-free, synthetic spectrum with the SDSS instrumental line-spread profile, and resample to match the SDSS wavelength resolution and coverage. We model the line-spread profile as a Gaussian with km s-1.
-
4.
Add SDSS-like noise to each spectrum in the mock observer’s frame, using the average S/N at each wavelength found by Dickey et al. (2021). Noise is added based on galaxy color, apparent magnitude, and wavelength by drawing from a normal distribution .
- 5.
From these noise-added measurements of and EW, we are able to identify quiescent galaxies within Romulus25 as an observer might, along a given line of sight. The EW traces star formation within the past Myr, while probes long-term star formation over the past Gyr by quantifying the strength of the Å break in each noise-added spectrum (Balogh et al., 1999; Brinchmann et al., 2004). We consider a galaxy along a given sight-line to be quiescent if Å and (Geha et al., 2012).
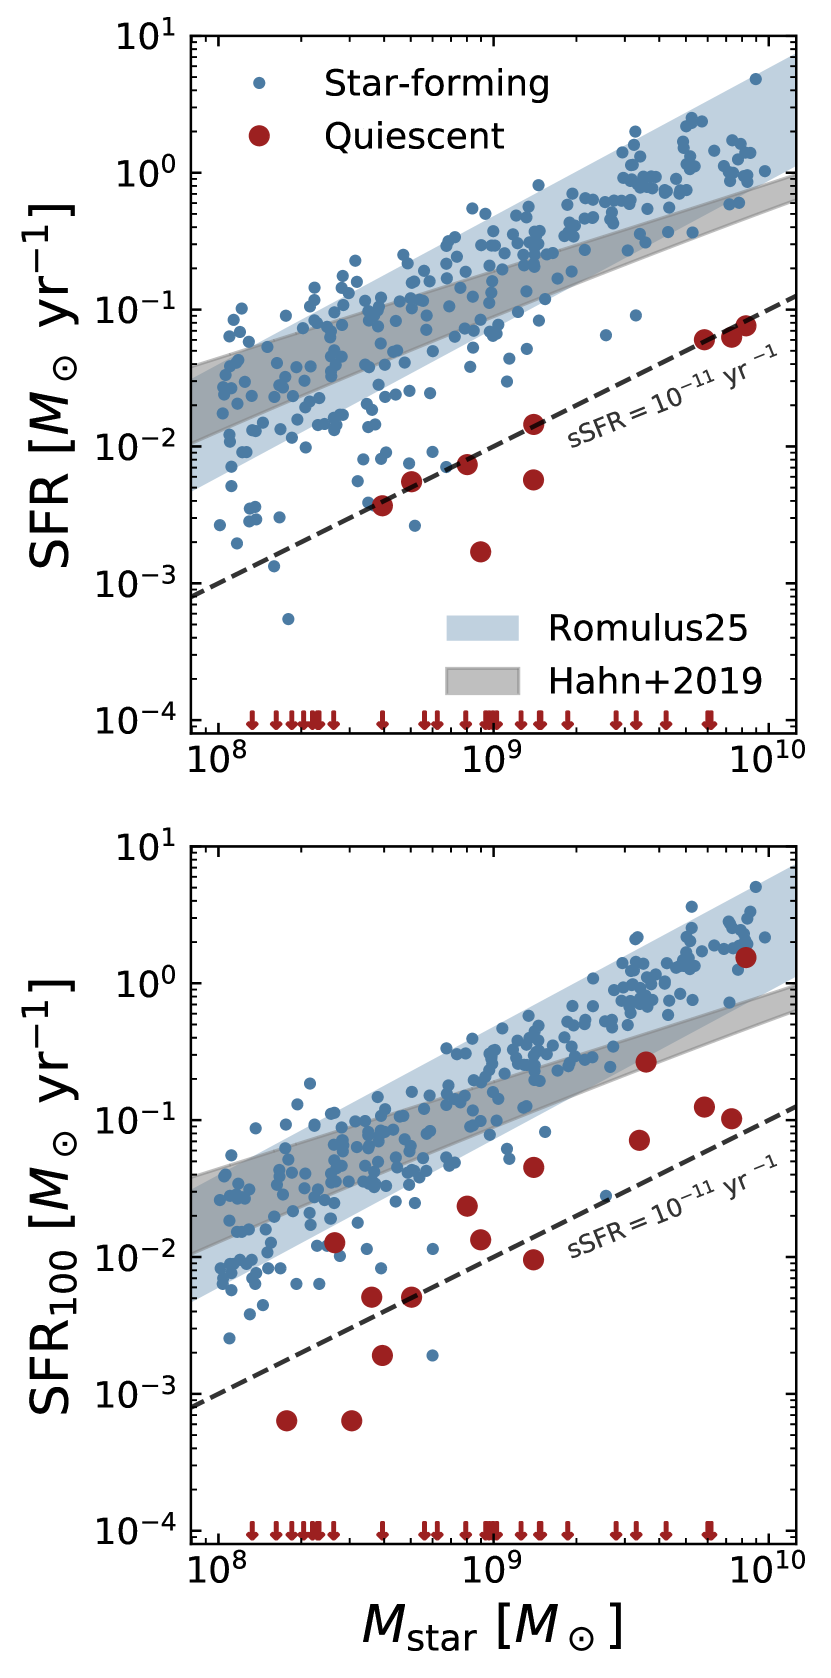
Figure 1 shows the relationship between intrinsic SFR and among the isolated dwarf galaxies in Romulus25 at (see Section 3 for further explanation). In the top panel, we calculate instantaneous SFR using the expected SFR from gas particles meeting the temperature and density thresholds for star formation. In the bottom panel, we average the SFR over the past Myr. We distinguish between galaxies identified by orchard as quiescent (red circles) versus star-forming (blue circles), where quiescence is determined indirectly from the noise-added EW and for a single sight-line. As in Dickey et al. (2021), we only show galaxies brighter than -band apparent magnitude and -band surface brightness mag arcsec-2.
Following Ricarte et al. (2019), we calculate the star formation main sequence in Romulus25 by fitting the median SFR of star-forming galaxies in dex stellar mass bins between , estimating the uncertainty with interquartile ranges. We calculate both the instantaneous SFR and Myr averaged SFR from the simulation to better compare with the SDSS-derived SFRs found in Hahn et al. (2019). They combine the SDSS DR7 massive, central galaxy sample from Tinker et al. (2011) with the NASA Sloan Atlas low-mass, isolated galaxy sample from Geha et al. (2012). Their sample spans stellar masses at (see Hahn et al. (2019) for more detail). The observations exhibit a slope of SFR. Isolated dwarf galaxies in Romulus25 exhibit a similar main sequence to the observations down to , albeit with a steeper slope, SFR for our sample.
Because our quiescent definition probes the luminosity-weighted stellar age rather than the SFR directly, there are cases of quiescent galaxies with higher average SFRs than star-forming galaxies at a given stellar mass. Regardless, we find that galaxies indirectly identified as quiescent typically fall below the main sequence, with of quiescent dwarfs exhibiting SFR yr-1 no matter how SFR is derived. Indirect identification of quiescent galaxies also tends to identify dwarfs below the commonly used specific star formation rate indicator of quiescence yr-1 (black dashed), (e.g, Wetzel et al., 2014). This tendency is particularly true when using instantaneous sSFRs, where of quiescent dwarfs fall below the instantaneous sSFR threshold, versus the of quiescent dwarfs that fall below the Myr threshold. Overall, the Romulus25 quiescent fractions shown in Section 3.1 change little when defining quiescence through either cuts on sSFR, cuts on distance from the main sequence, or through orchard.
3 Results
In order to analyze quenching properties of simulated galaxies and compare to observations, we must first make a correction to the simulated stellar masses. By comparing the stellar-to-halo mass relation from high resolution hydrodynamical simulations to abundance matching estimates, Munshi et al. (2013) find that stellar masses derived from aperture photometry tend to systematically underestimate the “true” stellar mass from simulations by around . Similarly, Dickey et al. (2021) find that stellar masses derived from colors (Mao et al., 2021) and Bell et al. (2003) mass-to-light ratios tend to underestimate the “true” stellar mass by dex. Previous studies of Romulus25 (e.g, Ricarte et al., 2019; Sharma et al., 2020) have typically used stellar mass corrections from Munshi et al. (2013). In order to stay consistent with results from Dickey et al. (2021), we calculate stellar masses throughout this work using our measured - and -band magnitudes according to Mao et al. (2021):
| (3) |
where is the absolute -band magnitude, assuming an absolute solar -band AB magnitude of (Conroy et al., 2009; Conroy & Gunn, 2010). We confirm that the stellar masses derived using this approach are consistent (within dex) with the adjusted stellar masses from previous works using Romulus25. Previous works incorporated a flat correction to the raw simulated stellar masses, as motivated by results from Munshi et al. (2013). Regardless, we find that the choice of stellar mass correction has no impact on measured quiescent fractions.
In this work we are primarily interested in dwarf galaxies between stellar masses at . This mass range is just below the regime where feedback is often thought to change from SN-dominated to AGN-dominated (e.g, Habouzit et al., 2017), as well as the regime where the MBH occupation fraction reaches unity in Romulus25 (Sharma et al., 2022).
In addition to selecting galaxies with low masses, we also set criteria on the galaxy local environment. We select isolated galaxies following Geha et al. (2012) using cuts in radial velocity and projected separation along the same single sight-line. For each target galaxy, we first identify potential massive neighbors with within an upper bound of Mpc projected distance and relative radial velocity km s-1. We consider galaxies which have no massive neighbors within projected Mpc Mpc to be isolated. Observations have found that galaxies with are nearly all star-forming at this distance from a massive galaxy (Geha et al., 2012; Rasmussen et al., 2012; Penny et al., 2016). By following the isolation criteria, we mitigate the possibility of quenching from environmental effects (however, see Section 3.4 for an analysis of the possibility of splashback galaxies).
There are times in our analysis where we distinguish between dwarf galaxies with and without central MBHs. We define central MBHs as those within kpc of the halo center. In cases where there are multiple MBHs (see e.g., Tremmel et al., 2018), we define the central MBH to be the most massive within the central kpc. Only a handful of galaxies in our sample host their most massive MBHs at large distances ( kpc) from the center.
Overall, these restrictions yield a sample of well-resolved, isolated dwarf galaxies. Table 1 provides a breakdown of the sample along the single sight-line used throughout much of this work.
| Star-forming | Quiescent | Total | |
|---|---|---|---|
| Central MBH | 117 | 34 | 151 |
| Off-center MBH | 17 | 1 | 18 |
| No MBH | 152 | 7 | 159 |
| Total | 286 | 42 | 328 |
3.1 Dwarfs with MBHs are more quiescent
We begin by examining the fraction of quiescent, isolated dwarf galaxies in Romulus25 following the methods from Dickey et al. (2021). We repeat our mock-observation process for randomly selected sight-lines outside the simulation box, remeasuring the noise-added and EW values for each galaxy and ultimately identifying detectable quiescent galaxies for each sight-line. In calculating the quiescent fraction, we weight each galaxy by the inverse of the survey volume over which the galaxy could be observed given the SDSS spectroscopic magnitude limit, . We can hence write the quiescent fraction:
| (4) |
where and are the numbers of quiescent and quiescent + star-forming galaxies in each mass bin, respectively. As in Dickey et al. (2021), we calculate the quiescent fraction for galaxies brighter than a limiting apparent magnitude of , and brighter than an -band surface brightness of mag arcsec-2. Galaxies fainter than either limit along a given sight-line are removed from the quiescent fraction calculation.
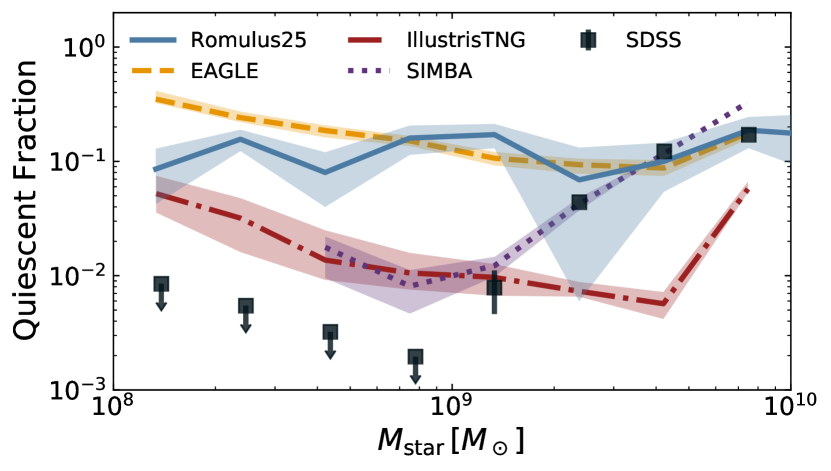
Figure 2 illustrates the quiescent fraction in Romulus25 as a function of stellar mass. We show the median across all sight-lines, with uncertainties reflecting the binomial uncertainties averaged across all sight-lines:
For comparison, we include the local quiescent fractions from the EAGLE (Schaye et al., 2015), IllustrisTNG Marinacci et al. (2018), and SIMBA (Davé et al., 2019) simulations, as calculated by Dickey et al. (2021) using orchard with the same mock-observation procedure, quiescent definition, and stellar mass definition. We also include the observed quiescent fraction from Geha et al. (2012); Dickey et al. (2021) for mass-selected dwarf galaxies within from the NASA/Sloan Atlas (Blanton et al., 2011).
Quiescent fractions in Romulus25 agree with observations down to , but over-predict the number of quiescent galaxies by when moving to lower masses. As discussed in Dickey et al. (2021), all simulations (including Romulus25) find non-zero quiescent fractions for isolated dwarfs below , in direct tension with SDSS observations. At , IllustrisTNG and SIMBA are closest with quiescent fractions , while Romulus25 and EAGLE find quiescent fractions . The weak dependence of quiescent fraction on stellar mass in Romulus25 is also most similar to EAGLE.
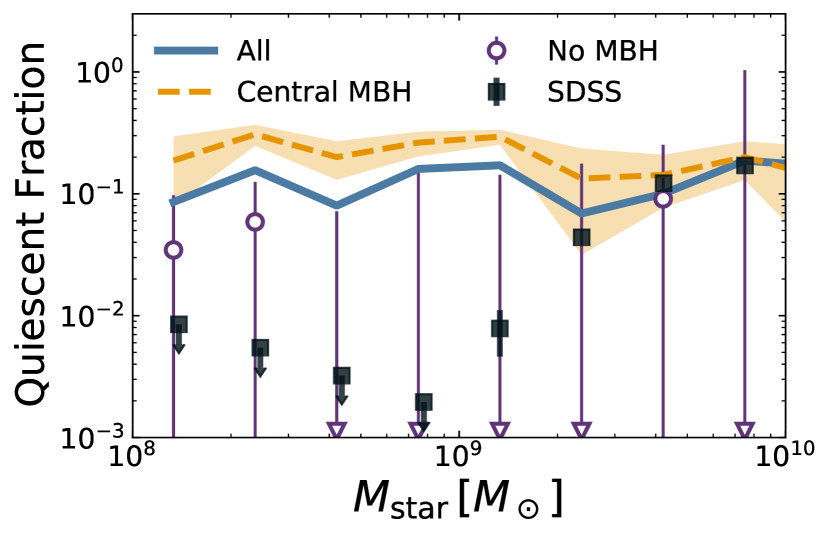
We now illustrate the effects of central MBHs on the quiescence of dwarf galaxies. As before, we run orchard across randomly chosen sight-lines, but now separate isolated dwarfs hosting a central MBH from those entirely without an MBH. We define central MBHs as the most massive within kpc of the halo center. Figure 3 shows the quiescent fraction for isolated dwarfs with central MBHs, and for those without MBHs. For comparison, we also include the observational constraints from (Dickey et al., 2021).
Isolated dwarfs with central MBHs exhibit higher quiescent fractions than dwarfs without MBHs. Among dwarfs without any MBHs, the quiescent fraction is consistent with what is observed, varying between . Among dwarfs with central MBHs, the quiescent fraction is substantially greater, varying between . The overall quiescent fraction is largely driven by the quiescent fraction among dwarfs with MBHs. As shown in Sharma et al. (2022), the MBH occupation in Romulus25 begins to drop below . Despite being more rare in dwarf galaxies, the presence of MBHs appear to correlate with quiescence down to at least .
It is worth noting that the MBH seeding mechanism and occupation fractions differ between each cosmological simulation we compare with. IllustrisTNG forms an MBH within a halo once it reaches a mass threshold (Weinberger et al., 2017). EAGLE similarly seeds MBHs in halos that reach a halo mass . SIMBA instead seeds MBHs in galaxies with (Davé et al., 2019). These cosmological simulations rarely (if ever) produce MBHs in halos at the lowest masses explored in this work. Thus, while our high quenched fractions at appear to be connected to the presence of MBHs, MBHs are unlikely to be related to the high quenched fractions in dwarfs for other simulations.
We may also ask how detectable the MBHs in our dwarf galaxies are. Results from Sharma et al. (2022) indicate that Romulus25 dwarfs often host “hidden” MBHS that are undetectable to current instrumentation. Such MBHs exhibit one or more of the following traits: low x-ray luminosities in the keV band , low luminosities relative to x-ray contaminants , and/or large distances from the halo center .
Applying the same methodology from Sharma et al. (2022) to the dwarfs in our sample, we find that quiescent dwarfs are more likely to host hidden MBHs than star-forming dwarfs, but the majority of MBHs are not hidden. Among quiescent dwarfs with MBHs in our sample, are hidden according to the criteria above, compared to the of star-forming dwarfs. In other words, the majority of MBHs found in our dwarf sample are detectable to current x-ray instrumentation.
3.2 Past growth in quiescent dwarfs
With the knowledge that the presence of MBHs correlates with quiescence, we next examine the host galaxy properties in Romulus25. In order to understand how dwarf galaxies stop forming stars, it is important to understand the gas content of these dwarf galaxies and how they evolve over cosmic time. We explore the growth histories of our dwarfs via their cumulative star formation and H i gas mass histories. We also calculate the H i and total gas fractions for star-forming and quiescent dwarfs.
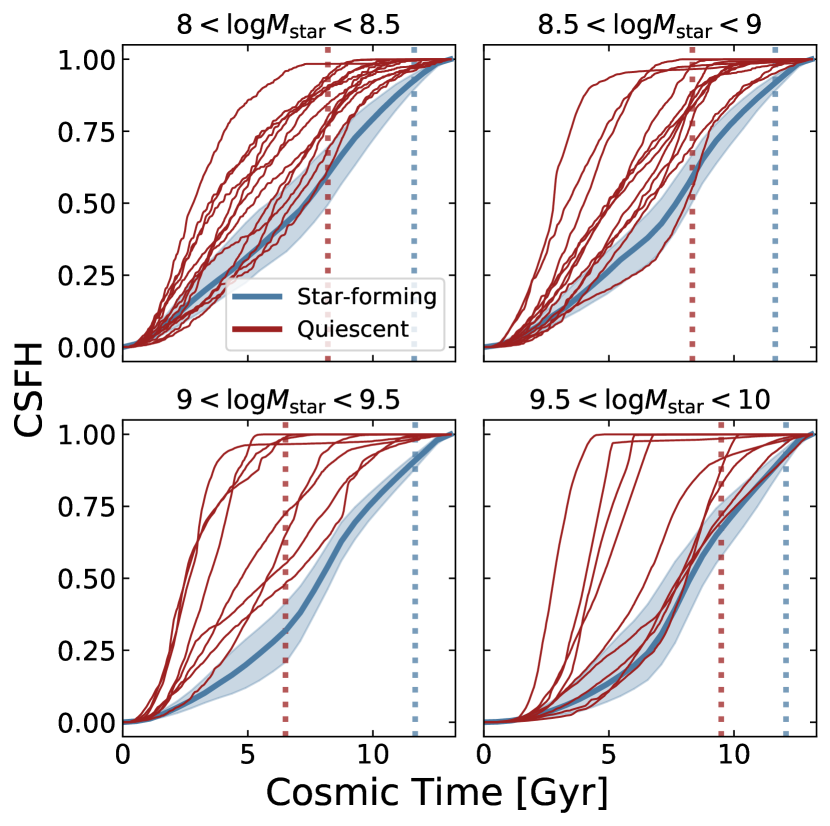
The left side of Figure 4 shows the individual cumulative star formation histories (CSFHs) across cosmic time for quiescent galaxies along with the median for star-forming galaxies. Starting from , we trace back the formation times and masses of all star particles. We divide our galaxies into bins of stellar mass at . The shaded regions mark the interquartile ranges for star-forming galaxies. In each mass bin, we mark the median value of , the cosmic time at which galaxies accumulate of their maximum stellar mass.
As expected, quiescent dwarfs of all masses tend to follow different stellar growth tracks from star-forming dwarfs. Quiescent dwarfs tend to build up their stars at early times then stop forming new stars, with median approximately Gyr ago, or redshift . Star-forming galaxies instead undergo steady formation of stars until the present day, building up their stellar component more slowly relative to quiescent galaxies. It is worth noting that not all quiescent dwarfs follow the schema of early stellar build-up then quenching – a handful build up stars more slowly and stop at late times, following a stellar evolution closer to that of star-forming galaxies.
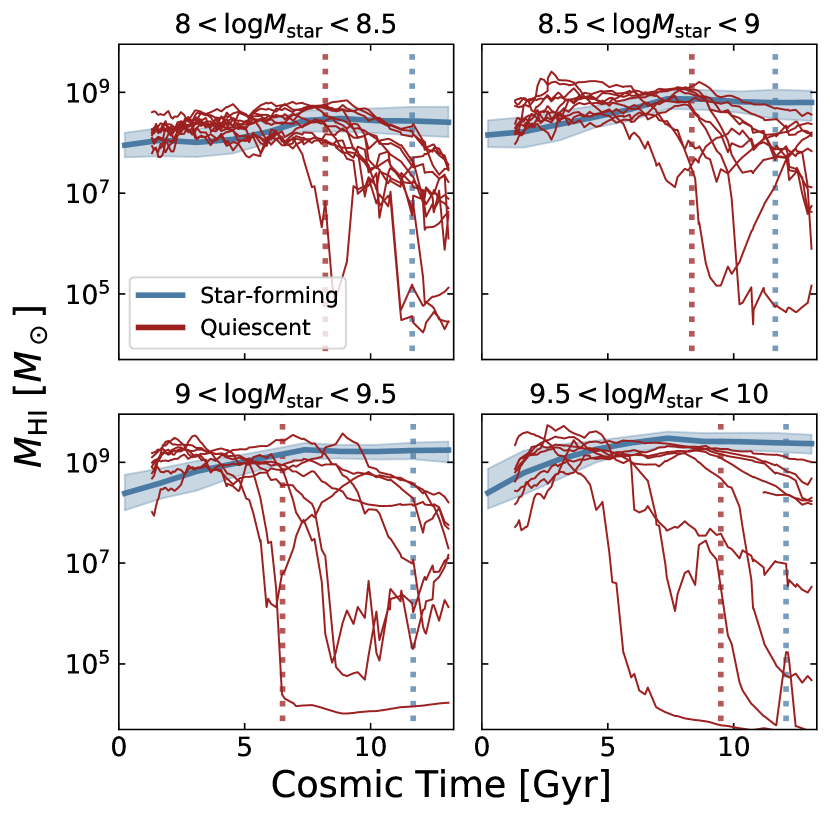
The right side of Figure 4 instead illustrates the history of across cosmic time for star-forming and quiescent galaxies, in the same stellar mass bins. Starting from , we trace back the merger tree of each target halo and identify the main progenitor within each simulation snapshot, calculating the H i gas mass along the way. We show the median and interquartile ranges for star-forming galaxies and plot individual evolutionary tracks for the quiescent galaxies. We also mark the median values of in each stellar mass bin for both quiescent and star-forming galaxies.
On average, quiescent galaxies tend to lose H i gas mass around the time of and maintain low afterward. Notably, six of the isolated dwarfs that are quiescent at underwent a single replenishment of their H i gas supply, temporarily rejuvenating low levels of star formation in the recent past.
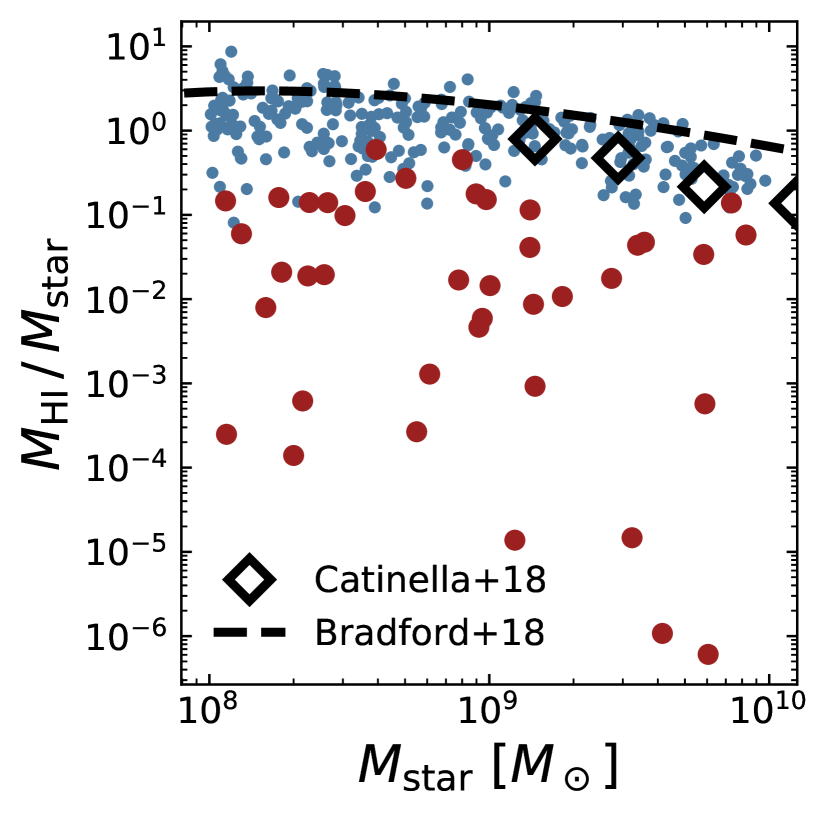
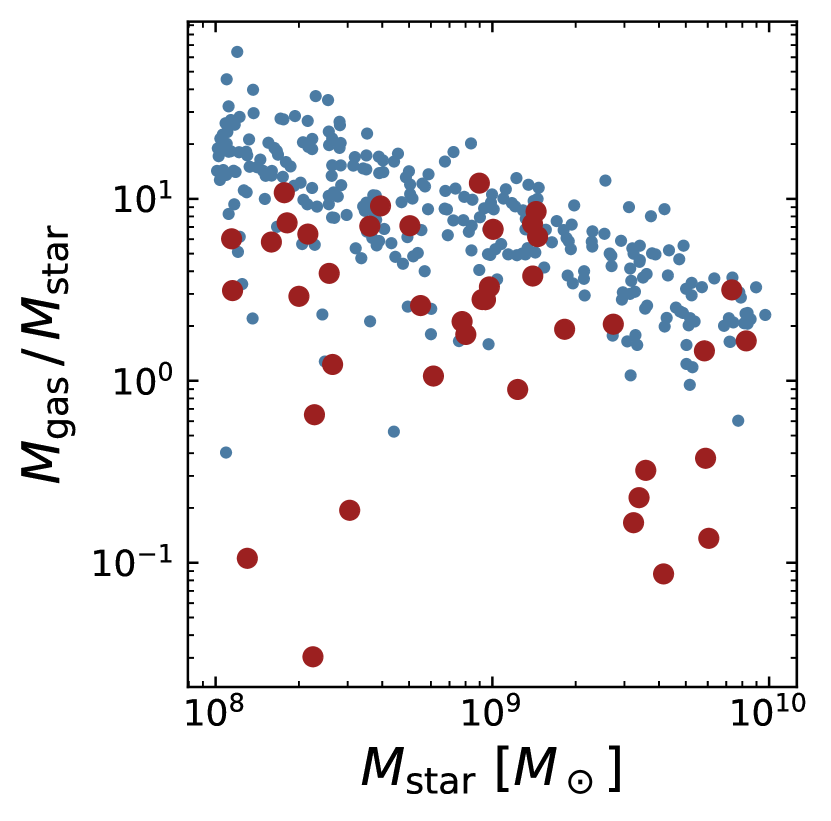
For each isolated dwarf, we next measure the neutral hydrogen gas fraction, , where is the mass of gas held in an H i component; as well as the total gas fraction, , where is the mass of all gas within the halo. Neutral hydrogen is primarily located within cool gas () and is a good tracer for the supply of star-forming gas within a galaxy.
The left panel of Figure 5 shows the H i gas fraction for isolated dwarf galaxies. We distinguish between star-forming and quiescent galaxies, and compare with observed H i gas fractions from the xGASS survey (Catinella et al., 2018) and from combined ALFALFA observations (Giovanelli et al., 2005; Haynes et al., 2011) with follow-up Arecibo observations (Bradford et al., 2018). The sample from Catinella et al. (2018) is gas-fraction limited, with galaxies selected by stellar masses between out to . The sample from Bradford et al. (2018) includes unresolved H i observations from ALFALFA along with deeper Arecibo observations of galaxies with stellar masses out to . The right panel of Figure 5 shows the total gas fraction for the same subsamples of dwarfs.
Quiescent dwarfs at all stellar masses exhibit a high degree of total gas depletion as well as dex lower abundance of cool, star-forming gas. Star-forming dwarfs instead follow the observed relations between H i gas fraction and . Depletion of H i gas is indicative of interstellar medium (ISM) heating and dispersal, while depletion of total gas indicates the ISM and circumgalactic medium are being removed from the halo entirely. The depleted H i gas fractions among quiescent dwarfs is consistent with observations which find that low specific star formation rates correlate with H i gas depletion among a sample of mass-selected, low-redshift galaxies from SDSS with H i detections from ALFALFA (Brown et al., 2015). Quiescent galaxies exhibit diminished total gas fraction, though to a lesser degree than is found among H i gas fractions. In other words, nearly all quiescent dwarfs show evidence of ISM heating, but not all quiescent dwarfs have had significant amounts of gas removed entirely from the halo. It is worth noting that the agreement of star-forming galaxies with observed relations follows from the simulation parameter tuning process (Tremmel et al., 2017), where the specific parameters controlling star formation were tuned to match H i gas fractions from SHIELD + ALFALFA (Cannon et al., 2011; Haynes et al., 2011). However, the relationship of quiescence with gas depletion is a prediction of the simulation.
Overall, these trends give insight into how our dwarf galaxies stop forming stars. Gas that may otherwise form stars is instead kept hot and/or completely driven out, while replenishing inflows of cold gas from the circumgalactic and intergalactic medium are suppressed. We examine the flow of gas more explicitly for a few cases in Section 3.5. This combination of gas “starvation” (Peng et al., 2015) and gas depletion is reminiscent of the mechanisms invoked in recent studies to explain quenching in local low-mass galaxies. Trussler et al. (2020) study the chemical properties of optically selected local galaxies with stellar masses , showing that passive star formation in their sample is likely driven by a combination of gas starvation and ejection via outflows. Bluck et al. (2020) similarly train a neural network on spatially resolved spectroscopic observations of local galaxies from MaNGA (Aguado et al., 2019), showing that global properties of central galaxies (e.g., central velocity dispersion) are more powerful predictors of spaxel-wise quiescence than even spaxel-wise properties (e.g., stellar mass surface density per IFU spaxel). They find that galaxy-wide gas starvation alongside MBH feedback are the primary source of quenching among central galaxies.
3.3 Interactions rarely lead to quenching
Before we can fully assess the impact of internal, MBH-driven processes on star formation, it is important to rule out the possibility of interactions driving the majority of quiescence. By selecting galaxies in isolation, we have mitigated (but not eliminated) the effects of environmental quenching on our dwarfs. We first ask how quenching compares among dwarfs in isolation relative to those with neighbors.
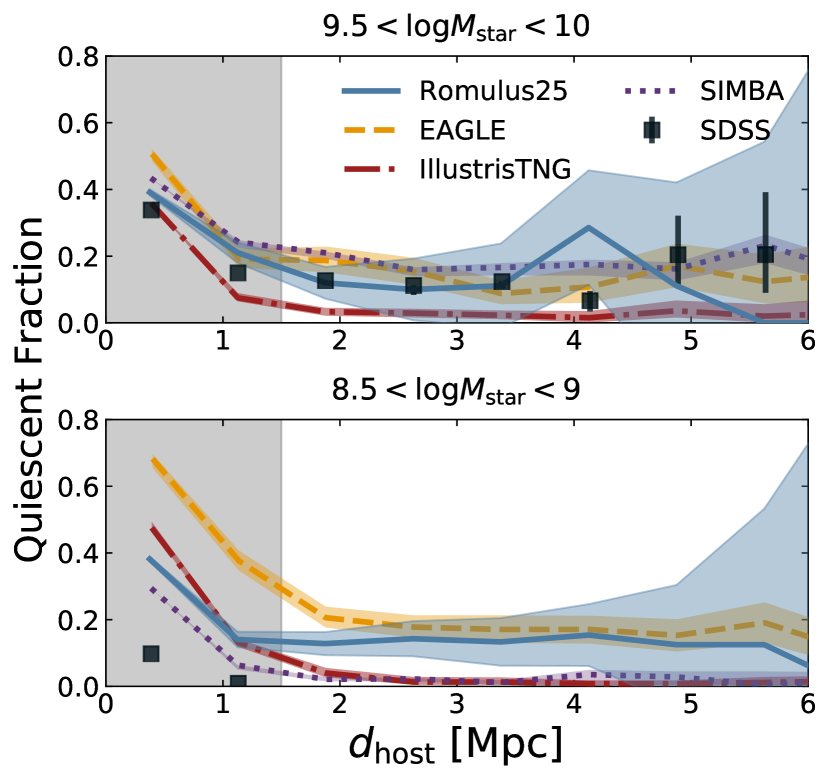
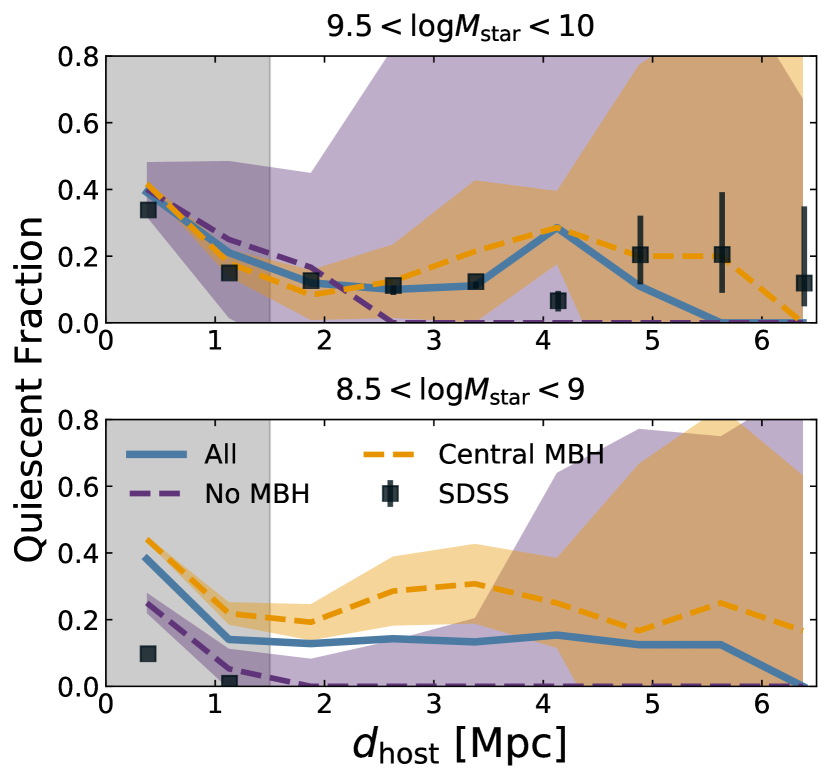
In Figure 6, we show the quiescent fraction at as a function of distance to the nearest host, . As in Dickey et al. (2021), we separate galaxies into two stellar mass bins: just below the Geha et al. (2012) quenching threshold , and just above . As before, we show the median across all sight-lines and compare with results from other cosmological simulations as well as SDSS observations.
Similar to other simulations, both quiescent isolated and quiescent non-isolated galaxies in Romulus25 are produced in excess relative to SDSS observations. In the higher mass bin, Romulus25, EAGLE, and SIMBA produce quiescent fractions consistent with SDSS for Mpc, though most simulations slightly overproduce quiescent galaxies for Mpc. In the lower mass bin, however, all simulations produce too many quiescent non-isolated galaxies, to varying degrees. In particular, Romulus25 yields non-isolated quiescent fractions between , substantially higher than the found in SDSS. It is possible that the mechanism responsible for quenching isolated galaxies in the simulations is also impacting quenching in dense environments, and may explain the over-production of low-mass quiescent dwarfs in dense environments.
We may also ask how quiescence varies for dwarfs with and without MBHs as a function of environment. Figure 7 shows the quiescent fraction as a function of distance to the nearest massive neighbor, distinguishing between dwarfs with central MBHs and those without MBHs. As in Figure 6, we split high- and low-mass dwarfs.
High-mass dwarfs with central MBHs tend to follow observed quiescent fractions in both the group and field environments. High-mass dwarfs without MBHs follow observed quiescent fractions in group environments, though drop more rapidly with than observations. On the other hand, low-mass dwarfs with central MBHs tend to over-predict the quiescent fraction in both the group and field environments. As seen earlier, dwarfs with central MBHs drive much of the discrepancy between Romulus25 and observed quiescent fractions, and indeed low-mass dwarfs without MBHs show much closer agreement with observations.
It is important to note that there are cases of splashback (e.g, Tinker et al., 2017) in our sample, where a galaxy that is currently isolated was within close proximity of a larger halo in the past. By tracing back each target halo’s interaction history, we identify times where the target halo first fell within the radius of a more massive halo, and compare these to the quenching times, .
Overall, we find that splashback is unlikely to play a major role in quenching our dwarf galaxy sample. Of the galaxies in our sample, have undergone splashback in the past. Approximately of splashback galaxies are quiescent, only slightly higher than the of non-splashback galaxies that are quiescent. Conversely, of quiescent galaxies are splashback, only slightly higher than the of star-forming galaxies that are splashback. The number of splashback galaxies is dependent on stellar mass, where dwarfs below make up of splashback galaxies. Still, these lower mass dwarfs show similar quiescent fractions between those that are splashback and non-splashback .
These splashback results are in line with findings from recent zoom cosmological simulations, which have found that low-mass satellites continue forming stars for Gyr after infall into the host halo (Akins et al., 2021), while higher mass satellites typically never fully quench (Akins et al., 2021; Samuel et al., 2022). While a small number of our isolated dwarfs likely quench due to splashback, the majority do not.
Finally, we determine whether mergers are the primary mode by which quiescence was catalyzed. Mergers are thought to dissipate gas angular momentum, channeling gas and driving quenching via a starburst (e.g, Wild et al., 2009, 2016) or AGN activity (e.g, Hopkins et al., 2006, 2008). We climb each target halo’s merger tree backward in time in search of cases where the next, earlier snapshot contains more than one progenitor. We restrict our search to mergers with halo mass ratios at the snapshot time. Identifying mergers in this way misses the effects of minor progenitors that become stripped over time, but captures the effects of major mergers. The merger time, , is then the cosmic time of the snapshot containing only the descendent of the merger. As in McAlpine et al. (2020), we define the dynamical time in terms of the cosmic critical density, ,
| (5) |
and identify dwarfs that underwent mergers within one dynamical time of the quenching time, .
Mergers are unlikely to be the primary mechanism by which quenching is initiated. Only of quiescent dwarfs have undergone significant mergers within one dynamical time of , similar to the of star-forming dwarfs. Relaxing our criteria, we find that of quiescent dwarfs have undergone a merger within two dynamical times of quenching, similar to the of star-forming dwarfs. Evidently, mergers are not a hard requirement to initiate quenching of isolated dwarf galaxies.
3.4 Internal processes can quench isolated dwarfs
Turning now to the precise effects of feedback, we calculate the integrated energy injection from both MBHs and Type II supernovae (SNe II) into the surrounding ISM. There is precedent for exploring the underlying energetics of AGN in relation to quenching. Using high resolution cosmological simulations of a halo, Pontzen et al. (2017) showed that galaxy quenching is related to a greater contribution from MBH activity to the total energy injected. Similarly, Dashyan et al. (2018) use analytic models of AGN energetics to show that large regions of the AGN efficiency – lifetime parameter space in dwarf galaxies are more favorable to AGN-driven gas removal versus SNe-driven removal.
Dashyan et al. (2018) use analytic models to show that feedback from AGN may be even more successful than SNe in driving out gas from galaxies below a critical halo mass threshold.
Within Romulus25, the integrated energy injected into the surrounding gas by SNe II is directly related to the number of SNe II that have detonated within the galaxy, . Although other types of SNe are implemented, we ignore the effects of Type Ia SNe since they do not drive large-scale blastwave feedback in Romulus25 (Stinson et al., 2006). Since the timing of the SNe II depends on the mass of the stellar progenitor, integrating over the IMF provides the number of stars that will explode within a given star particle, where only stars between are allowed to detonate as SNe II (Stinson et al., 2006). Each SNe II event injects the same amount of energy into the surrounding gas, (Tremmel et al., 2017). The integrated SNe energy injection can then be written:
| (6) |
The energy injected by the MBH into the surrounding ISM is directly related to the accretion rate, , via the radiative efficiency, , and the gas coupling efficiency, (Tremmel et al., 2017). The integrated MBH energy injection can then be written:
| (7) |
where the accretion is assumed to be constant throughout one MBH simulation timestep, .
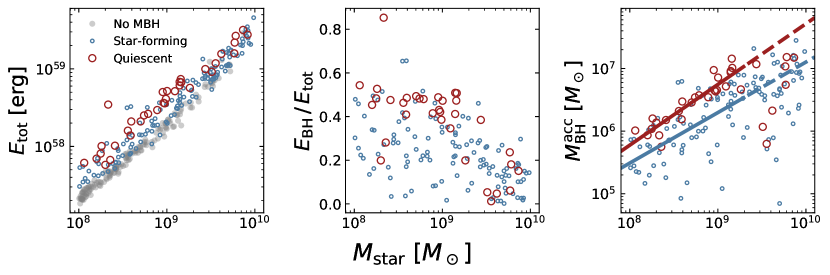
The left panel of Figure 8 shows the total energy injected into each dwarf’s ISM, , as a function of stellar mass, where we distinguish between quiescent and star-forming dwarfs with central MBHs, and dwarfs entirely without MBHs. Since the number of SNe II events scales directly with number of star particles, is closely tied to the stellar mass of the galaxy. Hence at fixed stellar mass, the difference between dwarfs without MBHs and those with central MBHs is largely due to energy injection from the MBH.
The MBH energy injection is seen in more detail in the center panel of Figure 8, where we instead show the fractional contributions of MBHs to the total energy injected, . Here, we only include dwarfs with central MBHs. Among dwarfs with , the fraction of the energy budget attributable to MBHs is higher in quiescent dwarfs than in star-forming dwarfs. Above , dwarfs shift to strongly SNe-dominated, with little difference in energy injection between quiescent and star-forming galaxies.
The latter behavior is slightly different than results from Pontzen et al. (2017), who study cosmological simulations of a halo at . They find that the total energy injection from feedback is comparable between MBHs+SNe runs and SNe-only runs of their halo, despite quenching only occurring in the MBH+SNe runs. However, they find that in cases where the halo quenches. In contrast, our lower mass dwarfs with MBHs have slightly enhanced , and only of all quiescent dwarfs and of all star-forming dwarfs exhibit . Evidently, MBHs only need to contribute a significant amount of energy in order to quench, and do not necessarily need to dominate the energy budget. The importance of MBH energy injection in suppressing star formation is in agreement with results from Piotrowska et al. (2022), who study the quenching mechanisms in central galaxies in the EAGLE, Illustris, and IllustrisTNG cosmological simulations. Using a random forest classifier, they find that classification of a galaxy as star-forming or quiescent is most closely tied to the integrated accretion history of the central MBH. However, as discussed in Section 3.1, the other simulations considered in this work do not seed MBHs in galaxies below . (Dickey et al., 2021) find that the over-production of low-mass quenched dwarfs in these other simulations is instead due to either environmental effects, feedback from SNe, or outflows from nearby massive galaxies.
As discussed above, the energy injection from SNe II and MBHs are closely related to the stellar mass and accreted MBH mass, respectively. The right panel of Figure 8 shows the relation for our isolated dwarf sample with central MBHs. Linear fits to the relation for quiescent and star-forming galaxies below indicate that quiescent dwarfs host MBHs more massive than the MBHs in corresponding star-forming dwarfs. This phenomenon is directly in-line with results from Sharma et al. (2020), which found that over-massive MBHs are related to star-formation suppression and gas depletion in Romulus25 dwarf galaxies. However, this behavior breaks down for galaxies above , where three quiescent galaxies in fact host under-massive MBHs. The quenching mechanism for dwarfs above and below clearly differ, and will require closer inspection.
3.5 Case Studies
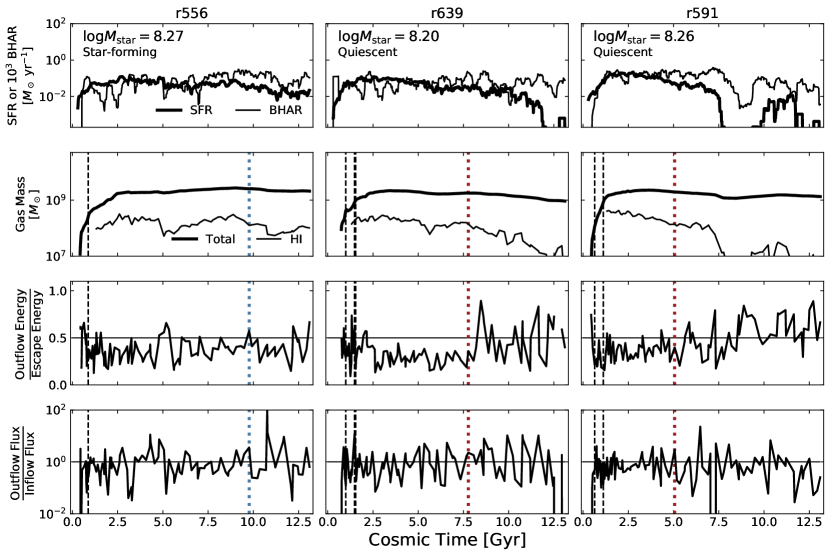
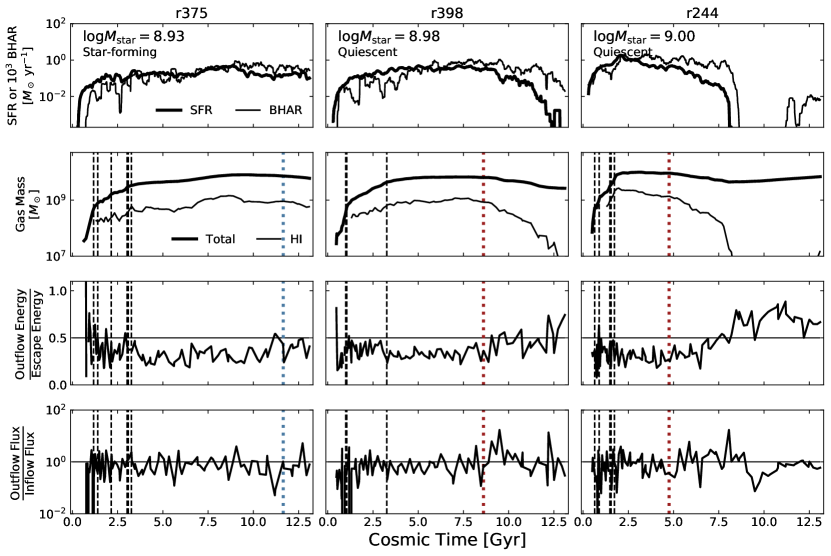
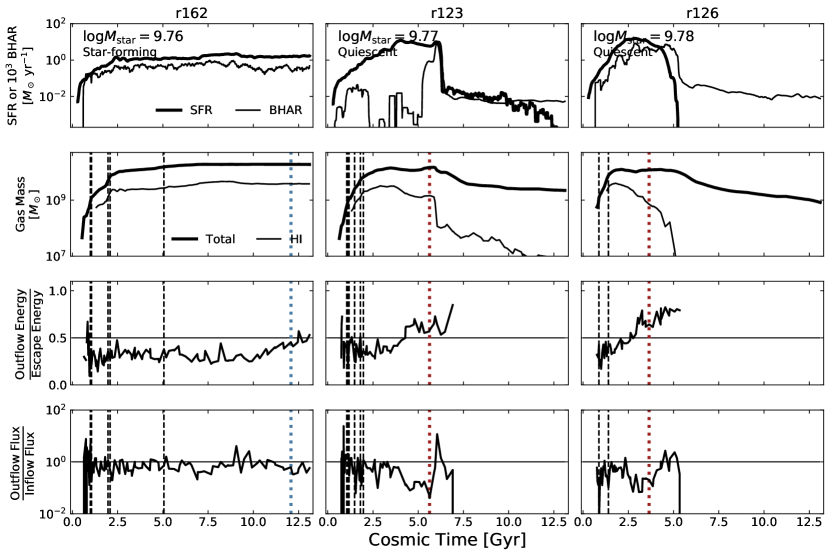
We now more closely examine the histories of gas mass, star formation, and MBH accretion for nine dwarfs as a way to understand the differences in quenching mechanisms. We divide our stellar mass range of interest into three bins, , and randomly select one star-forming dwarf from each bin. For each star-forming galaxy, we select two quiescent galaxies with stellar masses within dex.
For each dwarf at , we trace the main halo progenitor backward in time through all available simulation snapshots. At each snapshot we record: the mass held within gas particles as well as the mass within the H i component; the inflowing/outflowing mass flux and energy of gas flowing across a kpc thick shell of radius ; and the energy required for gas to escape the gravitational potential from out to . We also identify the total SFR for the stars within the dwarf at , and the accretion rate of the central MBH, which are output at finer time resolution. These quantities may yield insight into how the timing of MBH activity affects gas kinematics and ultimately star formation.
Studies connecting outflows and quenching within simulations have been done in the past. (Pontzen et al., 2017) and (Sanchez et al., 2021) study properties of AGN outflows in massive galaxies, finding a strong connection between energetic outflows and galaxy quenching. Within the galaxy cluster environment, Tremmel et al. (2019) and Chadayammuri et al. (2021) find that large scale, AGN-driven outflows regulate gas cooling onto the brightest cluster galaxy, quenching star formation. Koudmani et al. (2021) use the FABLE cosmological simulations to show that dwarf galaxies with energetic, MBH-driven outflows tend to exhibit reduced gas mass fractions and contribute to dwarf quenching at high redshift.
Figures 9, 10, and 11 show case studies for dwarfs in each of the three mass bins. In each figure, the top row traces SFR and MBH accretion rate across time. The second row traces the total gas mass and H i gas mass across time. The third row tracks the ratio of outflow gas energy to the escape energy (Pontzen et al., 2017), where we define the outflow energy:
| (8) |
with gas particle mass, gas internal energy, and gas radial velocity. We also define the escape energy:
| (9) |
for spherically averaged potential, at radius .
Dwarfs at low masses quench slowly over several Gyr. The supply of star-forming gas is slowly used up or heated by both the central MBH and star formation. Although the outflow energetics indicate a quick increase in outflow energy following quenching, there are no coherent outflows that consistently drive gas outward across this radius. Further, H i mass decreases over time while the total gas mass remains constant or slowly decreasing, suggesting that the quenching mechanism struggles to physically remove gas but can suppress cooling. Along with the fact that MBH activity continues after quenching, together these suggest that quenching for low-mass dwarfs is driven by gas heating induced by the combination of star formation and MBH activity. The quenched status is maintained by continued MBH feedback. At early times, the galaxy is able to accrete and cool gas, allowing star formation and MBH accretion to proceed until the point that heating from the MBH overwhelms ISM cooling.
Dwarfs at high masses instead quench explosively (see Figure 11), similar to what is thought to occur in more massive galaxies (Hopkins et al., 2005; Ishibashi & Fabian, 2016). High mass dwarfs tend to quench within a short period of time , with a period of rapid gas inflow driving fast MBH accretion, which in turn heats up gas and drives it outward across . In the case of r123, both MBH accretion and star formation drop quickly but maintain low levels. Star formation in r126 instead drops and stays at zero at the time of quenching, while the MBH continues to accrete at low levels. In both cases, nearly all of the gas is swept up and driven outside of . But the outflow energies indicate the gas is not able to fully escape the halo, and instead it is kept hot in the outskirts of the halo. The impact of the central MBH on the outskirts of the halo is in stark contrast with zoom simulation results from Sanchez et al. (2019, 2021), which find that MBHs in Milky Way-mass halos can drive large outflows from the disk, but are not able to drive changes in gas content in the circumgalactic medium. They find that MBH-induced outflows are able to transport metals to the outskirts, but do not strongly impact the temperature and densities of gas far from the halo center.
Dwarfs at intermediate masses make up a middle ground between slow and and fast quenching (see Figure 10); r398 quenches slowly over time in a way more reminiscent of the lower mass dwarfs, while r244 quenches rapidly more akin to higher mass dwarfs. These dwarfs appear to exist at a critical mass where quenching changes from the explosive “blow-outs” found among massive galaxies to the slow heating found in lower mass dwarfs.
Note that in all of these mass bins, the star-forming cases also contain an MBH. Although hosting a central MBH is typically necessary to quench a dwarf galaxy in these simulations, it is not alone sufficient in order to quench. The MBH needs to be hosted within an environment where it can accrete efficiently. In lower mass dwarfs, the MBH must undergo sustained accretion for long periods of time. To get complete quenching in higher mass dwarfs, the MBH must rapidly accrete a large amount of gas. Although mergers might help in funneling large amounts of gas toward the galaxy center, mergers are not necessary for driving quenching, even among these higher mass dwarfs.
4 Caveats
As discussed in Sharma et al. (2020), the primary caveat when analyzing MBHs in Romulus25 is the large seed mass of MBHs ( M⊙) relative to analytic estimates for direct-collapse seeding (Haiman, 2013). MBHs are seeded at these relatively large masses to better resolve their dynamics within the simulation (Tremmel et al., 2017). However, the Bondi-Hoyle accretion prescription scales with MBH mass which, if the MBH mass is already over-large to begin with, may drive unrealistic accretion onto the MBH. Indeed, Sharma et al. (2020) finds that overmassive MBHs in Romulus25 tend to lie at higher masses than expected from observational constraints of the relation.
Similarly, the Bondi-Hoyle accretion prescription, which appears to work for massive galaxies, may not apply to low-mass galaxies. Sharma et al. (2022) find that Romulus25 is able to reproduce observed relationships between AGN luminosity, SFR, and stellar mass among dwarf AGN, but the simulation also produces too many bright dwarf AGN relative to observations. Instead, a two-mode accretion model (Churazov et al., 2005) with a dependence on mass or Eddington fraction that allows for similar amounts of growth but with a lower seed mass may better match observations of the AGN fraction.
In this work, we push down to the lowest resolvable scales in Romulus25 in order to capture both MBH physics and quenching physics in dwarf galaxies. It is possible that our results are affected by numerics at the lowest dwarf masses, where the lower resolutions lead to fluffier, low resolution gas that is more susceptible to feedback. Note, however, that related analyses by Dickey et al. (2021) indicate that resolution effects may not fully explain the discrepancy in quiescent fractions between simulations and observations below . They find the discrepancy in quiescent fraction compared to observations is still present when recalculating their results for the smaller, higher-resolution runs of EAGLE (moving from the Mpc to the Mpc boxes) and SIMBA (moving from the Mpc to the Mpc box). Depending on the simulation, moving to higher-resolution runs either decreased or increased the discrepancy, but never eliminated it. It is hence also possible that running higher resolutions of Romulus25 would still not solve the discrepancy in quiescent fractions.
As discussed in Ricarte et al. (2019), Romulus25 is one of several state-of-the-art cosmological simulations which have found that mergers are not the primary mode by which low- and intermediate-luminosity AGN are triggered (Martin et al., 2018; McAlpine et al., 2018, 2020; Steinborn et al., 2018). Results for Romulus25 indicate that quenching progresses through sustained growth of the stellar and MBH components. However, high-resolution simulations suggest that MBH assembly may depend dramatically on resolution (Anglés-Alcázar et al., 2017) – Romulus25 may not resolve MBH accretion of small-scale, high-density gas brought in through mergers. Higher resolution zoom cosmological simulations may be required to fully disentangle the effects of numerics on MBH growth through mergers, MBH feedback, and dwarf galaxy quenching.
All in all, it is likely that the AGN in Romulus25 quench isolated dwarf galaxies too efficiently, though it is unclear to what extent. While Romulus25 can reproduce local scaling relations, the resolution and/or physical prescriptions likely do not capture the true nature of accretion and feedback in low-mass galaxies. On the other hand, as shown in Dickey et al. (2021), other cosmological simulations without MBHs in dwarfs still exhibit an overabundance of isolated, quenched dwarfs. Evidently there is a need for higher resolution simulations with an emphasis on MBH growth and feedback in the lowest mass galaxies.
5 Conclusion
We analyze quenching among isolated dwarf galaxies in the Romulus25 cosmological hydrodynamic simulation, which uniquely seeds MBHs in resolved, low mass galaxies in the early Universe. Using the mock observation package orchard, we generate mock sight-lines through the simulation box in order to measure quiescence as an observer would define it. This method allows us to make direct comparisons with observations and other mock-observed simulations from Dickey et al. (2019). We find that:
-
•
Similar to other large-scale cosmological simulations, Romulus25 predicts a greater number of isolated, quiescent dwarfs with stellar masses below at than is observed (Figure 2). As seen in Figure 3, this discrepancy is largely explained by the presence of dwarfs with central MBHs, which exhibit times higher quiescent fractions relative to dwarfs without MBHs.
-
•
Quiescent dwarfs form their stars then quench around , as seen in Figure 4, though the precise quenching time depends on stellar mass.
-
•
Quenching is strongly associated with energy injection into the ISM by MBHs, as seen in Figure 8. Figures 4 and 5 indicate that, by , quiescent dwarfs have significantly less HI gas, as well as less total gas, than star-forming dwarfs. Quiescent dwarf galaxies are more likely to host an MBH that has accreted more mass over cosmic time, thereby releasing more energy in the form of AGN feedback.
-
•
Dwarf galaxies across two dex in stellar mass quench at the onset of energetic black hole outflows, similar to what is seen in more massive galaxies (Pontzen et al., 2017; Tremmel et al., 2019; Sanchez et al., 2021). The most massive dwarfs in our sample (M M⊙) experience rapid blowout events that significantly decrease the overall gas content of the halo. Lower mass dwarfs (below M⊙), on the other hand, experience a more gradual quenching process with continuous black hole activity and outflows with less extreme changes to their halo gas content.
Our simulated dwarf galaxies, along with a slew of recent observational results (e.g. Silk, 2017; Bradford et al., 2018; Penny et al., 2018; Dickey et al., 2019; Manzano-King et al., 2019), support the idea that AGN feedback may be an important ingredient to dwarf galaxy evolution. It is likely that a large number of dwarfs host an MBH (e.g. Baldassare et al., 2020) and it is already known that dwarf galaxies can be an important laboratory to constrain MBH formation (Volonteri & Natarajan, 2009; Volonteri, 2012; Greene, 2012). In this work we showed the crucial impact of MBHs in creating a population of quenched, isolated dwarf galaxies. This demonstrates that low mass galaxies may also provide crucial constraints on the nature of AGN feedback. Modern cosmological simulations include a variety of different models for AGN feedback, yet these models are often created and optimized with massive galaxies in mind. The ability to model MBHs in dwarf galaxies and test against observations at low mass can provide a new way to constrain these models. Higher resolution simulations which we will perform in future work will provide even more insight into the detailed interactions between MBHs and the ISM of dwarf galaxies while new implementations of AGN feedback will be tested against observed dwarfs, as well as high mass galaxies.
6 Acknowledgements
This material is based on work supported by the National Science Foundation under grant No. NSF-AST-1813871. MT is supported by an NSF Astronomy and Astrophysics Postdoctoral Fellowship under award AST-2001810. JMB acknowledges support from NSF AST-1812642. Romulus25 is part of the Blue Waters sustained-petascale computing project, which is supported by the National Science Foundation (awards OCI-0725070 and ACI-1238993) and the state of Illinois. Blue Waters is a joint effort of the University of Illinois at Urbana-Champaign and its National Center for Supercomputing Applications. Romulus25 initial conditions and preliminary analysis used the Extreme Science and Engineering Discovery Environment (XSEDE), which is supported by National Science Foundation grant number ACI-1548562. RSS would like to thank Nicole Sanchez, Claire Dickey, and Tjitske Starkenburg for helpful conversations and data from private communications.
References
- Aguado et al. (2019) Aguado, D. S., Ahumada, R., Almeida, A., et al. 2019, The Astrophysical Journal Supplement Series, 240, 23, doi: 10.3847/1538-4365/aaf651
- Akins et al. (2021) Akins, H. B., Christensen, C. R., Brooks, A. M., et al. 2021, The Astrophysical Journal, 909, 139, doi: 10.3847/1538-4357/abe2ab
- Anglés-Alcázar et al. (2017) Anglés-Alcázar, D., Faucher-Giguère, C. A., Quataert, E., et al. 2017, MNRAS, 472, L109, doi: 10.1093/mnrasl/slx161
- Applebaum et al. (2021) Applebaum, E., Brooks, A. M., Christensen, C. R., et al. 2021, The Astrophysical Journal, 906, 96, doi: 10.3847/1538-4357/abcafa
- Bahé & McCarthy (2015) Bahé, Y. M., & McCarthy, I. G. 2015, Monthly Notices of the Royal Astronomical Society, 447, 969, doi: 10.1093/mnras/stu2293
- Baldassare et al. (2020) Baldassare, V. F., Geha, M., & Greene, J. 2020, The Astrophysical Journal, 896, 10, doi: 10.3847/1538-4357/ab8936
- Baldry et al. (2006) Baldry, I. K., Balogh, M. L., Bower, R. G., et al. 2006, Monthly Notices of the Royal Astronomical Society, 373, 469, doi: 10.1111/j.1365-2966.2006.11081.x
- Baldry et al. (2004) Baldry, I. K., Glazebrook, K., Brinkmann, J., et al. 2004, The Astrophysical Journal, 600, 681, doi: 10.1086/380092
- Balogh et al. (2004) Balogh, M. L., Baldry, I. K., Nichol, R., et al. 2004, The Astrophysical Journal, 615, L101, doi: 10.1086/426079
- Balogh et al. (1999) Balogh, M. L., Morris, S. L., Yee, H. K. C., Carlberg, R. G., & Ellingson, E. 1999, The Astrophysical Journal, 527, 54, doi: 10.1086/308056
- Barai & de Gouveia Dal Pino (2019) Barai, P., & de Gouveia Dal Pino, E. M. 2019, Monthly Notices of the Royal Astronomical Society, 487, 5549, doi: 10.1093/mnras/stz1616
- Begelman et al. (2006) Begelman, M. C., Volonteri, M., & Rees, M. J. 2006, Monthly Notices of the Royal Astronomical Society, 370, 289, doi: 10.1111/j.1365-2966.2006.10467.x
- Bell et al. (2003) Bell, E. F., McIntosh, D. H., Katz, N., & Weinberg, M. D. 2003, The Astrophysical Journal Supplement Series, 149, 289, doi: 10.1086/378847
- Bellovary et al. (2019) Bellovary, J. M., Cleary, C. E., Munshi, F., et al. 2019, Monthly Notices of the Royal Astronomical Society, 482, 2913, doi: 10.1093/mnras/sty2842
- Bettinelli et al. (2018) Bettinelli, M., Hidalgo, S. L., Cassisi, S., Aparicio, A., & Piotto, G. 2018, Monthly Notices of the Royal Astronomical Society, 476, 71, doi: 10.1093/mnras/sty226
- Binney & Tabor (1995) Binney, J., & Tabor, G. 1995, Monthly Notices of the Royal Astronomical Society, 276, 663, doi: 10.1093/mnras/276.2.663
- Blanton et al. (2011) Blanton, M. R., Kazin, E., Muna, D., Weaver, B. A., & Price-Whelan, A. 2011, The Astronomical Journal, 142, 31, doi: 10.1088/0004-6256/142/1/31
- Bluck et al. (2020) Bluck, A. F. L., Maiolino, R., Piotrowska, J. M., et al. 2020, Monthly Notices of the Royal Astronomical Society, 499, 230, doi: 10.1093/mnras/staa2806
- Bower et al. (2006) Bower, R. G., Benson, A. J., Malbon, R., et al. 2006, Monthly Notices of the Royal Astronomical Society, 370, 645, doi: 10.1111/j.1365-2966.2006.10519.x
- Bradford et al. (2018) Bradford, J. D., Geha, M. C., Greene, J. E., Reines, A. E., & Dickey, C. M. 2018, The Astrophysical Journal, 861, 50, doi: 10.3847/1538-4357/aac88d
- Brammer et al. (2009) Brammer, G. B., Whitaker, K. E., van Dokkum, P. G., et al. 2009, The Astrophysical Journal, 706, L173, doi: 10.1088/0004-637X/706/1/L173
- Brinchmann et al. (2004) Brinchmann, J., Charlot, S., White, S. D. M., et al. 2004, Monthly Notices of the Royal Astronomical Society, 351, 1151, doi: 10.1111/j.1365-2966.2004.07881.x
- Brown et al. (2015) Brown, T., Catinella, B., Cortese, L., et al. 2015, Monthly Notices of the Royal Astronomical Society, 452, 2479, doi: 10.1093/mnras/stv1311
- Brown et al. (2014) Brown, T. M., Tumlinson, J., Geha, M., et al. 2014, The Astrophysical Journal, 796, 91, doi: 10.1088/0004-637X/796/2/91
- Byler et al. (2017) Byler, N., Dalcanton, J. J., Conroy, C., & Johnson, B. D. 2017, The Astrophysical Journal, 840, 44, doi: 10.3847/1538-4357/aa6c66
- Cannon et al. (2011) Cannon, J. M., Giovanelli, R., Haynes, M. P., et al. 2011, The Astrophysical Journal, 739, L22, doi: 10.1088/2041-8205/739/1/L22
- Cassata et al. (2008) Cassata, P., Cimatti, A., Kurk, J., et al. 2008, Astronomy and Astrophysics, Volume 483, Issue 3, 2008, pp.L39-L42, 483, L39, doi: 10.1051/0004-6361:200809881
- Catinella et al. (2018) Catinella, B., Saintonge, A., Janowiecki, S., et al. 2018, Monthly Notices of the Royal Astronomical Society, 476, 875, doi: 10.1093/mnras/sty089
- Cattaneo et al. (2008) Cattaneo, A., Dekel, A., Faber, S. M., & Guiderdoni, B. 2008, Monthly Notices of the Royal Astronomical Society, 389, 567, doi: 10.1111/j.1365-2966.2008.13562.x
- Chabrier (2003) Chabrier, G. 2003, Publications of the Astronomical Society of the Pacific, 115, 763, doi: 10.1086/376392
- Chadayammuri et al. (2021) Chadayammuri, U., Tremmel, M., Nagai, D., Babul, A., & Quinn, T. 2021, Monthly Notices of the Royal Astronomical Society, 504, 3922, doi: 10.1093/mnras/stab1010
- Charlot & Fall (2000) Charlot, S., & Fall, S. M. 2000, The Astrophysical Journal, 539, 718, doi: 10.1086/309250
- Choi et al. (2015) Choi, E., Ostriker, J. P., Naab, T., Oser, L., & Moster, B. P. 2015, Monthly Notices of the Royal Astronomical Society, 449, 4105, doi: 10.1093/mnras/stv575
- Choi et al. (2018) Choi, E., Somerville, R. S., Ostriker, J. P., Naab, T., & Hirschmann, M. 2018, The Astrophysical Journal, 866, 91, doi: 10.3847/1538-4357/aae076
- Churazov et al. (2005) Churazov, E., Sazonov, S., Sunyaev, R., et al. 2005, Monthly Notices of the Royal Astronomical Society, 363, L91, doi: 10.1111/j.1745-3933.2005.00093.x
- Conroy & Gunn (2010) Conroy, C., & Gunn, J. E. 2010, The Astrophysical Journal, 712, 833, doi: 10.1088/0004-637X/712/2/833
- Conroy et al. (2009) Conroy, C., Gunn, J. E., & White, M. 2009, The Astrophysical Journal, 699, 486, doi: 10.1088/0004-637X/699/1/486
- Croton et al. (2006) Croton, D. J., Springel, V., White, S. D. M., et al. 2006, Monthly Notices of the Royal Astronomical Society, 365, 11, doi: 10.1111/j.1365-2966.2005.09675.x
- Dan Foreman-Mackey et al. (2014) Dan Foreman-Mackey, Sick, J., & Johnson, B. 2014, Python-Fsps: Python Bindings to FSPS (v0.1.1), Zenodo
- Dashyan et al. (2018) Dashyan, G., Silk, J., Mamon, G. A., Dubois, Y., & Hartwig, T. 2018, Monthly Notices of the Royal Astronomical Society, 473, 5698, doi: 10.1093/mnras/stx2716
- Davé et al. (2019) Davé, R., Anglés-Alcázar, D., Narayanan, D., et al. 2019, Monthly Notices of the Royal Astronomical Society, 486, 2827, doi: 10.1093/mnras/stz937
- Davies et al. (2022) Davies, J. J., Pontzen, A., & Crain, R. A. 2022, arXiv e-prints, arXiv:2203.08157
- Dekel & Silk (1986) Dekel, A., & Silk, J. 1986, The Astrophysical Journal, 303, 39, doi: 10.1086/164050
- Di Matteo et al. (2005) Di Matteo, T., Springel, V., & Hernquist, L. 2005, Nature, 433, 604, doi: 10.1038/nature03335
- Dickey et al. (2019) Dickey, C. M., Geha, M., Wetzel, A., & El-Badry, K. 2019, The Astrophysical Journal, 884, 180, doi: 10.3847/1538-4357/ab3220
- Dickey et al. (2021) Dickey, C. M., Starkenburg, T. K., Geha, M., et al. 2021, The Astrophysical Journal, 915, 53, doi: 10.3847/1538-4357/abc014
- Efstathiou (1992) Efstathiou, G. 1992, Monthly Notices of the Royal Astronomical Society, 256, 43P, doi: 10.1093/mnras/256.1.43P
- Emerick et al. (2016) Emerick, A., Mac Low, M.-M., Grcevich, J., & Gatto, A. 2016, The Astrophysical Journal, 826, 148, doi: 10.3847/0004-637X/826/2/148
- Feldmann et al. (2010) Feldmann, R., Carollo, C. M., Mayer, L., et al. 2010, The Astrophysical Journal, 709, 218, doi: 10.1088/0004-637X/709/1/218
- Feldmann et al. (2017) Feldmann, R., Quataert, E., Hopkins, P. F., Faucher-Giguère, C.-A., & Kereš, D. 2017, Monthly Notices of the Royal Astronomical Society, 470, 1050, doi: 10.1093/mnras/stx1120
- Fitts et al. (2017) Fitts, A., Boylan-Kolchin, M., Elbert, O. D., et al. 2017, Monthly Notices of the Royal Astronomical Society, 471, 3547, doi: 10.1093/mnras/stx1757
- Font et al. (2008) Font, A. S., Bower, R. G., McCarthy, I. G., et al. 2008, Monthly Notices of the Royal Astronomical Society, 389, 1619, doi: 10.1111/j.1365-2966.2008.13698.x
- Gallazzi et al. (2008) Gallazzi, A., Brinchmann, J., Charlot, S., & White, S. D. M. 2008, Monthly Notices of the Royal Astronomical Society, 383, 1439, doi: 10.1111/j.1365-2966.2007.12632.x
- Geha et al. (2012) Geha, M., Blanton, M. R., Yan, R., & Tinker, J. L. 2012, The Astrophysical Journal, 757, 85, doi: 10.1088/0004-637X/757/1/85
- Giallongo et al. (2005) Giallongo, E., Salimbeni, S., Menci, N., et al. 2005, The Astrophysical Journal, 622, 116, doi: 10.1086/427819
- Giovanelli et al. (2005) Giovanelli, R., Haynes, M. P., Kent, B. R., et al. 2005, The Astronomical Journal, 130, 2598, doi: 10.1086/497431
- Governato et al. (2015) Governato, F., Weisz, D., Pontzen, A., et al. 2015, Monthly Notices of the Royal Astronomical Society, 448, 792, doi: 10.1093/mnras/stu2720
- Greene (2012) Greene, J. E. 2012, Nature Communications, 3, 1304, doi: 10.1038/ncomms2314
- Greene et al. (2020) Greene, J. E., Strader, J., & Ho, L. C. 2020, Annual Review of Astronomy and Astrophysics, 58, 257, doi: 10.1146/annurev-astro-032620-021835
- Guedes et al. (2011) Guedes, J., Callegari, S., Madau, P., & Mayer, L. 2011, The Astrophysical Journal, 742, 76, doi: 10.1088/0004-637X/742/2/76
- Habouzit et al. (2017) Habouzit, M., Volonteri, M., & Dubois, Y. 2017, Monthly Notices of the Royal Astronomical Society, 468, 3935, doi: 10.1093/mnras/stx666
- Hahn et al. (2019) Hahn, C., Starkenburg, T. K., Choi, E., et al. 2019, The Astrophysical Journal, 872, 160, doi: 10.3847/1538-4357/aafedd
- Haiman (2013) Haiman, Z. 2013, The First Galaxies, 396, 293, doi: 10.1007/978-3-642-32362-1_6
- Haynes et al. (2011) Haynes, M. P., Giovanelli, R., Martin, A. M., et al. 2011, The Astronomical Journal, 142, 170, doi: 10.1088/0004-6256/142/5/170
- Hidalgo et al. (2011) Hidalgo, S. L., Aparicio, A., Skillman, E., et al. 2011, The Astrophysical Journal, 730, 14, doi: 10.1088/0004-637X/730/1/14
- Hirschmann et al. (2014) Hirschmann, M., Dolag, K., Saro, A., et al. 2014, Monthly Notices of the Royal Astronomical Society, 442, 2304, doi: 10.1093/mnras/stu1023
- Hopkins et al. (2005) Hopkins, P. F., Hernquist, L., Cox, T. J., et al. 2005, The Astrophysical Journal, 630, 705, doi: 10.1086/432438
- Hopkins et al. (2006) —. 2006, The Astrophysical Journal Supplement Series, 163, 1, doi: 10.1086/499298
- Hopkins et al. (2008) Hopkins, P. F., Hernquist, L., Cox, T. J., & Kereš, D. 2008, The Astrophysical Journal Supplement Series, 175, 356, doi: 10.1086/524362
- Ilbert et al. (2010) Ilbert, O., Salvato, M., Le Floc’h, E., et al. 2010, The Astrophysical Journal, 709, 644, doi: 10.1088/0004-637X/709/2/644
- Ilbert et al. (2013) Ilbert, O., McCracken, H. J., Le Fèvre, O., et al. 2013, Astronomy & Astrophysics, Volume 556, id.A55, NUMPAGES19/NUMPAGES pp., 556, A55, doi: 10.1051/0004-6361/201321100
- Ishibashi & Fabian (2016) Ishibashi, W., & Fabian, A. C. 2016, Monthly Notices of the Royal Astronomical Society, 463, 1291, doi: 10.1093/mnras/stw2063
- Janz et al. (2017) Janz, J., Penny, S. J., Graham, A. W., Forbes, D. A., & Davies, R. L. 2017, Monthly Notices of the Royal Astronomical Society, 468, 2850, doi: 10.1093/mnras/stx634
- Joshi et al. (2021) Joshi, G. D., Pillepich, A., Nelson, D., et al. 2021, Monthly Notices of the Royal Astronomical Society, 508, 1652, doi: 10.1093/mnras/stab2573
- Kauffmann et al. (1993) Kauffmann, G., White, S. D. M., & Guiderdoni, B. 1993, Monthly Notices of the Royal Astronomical Society, 264, 201, doi: 10.1093/mnras/264.1.201
- Kauffmann et al. (2004) Kauffmann, G., White, S. D. M., Heckman, T. M., et al. 2004, Monthly Notices of the Royal Astronomical Society, 353, 713, doi: 10.1111/j.1365-2966.2004.08117.x
- Kauffmann et al. (2003a) Kauffmann, G., Heckman, T. M., White, S. D. M., et al. 2003a, Monthly Notices of the Royal Astronomical Society, 341, 54, doi: 10.1046/j.1365-8711.2003.06292.x
- Kauffmann et al. (2003b) Kauffmann, G., Heckman, T. M., Tremonti, C., et al. 2003b, Monthly Notices of the Royal Astronomical Society, 346, 1055, doi: 10.1111/j.1365-2966.2003.07154.x
- Kazantzidis et al. (2005) Kazantzidis, S., Mayer, L., Colpi, M., et al. 2005, The Astrophysical Journal, 623, L67, doi: 10.1086/430139
- Kimm et al. (2015) Kimm, T., Cen, R., Devriendt, J., Dubois, Y., & Slyz, A. 2015, Monthly Notices of the Royal Astronomical Society, 451, 2900, doi: 10.1093/mnras/stv1211
- Kimm et al. (2009) Kimm, T., Somerville, R. S., Yi, S. K., et al. 2009, Monthly Notices of the Royal Astronomical Society, 394, 1131, doi: 10.1111/j.1365-2966.2009.14414.x
- Knollmann & Knebe (2009) Knollmann, S. R., & Knebe, A. 2009, The Astrophysical Journal Supplement Series, 182, 608, doi: 10.1088/0067-0049/182/2/608
- Koudmani et al. (2021) Koudmani, S., Henden, N. A., & Sijacki, D. 2021, Monthly Notices of the Royal Astronomical Society, 503, 3568, doi: 10.1093/mnras/stab677
- Koudmani et al. (2019) Koudmani, S., Sijacki, D., Bourne, M. A., & Smith, M. C. 2019, Monthly Notices of the Royal Astronomical Society, 484, 2047, doi: 10.1093/mnras/stz097
- Koudmani et al. (2022) Koudmani, S., Sijacki, D., & Smith, M. C. 2022, Monthly Notices of the Royal Astronomical Society, doi: 10.1093/mnras/stac2252
- Kroupa (2001) Kroupa, P. 2001, Monthly Notices of the Royal Astronomical Society, 322, 231, doi: 10.1046/j.1365-8711.2001.04022.x
- Larson (1974) Larson, R. B. 1974, Monthly Notices of the Royal Astronomical Society, 169, 229, doi: 10.1093/mnras/169.2.229
- López Fernández et al. (2018) López Fernández, R., González Delgado, R. M., Pérez, E., et al. 2018, Astronomy & Astrophysics, Volume 615, id.A27, NUMPAGES23/NUMPAGES pp., 615, A27, doi: 10.1051/0004-6361/201732358
- Manzano-King et al. (2019) Manzano-King, C. M., Canalizo, G., & Sales, L. V. 2019, The Astrophysical Journal, 884, 54, doi: 10.3847/1538-4357/ab4197
- Mao et al. (2021) Mao, Y.-Y., Geha, M., Wechsler, R. H., et al. 2021, The Astrophysical Journal, 907, 85, doi: 10.3847/1538-4357/abce58
- Marinacci et al. (2018) Marinacci, F., Vogelsberger, M., Pakmor, R., et al. 2018, Monthly Notices of the Royal Astronomical Society, 480, 5113, doi: 10.1093/mnras/sty2206
- Martin et al. (2018) Martin, G., Kaviraj, S., Devriendt, J. E. G., Dubois, Y., & Pichon, C. 2018, Monthly Notices of the Royal Astronomical Society, 480, 2266, doi: 10.1093/mnras/sty1936
- McAlpine et al. (2018) McAlpine, S., Bower, R. G., Rosario, D. J., et al. 2018, Monthly Notices of the Royal Astronomical Society, 481, 3118, doi: 10.1093/mnras/sty2489
- McAlpine et al. (2020) McAlpine, S., Harrison, C. M., Rosario, D. J., et al. 2020, Monthly Notices of the Royal Astronomical Society, 494, 5713, doi: 10.1093/mnras/staa1123
- McGee et al. (2011) McGee, S. L., Balogh, M. L., Wilman, D. J., et al. 2011, Monthly Notices of the Royal Astronomical Society, 413, 996, doi: 10.1111/j.1365-2966.2010.18189.x
- Menon et al. (2015) Menon, H., Wesolowski, L., Zheng, G., et al. 2015, Computational Astrophysics and Cosmology, 2, 1, doi: 10.1186/s40668-015-0007-9
- Monelli et al. (2010) Monelli, M., Hidalgo, S. L., Stetson, P. B., et al. 2010, The Astrophysical Journal, 720, 1225, doi: 10.1088/0004-637X/720/2/1225
- Mori et al. (2002) Mori, M., Ferrara, A., & Madau, P. 2002, The Astrophysical Journal, 571, 40, doi: 10.1086/339913
- Moster et al. (2013) Moster, B. P., Naab, T., & White, S. D. M. 2013, Monthly Notices of the Royal Astronomical Society, 428, 3121, doi: 10.1093/mnras/sts261
- Munshi et al. (2021) Munshi, F., Brooks, A. M., Applebaum, E., et al. 2021, The Astrophysical Journal, 923, 35, doi: 10.3847/1538-4357/ac0db6
- Munshi et al. (2013) Munshi, F., Governato, F., Brooks, A. M., et al. 2013, The Astrophysical Journal, 766, 56, doi: 10.1088/0004-637X/766/1/56
- Muzzin et al. (2013) Muzzin, A., Marchesini, D., Stefanon, M., et al. 2013, The Astrophysical Journal, 777, 18, doi: 10.1088/0004-637X/777/1/18
- Nelson et al. (2018) Nelson, D., Pillepich, A., Springel, V., et al. 2018, Monthly Notices of the Royal Astronomical Society, 475, 624, doi: 10.1093/mnras/stx3040
- Obreschkow & Glazebrook (2014) Obreschkow, D., & Glazebrook, K. 2014, The Astrophysical Journal, 784, 26, doi: 10.1088/0004-637X/784/1/26
- Okamoto et al. (2008) Okamoto, T., Gao, L., & Theuns, T. 2008, Monthly Notices of the Royal Astronomical Society, 390, 920, doi: 10.1111/j.1365-2966.2008.13830.x
- Peng et al. (2015) Peng, Y., Maiolino, R., & Cochrane, R. 2015, Nature, 521, 192, doi: 10.1038/nature14439
- Peng et al. (2010) Peng, Y., Lilly, S. J., Kovac, K., et al. 2010, The Astrophysical Journal, Volume 721, Issue 1, pp. 193-221 (2010)., 721, 193, doi: 10.1088/0004-637X/721/1/193
- Penny et al. (2016) Penny, S. J., Masters, K. L., Weijmans, A.-M., et al. 2016, Monthly Notices of the Royal Astronomical Society, 462, 3955, doi: 10.1093/mnras/stw1913
- Penny et al. (2018) Penny, S. J., Masters, K. L., Smethurst, R., et al. 2018, Monthly Notices of the Royal Astronomical Society, 476, 979, doi: 10.1093/mnras/sty202
- Pfister et al. (2017) Pfister, H., Lupi, A., Capelo, P. R., et al. 2017, Monthly Notices of the Royal Astronomical Society, 471, 3646, doi: 10.1093/mnras/stx1853
- Piotrowska et al. (2022) Piotrowska, J. M., Bluck, A. F. L., Maiolino, R., & Peng, Y. 2022, Monthly Notices of the Royal Astronomical Society, 512, 1052, doi: 10.1093/mnras/stab3673
- Planck Collaboration et al. (2014) Planck Collaboration, P., Ade, P. a. R., Aghanim, N., et al. 2014, Astronomy and Astrophysics, 571, A16, doi: 10.1051/0004-6361/201321591
- Pontzen et al. (2017) Pontzen, A., Tremmel, M., Roth, N., et al. 2017, Monthly Notices of the Royal Astronomical Society, 465, 547, doi: 10.1093/mnras/stw2627
- Power et al. (2003) Power, C., Navarro, J. F., Jenkins, A., et al. 2003, Monthly Notices of the Royal Astronomical Society, 338, 14, doi: 10.1046/j.1365-8711.2003.05925.x
- Rasmussen et al. (2012) Rasmussen, J., Mulchaey, J. S., Bai, L., et al. 2012, The Astrophysical Journal, 757, 122, doi: 10.1088/0004-637X/757/2/122
- Rees & Ostriker (1977) Rees, M. J., & Ostriker, J. P. 1977, Monthly Notices of the Royal Astronomical Society, 179, 541, doi: 10.1093/mnras/179.4.541
- Reines et al. (2020) Reines, A. E., Condon, J. J., Darling, J., & Greene, J. E. 2020, The Astrophysical Journal, 888, 36, doi: 10.3847/1538-4357/ab4999
- Rey et al. (2020) Rey, M. P., Pontzen, A., Agertz, O., et al. 2020, Monthly Notices of the Royal Astronomical Society, 497, 1508, doi: 10.1093/mnras/staa1640
- Rey et al. (2019) —. 2019, The Astrophysical Journal, 886, L3, doi: 10.3847/2041-8213/ab53dd
- Ricarte et al. (2019) Ricarte, A., Tremmel, M., Natarajan, P., & Quinn, T. 2019, Monthly Notices of the Royal Astronomical Society, 489, 802, doi: 10.1093/mnras/stz2161
- Ricarte et al. (2021a) —. 2021a, The Astrophysical Journal, 916, L18, doi: 10.3847/2041-8213/ac1170
- Ricarte et al. (2021b) Ricarte, A., Tremmel, M., Natarajan, P., Zimmer, C., & Quinn, T. 2021b, Monthly Notices of the Royal Astronomical Society, 503, 6098, doi: 10.1093/mnras/stab866
- Samuel et al. (2022) Samuel, J., Wetzel, A., Santistevan, I., et al. 2022, Extinguishing the FIRE: Environmental Quenching of Satellite Galaxies around Milky Way-mass Hosts in Simulations
- Sanchez et al. (2021) Sanchez, N. N., Tremmel, M., Werk, J. K., et al. 2021, The Astrophysical Journal, 911, 116, doi: 10.3847/1538-4357/abeb15
- Sanchez et al. (2019) Sanchez, N. N., Werk, J. K., Tremmel, M., et al. 2019, The Astrophysical Journal, 882, 8, doi: 10.3847/1538-4357/ab3045
- Schaye et al. (2015) Schaye, J., Crain, R. A., Bower, R. G., et al. 2015, Monthly Notices of the Royal Astronomical Society, 446, 521, doi: 10.1093/mnras/stu2058
- Schramm & Silverman (2013) Schramm, M., & Silverman, J. D. 2013, The Astrophysical Journal, 767, 13, doi: 10.1088/0004-637X/767/1/13
- Sharma et al. (2020) Sharma, R. S., Brooks, A. M., Somerville, R. S., et al. 2020, The Astrophysical Journal, 897, 103, doi: 10.3847/1538-4357/ab960e
- Sharma et al. (2022) Sharma, R. S., Brooks, A. M., Tremmel, M., et al. 2022, A Hidden Population of Massive Black Holes in Simulated Dwarf Galaxies
- Shen et al. (2010) Shen, S., Wadsley, J., & Stinson, G. 2010, Monthly Notices of the Royal Astronomical Society, 407, 1581, doi: 10.1111/j.1365-2966.2010.17047.x
- Sijacki et al. (2007) Sijacki, D., Springel, V., Di Matteo, T., & Hernquist, L. 2007, Monthly Notices of the Royal Astronomical Society, 380, 877, doi: 10.1111/j.1365-2966.2007.12153.x
- Silk (2017) Silk, J. 2017, The Astrophysical Journal, 839, L13, doi: 10.3847/2041-8213/aa67da
- Simpson et al. (2018) Simpson, C. M., Grand, R. J. J., Gómez, F. A., et al. 2018, Monthly Notices of the Royal Astronomical Society, 478, 548, doi: 10.1093/mnras/sty774
- Skillman et al. (2017) Skillman, E. D., Monelli, M., Weisz, D. R., et al. 2017, The Astrophysical Journal, 837, 102, doi: 10.3847/1538-4357/aa60c5
- Smith et al. (2012) Smith, R. J., Lucey, J. R., Price, J., Hudson, M. J., & Phillipps, S. 2012, Monthly Notices of the Royal Astronomical Society, 419, 3167, doi: 10.1111/j.1365-2966.2011.19956.x
- Snyder et al. (2015) Snyder, G. F., Torrey, P., Lotz, J. M., et al. 2015, Monthly Notices of the Royal Astronomical Society, 454, 1886, doi: 10.1093/mnras/stv2078
- Somerville & Davé (2015) Somerville, R. S., & Davé, R. 2015, Annual Review of Astronomy and Astrophysics, 53, 51, doi: 10.1146/annurev-astro-082812-140951
- Steinborn et al. (2018) Steinborn, L. K., Hirschmann, M., Dolag, K., et al. 2018, Monthly Notices of the Royal Astronomical Society, 481, 341, doi: 10.1093/mnras/sty2288
- Stinson et al. (2006) Stinson, G., Seth, A., Katz, N., et al. 2006, Monthly Notices of the Royal Astronomical Society, 373, 1074, doi: 10.1111/j.1365-2966.2006.11097.x
- Strateva et al. (2001) Strateva, I., Ivezić, Ž., Knapp, G. R., et al. 2001, The Astronomical Journal, 122, 1861, doi: 10.1086/323301
- Tinker et al. (2011) Tinker, J., Wetzel, A., & Conroy, C. 2011, Are Halo and Galaxy Formation Histories Correlated?
- Tinker et al. (2017) Tinker, J. L., Wetzel, A. R., Conroy, C., & Mao, Y.-Y. 2017, Monthly Notices of the Royal Astronomical Society, 472, 2504, doi: 10.1093/mnras/stx2066
- Tonnesen et al. (2007) Tonnesen, S., Bryan, G. L., & van Gorkom, J. H. 2007, The Astrophysical Journal, 671, 1434, doi: 10.1086/523034
- Tremmel et al. (2018) Tremmel, M., Governato, F., Volonteri, M., Pontzen, A., & Quinn, T. R. 2018, The Astrophysical Journal, 857, L22, doi: 10.3847/2041-8213/aabc0a
- Tremmel et al. (2015) Tremmel, M., Governato, F., Volonteri, M., & Quinn, T. R. 2015, Monthly Notices of the Royal Astronomical Society, 451, 1868, doi: 10.1093/mnras/stv1060
- Tremmel et al. (2017) Tremmel, M., Karcher, M., Governato, F., et al. 2017, Monthly Notices of the Royal Astronomical Society, 470, 1121, doi: 10.1093/mnras/stx1160
- Tremmel et al. (2019) Tremmel, M., Quinn, T. R., Ricarte, A., et al. 2019, Monthly Notices of the Royal Astronomical Society, 483, 3336, doi: 10.1093/mnras/sty3336
- Trussler et al. (2020) Trussler, J., Maiolino, R., Maraston, C., et al. 2020, Monthly Notices of the Royal Astronomical Society, 491, 5406, doi: 10.1093/mnras/stz3286
- van den Bosch et al. (2008) van den Bosch, F. C., Aquino, D., Yang, X., et al. 2008, Monthly Notices of the Royal Astronomical Society, 387, 79, doi: 10.1111/j.1365-2966.2008.13230.x
- Villaume et al. (2015) Villaume, A., Conroy, C., & Johnson, B. D. 2015, The Astrophysical Journal, 806, 82, doi: 10.1088/0004-637X/806/1/82
- Volonteri (2012) Volonteri, M. 2012, Science, 337, 544, doi: 10.1126/science.1220843
- Volonteri & Natarajan (2009) Volonteri, M., & Natarajan, P. 2009, Monthly Notices of the Royal Astronomical Society, 400, 1911, doi: 10.1111/j.1365-2966.2009.15577.x
- Wadsley et al. (2017) Wadsley, J. W., Keller, B. W., & Quinn, T. R. 2017, Monthly Notices of the Royal Astronomical Society, 471, 2357, doi: 10.1093/mnras/stx1643
- Weinberger et al. (2017) Weinberger, R., Springel, V., Hernquist, L., et al. 2017, Monthly Notices of the Royal Astronomical Society, 465, 3291, doi: 10.1093/mnras/stw2944
- Weinmann et al. (2009) Weinmann, S. M., Kauffmann, G., van den Bosch, F. C., et al. 2009, Monthly Notices of the Royal Astronomical Society, 394, 1213, doi: 10.1111/j.1365-2966.2009.14412.x
- Weinmann et al. (2006) Weinmann, S. M., van den Bosch, F. C., Yang, X., & Mo, H. J. 2006, Monthly Notices of the Royal Astronomical Society, 366, 2, doi: 10.1111/j.1365-2966.2005.09865.x
- Weisz et al. (2014) Weisz, D. R., Dolphin, A. E., Skillman, E. D., et al. 2014, The Astrophysical Journal, 789, 148, doi: 10.1088/0004-637X/789/2/148
- Weisz et al. (2015) —. 2015, The Astrophysical Journal, 804, 136, doi: 10.1088/0004-637X/804/2/136
- Wetzel et al. (2012) Wetzel, A. R., Tinker, J. L., & Conroy, C. 2012, Monthly Notices of the Royal Astronomical Society, 424, 232, doi: 10.1111/j.1365-2966.2012.21188.x
- Wetzel et al. (2013) Wetzel, A. R., Tinker, J. L., Conroy, C., & van den Bosch, F. C. 2013, Monthly Notices of the Royal Astronomical Society, 432, 336, doi: 10.1093/mnras/stt469
- Wetzel et al. (2014) —. 2014, Monthly Notices of the Royal Astronomical Society, 439, 2687, doi: 10.1093/mnras/stu122
- Wild et al. (2016) Wild, V., Almaini, O., Dunlop, J., et al. 2016, Monthly Notices of the Royal Astronomical Society, 463, 832, doi: 10.1093/mnras/stw1996
- Wild et al. (2009) Wild, V., Walcher, C. J., Johansson, P. H., et al. 2009, Monthly Notices of the Royal Astronomical Society, 395, 144, doi: 10.1111/j.1365-2966.2009.14537.x
- Willmer et al. (2006) Willmer, C. N. A., Faber, S. M., Koo, D. C., et al. 2006, The Astrophysical Journal, 647, 853, doi: 10.1086/505455
- Wyder et al. (2007) Wyder, T. K., Martin, D. C., Schiminovich, D., et al. 2007, The Astrophysical Journal Supplement Series, 173, 293, doi: 10.1086/521402
- Yan et al. (2006) Yan, R., Newman, J. A., Faber, S. M., et al. 2006, The Astrophysical Journal, 648, 281, doi: 10.1086/505629