Time-resolved measurement of spin excitations in Cu2OSeO3
Abstract
Magnetic diffraction in combination with x-ray detected ferromagnetic resonance (DFMR) is a powerful technique for performing time-resolved measurements on individual spin textures. Here, we study the ferromagnetic resonance (FMR) modes of both the conical and field-polarized phases in the chiral magnet Cu2OSeO3. Following the identification of the FMR modes at different temperatures using broadband vector network analyzer FMR, we use DFMR on the crystalline (001) Bragg peak to reveal the time-dependent spin configurations of the selected FMR modes. By being able to measure both the amplitude and phase response of the spin system across the resonance, a continuous phase advance (of ) in the conical mode, and a phase lag (of ) in the field-polarized mode is found. By performing dynamic measurements in the conical phase as a function of the linear polarization angle of the x-rays, i.e., successively probing the dynamics of the moments, we find an inversion of the dynamics along the conical axis upon inverting the applied field direction. By allowing for time-resolved measurements of the phase and amplitude of individual magnetic phases, DFMR opens up new opportunities for obtaining a deeper understanding of the complex dynamics of chiral magnets.
I Introduction
Topological spin textures in chiral magnets such as Cu2OSeO3 are of great interest for potential advances in spintronics [1, 2]. Key to the success of future technologies are their dynamic properties, enabling fast and energy-efficient transitions of the magnetic states. One of the most commonly used techniques for the study of the magnetization dynamics is ferromagnetic resonance (FMR) [3, 4, 5, 6]. In broadband coplanar waveguide (CPW) FMR, the resonances of a sample are probed by placing it on the CPW and subjecting it to a variable magnetic field. By sweeping an RF signal fed to the CPW in the range from typically 0 to 20 GHz, and by measuring the transmitted RF power, the resonances reveal themselves as absorption maxima in frequency vs field maps.
Previous vector network analyzer (VNA) FMR studies have probed the magnetization dynamics of the resonance modes in Cu2OSeO3, i.e., the helical, conical, and skyrmion phase, as well as the field-polarized phase, revealing their evolution in field-frequency space [1, 7, 8, 9, 10]. Supported by micromagnetic simulations, three internal breathing and rotational modes have been identified in the skyrmion phase [1], two each in the helical and conical states, and one in the field-polarized state [7].
Within the conical phase, the two resonance modes that have been resolved can be attributed to vibrational modes in the conical structure and are labeled and [1]. While their magnetization oscillates uniformly, the two modes have opposite helicity and oscillate (counter)clockwise in the () mode [10]. For their excitation, the AC field has to be perpendicular to the bias field direction, and hence the conical propagation axis [1]. As well as the geometry of the field direction, the excitation also depends on the sample geometry due to the anisotropy [7, 8]. The Gilbert damping parameter is small and was found to be 0.003 in Cu2OSeO3 at 5 K (from the FMR linewidth) [9]. Note that the counterclockwise oscillating mode seamlessly connects to the also counterclockwise oscillating Kittel mode present in the field-polarized phase above a critical field, while the spectral weight of the mode is vanishing. The counterclockwise rotation sense in the field-polarized state is a result of the fact that single electron moments, representative of a uniform magnetic state, simply precess counterclockwise around a magnetic field vector.
Resonant elastic x-ray scattering (REXS) provides a unique, element-specific view of ordered magnetic structures, and has been extensively used for the study of Cu2OSeO3 [11, 12, 13, 14, 15] and other chiral magnetic systems [16, 17, 18, 19, 20, 21]. The use of soft x-rays (via x-ray magnetic circular dichroism) to measure magnetization dynamics through x-ray detected ferromagnetic resonance (XFMR) is a valuable technique [22, 23, 24, 25], giving access to the dynamics of individual layers via the element-selectivity of x-ray spectroscopy in few-layer stacks such as spin valves [26] and magnetic tunnel junctions [27]. The combination of the two, REXS and XFMR, allows for dynamic studies of diffraction-selected specific magnetic modes, and is particularly useful for systems in which the eigenmodes are complex and their interpretation crucially relying on micromagnetic simulations. The capabilities of this diffractive FMR (DFMR) technique was demonstrated on the rich magnetic structure of a Y-type hexaferrite [28], and it was further expanded into the probing of superlattices via x-ray reflectometry [29]. A similar technique, REXS-FMR, was successfully applied for the study of, most notably, the three skyrmion eigenmodes in Cu2OSeO3 via the crystalline (001) Bragg peak and its magnetic satellites [30]. While REXS-FMR is a homodyne detection technique which relies on the difference of probed magnetic peak intensities between RF on and off, heterodyne detection DFMR is a truly time-resolving technique, giving access the phase of the dynamic response [28]. Also note that both REXS-FMR and DFMR can be carried out on the magnetic satellites as well, however, due to the complexity of the analysis, the present study will focus on dynamic Bragg peak studies.
Here, we report a time-resolved dynamic study of the conical and field-polarized phase in Cu2OSeO3 using the diffractive ferromagnetic resonance technique, employing both circularly and linearly polarized x-rays. First, the dynamic phase diagram is mapped out using VNA-FMR with the field applied in-plane, identifying the conical and field-polarized modes and characterizing their temperature and field dependence. The characteristics of the resonance modes in the conical and field-polarized phase, as well as the dependence of the critical field on temperature, is well-captured using the established models [10]. Using DFMR, we investigate the dynamic behavior of the conical and the field-polarized mode, as well as the transition between them, in greater detail. As the field-polarized phase does not result in magnetic scattering peaks, we restrict our study to the analysis of the (001) Bragg peak, whose magnetic intensity is susceptible to both phases. Note that, in principle, any reflection peak could be probed which has a magnetic contribution. We find a 180∘ phase shift across the resonances of the conical and field-polarized modes, which is negative and positive, respectively. Further, while the conical resonance peak position is temperature-dependent, the field-polarized resonance is temperature-independent. Finally, by employing linear polarized x-rays of variable polarization angle, we are able to access the dynamics of the projected moments along the conical texture at resonance. We find that upon reversing the applied field, the dynamic response is inverted.
II Experimental
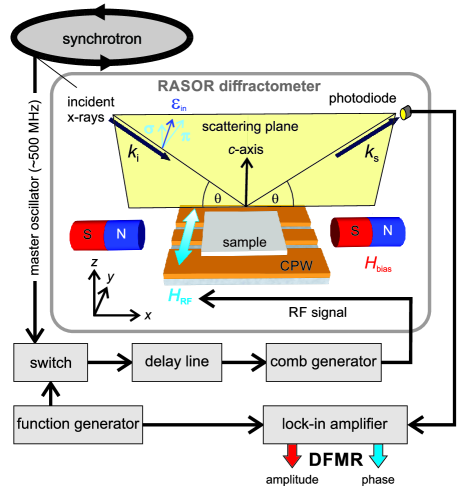
The dynamic behavior of the conical and field-polarized phase in Cu2OSeO3 was measured using broadband VNA-FMR [31] and synchrotron-based DFMR [28]. Both techniques were performed in-situ in the RASOR diffractometer on beamline I10 at the Diamond Light Source (Oxfordshire, UK). A high-quality, (001)-cut Cu2OSeO3 sample, measuring 2 2 0.1 mm3, was polished and placed on a coplanar waveguide (CPW). The CPW was attached to a cold-finger cryostat at the center of the diffractometer, and cooled to temperatures in the range from 25 to 60 K in ultrahigh vacuum. A magnetic bias field was applied in the plane of the sample by way of two permanent magnets, whereby the field strength can be controlled by varying the separation between the magnets. This bias field was oriented in the scattering plane, and perpendicular to the radio frequency (RF) field produced by the CPW. The schematic of the experimental setup is illustrated in Fig. 1.
First, the static magnetic scattering from the sample was characterized. Cu2OSeO3 [cubic space group 213 (198)] has a lattice constant of 8.925 Å. At the Cu edge (931.25 eV), this results in the (001) structural Bragg peak at [13]. Note that this (001) Bragg peak is ‘forbidden’ and only observed in resonant x-ray scattering [11, 12, 32, 33]. In resonant scattering, the magnetic state of Cu2OSeO3 can be accessed via the structural Bragg peak [30], i.e., effectively probes the dynamics, or, alternatively the magnetic satellites ( modes, e.g., the skyrmion breathing mode) [11, 12].
To cover an extended field range, the measurements were performed in two parts, whereby the smaller permanent magnets were replaced by larger ones for the second part of the measurements. As their field ranges were not perfectly overlapping, fields around 30 mT could not be covered (white areas in the resonance plots in Fig. 2).
As a first step, the dynamic phase space of the system was mapped out using VNA-FMR. The RF power transmitted through the CPW, , is measured, whereby its loss () as a function of frequency represents the FMR spectrum. In VNA-FMR measurements, this absorption is typically mapped out as a function of RF frequency and magnetic bias field. However, in this investigation, the absorbed RF power also depends on the magnetic phase of the sample, and thus the excitable magnetic spin configurations, resulting in a temperature and extra field dependence of the spectra. Therefore, in this investigation, we map out the RF absorption of the sample as a function of all three quantities, i.e., frequency, field, and temperature. In practice, this is best achieved by performing frequency sweeps while slowly decreasing the temperature. The difference in sweep rates of both quantities means that the temperature deviation over the time taken to measure a frequency sweep is negligible. These measurements are then repeated at various magnetic fields. This effectively measures the dynamic properties of the system as prepared using a field-cooling protocol.
As the temperature was varied continuously while taking frequency sweeps, the temperature steps need to be interpolated to enable further processing and the analysis of two-dimensional slices of frequency-field at fixed temperature or field-temperature at fixed frequency. In VNA-FMR measurements, the background resulting from the electrical characteristics of the measurement setup is subtracted. This background is typically obtained from a high-field measurement where the moments are saturated and any dynamic features are driven to sufficiently high frequencies to be out of the measurement range. Due to the limitations in the field range in the RASOR diffractometer, we adopt an alternative approach, by subtracting a background measured in the field polarized state at 60 K, i.e., at a temperature above .
After the detection of the dynamic modes using VNA-FMR, the modes were further investigated using polarized soft x-rays. Both circularly and linearly polarized x-rays were used, with an energy tuned to the Cu edge at 931.25 eV. The beam spot size at the sample position is typically 100 100 m2, and the scattered beam was measured using a photodiode in a - configuration with slits providing an angular resolution of 3 mrad.
Initially measurements of the scattered intensity as a function of reciprocal lattice space coordinates were used to map out the static magnetic phase diagram of the sample and to optimize the alignment of the diffractometer. The detector was then positioned at the (001) Bragg peak of Cu2OSeO3.
The polarized soft x-rays provide a probe of the magnetization state in the sample due to circular and linear magnetic dichroism in resonant elastic x-ray scattering [34]. As noted above, in resonant scattering on Cu2OSeO3, both the (001) Bragg peak [30] as well as its surrounding magnetic satellites [11, 12] can be used to probe the magnetic states of Cu2OSeO3. Here, due to the complexity of depth-dependent information a resonant soft x-ray study of the magnetic satellites provides, we focus on the analysis of the (001) Bragg peak data.
For the dynamic measurements, the scattered intensity at the (001) Bragg peak was measured stroboscopically, taking advantage of the pulsed nature of the synchrotron radiation at a frequency of 500 MHz. Here, the RF magnetic field generated from the CPW beneath the sample was phase-locked to an integer multiple of the synchrotron master clock. Due to the reduced thickness of the sample (100 m), the RF power delivered from the CPW was sufficient to excite the magnetization precession dynamics on the Cu2OSeO3 top surface, probed by the x-rays. The intensity of the scattered x-rays provides a measure of the magnetic state of the system for a particular point in time during the precession of the magnetization. Taking such snapshots for increasing delay time between the RF pump and the x-ray probe are then giving the time-dependent magnetization behavior. The signal-to-noise ratio in the dynamic component of the scattered intensity is further enhanced through lock-in detection, using a 180∘ modulation of the phase of the RF pump at a frequency of 700 Hz. For our measurements, the RF frequency was set to 4 GHz where a clear FMR mode crossing is found for both the conical and field polarized phases. Both of these mode crossings are within the field range accessible in the diffractometer. Measurements of the dynamic signal as a function of pump-probe delay and magnetic field were performed at various temperatures with both left and right circularly polarized x-rays, and also with linearly polarized x-rays as a function of the incident polarization angle.
III Results
The ferromagnetic resonance modes of the Cu2OSeO3 sample were first studied in the RASOR diffractometer using VNA-FMR. The frequency spectra were measured during a series of field-cooling sweeps, i.e., as a function of temperature. Slices of this data as a function of frequency and field at different temperatures, and also as a function of field and temperature at different frequencies are shown in Fig. 2(a-d) and Fig. 2(e-h), respectively. The color scale represents the magnitude of transmitted RF power, , revealing strong absorption features corresponding to magnetic resonance modes in the sample.
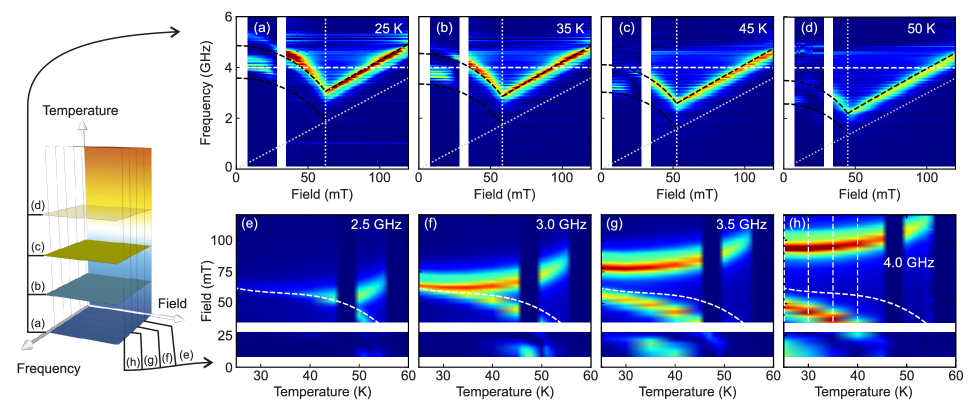
At the critical field , an abrupt change in the magnetic resonance behavior is observed, which is indicated in Fig. 2(a-d) by the vertical, and in Fig. 2(e-h) by the curved dashed lines. This phase boundary separates the conical phase at lower fields from the field-polarized phase which exists above the transition. Both of these phases show different magnetic resonance behavior and there is a continuous transition between them crossing the phase boundary.
The resonance behavior of the field-polarized mode above is adequately described by the Kittel equation, i.e., the description for a uniform ferromagnet (see Eq. (14) in Ref. [10]). Note that while the sample in the present case is a flat plate with its surface normal along the -direction (i.e. with demagnetization factors of and ), the static magnetic field is applied along the -direction, while the RF field, , is applied along the -direction (see Fig. 1). The measured resonance curves [Fig. 2(a-d)] lie above the straight (white dotted) frequency-field line representing the behavior of a perfect sphere, i.e., when demagnetization is irrelevant (demagnetization factors ) and , which is the resonance frequency in the paramagnetic limit. Note that the field-polarized phase branch can either lie above (as here) or below the paramagnetic resonance (dotted white lines), depending on whether the shape anisotropy effectively enhanced or reduces the applied static field [35].
From fitting the Kittel equation to the data [dashed black lines above in Fig. 2(a-d)], the following parameters were obtained: for the demagnetization factors, and , and for the internal susceptibility, . This value for , where is the saturation magnetization, is the pitch vector, and is the stiffness, is consistent with the value of 1.76 reported in Ref. [10].
The conical phase, which exists below , has a more complex dynamic behavior with two modes, and , corresponding to the two vibrational modes within the chiral spin texture [1, 7]. The conical modulation period in Cu2OSeO3 is between 50 and 60 nm [36, 37]. Both modes show a decrease in frequency with increasing field, and are separated by a difference in frequency. At low field, the lower frequency mode contributes to a large RF absorption. With increasing field, the mode decreases in intensity and the mode becomes the dominant mode, in agreement with the theoretically calculated behavior [10]. At , the mode continuously transforms into the field-polarized Kittel mode [8, 7, 10]. These dashed black lines in Fig. 2(a-d) represent fits to the data using the expression given by Garst et al. in Eq. (30) of Ref. [10].
Further, the resonance modes have a subtle temperature dependence when traversing the field-temperature phase diagram [Figure 2(e-h)]. In the field-polarized phase, the resonance field experiences a slight increase up to = 57 K, above which the intensity of the mode vanishes. In the conical phase, the resonant field of the and modes both decrease with increasing temperature at fixed frequencies.
The VNA-FMR measurements shown in Fig. 2 reveal the behavior of the resonance modes within the frequency-temperature-field phase space in Cu2OSeO3. However, while the presence of power-absorbing resonances is clear from these measurements, nothing can be learned about their nature. To gain further insight into their time-dependent spin structure, the dynamic contribution to the scattering at the (001) Bragg peak was measured while exciting specific ferromagnetic resonance modes.
During resonance, the precession of the magnetic moments about the equilibrium spin configuration results in a time-dependent variation of the projection of the moments along the direction of the x-ray polarization vector. This time-dependent projection in turn results in a time-dependent contribution to the scattered intensity at the (001) Bragg peak. Figure 3(a) shows a colormap plot of sequences of such time-dependent scattering intensities for an excitation frequency of 4 GHz. The dynamic contributions to the scattering were recorded as a function of the time delay between the RF pump and x-ray probe pulse, and these so-called delay scans were further obtained as a function of external bias field. The yellow regions indicate that the dynamic scattering is equal to the scattered intensity from the static state, while red (blue) regions indicate an increase (decrease) in the scattered intensity, respectively. The delay scans show sinusoidal oscillations with a period of 250 ps, and demonstrate that the dynamics in the spin configuration is coupled to the 4 GHz excitation frequency.
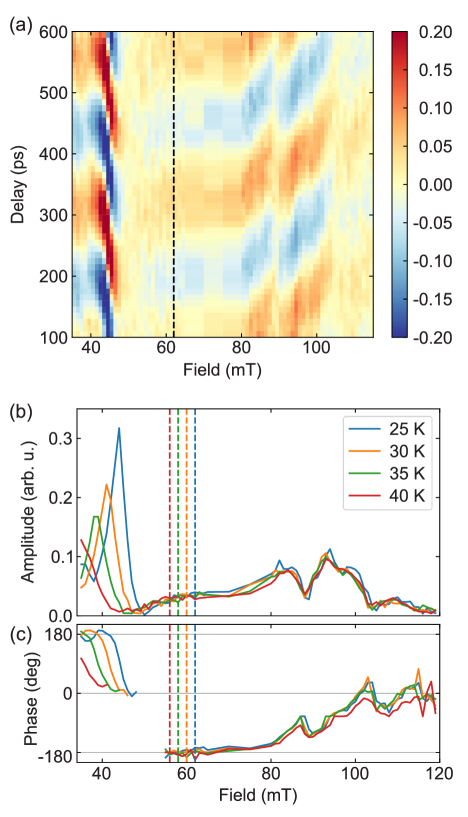
From the contrast in Fig. 3(a) it can be seen that the amplitude and the phase of the oscillations of the (001) Bragg peak intensity change as a function of the applied magnetic field. A strong enhancement of the contrast is observed at 44 mT, and a comparably weaker enhancement between 80 and 100 mT, corresponding to the two resonance modes observed in the 4 GHz VNA-FMR measurements at 25 K, shown in Fig. 2(a). From the shifts of the patterns across Fig. 3(a), especially around the fields at which the contrast is strong, it can also be concluded that the phase of the sinusoidal dynamic signal strongly depends on the applied magnetic field.
The dynamic contribution to the (001) Bragg intensity shown in Fig. 3(a) can be quantified via sinusoidal fits to the delay scan data at each field point. Figures 3(b) and 3(c) show the corresponding amplitude and phase, respectively, as a function of the magnetic field at 25, 30, 35, and 40 K. For all four temperatures, a peak is visible in the amplitude at 40 mT, corresponding to the resonance mode in the conical phase. These peaks are accompanied by a ∘ phase change across the resonance. Both the magnitude and the position of the amplitude peaks are a function of temperature, with the amplitude and resonant field being largest at low temperature, and decreasing with increasing temperature. Both of these features are consistent with the VNA-FMR measurement data presented in Fig. 2(a-d).
The amplitude [Fig. 3(b)] also shows features in the field range from 80-100 mT, consisting of a more complex peak structure, which is also accompanied by a (positive) phase change of 180∘ [Fig. 3(c)]. These features correspond to the resonance of the field-polarized phase and they show, in contrast to the conical mode, no apparent dependence on temperature in either peak amplitude or resonance field. This behavior is consistent with the flatness of the resonance over this temperature range, which can be seen in Fig. 2(h).
Note that the +180∘ phase shift over the field-polarized resonance with field is opposite to the ∘ phase shift over the conical resonance. This leading or lagging behavior of the phase, is due to the different ways in which the resonance is crossed, i.e., with a negative frequency-field slope in case of the conical and a positive slope in case of the field-polarized resonance [see Fig. 2(a) for comparison]. Note that the results shown in Fig. 3 are measured with right-circularly polarized light with the field applied in-plane in the same orientation. When the field direction is reversed, the dynamic signal still shows a peak in amplitude for the conical resonance and the associated 180∘ phase change still occurs in the same direction.
The field-polarized resonance is rather broad and shows a detailed fine structure in both amplitude and phase (Fig. 3). This behavior is due to the existence of multiple magnetostatic modes in the sample, which are enhanced due to the thin thickness of the sample [38]. These multiple overlapping resonance modes combine, resulting in the complex feature in which the higher frequency-field component is the strongest contribution. In the conical phase, these magnetostatic modes are also present, but occur over a narrower frequency range and are not resolved. Note that these modes are also present in VNA-FMR measurements in both the field-polarized and conical phase, however, hard to discern in the usual representation of VNA-FMR absorption maps (they become visible upon differentiation of the signal). Further, the low-field tail of the field-polarized resonance mode appears to ‘leak’ into a field range below the transition, i.e., into the conical phase range. The temperature-dependent values are indicated by the vertical dashed lines in Fig. 3(b,c). This behavior points towards the existence of metastable states, resulting from the field-cooling protocol employed in our measurements.
The VNA-FMR and XFMR measurements (with circularly polarized x-rays) allow us to identify the resonance conditions, and also obtain insight into the phase changes taking place over those resonances. However, further insight into the time evolution of the magnetic structure can be obtained by measuring the (001) Bragg diffraction of linearly polarized x-rays as a function of the linear polarization angle. The linearly polarized light introduces a mechanism to provide directional contrast into the measurements of the magnetic configuration of the system.
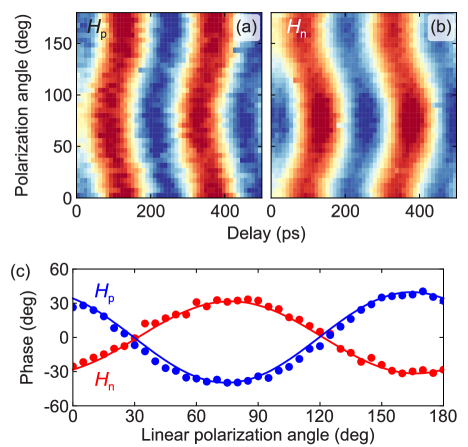
We have shown earlier that the resonance mode in the conical phase in our Cu2OSeO3 sample occurs at 4 GHz in an in-plane bias field of 43 mT at 25 K. With the system excited at this resonance, Fig. 4(a,b) shows the how the magnetic contrast during this dynamic process varies as a function of both the linear polarization angle and the time delay.
Similar to the measurements as a function of field in Fig. 3, the dynamic signal has a sinusoidal dependence on the delay with a period of 250 ps, originating from the 4 GHz RF excitation frequency. This dynamic signal shifts in phase as a function of the incident linear polarization angle. The particular phase of that is measured for a linear polarization angle of is given by the probed position within the resonance curve at 43 mT [see Fig. 3(b,c) for comparison]. Further, the reversal of the applied field direction reverses the direction of the phase shift as a function of the incident linear polarization angle, as shown in Fig. 4(a,b) for the projection of the field along the beam direction applied parallel and antiparallel, respectively. Sinusoidal fits to the delay scan data were used to extract the phase of the dynamic signal for both positive () and negative field (), shown in Fig. 4(c). The phase of the dynamic signals in Fig. 4(c) varies sinusoidally with the linear polarization angle. Most importantly, the phase is inverted when the direction of the magnetic field is reversed. This phase inversion can be interpreted as an inversion of the polarization angle-dependent contrast, which in resonant scattering probes the contribution of the spins along and perpendicular to the polarization direction.
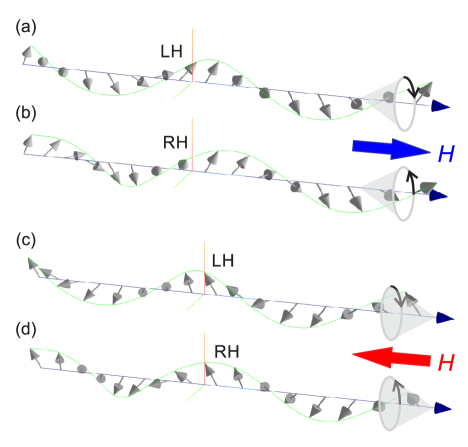
In general, when the field direction is reversed and assuming that the spins simply follow the applied field, the conical spins change their equilibrium orientation, as illustrated in Fig. 5. Note that while the spins follow the magnetic field direction, the conical helix will remain either right- and left-handed, independent of the field direction. As the rotation sense of the dynamical precession is determined by the direction of the applied field, which is counterclockwise for a free electron spin, the rotation sense reverses (in the reference frame of the sample) if the field direction is reversed. As stated above, the conical dynamic mode which has the same (counterclockwise) rotation sense as a free spin, and therefore the field-polarized mode, is the modes. Both modes are seamlessly connected at the transition field (see upper row in Fig. 2). Note that this behavior, i.e., the helicity of the modes, is unaffected by the chirality of the crystal [10].
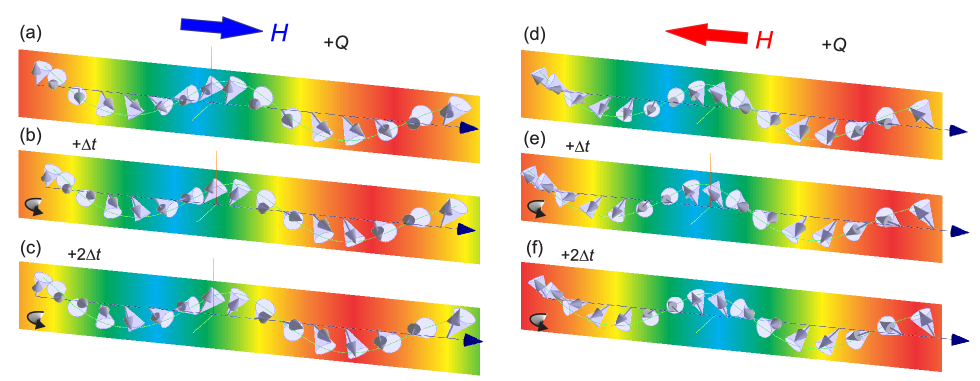
In our experiments, we selected the mode via the RF frequency at a given applied field. Figure 6 shows an illustration of the dynamic behavior of the mode upon field reversal. The panels show subsequent snapshots of the precession of the spins about the local effective field. For a positive applied field (along the helical propagation axis), a compression wave propagates to the right, in the direction of the applied field. For a negative applied field, the propagation direction inverts as well. This model is consistent with our experimental results (Fig. 4).
IV Conclusions
In summary, we explored the dynamic phase space of the resonance modes in the conical and field-polarized states in Cu2OSeO3 as a function of field, temperature, and RF excitation frequency. First, we identified the resonances and measured their field and temperature dependence using VNA-FMR. Taking into account the shape (and demagnetization factors) of the Cu2OSeO3 sample [7], the observed modes could be reproduced using the established models [10]. Employing the same setup, synchrotron-based DFMR allows for a deeper insight into the dynamics of the identified resonance modes. We observed an inversion of the phase of the dynamic signal at 4 GHz across the resonances in the field-polarized and conical state, owing to the way the resonances are traversed. Furthermore, linearly polarized incident x-rays provide additional contrast, projecting out the specific orientation of the magnetization along the incident beam propagation direction, giving access to the time-dependent orientation of the magnetic spins during precession. We find that upon reversing the applied magnetic field direction, the direction of the propagating compression wave is inverted. In general, being able to measure the time-dependent orientation of the magnetization allows for the exploration of the dynamics of chiral systems, which has so far only been accessible via RF absorption measurements in VNA-FMR. The technique of DFMR therefore provides a unique view into the magnetization dynamics of complex topologically structured spin systems.
V Acknowledgments
We thank Prof. Markus Garst from KIT in Karlsruhe for fruitful discussion about the dynamical behavior of magnetization patterns in Cu2OSeO3. We acknowledge the Diamond Light Source (Oxfordshire, UK) for the provision of synchrotron radiation beamtime at beamline I10 under proposals SI16043 and SI17612. This research was funded in part by the Engineering and Physical Sciences Research Council (UK) through grant EP/N032128/1. For the purpose of Open Access, the author has applied a CC BY public copyright license to any Author Accepted Manuscript version arising from this submission.
References
- Onose et al. [2012] Y. Onose, Y. Okamura, S. Seki, S. Ishiwata, and Y. Tokura, Observation of magnetic excitations of skyrmion crystal in a helimagnetic insulator Cu 2OSeO 3, Phys. Rev. Lett. 109, 037603 (2012).
- Nagaosa and Tokura [2013] N. Nagaosa and Y. Tokura, Topological properties and dynamics of magnetic skyrmions, Nat. Nanotechnol. 8, 899 (2013).
- Cochran et al. [1986] J. F. Cochran, B. Heinrich, and A. S. Arrott, Ferromagnetic-resonance in a system composed of a ferromagnetic substrate and an exchange-coupled thin ferromagnetic overlayer, Phys. Rev. B 34, 7788 (1986).
- Metaxas et al. [2010] P. J. Metaxas, R. L. Stamps, J.-P. Jamet, J. Ferre, V. Baltz, B. Rodmacq, and P. Politi, Dynamic binding of driven interfaces in coupled ultrathin ferromagnetic layers, Phys. Rev. Lett. 104, 237206 (2010).
- Magaraggia et al. [2011] R. Magaraggia, K. Kennewell, M. Kostylev, R. L. Stamps, M. Ali, D. Greig, B. J. Hickey, and C. H. Marrows, Exchange anisotropy pinning of a standing spin-wave mode, Phys. Rev. B 83, 054405 (2011).
- Kaiser et al. [2011] A. M. Kaiser, C. Schoeppner, F. M. Roemer, C. Hassel, C. Wiemann, S. Cramm, F. Nickel, P. Grychtol, C. Tieg, J. Lindner, and C. M. Schneider, Nano and picosecond magnetization dynamics of weakly coupled CoFe/Cr/NiFe trilayers studied by a multitechnique approach, Phys. Rev. B 84, 134406 (2011).
- Schwarze et al. [2015] T. Schwarze, J. Waizner, M. Garst, A. Bauer, I. Stasinopoulos, H. Berger, C. Pfleiderer, and D. Grundler, Universal helimagnon and skyrmion excitations in metallic, semiconducting and insulating chiral magnets, Nat. Mater. 14, 478 (2015).
- Stasinopoulos et al. [2017] I. Stasinopoulos, S. Weichselbaumer, A. Bauer, J. Waizner, H. Berger, M. Garst, C. Pfleiderer, and D. Grundler, Linearly polarized GHz magnetization dynamics of spin helix modes in the ferrimagnetic insulator Cu2OSeO3, Sci. Rep. 7, 7037 (2017).
- Weiler et al. [2017] M. Weiler, A. Aqeel, M. Mostovoy, A. Leonov, S. Geprägs, R. Gross, H. Huebl, T. T. M. Palstra, and S. T. B. Goennenwein, Helimagnon resonances in an intrinsic chiral magnonic crystal, Phys. Rev. Lett. 119, 237204 (2017).
- Garst et al. [2017] M. Garst, J. Waizner, and D. Grundler, Collective spin excitations of helices and magnetic skyrmions: review and perspectives of magnonics in non-centrosymmetrric magnets, J. Phys. D: Appl. Phys 50, 293002 (2017).
- Zhang et al. [2016a] S. L. Zhang, A. Bauer, H. Berger, C. Pfleiderer, G. van der Laan, and T. Hesjedal, Resonant elastic x-ray scattering from the skyrmion lattice in Cu2OSeO3, Phys. Rev. B 93, 214420 (2016a).
- Zhang et al. [2016b] S. L. Zhang, A. Bauer, D. M. Burn, P. Milde, E. Neuber, L. M. Eng, H. Berger, C. Pfleiderer, G. van der Laan, and T. Hesjedal, Multidomain Skyrmion Lattice State in Cu2OSeO3, Nano Lett. 16, 3285 (2016b).
- Zhang et al. [2016c] S. L. Zhang, A. Bauer, H. Berger, C. Pfleiderer, G. van der Laan, and T. Hesjedal, Imaging and manipulation of skyrmion lattice domains in Cu2OSeO3, Appl. Phys. Lett. 109, 192406 (2016c).
- Zhang et al. [2017a] S. L. Zhang, G. van der Laan, and T. Hesjedal, Direct experimental determination of the topological winding number of skyrmions in Cu2OSeO3, Nat. Commun. 8, 14619 (2017a).
- Ukleev et al. [2022] V. Ukleev, C. Luo, R. Abrudan, A. Aqeel, C. H. Back, and F. Radu, Chiral surface spin textures in Cu2OSeO3 unveiled by soft X-ray scattering in specular reflection geometry, Sci. Technol. Adv. Mater. 23, 682 (2022).
- Dürr et al. [1999] H. A. Dürr, E. Dudzik, S. S. Dhesi, J. B. Goedkoop, G. van der Laan, M. Belakhovsky, C. Mocuta, A. Marty, and Y. Samson, Chiral Magnetic Domain Structures in Ultrathin FePd Films, Science 284, 2166 (1999).
- Zhang et al. [2017b] S. L. Zhang, G. van der Laan, and T. Hesjedal, Direct experimental determination of spiral spin structures via the dichroism extinction effect in resonant elastic soft x-ray scattering, Phys. Rev. B 96, 094401 (2017b).
- Chauleau et al. [2018] J.-Y. Chauleau, W. Legrand, N. Reyren, D. Maccariello, S. Collin, H. Popescu, K. Bouzehouane, V. Cros, N. Jaouen, and A. Fert, Chirality in magnetic multilayers probed by the symmetry and the amplitude of dichroism in x-ray resonant magnetic scattering, Phys. Rev. Lett. 120, 037202 (2018).
- Legrand et al. [2018] W. Legrand, J.-Y. Chauleau, D. Maccariello, N. Reyren, S. Collin, K. Bouzehouane, N. Jaouen, V. Cros, and A. Fert, Hybrid chiral domain walls and skyrmions in magnetic multilayers, Sci. Adv. 4, eaat0415 (2018).
- Li et al. [2019] W. Li, I. Bykova, S. Zhang, G. Yu, R. Tomasello, M. Carpentieri, Y. Liu, Y. Guang, J. Gräfe, M. Weigand, D. M. Burn, G. van der Laan, T. Hesjedal, Z. Yan, J. Feng, C. Wan, J. Wei, X. Wang, X. Zhang, H. Xu, C. Guo, H. Wei, G. Finocchio, X. Han, and G. Schütz, Anatomy of skyrmionic textures in magnetic multilayers, Adv. Mater. 31, 1807683 (2019).
- Kim et al. [2022] K. T. Kim, M. R. McCarter, V. A. Stoica, S. Das, C. Klewe, E. P. Donoway, D. M. Burn, P. Shafer, F. Rodolakis, M. A. P. Gonçalves, F. Gomez-Ortiz, J. Iniguez, P. Garcia-Fernandez, J. Junquera, S. Susarla, S. W. Lovesey, G. van der Laan, S. Y. Park, L. W. Martin, J. W. Freeland, R. Ramesh, and D. R. Lee, Chiral structures of electric polarization vectors quantified by x-ray resonant scattering, Nat. Commun. 13, 1769 (2022).
- Arena et al. [2009] D. A. Arena, Y. Ding, E. Vescovo, S. Zohar, Y. Guan, and W. E. Bailey, A compact apparatus for studies of element and phase-resolved ferromagnetic resonance, Rev. Sci. Instrum. 80, 083903 (2009).
- Marcham et al. [2011] M. K. Marcham, P. S. Keatley, A. Neudert, R. J. Hicken, S. A. Cavill, L. R. Shelford, G. van der Laan, N. D. Telling, J. R. Childress, J. A. Katine, P. Shafer, and E. Arenholz, Phase-resolved x-ray ferromagnetic resonance measurements in fluorescence yield, J. Appl. Phys. 109, 07D353 (2011).
- Bailey et al. [2013] W. E. Bailey, C. Cheng, R. Knut, O. Karis, S. Auffret, S. Zohar, D. Keavney, P. Warnicke, J.-S. Lee, and D. A. Arena, Detection of microwave phase variation in nanometre-scale magnetic heterostructures, Nat. Commun. 4, 2025 (2013).
- van der Laan [2017] G. van der Laan, Time-resolved X-ray detected ferromagnetic resonance of spin currents, J. Electron. Spectrosc. Relat. Phenom. 220, 137 (2017).
- Baker et al. [2015] A. A. Baker, A. I. Figueroa, L. J. Collins-McIntyre, G. van der Laan, and T. Hesjedal, Spin pumping in Ferromagnet-Topological Insulator-Ferromagnet Heterostructures, Sci. Rep. 5, 7907 (2015).
- Baker et al. [2016] A. A. Baker, A. I. Figueroa, D. Pingstone, V. K. Lazarov, G. van der Laan, and T. Hesjedal, Spin pumping in magnetic trilayer structures with an MgO barrier, Sci. Rep. 6, 35582 (2016).
- Burn et al. [2020a] D. M. Burn, S. Zhang, K. Zhai, Y. Chai, Y. Sun, G. van der Laan, and T. Hesjedal, Mode-resolved detection of magnetization dynamics using x-ray diffractive ferromagnetic resonance, Nano Lett. 20, 345 (2020a).
- Burn et al. [2020b] D. M. Burn, S. L. Zhang, G. Q. Yu, Y. Guang, H. J. Chen, X. P. Qiu, G. van der Laan, and T. Hesjedal, Depth-resolved magnetization dynamics revealed by x-ray reflectometry ferromagnetic resonance, Phys. Rev. Lett. 125, 137201 (2020b).
- Pöllath et al. [2019] S. Pöllath, A. Aqeel, A. Bauer, C. Luo, H. Ryll, F. Radu, C. Pfleiderer, G. Woltersdorf, and C. H. Back, Ferromagnetic resonance with magnetic phase selectivity by means of resonant elastic x-ray scattering on a chiral magnet, Phys. Rev. Lett. 123, 167201 (2019).
- Maksymov and Kostylev [2015] I. S. Maksymov and M. Kostylev, Broadband stripline ferromagnetic resonance spectroscopy of ferromagnetic films, multilayers and nanostructures, Physica E 69, 253 (2015).
- Templeton and Templeton [1994] D. H. Templeton and L. K. Templeton, Tetrahedral anisotropy of x-ray anomalous scattering, Phys. Rev. B 49, 14850 (1994).
- Dmitrienko and Chizhikov [2012] V. E. Dmitrienko and V. A. Chizhikov, Weak antiferromagnetic ordering induced by dzyaloshinskii-moriya interaction and pure magnetic reflections in mnsi-type crystals, Phys. Rev. Lett. 108, 187203 (2012).
- van der Laan [2008] G. van der Laan, Soft X-ray resonant magnetic scattering of magnetic nanostructures, C. R. Physique 9, 570 (2008).
- Gurevich and Melkov [1996] A. G. Gurevich and G. A. Melkov, Magnetization Oscillations and Waves (CRC Press, Boca Raton, 1996).
- Seki et al. [2012a] S. Seki, J. H. Kim, D. S. Inosov, R. Georgii, B. Keimer, S. Ishiwata, and Y. Tokura, Formation and rotation of skyrmion crystal in the chiral-lattice insulator Cu2OSeO3, Phys. Rev. B 85, 220406 (2012a).
- Seki et al. [2012b] S. Seki, X. Z. Yu, S. Ishiwata, and Y. Tokura, Observation of Skyrmions in a Multiferroic Material, Science 336, 198 (2012b).
- Storey et al. [1977] B. E. Storey, A. O. Tooke, A. P. Cracknell, and J. A. Przystawa, The determination of the frequencies of magnetostatic modes in rectangular thin films of ferrimagnetic yttrium iron garnet, J. Phys. C: Solid State Phys. 10, 875 (1977).
- [39] See Supplemental Material at [URL will be inserted by publisher] for an animated illustration of the LH conical screw in a positive applied field (Static_+Q_+H.mp4) and of the dynamic conical spin structures (for ) in applied fields along the helical propagation axis and opposite to it (Dynamics_+Q_+H.mp4 and Dynamics_+Q_-H.mp4, respectively).