Shuman et al. \TotalWords6141
Inferring Mobility of Care Travel Behavior From Transit Origin-Destination Data
1 Abstract
There are substantial differences in travel behavior by gender on public transit. Studies have concluded that these differences are largely attributable to household responsibilities typically falling disproportionately on women, leading to women being more likely to utilize transit for purposes referred to by the umbrella concept of “mobility of care”. In contrast to past studies that have quantified the impact of gender using survey and qualitative data, we propose a novel data-driven workflow utilizing a combination of previously developed origin, destination, and transfer inference (ODX) based on individual transit fare card transactions, name-based gender inference, and geospatial analysis as a framework to identify mobility of care trip making. We apply this framework to data from the Washington Metropolitan Area Transit Authority (WMATA). Analyzing data from millions of journeys conducted in the first quarter of 2019, the results of this study show that our proposed workflow can identify mobility of care travel behavior, detecting times and places of interest where the share of women travelers in an equally-sampled subset (on basis of inferred gender) of transit users is 10% - 15% higher than that of men. The workflow presented in this study provides a blueprint for combining transit origin-destination data, inferred customer demographics, and geospatial analyses enabling public transit agencies to assess, at the fare card level, the gendered impacts of different policy and operational decisions.
Keywords: Public Transport, Origin-Destination Data, Spatial Equity Analysis, Women in Transport.
2 Introduction
Research on women and gender in transport carried out in the last three decades suggests that women tend to interact with public transportation differently from other users [1]. Most of this difference in use can be attributed to the typical distribution of household responsibilities largely falling on women. Many of these studies are based on survey data and qualitative data, which shows evidence that women spend more time and energy using public transportation to conduct those typical gender-role defined tasks [2], referred to by the umbrella concept “mobility of care”. The concept was introduced by Ines Sanchez de Madariaga in 2009 [3] who further hypothesized in 2013 that the total number of such trips could be close to that of employment-related mobility [3]. The mobility of care concept provides a framework for "recognizing, measuring, making visible, valuing and properly accounting for all the travel associated with those caring and home-related tasks needed for the reproduction of life”. The umbrella concept mobility of care unveils trips related to the care of other persons and of the household that normally are made by women and hidden under other categories defining travel purposes, such as escorting, visiting, strolling, shopping, or other. Studies also demonstrate that women commonly make up the majority of riders on public transportation systems [4].
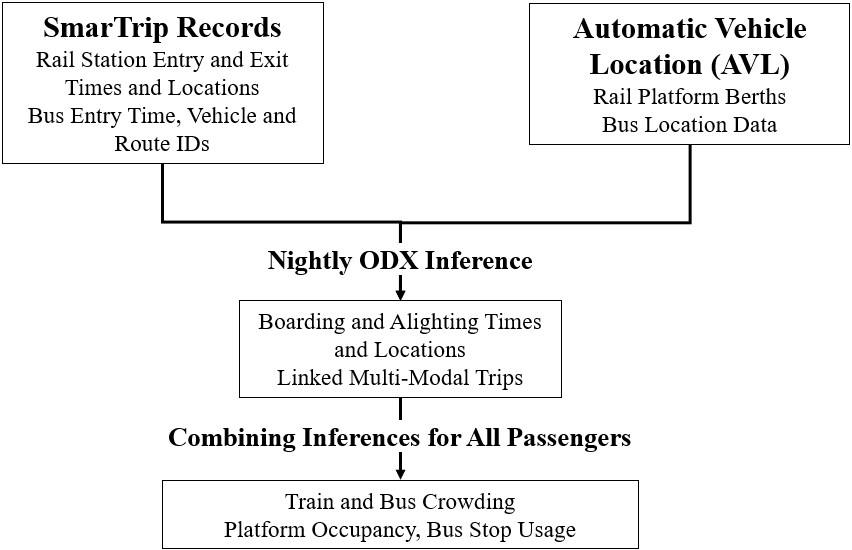
Recent advances in inferring passenger behavior from automated data collection systems provide a richness of information about how individuals pay and travel throughout the public transit system [5, 6]. However, there is currently an evidence gap in evaluating the results of survey-based studies against those automated data collection sources and fare card data in particular. This research addresses that gap by making it possible to examine the extent of gender-specific travel behavior at the passenger-card level. While this gender-specific travel behavior has typically been studied through user surveys, which provide rich information about behavioral choices and why people are making the travel decisions they are, they can also be expensive to conduct on a large scale and take time to provide actionable evidence. Whereas for automated fare card data, collection and analysis of substantially larger quantities of high-granularity passenger travel information can occur as early as the next day. A shift towards using big data, particularly disaggregate origin-destination data, can help validate existing hypotheses about the impact of gender on travel behavior and fare burden and reveal new findings as to how individuals, women particularly, actually use the system. Methods to infer passenger origin, destination, and transfer (ODX) patterns from combined automatic fare collection and automatic vehicle location data have been developed previously [7, 8]. The results of this disaggregate, comprehensive inference process provide for a detailed study of travel behavior within public transportation systems [9]. This work builds on a commercial ODX implementation, illustrated in Figure 1, built on the methods cited previously deployed at the Washington Metropolitan Area Transit Authority (WMATA).
Combining ODX data with demographic information is a powerful, highly granular way to observe and assess how specific groups of people move around a city using public transportation. For WMATA in particular, women are the majority: more trips are taken by women (58% on Metrobus and 54% on Metrorail), more unique customers are women (55%), and more people in the region are women (51%) (data from WMATA’s customer surveys, and US census). Seemingly gender-neutral policies can have surprisingly different impacts, including unintended negative impacts on women. Gender disaggregated data, developed through this research, provides a new tool that WMATA can use to evaluate gender equity in fares and service. The first application, presented here, is to use this data to identify mobility of care travel behavior. Based on the literature, we expect to observe more women traveling to and from transit stops that serve particular mobility of care places of interest (e.g. daycare centers, schools, or grocery stores). This can, in turn, inform agency decisions about stop, schedule, and infrastructure needs around these locations.
2.1 Objectives and Contribution
To the authors’ knowledge, there are no major studies investigating mobility of care travel behavior from ODX data, with studies in the field largely dependent on survey and qualitative data. The authors believe that a data-driven approach, based on the truly observed trip-making behavior complements the traditional approaches and provides public transportation agencies with highly granular analyses that can aid in guiding and evaluating operation and policy decisions. This study was conducted to identify mobility of care trip-making using WMATA’s ODX data for a set of registered customer fare cards (SmarTrip), covering the first quarter of 2019. We propose and evaluate a workflow that successfully identifies users exhibiting mobility of care travel behavior, providing a policy and operations decision-support layer to public transportation agencies.
3 Related Work
Studies have found women to have relatively distinct travel patterns compared to men. Women are more likely to travel on public transit generally, as well as off-peak (typically noon - 4 PM), for shorter distances, and in chained trips [10]. These findings on the characteristics of trips have been consistent across numerous studies, including a detailed 2019 study [11] that validated many of these findings in the context of Los Angeles County. In a separate study, Gauvin et al. [12] used mobile phone data in Santiago, Chile and found that women tend to be more spatially localized than men, as well as more predictable in their travel patterns. Women were found to distribute their trips among a few highly preferred locations while men distribute their trips among many locations with almost equal probability. In other words, women can be found more frequently at their more visited locations. Mark and Heinrichs conducted a study in Buenos Aires concluding that gender-based trips typically follow separate pre-structured schedules, especially for women with young children [13]. These findings were consistently observed in many cities across the world with a 2018 study that combined multiple surveys from 8 cities [14]. This study is discussed in further detail below.
There are differences in travel patterns among women depending on employment status and household income status. Gauvin et al. found that the disparity in women’s mobility patterns increases significantly when moving from the wealthiest to most deprived communities of Santiago [12]. Further, this study found that the gender mobility gap is significantly correlated with employment status, higher fertility rates, and larger households. Using travel diary data, Kwan (1999) found that employment status and how family obligations are divided play an important role in women’s mobility patterns [15]. Similarly, in a survey with approximately 25,000 households and 60,000 individuals conducted by the German Institute for Economic Research, it was found that the average trip length of part-time employed individuals, and especially homemakers, are lower than that of full-time employed individuals. However, when disaggregating these results by gender, women were found to have a 5% increase in trips per day compared to men [16], demonstrating that the impact of employment on average trip length is higher among women. This phenomenon, however, does not apply to part-time working single women, who have fewer but longer trips than their men counterparts.
The majority of studies on gendered travel patterns rely heavily on survey data. Survey data has been a powerful tool to examine gender equity issues in systems. The International Transport Forum commissioned an aggregation of survey data from 8 different cities across the world in 2018 [14]. Using multinomial logistic regression analysis, this study explored the relationship between gender and transport mode choices. Some of the key findings were that women make more non-commute trips than men, their travel distances are shorter, and women are more likely to walk or cycle than men. The mobility of care is a useful umbrella category that characterizes a pattern of trip-making. The first major study conducted on mobility of care travel was made through a specifically designed survey conducted in the metropolitan area of Madrid [10]. To characterize the nature of mobility of care Trips, Sánchez de Madariaga and Zucchini designed and implemented a survey specifically conceived to be able to quantify mobility of care trips in the metropolitan area of Madrid for the population aged 30-45. The main findings of this study demonstrate the original hypothesis posed by Sánchez de Madariaga in 2013: the number of trips under the umbrella notion of mobility of care could be close to employment-related trips. The gender gap in care-related travel was much bigger than the gender gap in employment-related travel. A key aspect of this study was to properly measure care-related travel through question design. Care-related trips are often hidden under other headings including shopping, escorting, visiting, strolling, or others. This study specifically distinguished between forms of care-related travel.
A number of transit agencies, including but not limited to Los Angeles Metro, Vienna, and Montreal, have used surveys to improve their services for groups of riders, including women. The Los Angeles County Metropolitan Transportation Authority (LA Metro) is a prominent example. In the “Understanding How Women Travel Report”, LA Metro revealed detailed findings on how women use their system. LA Metro released a specific “Understanding How Women Travel” survey in 2018 that reached 2,600 respondents [11]. To supplement this data, LA Metro analyzed trip purposes using the National Household Travel Survey (an LA County subset) along with 6 other surveys not directly related to gender differences. More innovative forms of data collection contextualized the findings, including 3 focus groups, 100 hours of participant observations, and participatory workshops. These innovative forms of data collection contributed significantly to contextualizing experiences on transit for women, specifically lower-income women or non-English speaking women. The participatory workshops specifically were crucial in observing intersectionality, for example how fully-employed women travel differently than part-time employed women. Much of the influence for the agency came from the City Woman’s Office in Vienna [17] and Mobility of Care concepts coined by Ines Sanchez de Madariaga.
There is a growing body of work that uses ODX data to better understand rider travel behavior and make policy and operational improvements. Those use cases of ODX data range from understanding commuting patterns of transit users [18], and estimating trip purposes [19] to linking customer delays to root causes [20]. Passenger segmentation, a task that involves clustering passengers into different user groups based on their common recurring travel behavior has also been a popular use of ODX data [21]. Unfortunately, fare card data rarely includes demographic information, which could be used to analyze fare burden and travel patterns by gender, among other attributes. This paper contributes to the literature by offering an additional large-scale study based in the United States on the mobility of care patterns using ODX data for a set of nearly 2 million users and tens of millions of trips that have taken place in the National Capital Region in the first quarter of 2019 (January 1st - March 31st).
4 Methodology
4.1 Origin-Destination and Registered SmarTrip Card Data
The ODX dataset provided by WMATA contains the actual or inferred origin, destination, and transfer information for customers using the agency’s SmarTrip card. This includes trip-level (journeys) and individual journey legs (stages) information such as boarding and alighting times and locations, routes used, distance traveled, and fare paid. Over 1.9 million customers in 2019 used a registered SmarTrip card (958K of whom were active in the first quarter), which asks for basic contact information, such as first and last name at registration. While the registered user customer data allows for conducting demographic and gender inference, it excludes cash transactions as it only includes tap-in/tap-out interactions with the WMATA system. Registration is also not mandatory, and registered users are more likely to be participating in the SmartBenefits program, receiving either a pre-tax, full, or partial transit subsidy from their employer. As a result, the registered card users dataset contains a higher share of customers who worked full-time and had typical pre-pandemic 9-5 commute patterns. Hence, this study focuses on analyzing destinations where individuals conducting mobility of care activities are expected to travel more, albeit being on a 9-5 work schedule. Accompanying children to daycare centers and schools, and going to grocery stores are examples of places we expect this pattern of travel to be prevalent based on the literature, particularly during drop-off/pick-up times on weekdays.
The ODX data for the entirety of Quarter 1 of 2019 contains 80,023,450 stages, 70,561,887 journeys, and 3,012,087 unique cards. Given that Metrorail stations are limited in number and serve larger areas compared to bus stops, we focus our analyses only on bus journeys to allow for a more granular geospatial analysis, where we can have higher confidence in origins and destinations in the proximity of bus stops. Of the aforementioned records, 25 million of all stages are bus stages, forming a total of 22 million journeys conducted by 814,726 users that have tapped into the Metrobus system during the first quarter of 2019.
4.2 Gender Assignment to SmarTrip Cards
WMATA additionally has a dataset containing a limited number of customers ( 5,000) who have provided detailed self-reported demographics, including gender. To conduct the large-scale analyses proposed for this project, it was necessary to acquire gender information for a larger number of customers. Gender inference on the basis of the first name has grown in popularity in recent years, mainly due to the ease of acquiring large volumes of user names and self-reported genders through social media platforms. This has been studied by researchers including Liu & Ruth [22], and Santamaría & Mihaljevic [23]. For baseline gender inference, we utilized the API integration for a commercial service, Genderize.io. Genderize scrapes open data from the internet, mainly public social media accounts, to collect counts and self-reported gender information associated with every first name. As of the time of writing, Genderize’s database contains gender counts and probabilities from over 114 Million entries (total entries in the database and not unique names). The API also provides the country breakdown associated with the names in their database.
4.2.1 Pre-Processing and Gender Inference
We used the names and serialized card IDs from the registered SmarTrip card data for 1.9 million registered WMATA users in . Prior to running gender inference on the basis of the first name, the following steps were taken:
-
•
Names were pre-processed to remove blank entries and name fields reported as numbers.
-
•
The remaining names were converted to Proper Form and white spaces were removed from the name string to remove discrepancies (hyphens are kept unchanged).
-
•
A set of unique first names () were then taken and run through the Genderize API, retrieving the associated names, gender classification, the database counts for a given name, and the probability of gender classification.
-
•
We saved those into a local database, which can be accessed to retrieve gender for registered users’ mobility analyses. This step also reduces the effort for future name-to-gender inference to unique names as opposed to entirely new datasets.
-
•
First names that remain with unidentified gender out of the Genderize API are then passed through the US Social Security Baby Names database, which lists the most popular 2,000 baby names in the US for every year from 1880 onwards [24].
Overall, a likely gender is associated with more than unique names, which were slightly more women-classified than men-classified. When joining the name-gender classification to the registered SmarTrip card data, we end with () men, women (), and cards with no associated gender classification (). While the men-classified names had higher confidence associated with the gender prediction, the majority of both men’s and women’s classification probabilities are well above . For the approximately 5,000 cards where we had self-reported demographic information, we compared the predicted to self-reported gender and found our method accurately inferred gender for 94% of those customers.
It is important to make explicit that this analysis does not seek to perpetuate the stereotype that those with names that are more likely to belong to women should be conducting mobility of care work, or that a binary representation (female/woman, male/man) based on the name associated with sex-at-birth sufficiently represents people’s gender identities, as demonstrated by D’Ignazio and Klein [25]. Instead, in the current state, studies in the literature consistently find that individuals identifying as women tend to perform a disproportionate share of care work. The purpose of this large-scale, name-based analysis is to aid in improving the system for caretakers and assessing the mobility patterns of those who are likely to be women-identifying individuals. This is only one way of doing so as the literature suggests and the available data permits.
4.3 Data Processing for Analysis
4.3.1 Sampling Registered SmarTrip Cards
The dataset was balanced by inferred gender for the time period of analysis (first quarter of 2019). The name-based gender inference yields more cards associated with men than women in the registered SmarTrip card dataset, although the survey data for WMATA consistently shows that more customers, particularly on the Metrobus system, are women. This discrepancy is attributed to the aforementioned bias of the registered SmarTrip users’ dataset towards full-time employees, which in this case included slightly more men than women. To account for this discrepancy, we used all the women-classified cards and randomly drew a matching number of men-classified cards (hereinafter referred to as women and men). This results in a 50-50 baseline ratio of women to men in our analysis subset. Only the stages taken by the cards in this balanced random sample are included in the analysis. The analysis pipeline was re-run numerous times to ensure that this sampling process doesn’t introduce bias, and the results were found to be consistent.
4.3.2 Identifying Places of Interest
Where is the euclidean distance between the geo-location of a POI and a bus stop.
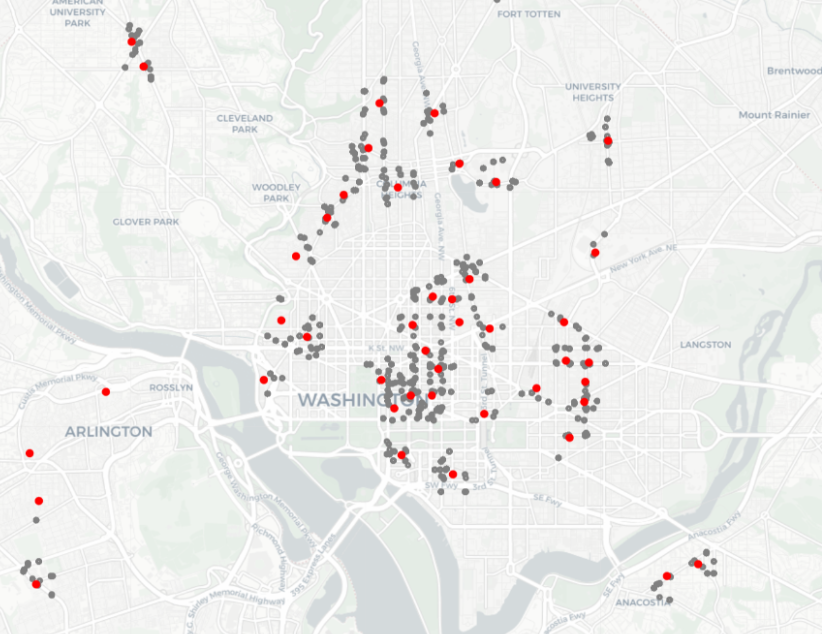
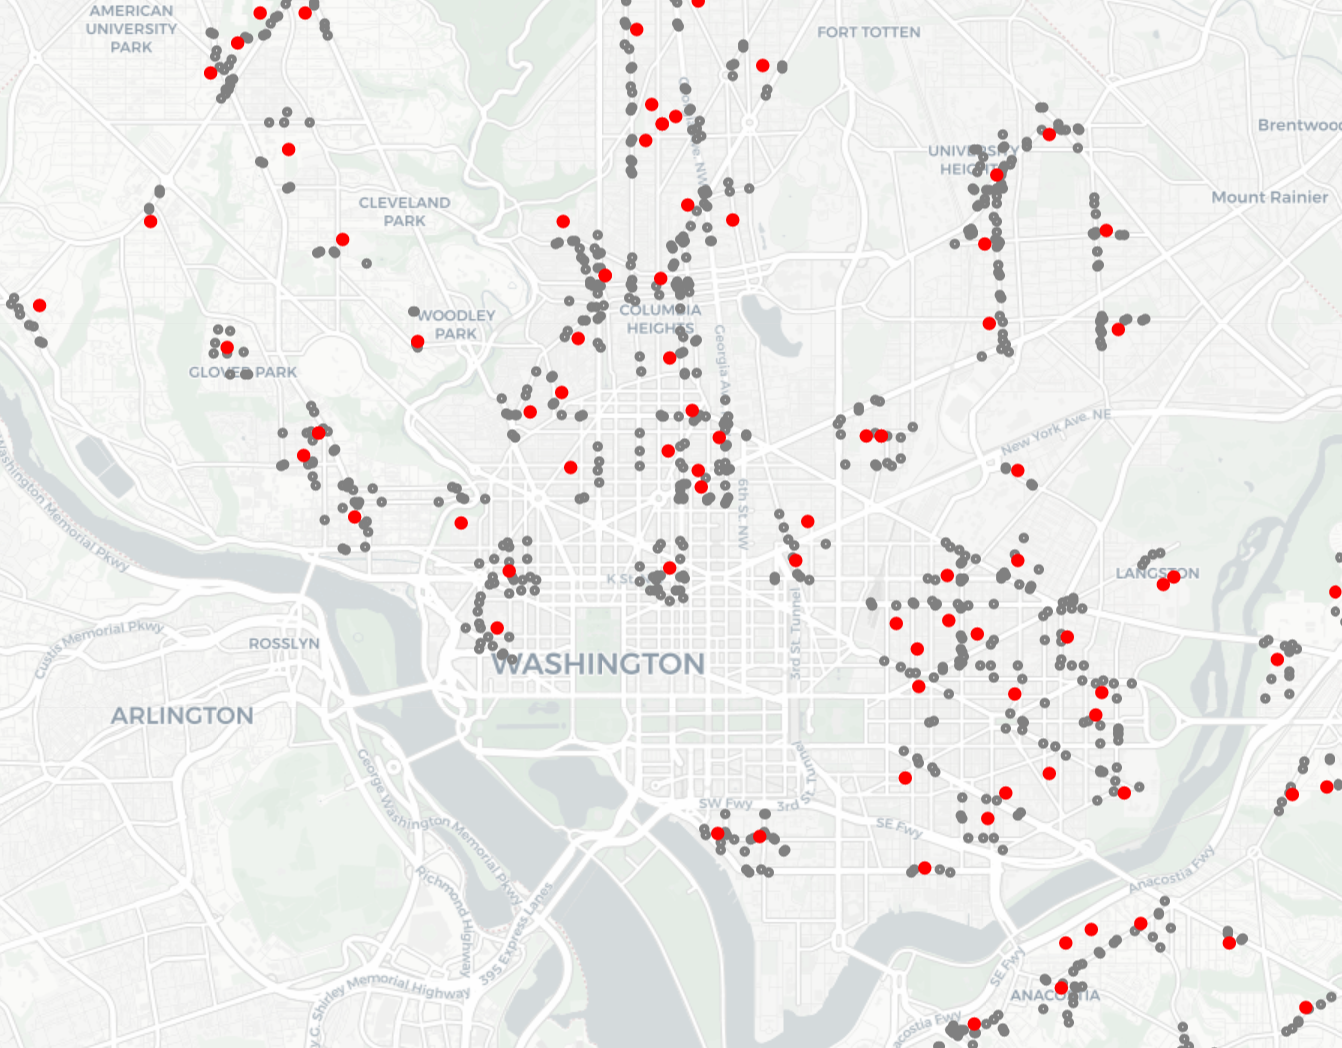
A geospatial approach was used to identify stages that potentially involve mobility of care. If a rider boards or alights at a stop near a mobility of care place of interest (POI), we can assume the journey (or part of it) was more likely to be a mobility of care trip compared to stages at stops further from these POIs. We used DC Open Data repository to identify the geographical location of daycares, schools, and grocery store locations in Washington DC and nearby areas in Maryland and Virginia served by the WMATA Metrobus system. One way of identifying stops near POI is to simply include all stops within a certain walkable distance from the POI. However, depending on the distance criterion, this method may result in the inclusion of multiple stops along the same route and direction, while bus riders whose intention is to end up at that POI will most likely board or alight at the nearest stop along the route. We, therefore, implemented a route-direction-based algorithm to identify the stops serving a set POIs.
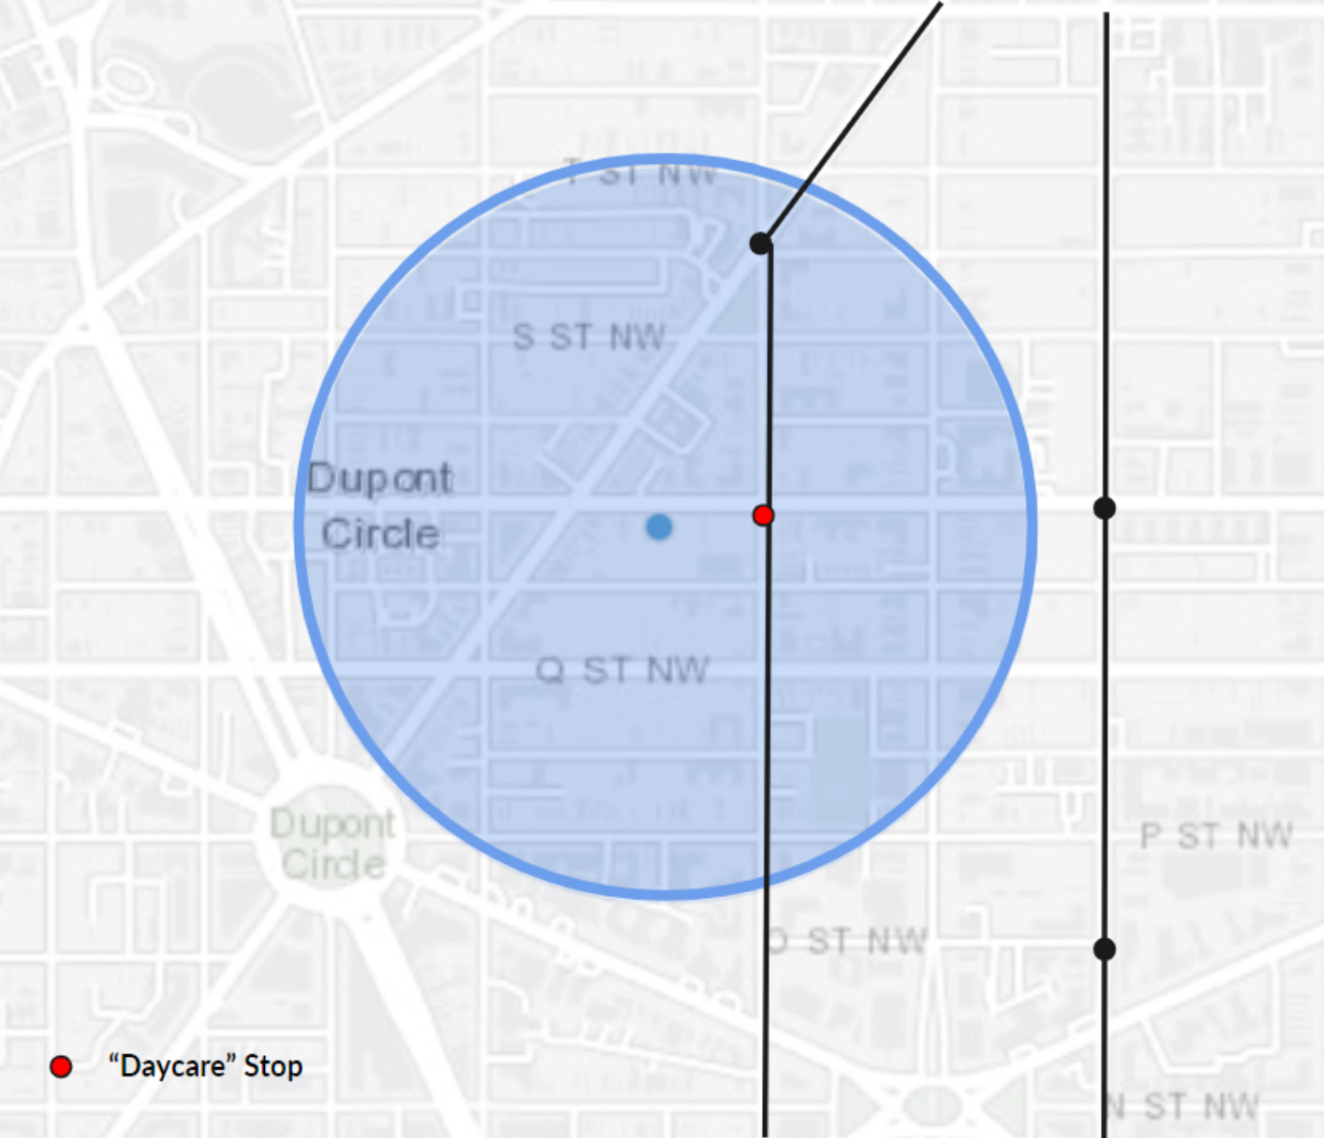
The algorithm takes in a list of POI unique IDs and locations and the agency’s GTFS feed for the time period of interest. Using the GTFS feed, the algorithm identifies a set of unique route-direction pairs. The route-direction pairs are generated by grouping all travel patterns that fall in the same route direction. For example, a pattern on a particular day of the year that takes a separate path will be grouped with the pattern on every other day of the year. This removes any extreme cases. Each unique route direction has a list of stops. For each POI, the algorithm iterates through those stops, identifies the nearest stop within 400m to an individual POI (e.g. a daycare), and appends it to the set of stops closest to the particular POI class (e.g. all daycare centers in the area). The average city block distance in Washington DC is 528 feet (160m), so 400m provides a 1.5 block coverage before and after a certain POI. We found the average POI-to-stop distance identified by this algorithm to be 74 meters. This process is illustrated in Figures 2 and 3.
4.3.3 Identifying Mobility of Care Travel Pattern
To help identify travel patterns more likely to relate to mobility of care while reducing potential noise, we make the assumptions that the anticipated journey characteristics would include regular (recurring) travel patterns, more evident on weekdays and peak in the morning and afternoon. We define regularity in system usage by limiting the analysis to SmarTrip cards that were active on the system for 10 days or more during the time period of the study. After limiting the data to active users, 55 million journeys by 782,009 unique SmarTrip cards remain. This suggests that approximately 80% of the journeys are taken by the top 26% of active users. Of those active-user records, 17 million stages and 15 million journeys took place on Metrobus. Table 1 shows the data reduction along the processing steps. The analysis presented hereafter is for 8.55 million stages and 7.67 million journeys conducted in the first quarter of 2019 by 215,000 active, registered SmartTrip cards where gender could be inferred (equally sampled to represent 107,500 women and men).
| Unique Cards | Total Journeys | Total Stages | |
|---|---|---|---|
| (thousand) | (million) | (million) | |
| Full 2019 Q1 Dataset | 3,012 | 70.56 | 80.02 |
| 10+ Active Days | 782 | 55.40 | 64.12 |
| On Metrobus | 420 | 15.65 | 17.78 |
| Registered w/ Gender Inference | 215 | 7.67 | 8.55 |
In order to identify travel behavior that is more likely to be associated with a specific POI, the first case we analyzed includes only journeys that have multiple stages and where the second boarding or higher occurs at a mobility of care POI stop. In other words, it only includes journeys where someone trip-chained near a POI. An example of a journey included in this setup is when someone takes the bus to drop a child off at daycare and, shortly after, boards another bus to continue to their final destination. The identification of mobility of care trips was initially restricted to the multi-stage journeys to reduce the likelihood that we capturing scenarios where the rider consistently enters the system for the first time at a stop near a POI, for a reason unrelated to the POI (e.g. the POI happens to be near their home or work).
The second case we analyzed relaxes the initial trip chaining limitation, including any journey that has a stage that ends near a POI. But because Metrobus customers tap in to board, but do not tap out, the ODX process is only able to infer alighting location for 65% of bus stages. This second case allows us to test if we can identify mobility of care trips by limiting the data to stages with an alighting stop inference, but without limiting it to the subset of trips where we observe transit trip chaining behavior.
To summarize the travel patterns we analyze:
-
•
Case 1 (baseline analysis): Origin Destination
-
•
Case 2 (end stop analysis): Origin POI
Ultimately, we observe the deviation of the ratio of women riders from gender parity over the course of the day at the stops identified closest to the mobility of care destinations. Starting from the assumption that gender should play no role in mobility behavior, thus the ratio of customers at any stop should not significantly deviate from gender parity induced by the equal sampling of the gender-labeled dataset of users. The gender ratio was calculated by taking the total boardings (alightings in the case of the end stop analysis) at POI stops and all bus network stops, grouped by 15-minute intervals from 6 am to 10 pm. Stages that started within this time period were grouped by unique SmarTrip card ID and the percentage of women-classified cards was calculated. For simplicity going forward, we refer to results generated by the women-classified cards as "women" and by the men-classified cards as "men".
5 Results and Discussion
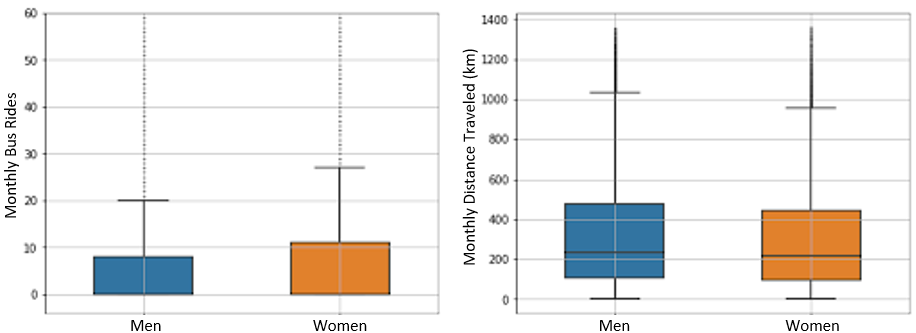
Looking at the big-picture differences between how men and women use the system, we found the results consistent with previous studies on the topic. For all the registered SmartTrip cards in the first quarter of 2019, we found that women are more likely to take the bus and travel shorter distances, as illustrated in Figure 4. While those findings are in line with the literature review, we did not find conclusive evidence of other predominant behaviors found in the literature, which include women traveling more often during off-peak hours, and conducting journeys that involve more transfers. This was not unexpected, given the aforementioned bias that the registered SmarTrip card data is more likely to include full-time employees with a typical pre-pandemic commute pattern.
5.1 Places of Interest Analysis
We chose to observe the gender distribution of a subset equally sampled by gender of active transit users to the mobility of care destinations, with the knowledge that per the literature, journey characteristics associated with mobility of care were found consistent among women with full-time jobs and otherwise. We expected women to travel to and from stops near these POIs at larger rates than men and found a significant difference in the percentage of women boarding a second stage or higher (after a presumed visit to a mobility of care POI) at stops near POIs compared to men. This is quantified by looking at the deviation from gender parity, given that with an equally balanced sample (on the basis of inferred gender) the neutral trip distribution should be 50% for each gender. We find that on average, albeit a balanced subset of users, there are slightly more stages by SmarTrip cards belonging to men compared to women. In a 15-minute interval, the median gender distribution at all stops had -2.10% fewer women stages. While the lowest quantile saw an average of -5% women stages overall stops and at stops identified near mobility of care POIs, higher percentiles show a significant increase in the ratio of women compared to men at mobility of care stops. While the overall 90th percentile gender ratio deviation at all bus stops sees a modest 1.5% more women than men, we observe an increase of 15% more women near daycare centers, 11.30% near schools, and 12.5% near grocery stores. Those results are shown in Table 2. This indicates that women are more likely to be trip chaining near POIs associated with mobility of care travel. While not all transit users observed transferring near a mobility of care POI would eventually be patronizing it, the higher ratio of women observed in those particular places of interest does indicate a higher probability of women conducting mobility of care work.
| 25th Percentile | 50th Percentile | 75th Percentile | 90th Percentile | |
|---|---|---|---|---|
| Daycares | -5.70% | 1.80% | 9.10% | 15.00% |
| Schools | -4.50% | 1.50% | 6.70% | 11.30% |
| Grocery | -5.90% | 1.80% | 7.70% | 12.50% |
| All | -4.58% | -2.10% | 0.00% | 1.50% |
Table 3 shows counts of POI stops and the total and the average number of women and men stages observed. The closest bus stop to the POI is a proxy of travel to that location, but we do not know from the card-based data that someone actually visited a mobility of care POI. We performed an additional check using only the data outside the urban core to test if the results were being driven by the density of development downtown. Evaluating stops that fall outside the central area, we find consistent results as demonstrated in Table 4. The total number of stages includes all stages for the first quarter of 2019. We find that on average, during every 15-minute interval there is one more woman that boards at stops near daycare centers compared to men, albeit having slightly fewer women stages on the system’s average. We observe this discrepancy across all mobility of care POIs, including an average of 3 additional women boardings per hour at stops near grocery stores.
| Stops | Women Stages | Men Stages | ||||
|---|---|---|---|---|---|---|
| Daycares | 594 | 95,857 | 86,270 | 10.1 | 9.1 | 1 |
| Schools | 1,029 | 140,599 | 126,692 | 8.5 | 7.7 | 0.82 |
| Grocery | 288 | 92,210 | 80,823 | 20.0 | 17.5 | 2.5 |
| Stops | Women Stages | Men Stages | ||||
|---|---|---|---|---|---|---|
| Daycares | 394 | 61,103 | 54,972 | 9.7 | 8.7 | 1 |
| Schools | 870 | 119,951 | 109,328 | 8.6 | 7.8 | 0.8 |
| Grocery | 238 | 81,593 | 69,414 | 21.4 | 18.2 | 3.2 |
5.1.1 Daycares
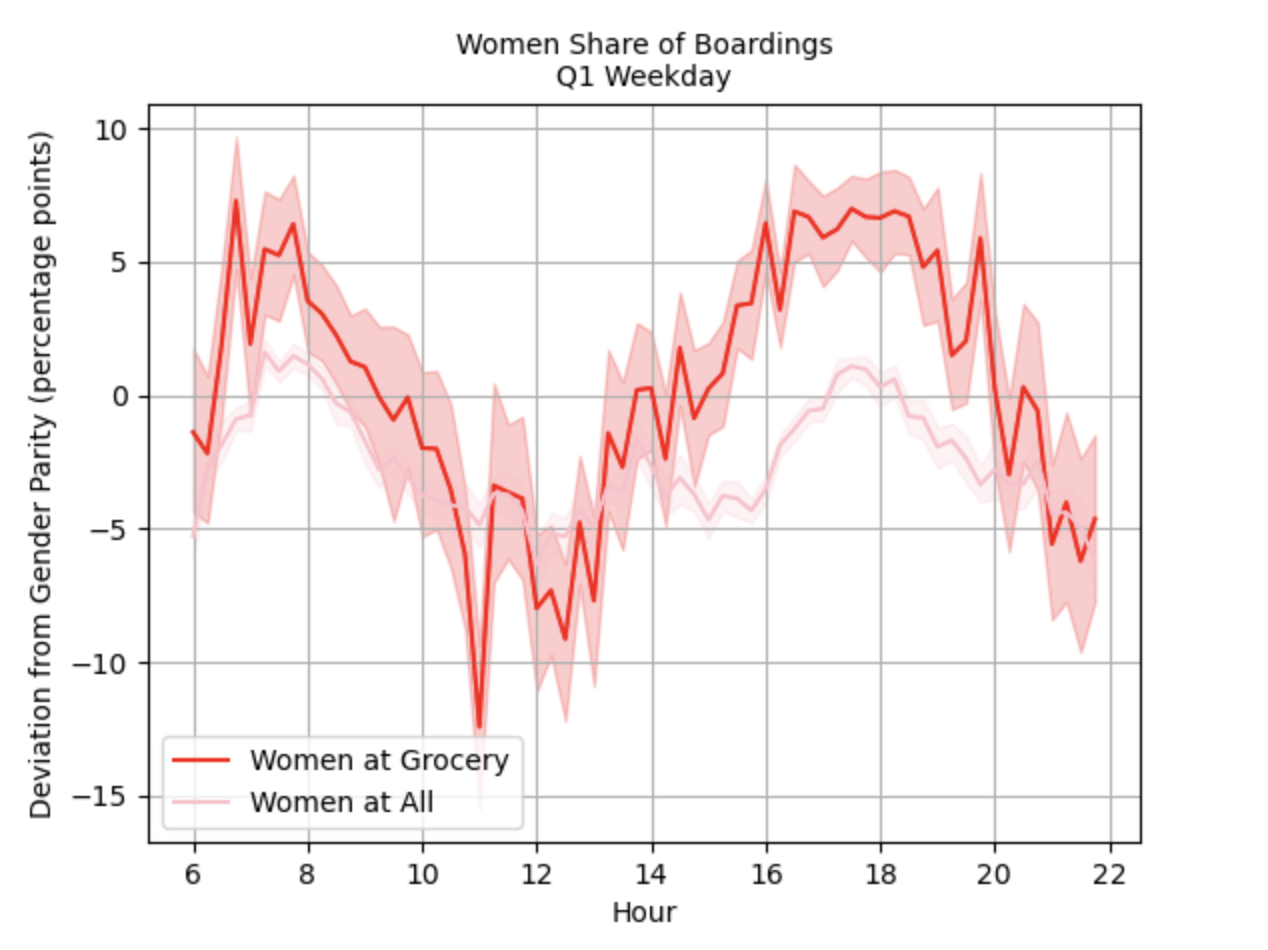
Next, we observe the changes in gender ratio distribution across the day. Figure 5 illustrates the average deviation from gender parity near daycare stops (6% of all stops) compared to all bus stops. The upper and lower envelopes illustrate the 95% confidence interval across different days in the first quarter of 2019.
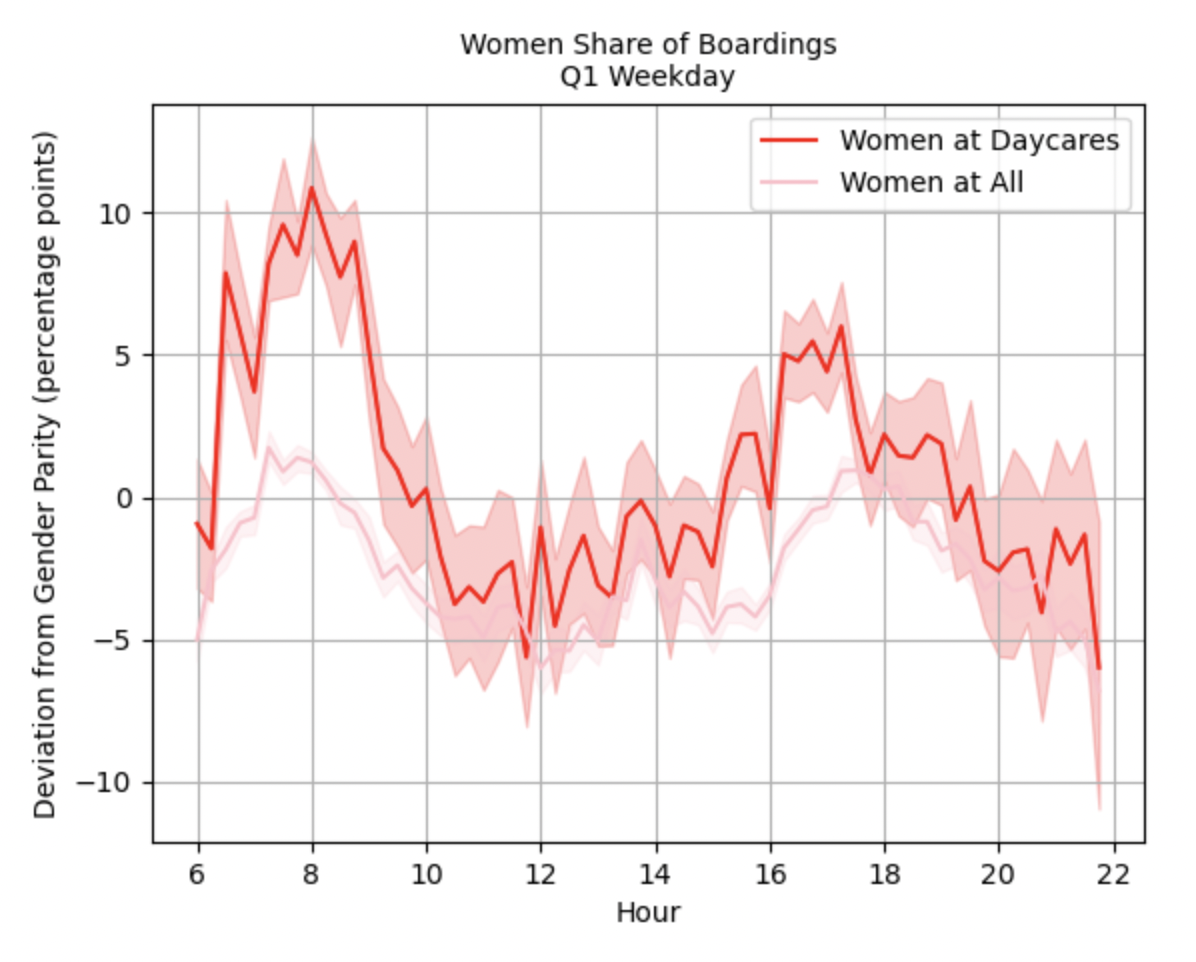
At stops near daycares, there are on average 10% more women than men (60% of riders are women) during AM drop-off times. Compared to all other stops, we observe a modest 2.5% increase in women’s stages during peak hours. Since daycare stops make up only approximately 4% of all stops, there is limited interaction between these two lines. The higher deviation during peak commute hours is expected as this data is skewed toward full-time employees, it is expected that full-time employed women are more likely to board at a daycare stop following a drop-off or pick-up respectively during the AM and PM peak hours. We observe a minimal difference in the gender ratio during the middle of the day between POI stops and all stops. This supports the hypothesis that women are more likely to exhibit the daycare/school drop-off/pick-up travel pattern and there is not a geographical correlation consistent across all times.
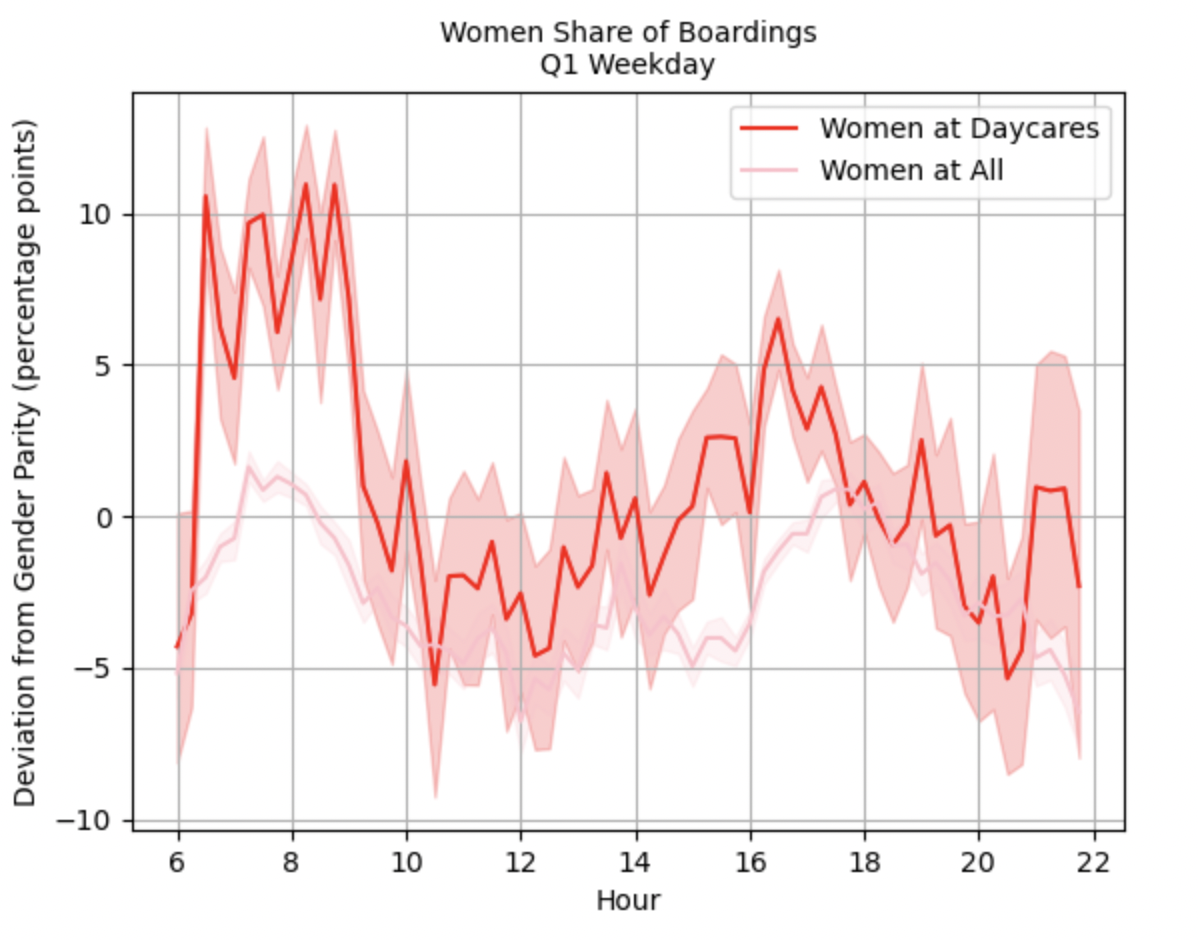
We also observe more spread in the pick-up times in the afternoon while the AM drop-off window is narrower. This suggests women traveling to pick-up may choose to do so over a wider spread of time, or that women and men may do a more equal share of pick-ups. To account for the geographical interaction between this observed deviation and city center dynamics, we evaluate mobility of care stops outside the city center. We defined the Washington DC city center as the area bounded by Independence Ave SW & U Street NW, and 6th Street NW & 23rd Street NW. The trends observed were found to be consistent for daycare stops outside the city center. We also observe more variation in the women ratio during the afternoon and evening for stops outside of the city center, illustrated by the wider confidence intervals. This is attributed to the lower number of people boarding from those stops later in the day, leading to small changes in ridership to cause higher volatility.
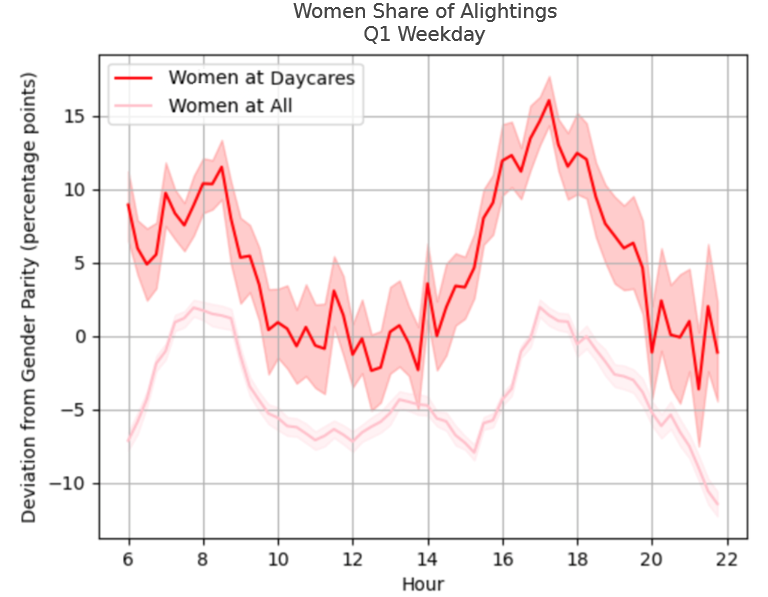
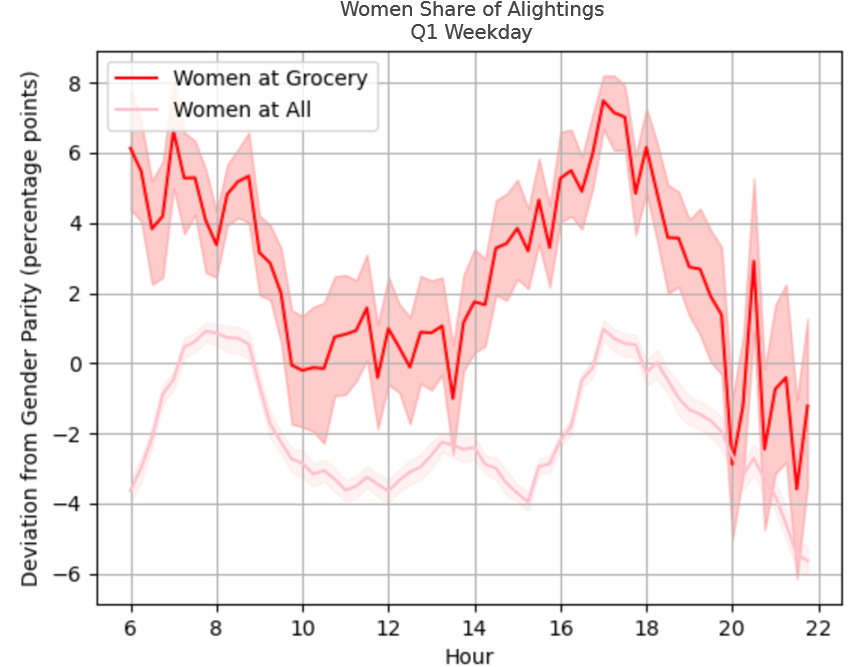
Looking at the second case using end stop analysis that includes the 65% of the data where the alighting stop of a stage was inferred, we observed a similar trend, with the women ratio peaking at commute times. We find a consistent trend in the AM peak, while in the PM peak, we observe 15% more women ending their stages or journey at a stop near a daycare center. While a possible explanation is that more people live near daycares, given that the baseline is a gender-balanced sample it is unlikely this deviation can be entirely explained by geographical association. We don’t expect women to disproportionately arrive at home stops more often than men. Thus, this may be able to capture women who walk or utilize a different mode of transport to drop off or pick up their children at daycares before taking transit for their subsequent stages.
5.1.2 Schools
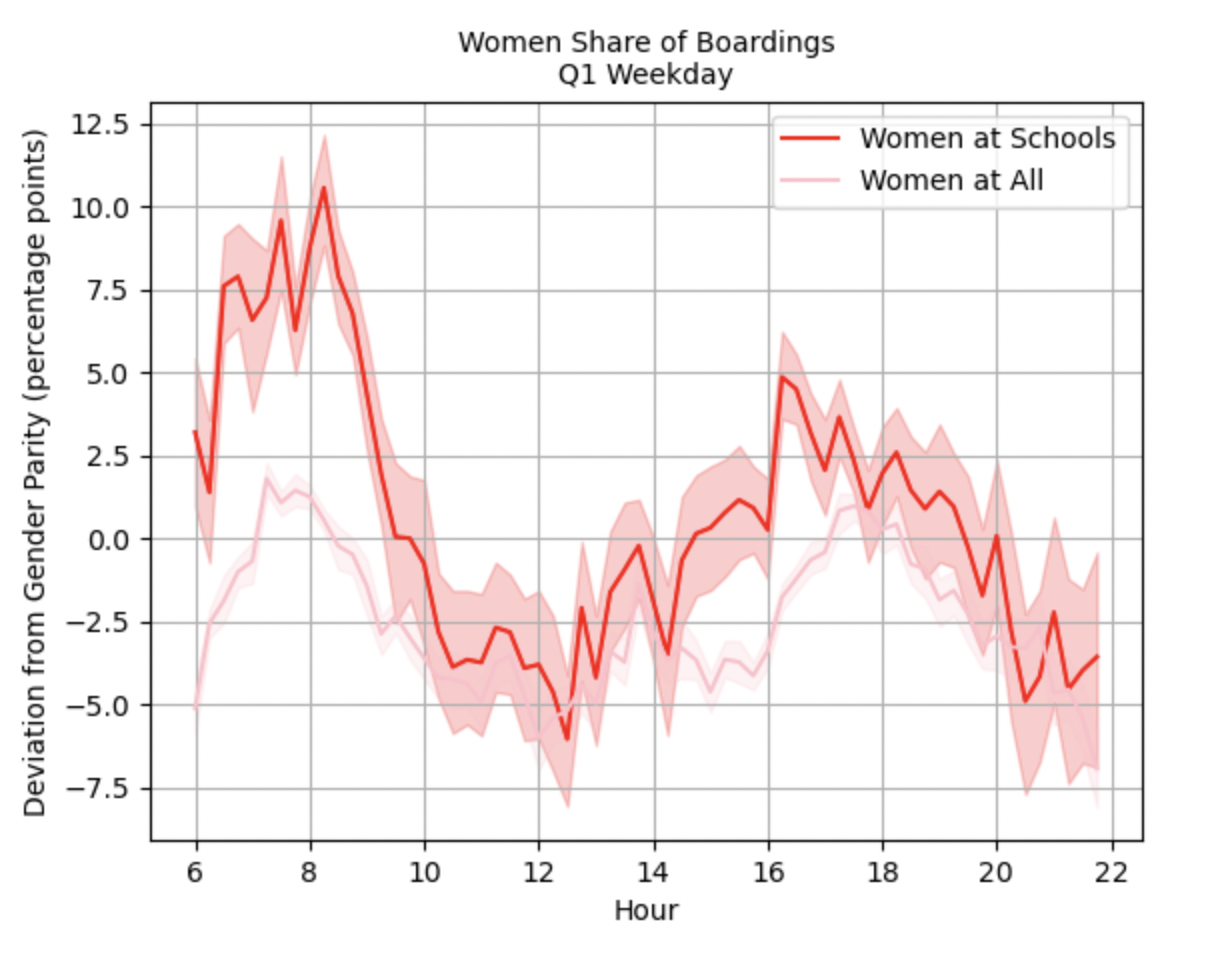
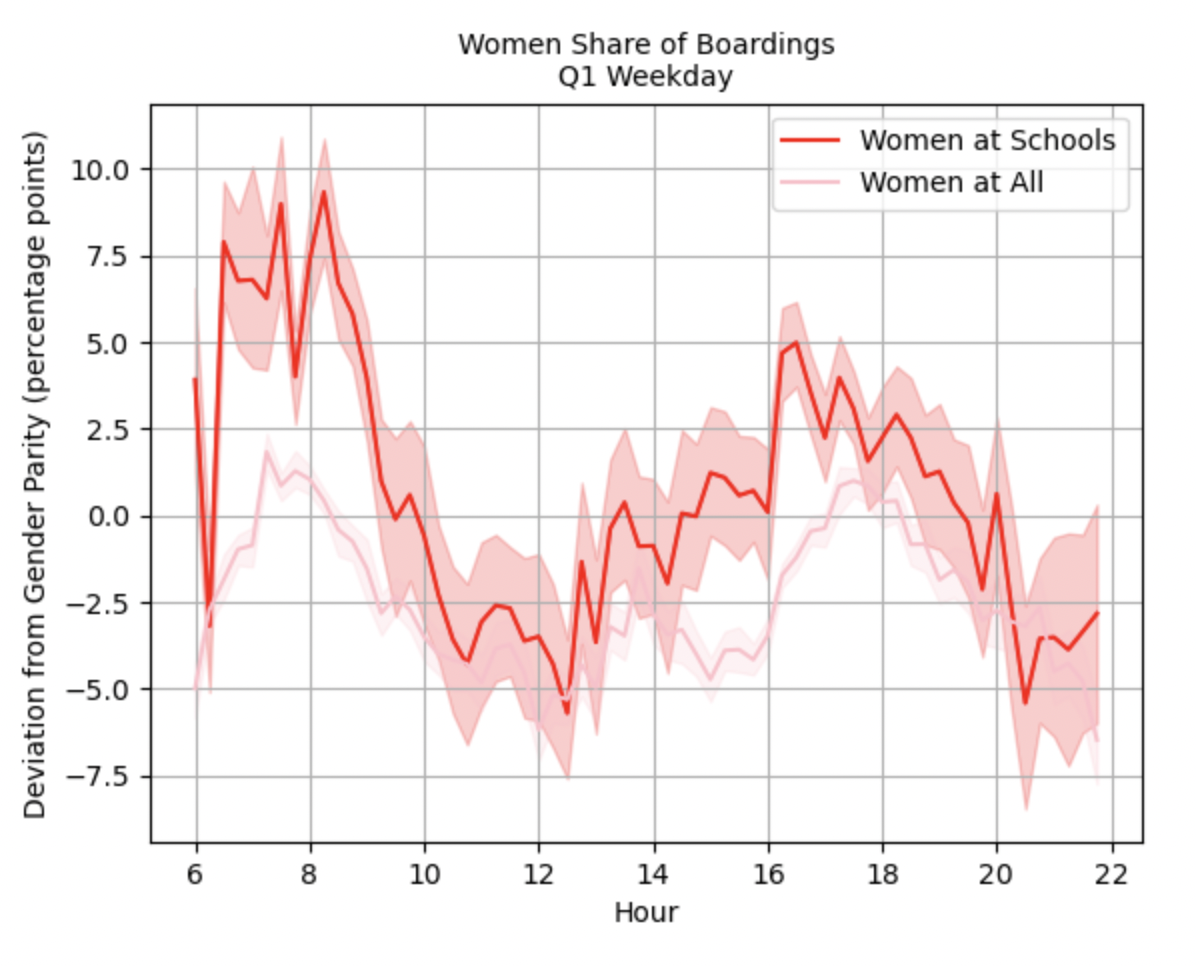
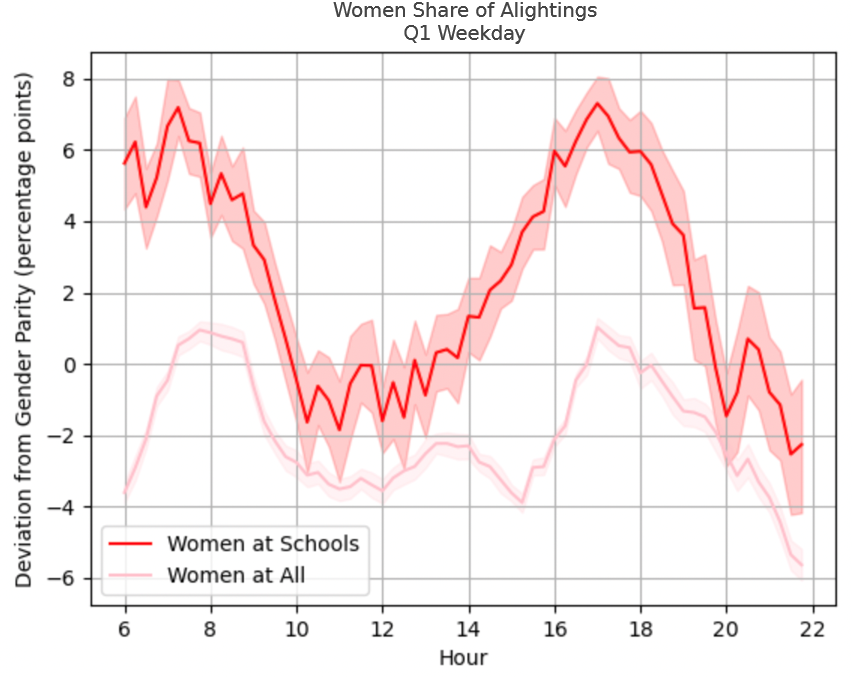
We observe a similar trend at stops near schools (8% of all stops): there are approximately 10% more women than men who board a subsequent stage after a presumed drop-off during peak hours. Similar to what we observed at daycares, the trend holds for school stops outside the city center, as well as when observing journey stages that end near school stops. One noticeable difference is that there is a narrower AM drop-off window with a steep decline beginning at 8 AM, which is the time when school starts for DC Public School students. Hence, this trend is extremely logical, which further validates that our workflow for identifying frequent riders and nearest stops to places of interest is successful.
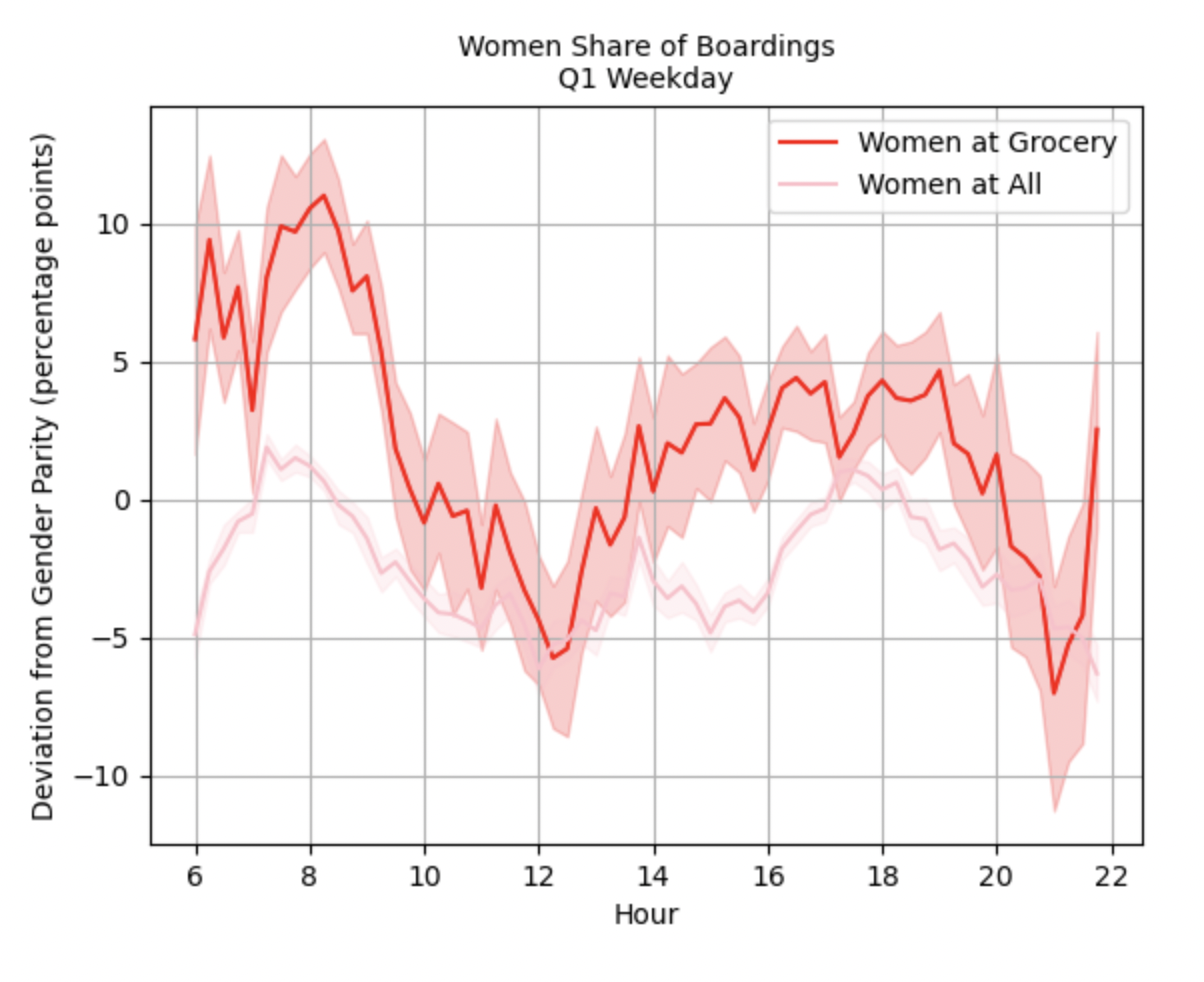
5.1.3 Grocery Stores
We observe a similar trend at grocery stores (2% of all stops). The confidence intervals, however, are generally wider, particularly in the afternoon suggesting higher variability. This may be attributed to grocery store locations typically being in areas with much higher mixed use as compared to daycares and schools. Evidence of this is that when we look at grocery store stops outside the city center illustrated in Figure 9(b), we see that there is less of a relationship between grocery store stops and an increase in the ratio of women travelers in the morning, where the trend is closer to the overall trend. However, the observed higher percentage of women during the PM hours is robust, as well as when we observe trips that end at stops near grocery stores illustrated in Figure 10, all with significantly tighter confidence intervals. It may also be because visits to grocery stores do not have set hours the way that daycare and school pick-up and drop-offs do.
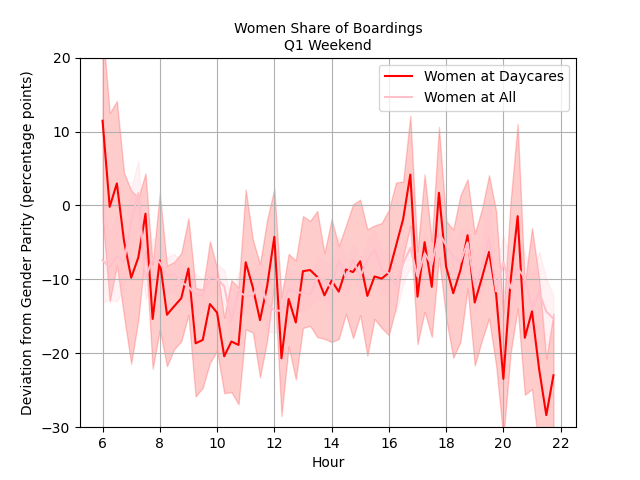
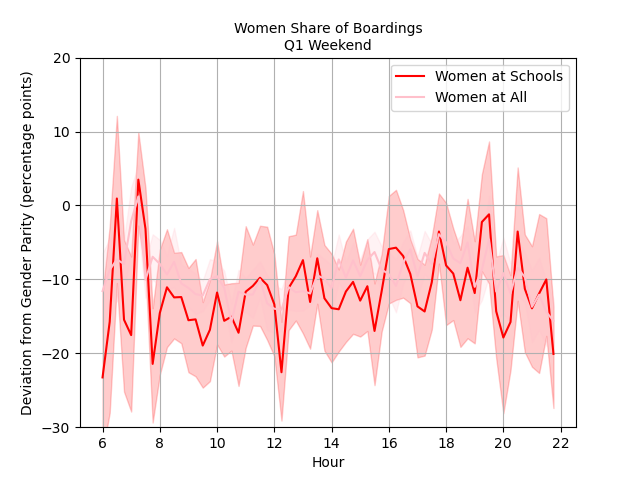
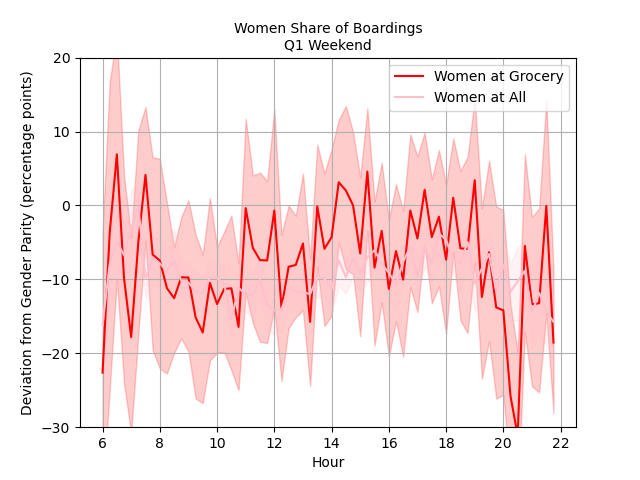
5.2 Comparing to Weekend Travel Pattern
Finally, we observe and compare the change in the ratio of women near mobility of care stops during the weekends. Overall, we observe significantly fewer women on the system on weekends, an average decrease of -10%. This is reflected by the overlapping trend lines for all stops and POI stops illustrated in Figure 11. This suggests that women conducting mobility of care trips are not more likely than men to travel to those POIs other than on weekdays at the hours we hypothesized, which further validates our methodology. A logical exception to this, however, is observed at the POI stops near grocery stores, where more women can be observed on weekends, in spite of the significant decrease in women riders overall on weekends. This is illustrated in Figure 11(c) with the average grocery store stops at gender parity and ones falling in the higher percentiles having an increase of over 10% women riders during the afternoon and early evening periods.
6 Conclusions
In this study, we propose and evaluate a data-driven workflow to capture and assess mobility of care trip-making behavior and present a case study in the National Capital Region using data from the Washington Metropolitan Area Transit Authority (WMATA). Using ODX data, a name-based gender inference approach to associate a likely gender with fare cardholder name, and geospatial analysis, we observed that women-classified cards indeed travel more often to mobility of care locations than men-classified cards. This deviation from gender parity is particularly observed during weekday mornings and afternoons, at times associated with higher activities at mobility of care POIs. For a gender-balanced dataset, we observed that approximately 60%-65% of the trips to and from stops near daycare centers were made by women-classified cards. This trend was similarly observed at schools and grocery stores and found consistent for those places of interest that fall outside the city center.
While a higher ratio of women near those POIs doesn’t guarantee a higher ratio of women at the facilities themselves, it does confirm a higher probability of women conducting mobility of care work. The findings of this study validate the findings of other studies in the literature, concluding that women are likely to conduct more mobility of care journeys than men. The majority of this disparity is observed at peak hours. This complements research on mobility of care trips, where women were found to travel on public transportation disproportionately for the purpose of accompaniment and care [10]. Given that we see a significant difference in gender ratio at daycares and schools during peak hours, we can assume that employed women are bearing the brunt of drop-offs and pick-ups for children in the National Capital Region, as well as chores related to grocery shopping.
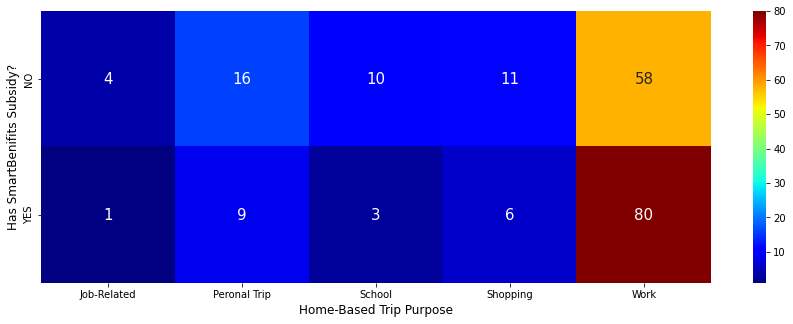
Further research is necessary to capture a wider array of individuals. As the literature suggests, income and employment status are strong variables affecting mobility of care travel patterns. Albeit the significant differences observed in gendered travel patterns, a limitation of this study is that it utilizes data that is mostly reflective of the travel behavior of full-time employed individuals, who registered their cards to enroll in the SmartBenefits program. In responses analyzed from a WMATA customer survey for their bus system users, women respondents who reported having a SmartBenefits subsidy indicated that 80% of their journeys are work-related. This percentage drops to 58% for women without a transit subsidy, who are traditionally far less likely to register their SmarTrip card. This shows the immense need for encouraging and incentivizing representative customer card data, which would enable additional gender-based analyses.
7 Acknowledgements
The authors would like to thank WMATA for their generous support of this project, and the MIT SuperCloud and Lincoln Laboratory Supercomputing Center for providing high-performance computing resources that have contributed to the research results reported in this paper.
8 Author Contribution Statement
The authors confirm their contribution to the paper as follows: study conception and design: D.S., A.A., A.S, K.C.; data collection: D.S., A.A.; analysis and interpretation of results: D.S., A.A., A.S.; draft manuscript preparation: D.S., A.A., A.S, K.C., M.P., I.S., J.Z. All authors reviewed the results and approved the final version of the manuscript. The authors do not have any conflicts of interest to declare.
References
- Sánchez De Madariaga [2013] Sánchez De Madariaga, I., From women in transport to gender in transport: challenging conceptual frameworks for improved policymaking. Journal of International affairs, 2013, pp. 43–65.
- Ravensbergen et al. [2022] Ravensbergen, L., J. Fournier, and A. El-Geneidy, Exploratory Analysis of Mobility of Care in Montreal, Canada. Transportation Research Record, Vol. 0, No. 0, 2022, p. 03611981221105070.
- Sánchez de Madariaga [2016] Sánchez de Madariaga, I., Mobility of care: Introducing new concepts in urban transport. In Fair shared cities, Routledge, 2016, pp. 51–66.
- UN Habitat [2018] UN Habitat, "Mobility of Care" – Ines Sanchez de Madariaga, 2018.
- Wilson et al. [2009] Wilson, N. H., J. Zhao, and A. Rahbee, The potential impact of automated data collection systems on urban public transport planning. In Schedule-based modeling of transportation networks, Springer, 2009, pp. 1–25.
- Gordon et al. [2013] Gordon, J. B., H. N. Koutsopoulos, N. H. M. Wilson, and J. P. Attanucci, Automated Inference of Linked Transit Journeys in London Using Fare-Transaction and Vehicle Location Data, 2013.
- Sánchez-Martínez [2017] Sánchez-Martínez, G. E., Inference of public transportation trip destinations by using fare transaction and vehicle location data: Dynamic programming approach. Transportation Research Record, Vol. 2652, No. 1, 2017, pp. 1–7.
- Gordon et al. [2018] Gordon, J. B., H. N. Koutsopoulos, and N. H. Wilson, Estimation of population origin–interchange–destination flows on multimodal transit networks. Transportation Research Part C: Emerging Technologies, Vol. 90, 2018, pp. 350–365.
- Goulet-Langlois et al. [2017] Goulet-Langlois, G., H. N. Koutsopoulos, Z. Zhao, and J. Zhao, Measuring regularity of individual travel patterns. IEEE Transactions on Intelligent Transportation Systems, Vol. 19, No. 5, 2017, pp. 1583–1592.
- Sánchez de Madariaga and Zucchini [2019] Sánchez de Madariaga, I. and E. Zucchini, Measuring Mobilities of Care, a Challenge for Transport Agendas: From One to Many Tracks, pp. 145–173, 2019.
- Los Angeles County Metropolitan Transportation Authority [2019] Los Angeles County Metropolitan Transportation Authority, Understanding How Women Travel. LA Metro, 2019.
- Gauvin et al. [2020] Gauvin, L., M. Tizzoni, S. Piaggesi, A. Young, N. Adler, S. Verhulst, L. Ferres, and C. Cattuto, Gender gaps in urban mobility. Vol. 7, No. 1, 2020, p. 11.
- Mark and Heinrichs [2019] Mark, L. and D. Heinrichs, More than time and money - Influences on mobility of low-income women in the Villa 20 in Buenos Aires, Argentina. Vol. 15, 2019, p. 100652.
- Ng and Acker [2018] Ng, W.-S. and A. Acker, Understanding Urban Travel Behaviour by Gender for Efficient and Equitable Transport Policies, 2018.
- Kwan [1999] Kwan, M.-P., Gender, the Home-Work Link, and Space-Time Patterns of Nonemployment Activities. Vol. 75, No. 4, 1999, pp. 370–394, publisher: [Clark University, Wiley].
- Nobis and Lenz [2005] Nobis, C. and B. Lenz, Gender Differences in Travel Patterns: Role of Employment Status and Household Structure, 2005, pp. 114–123.
- Office of Gender Mainstreaming, Stadt Wien [2022] Office of Gender Mainstreaming, Stadt Wien, Gender mainstreaming in Vienna, 2022.
- Ma et al. [2017] Ma, X., C. Liu, H. Wen, Y. Wang, and Y.-J. Wu, Understanding commuting patterns using transit smart card data. Journal of Transport Geography, Vol. 58, 2017, pp. 135–145.
- Kusakabe and Asakura [2014] Kusakabe, T. and Y. Asakura, Behavioural data mining of transit smart card data: A data fusion approach. Transportation Research Part C: Emerging Technologies, Vol. 46, 2014, pp. 179–191.
- Eichler [2022] Eichler, M., Linking Incidents to Customers (LINC): An Algorithm for Linking Incidents to Rail Customer Delays Inspired by Traffic Flow Theory. Transportation Research Record, Vol. 2676, No. 3, 2022, pp. 598–607.
- Bhaskar et al. [2014] Bhaskar, A., E. Chung, et al., Passenger segmentation using smart card data. IEEE Transactions on intelligent transportation systems, Vol. 16, No. 3, 2014, pp. 1537–1548.
- Liu and Ruths [2013] Liu, W. and D. Ruths, What’s in a name? using first names as features for gender inference in twitter. In 2013 AAAI Spring Symposium Series, 2013.
- Santamaría and Mihaljević [2018] Santamaría, L. and H. Mihaljević, Comparison and benchmark of name-to-gender inference services. PeerJ Computer Science, Vol. 4, 2018, p. e156.
- Nuessel [2017] Nuessel, F., A Note on Popular Baby Names on the Social Security Website: An Important Onomastic Resource. Names, Vol. 65, No. 1, 2017, pp. 45–50.
- D’ignazio and Klein [2020] D’ignazio, C. and L. F. Klein, Data feminism. MIT press, 2020.