AppReferences for the Appendix
The Golden City on the Edge:
Economic Geography and Jihad over Centuries111
We are grateful to Andrew Foster, Shuhei Kitamura, Stelios Michalopoulos, and Jared Rubin for invaluable discussions.
For helpful comments, we thank Dan Björkegren, Gabriel Brown, John Friedman, Tomohiro Hara, Peter Hull, Taylor Jaworski, Erik Kimbrough, Murat Kirdar, Motohiro Kumagai, Takashi Kurosaki, Avital Livny, Masaru Nagashima, Mike Neubauer, Henrique Pita Barros, Steve Pfaff, Louis Putterman, Devesh Rustagi, Bryce Steinberg, Yoshito Takasaki, Matt Turner, David Weil, Junichi Yamasaki, and audiences at Brown (Growth Lab, the development group, and Applied Micro Lunch), Chapman (IRES workshop), and the 4th JADE conference.
We thank Stelios Michalopoulos for sharing the shape file of historical trade routes and Nick Drake for sharing the shape file of ancient water sources.
Kubo acknowledges the Bravo Center Research Funding at Brown University.
Tsuda acknowledges financial support from the Interdisciplinary Opportunity Dissertation Completion Fellowship at Brown University and funding from the Murata Science Foundation.
All remaining errors are ours.
Abstract
This paper uncovers the evolution of cities and Islamist insurgencies, so called jihad, in the process of the reversal of fortune over the centuries.
In West Africa, water access in ancient periods predicts the locations of the core cities of inland trade routes—the trans-Saharan caravan routes—founded up to the 1800s, when historical Islamic states played significant economic roles before European colonization.
In contrast, ancient water access does not have a persistent influence on contemporary city formation and economic activities.
After European colonization and the invention of modern trading technologies, along with the constant shrinking of water sources, landlocked pre-colonial core cities contracted or became extinct.
Employing an instrumental variable strategy, we show that these deserted locations have today been replaced by battlefields for jihadist organizations.
We argue that the power relations between Islamic states and the European military during the 19th century colonial era shaped the persistence of jihadist ideology as a legacy of colonization.
Investigations into religious ideology related to jihadism, using individual-level surveys from Muslims, support this mechanism.
Moreover, the concentration of jihadist violence in “past-core-and-present-periphery” areas in West Africa is consistent with a global-scale phenomenon.
Finally, spillovers of violent events beyond these stylized locations are partly explained by organizational heterogeneity among competing factions (Al Qaeda and the Islamic State) over time.
Keywords: Cities, Colonization, Conflicts, History, Ideology, Islam, Persistence, Trade, Water
1 Introduction
Violence by Islamic extremist organizations, so-called jihad,444 The literal meaning of “jihad” in Arabic is “striving or exerting oneself (with regard to one’s religion)” (Cook 2015). But jihad also has a number of other meanings, such as “the effort to lead a good life, to make society more moral and just, and to spread Islam through preaching, teaching, or armed struggle” (Esposito 1999). See Cook (2015) for detailed discussions. Although there is controversy over whether the word’s interpretation is exclusively spiritual or if it includes military action, this paper uses the terms “jihadist violence” and “jihad” interchangeably. We broadly define a jihadist organization as a non-state group that aims to topple a government or to govern a particular region to establish an Islamic caliphate based on a strict interpretation of Shariah law. See Appendix D for more detailed organization-specific ideologies and goals. is a global threat. It has caught the world’s attention since the September 11 attacks by Al Qaeda. The recent rise of the Islamic State of Iraq and Syria (ISIS) has exacerbated this threat. While the ISIS has lost a significant portion of its territories in Syria and Iraq, jihadist violence remains widespread in other areas, including Africa. However, economics research to understanding determinants of jihad is scarce. Moreover, while jihadist violence has been drastically increasing in recent years, jihad is not only a contemporary phenomenon, but has in fact been cyclic over the centuries. Over the course of history, the spatial distribution of economic activities has also changed around the world. These facts suggest the importance of studying the economic geography and insurgent forces in a unified framework.
This paper investigates the evolution of cities and Islamist insurgencies with focuses on ancient, pre-colonial, colonial, and contemporary periods. We first identify the ancient origins of the core cities of inland trade routes—the trans-Saharan caravan routes—in West Africa founded up to the 1800s, when camels were the major transport mode and Islamic states played significant roles in the economy before European colonization. We next show that the landlocked pre-colonial core cities contracted or became extinct after European colonization and the invention of modern trading technologies, along with the constant shrinking of water sources. We then examine the persistent effects of the past presence of Islamic states along the inland trade routes. In particular, we estimate the effects of these deserted locations on contemporary jihad which drastically increased in the 2010s, by employing an instrumental variable strategy. We finally propose a mechanism that focuses on the power relations between Islamic states and European militaries during the early colonial era, argue that the concentration of jihadist violence in “past-core-and-present-periphery” areas is also a global-scale phenomenon, and investigate heterogeneity across jihadist organizations over time.
Both historical and contemporary factors matter for explaining the spatial distribution of economic activities over the centuries in West Africa. From a historical perspective, inlands in West Africa experienced a stark reversal of fortune over the centuries. In the pre-colonial era, economic activities were concentrated in landlocked areas where historical Islamic states had strong influences. The Islamic states played key roles in trade in the Saharan region over the past centuries. They conquered the trade routes and trafficked in goods and slaves. However, after Europeans (e.g., missionaries, scholars, and merchants) landed on the coastal areas in West Africa, the center of the economy gradually shifted from inland to coastal regions as Europeans carried on slave trading and public investments. From a contemporary perspective, in many developing countries, economic activity is often concentrated in a few large cities (especially in many coastal areas), while in other areas the economy is stagnant. In West Africa, this general spatial structure of inequality is exacerbated by insurgent activities. Violent events involving jihadist groups have been increasing in terms of both extensive and intensive margins. During the past decade in West Africa, the number of violent Islamic groups, the number of violent events involving them, and their geographical coverage have all been increasing.
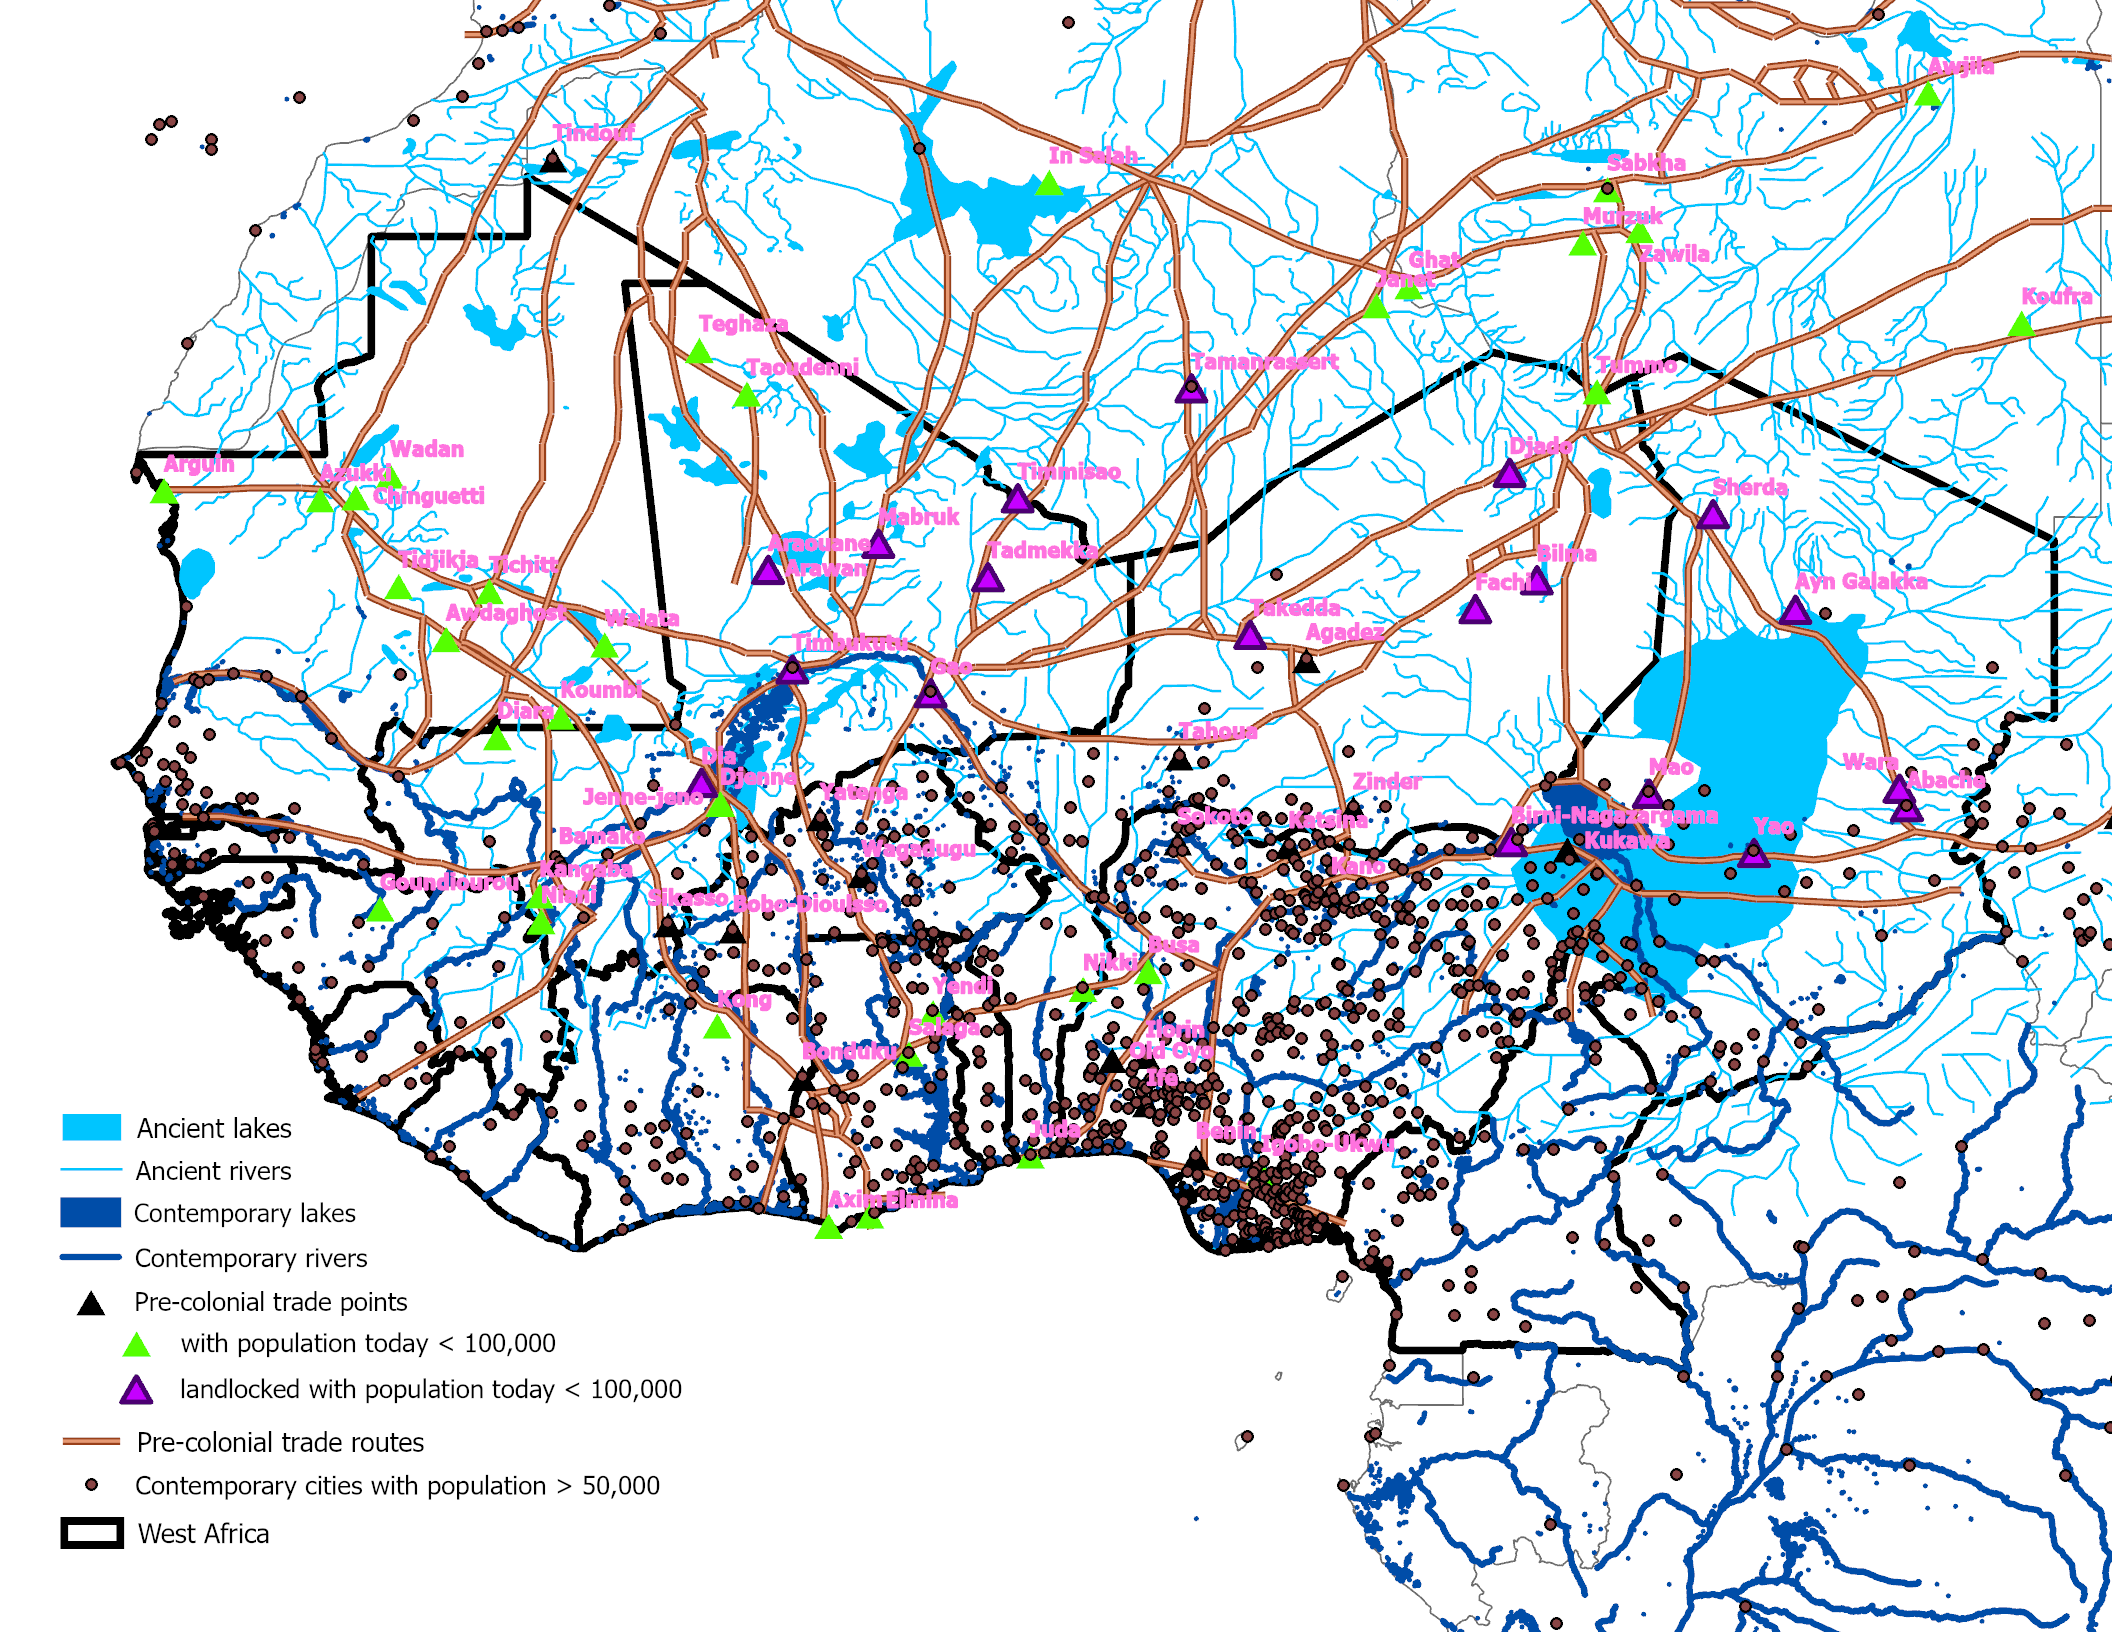
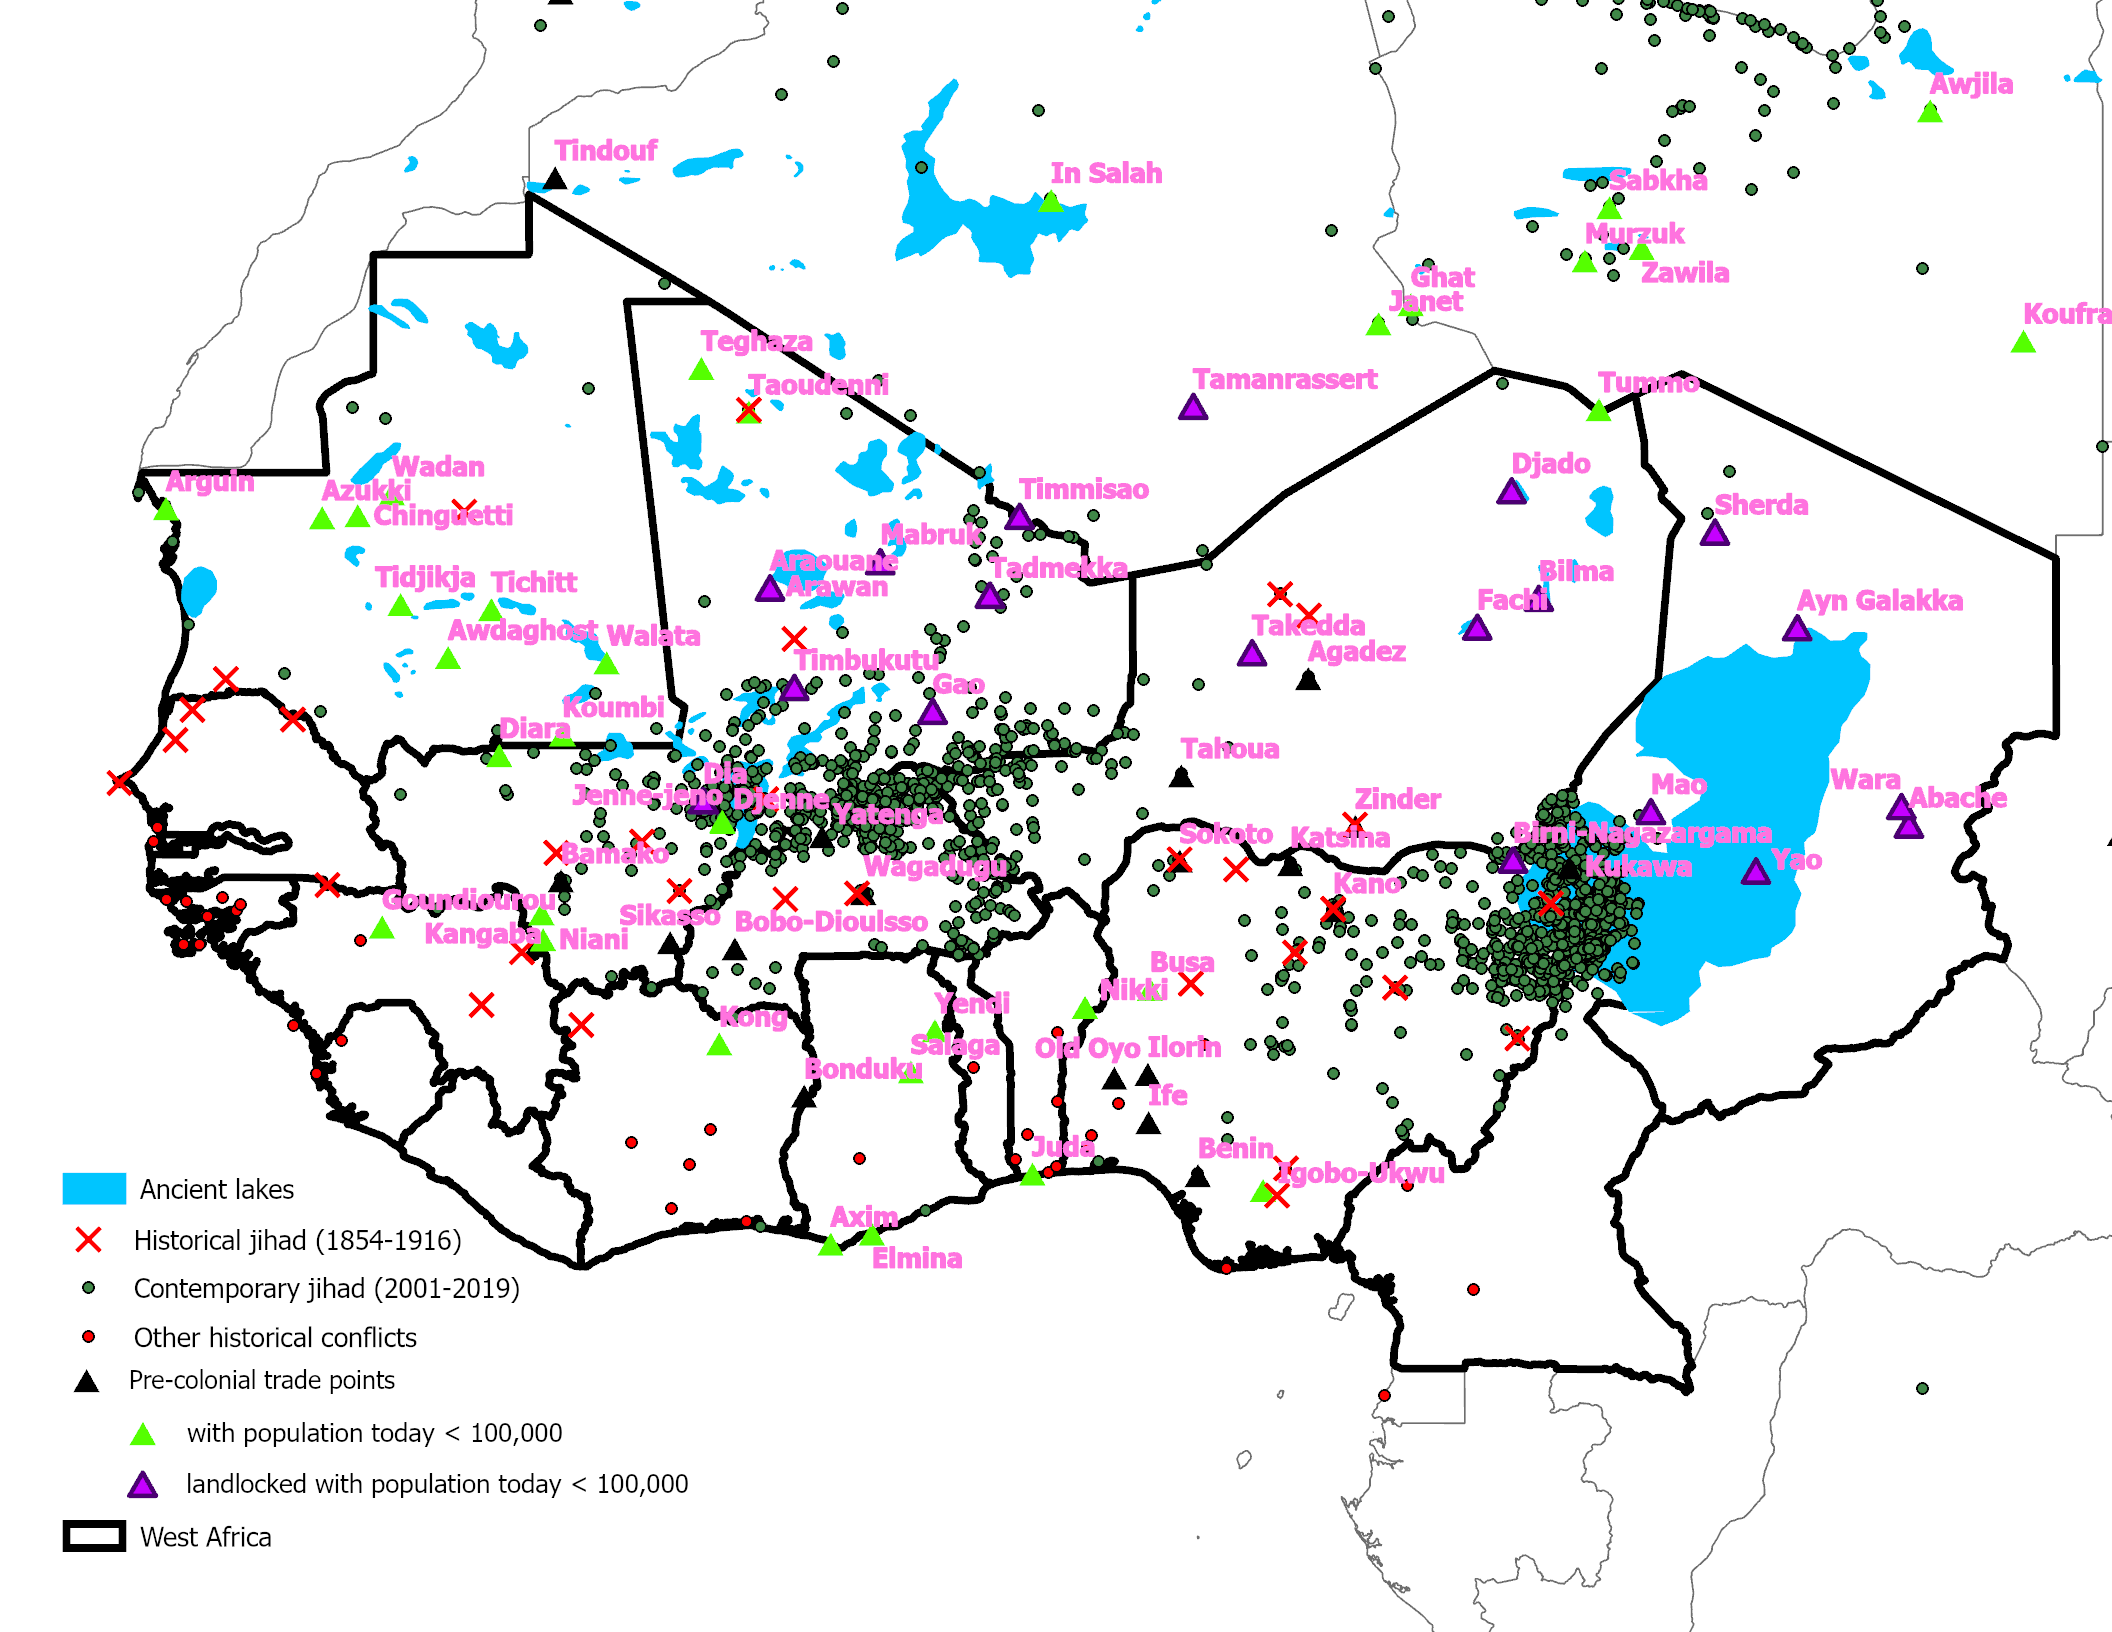
Mapping our primary data informs us of two stylized facts. The first pertains to the relationship between water sources and city formation over time. Figure 2 shows ancient and contemporary water sources (lakes and rivers), core trading points along the Trans-Saharan caravan routes, and contemporary cities. Among the pre-colonial cities, those that are landlocked and have now decayed are located close to ancient water sources.555 Timbuktu in modern Mali (Figure A.1) is a notable example. It was a trade hub under the Songhai Empire in the 15th and 16th centuries and thus called the “golden city.” However, this once golden city fell into the periphery: its economy remains underdeveloped (relative to the other major cities in Mali) in the modern era. For more detail about the development of pre-colonial states and cities, see section 2.1. Many are located close to ancient lakes (e.g., Timbukutu in Mali, Bilma in Niger, and several points around the Lake Chad). A few are not close to ancient lakes yet are very close to ancient rivers. However, we do not observe contemporary populated cities around these ancient water sources.
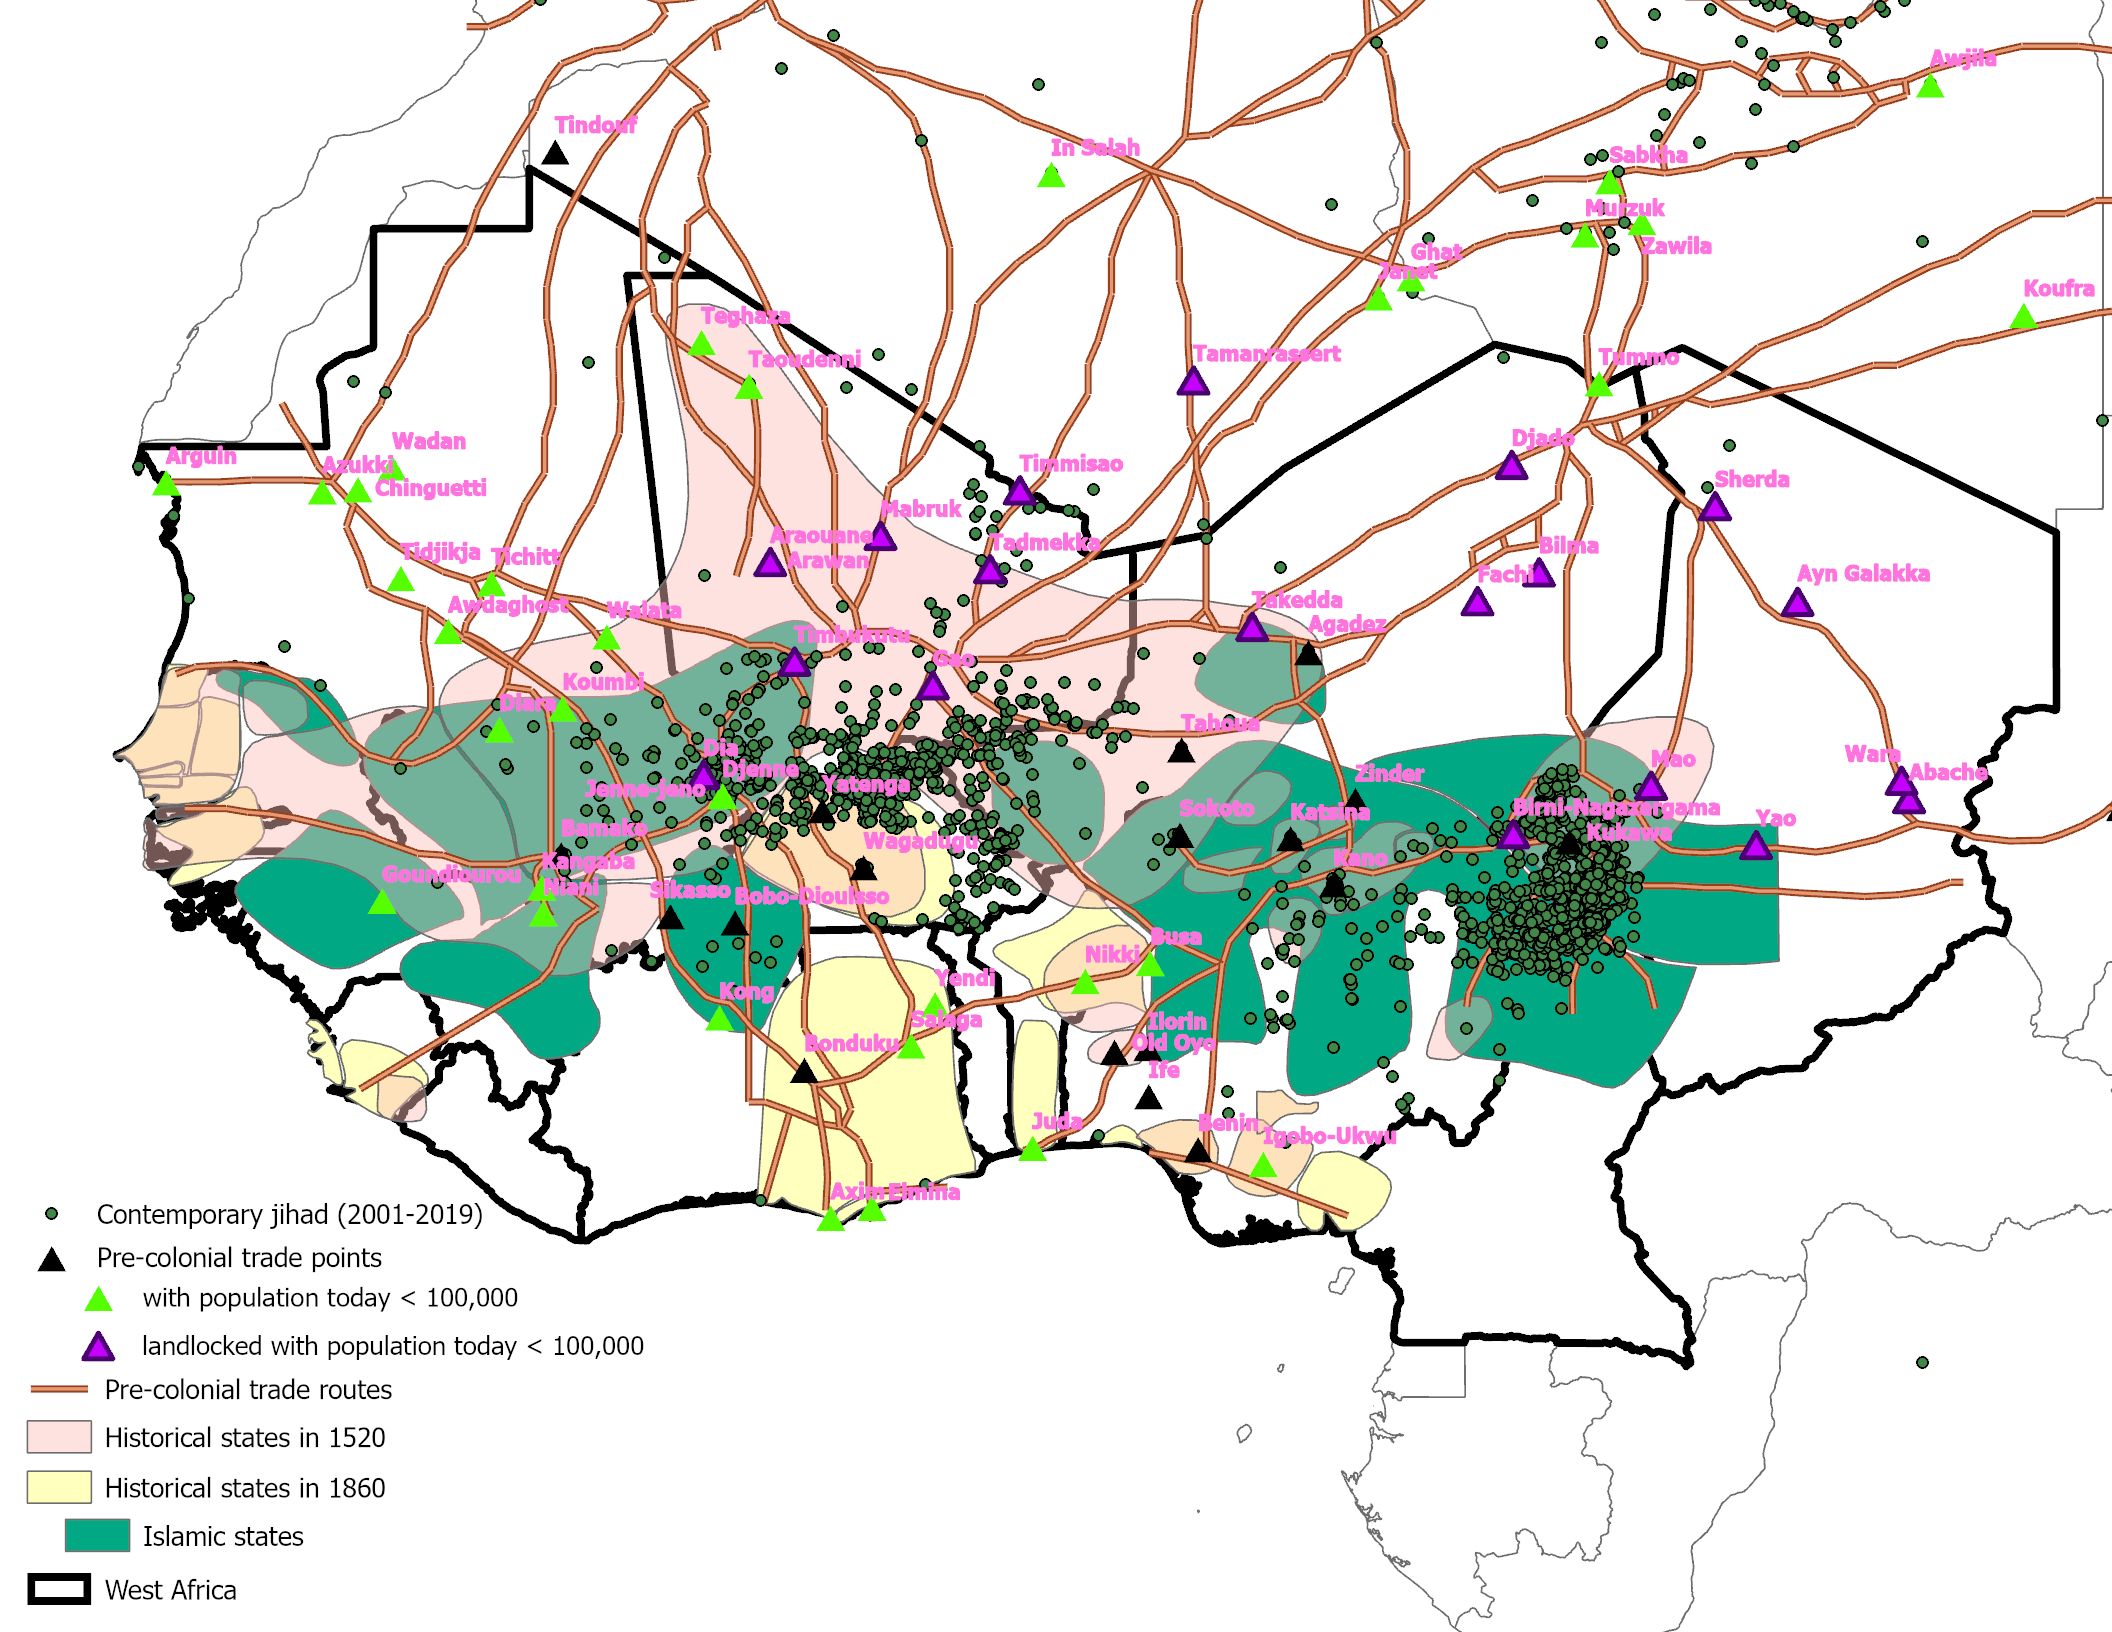
The second fact is tied to the relationship between historical civilizations in Islamic states and contemporary jihad. Figure 2 shows historical states (around the years 1520 and 1860), the trade points described above, and contemporary violent events by jihadist organizations. We observe concentrations of jihadist violence around some of the contracted and landlocked historical trade points (e.g., around Timbukutu, Dia, the north-east region of Mali, or the Lake Chad region). We also observe spillovers of jihadist violence beyond these stylized locations (e.g., around the border between Burkina Faso and Niger). Similarly, contemporary Islamic conflict events are concentrated in locations of historical Islamic states, but not in locations of historical non-Islamic states. Moreover, contemporary conflict events are concentrated only in a specific set of historical Islamic state locations. These observations suggest the importance of formally estimating the persistent effects of now-deserted historical cities as well as investigating several heterogeneities (across different historical Islamic states, contemporary jihadist organizations, and contemporary time periods) to explain these spillovers.
Motivated by these stylized facts, our empirical analysis has two goals. First, we aim to identify the origins of pre-colonial and contemporary city formations. Second, we intend to estimate the persistent influence of core pre-colonial trading cities in historical Islamic states on contemporary Islamist insurgencies. To examine these questions empirically, we construct artificial 0.5 × 0.5 degree (about 55km × 55km) grid cells covering the entirety of West Africa.
To identify city origins, we focus on the following first- and second-nature forces: the initial geography (the ancient lakes), the changing natural geography over time (i.e., the constant shrinking of water sources), and the opportunities for colonial investments by European countries. To estimate the persistent influence of historical Islamic states, we in particular focus on pre-colonial trading cities that satisfy two specific conditions—they are located inland and have small contemporary populations—for the following two reasons. First, in trade networks before the invention of modern trade technologies and the reversal of economic roles of inland and coastal areas, inland trading cities were the core and cities closer to the coast were the periphery. Second, the locations of inland pre-colonial cities with higher contemporary populations might have been more likely to be affected by contemporary unobserved factors that caused colonial investments and economic development. In order to study the persistent influence of past economic activities, it is desirable to focus on inland pre-colonial cities whose formation was largely determined by factors that do not exist today and that are not likely to directly affect contemporary jihadist activities.
In the second stage, we employ ancient water accessibility as an instrument. In addition to exogenous water access in ancient periods, we need the following identifying assumption for causal inference. Water access in ancient periods influences contemporary outcomes only through its effect on shaping economic activities in historical states before colonization. That is, after controlling for observable geographical characteristics, the unobservable factors of contemporary Islamist insurgencies are uncorrelated with water access in ancient periods. The following two arguments support this assumption. First, most ancient lakes have now disappeared because of exogenous long-term climate and environmental changes. Therefore, the ancient lakes are not likely to have a direct influence on contemporary jihadist activities. Second, we empirically show that the accessibility of ancient water sources is mostly uncorrelated with pre-determined characteristics, including geographical conditions and pre-colonial variables of culture and institution.
Figure 3 summarizes three main results. First, proximity to ancient lakes strongly predicts only the locations of the core inland pre-colonial cities that have small populations today. This instrument has higher power for predicting these pre-colonial city locations than it does for any other possible combinations of historical cities. Second, there is a lack of persistent effects of this initial geography on contemporary city formation and economic activities. Instead, changing natural geography (the shift in water sources) and colonial investment strongly explain them. Third, the second-stage regression results confirm that a grid cell closer to the core inland colonial cities is also more likely to be closer to jihadist violence and to experience its onset with higher intensities on average during the past decade. This effect is specific to jihad and does not apply to general conflicts. These results are robust to the sample of Muslim-dominated locations, suggesting that the main results are not driven by differences in the population shares of Christians and Muslims across locations, and to alternative definitions of contemporary small cities, indicating that the main results are also not driven by the simplistic theory that jihad occurs in populated locations (i.e., with a large pool of targets).
We propose that the primary mechanism behind these empirical results is persistent jihadist ideology as a legacy of European colonization. The Islamic states with better access to weapons adopted the confrontation strategy against European colonizers and fought more intensely with them. Consequently, the European forces militarily defeated such states. These states ceased to exist, and the seeds of jihadist ideology in them also diminished. In contrast, the Islamic states with worse access to weapons did not fight as intensely against European forces due to the extreme and obvious asymmetry in fighting power between them. In these circumstances, such states followed strategies of alliance, acquiescence, or submission with respect to European forces. These states also ceased to exist, but the seeds of jihadist ideology in them did not diminish, which has caused future jihads. We provide arguments supporting this mechanism by showing the cycle of jihad with distinct spatial distributions over the centuries, varying intensities of historical jihads across locations, historical records of the strategies adopted by Islamic states against colonization forces, and anecdotes. We provide further supportive evidence, drawn from individual-level survey data from Muslims, that religious ideology related to jihadism (such as excluding other religions, governing a country by religious law, and limiting female education) is concentrated in the locations of pre-colonial cities. Overall, these arguments imply that how conflicts end matters for future conflicts.
From empirical analyses so far, we have learnt that, in general, contemporary jihadist activities are concentrated around “past-core-and-present-periphery” locations. In other words, contemporary jihads occur in areas that experienced reversals of fortune over the centuries. We argue that this pattern holds on the global scale as well, drawing on the global-level information about historical population, overland trade routes, and contemporary Muslim populations and jihad. The cases of Afghanistan, Pakistan, Iraq, and Syria, as well as observations of the routes leading from Asia to Europe, reinforce this view.
In order to explain deviations from the expected pathways from history, i.e., to understand the spillovers of jihadist events beyond the stylized locations predicted by the pre-colonial cities, we investigate two dimensions of heterogeneity.
First, the explanatory power of historical determinants is highly heterogeneous across different contemporary time periods.
In particular, the persistence of history has diminished since the competition between Al Qaeda and the Islamic State (IS) in the global jihadist movement became more harsh.
Second, historical and locational dependence and persistence are highly heterogeneous across jihadist groups affliated with Al Qaeda, IS, and Boko Haram—the three largest factions in West Africa.
Although uncovering the exact causal mechanism behind this across-group heterogeneity is left to future research, we provide one interpretation consistent with these results, from the perspective of groups’ organizational structures and operation strategies, by bringing in an additional district-level dataset.
Related literature. This paper contributes to four strands of literature. First, this paper contributes to the literature on the economics of conflicts, being closely connected to research on the historical origins of contemporary conflicts (Arbatlı et al. 2020; Boxell et al. 2019; Besley and Reynal-Querol 2014; Depetris-Chauvin 2015; Depetris-Chauvin and Özak 2020; Heldring 2021; Jha 2013; Michalopoulos and Papaioannou 2016; Moscona et al. 2020). In particular, Depetris-Chauvin (2015) and Heldring (2021), which examine the relationship between historical states and contemporary conflicts, are most relevant to our work.666 Depetris-Chauvin (2015) documents the negative relationship between the political centralization of historical states in 1000–1850 CE and contemporary civil conflicts. Heldring (2021) examines the effect of exposure to historical state institutions under centralized rule one century earlier on contemporary violence in Rwanda. He argues the culturally transmitted norm of obedience as the primary mechanism behind this result, supported by differential impacts interacted with contemporary government policies and by lab-in-the field experiments to measure rule-following behavior. These papers focus on the historical presences of state-like institutions and look at the persistence of these institutions. Our study differs because we focus on a particular institution, Islam, among historical states. This paper is also related to theoretical arguments about cycles and the persistence of conflicts (Acemoglu et al. 2010; Acemoglu and Wolitzky 2014; Rohner et al. 2013). Empirical investigations are scarce, with the exception Besley and Reynal-Querol (2014), which documents the positive correlation between historical and post-colonial conflict. In addition to arguing that jihad is cyclical, this paper adds the new view that how conflicts end matters for future conflicts. In this respect, this paper also relates to the historical legacy of conflict (e.g., Dincecco et al. 2019). Moreover, this paper contributes to our understanding of the deep causes of conflicts and violence involving jihadist organizations. As there is little knowledge on violent Islamic extremism in economics, either theoretically or empirically, with only a few exceptions (e.g., Berman 2011), this paper can be expected to open up a new research area.777 Several studies examine the contemporary determinants of jihadist violence, focusing on counterinsurgency forces and strategies (e.g., Berman et al. 2011; Fetzer et al. 2021) and on other exogenous shocks such as climate change (McGuirk and Nunn 2022), election timings (Condra et al. 2018), marriage market (Rexer 2021), silver prices (Limodio 2021), and unemployment (Brockmeyer et al. 2022). These structural factors can in theory be applied to general insurgent forces, not restricted to jihad. However, our story is more specific to understanding the stylized spatial distribution of jihadist violence on both a localized (West Africa) and global scale.
Second, this paper is related to the literature on the deep roots of economic development and the persistent effects of historical institutions in Africa (see Michalopoulos and Papaioannou 2020 for a review), and in particular, to studies of the legacy of colonization in Africa (Bauer et al. 2022; Canning et al. 2021; García Ponce and Wantchekon 2011; Heldring and Robinson 2018; Huillery 2011; Michalopoulos and Papaioannou 2013; Nunn and Puga 2012; Okoye et al. 2019). This paper contributes to this research stream in three ways. First, it explores the dynamics of natural geography. Previous studies have used data about contemporary natural geography to study pre-modern human settlements, implicitly assuming the fixed variation of natural geography (e.g., Michalopoulos 2012). This paper instead emphasizes the distinctive role of the ancient lakes, as compared to contemporary water sources, in pre-modern human settlements and economic activity. Second, this paper examines the persistence of jihadist ideology and the eruptions of jihadist events long after the colonial oppression. Previous studies have observed the backlash of physical and cultural oppression only in the short run (García Ponce and Wantchekon 2011; Fouka 2020). In contrast, this paper observes the eruptions of jihadist events after around 50 years of independence from a colonial power. Third, this paper exploits variation within the Islamic world, focusing on proximity to the core trading cities circa 1800. In Africa, pre-colonial states are closely related to pre-colonial trade and contemporary development (Fenske 2014; Michalopoulos and Papaioannou 2013). By discussing different strategies against colonization within the Islamic world, we dig deeper into the legacy of the pre-colonial trade cities for contemporary economic development.
Third, this paper is connected to the long-standing literature about economic geography focusing on persistence and path dependence (Allen and Donaldson 2021 and the references therein). In particular, it is closely tied to recent research that empirically investigates the origins of cities and economic activities through geographical fundamentals and history (e.g., Alix-Garcia and Sellars 2020; Bakker et al. 2021; Bleakley and Lin 2012; Bosker and Buringh 2017; Brown and Cuberes 2020; Ellingsen 2021; Henderson et al. 2018; Jedwab et al. 2017; Maloney and Valencia Caicedo 2016; Michaels and Rauch 2018; Nagy 2020; Redding et al. 2011). Like these studies, we investigate both first- and second-nature forces (natural geography, especially water sources, and local historical shocks, especially colonization and technological change in trade) to understand the persistence and path dependence of economic activities. However, this paper is distinct from the previous literature in two ways. First, it exploits the effects of changing natural geography over a long horizon, while most previous research has only examined the changing effects of fixed natural geography over time, albeit with some recent exceptions (Allen et al. 2020; Jedwab et al. 2022; Seror 2020). Second, this paper finds not only a lack of persistence of initial geography (ancient water) on typical economic activities (modern city formation) but also its persistence on peculiar activities (jihadist activities). This contribution emphasizes the importance of incorporating political factors, such as incentives for coordination or engagement in conflicts, in a framework of economic geography. In this respect, this paper is most closely related to Allen et al. (2020) and Kitamura and Lagerlöf (2021).
Lastly, this paper is related to the broader literature on the Islamic economy (see Iyer 2016 and Kuran 2018 for its review).
Several previous studies investigated the historical, geographical, and institutional determinants of the spread (e.g., Bazzi et al. 2020; Michalopoulos et al. 2016; Michalopoulos et al. 2018), the politics (e.g., Chaney 2013; Chaney et al. 2012), and the economic performance (e.g., Alesina et al. 2020; Bosker et al. 2013; Rubin 2017) of Islam.
However, there is little research on the determinants of jihadist violence, without which it is difficult to characterize the state of the modern Islamic economy.
Why do jihadist activities take place in some places but not in others within the Islamic world?
This paper partly fills this knowledge gap by tracing this question back to its ancient and pre-colonial origins and linking jihad to economic geography.
Roadmap. Section 2 describes the historical backgrounds of pre-colonial cities, Islamic states, and Western colonization in West Africa. Section 3 introduces data sources. Section 4 presents empirical strategy and results. Section 5 investigates the mechanism behind the empirical results. Section 6 provides further discussion. Section 7 concludes the paper.
2 Historical Background
We provide the historical backgrounds of Islamic states from pre-colonial period to the independence period. First, we detail the spread of Islam and Islamic pre-colonial states and cities with historical anecdotes. Second, we describe how Islamic states in the 19th century emerged and their access to weapons. Finally, we summarize how Islamic states reacted against European colonization and about Muslims in the colonial and independence periods.
2.1 Pre-Colonial Cities and Islam in West Africa
Back to five thousands years ago, with the ample lakes and rivers, the Sahara was attractive to human settlements (Drake et al. 2011). After the African Humid Period (AHP), water sources in the Sahara became gradually depleted, which resulted in the Sahara Desert. Nevertheless, the Sahara Desert, “one of the world’s greatest barriers to human movement” was bridged by trade, which led to the births of the core trading cities (Bovill 1968; Connah 1987, p.98).
At the first millennium AD, a primal position with natural resources such as gold and salt exchanged with the North African empires primarily brought the power and economic prosperity in the Ghana Empire (Trimingham 1962; Chu and Skinner 1965). After the collapse of the Ghana Empire in 1235, the Muslim king Sundiata founded the Mali Empire. The empire situated in full savanna, also well provided with natural resources, including control of gold-bearing area. With the trade contact with North Africa, the Mali Empire spread Islam, embracing large numbers of subject states of diverse populations (Trimingham 1962, p.61). In the 15th and the 16th centuries, as the Mali Empire became weakened, the Songhai Empire with the Muslim kings gained power and brought a brilliant civilization (Trimingham 1962; Ki-Zerbo et al. 1997).
Timbuktu, located in the modern West African country of Mali, is an exemplary example of the core trading cities governed by the Islamic states. It was the second capital of Songhai Empire and had experienced the “Golden Age” in the 15th and 16th centuries (Singleton 2004; Austen 2010, p.57) until it was invaded by Moroccans in 1590s. The shaded boundaries in Figure 2 represent historical states in the 16th century, including the Songhai Empire in the center. In the writing of al-Sa’di about Jenne (near Timbuktu) in 1655, “caravans flock to Timbuktu from all points of horizon” (translated by Connah 1987, p.97). Also, Timbuktu was not only the center of trade network but also a scholarly center (Kane 2017).
Near Timbuktu, Gao was also an important center of Saharan trade even before the Islamic era and became an early attraction for trans-Saharan commerce (Austen 2010, p.57). Sailing down the Niger river (he was calling it “Nile”) from Timbuktu (Tumbuktá), Ibn Battuta reached Gao (Gawgaw) in 1353 at the age of Mali Empire depicted in the top left map in Figure B.1. He describes the prosperity of Gao in Battuta (2004):
“I went on from there to Gawgaw [Gogo], which is a large city on the Nile, and one of the finest towns in the Negrolands. It is also one of their biggest and best-provisioned towns, with rice in plenty, milk, and fish, and there is a species of cucumber there called ‘inán which has no equal. The buying and selling of its inhabitants is done with cowry-shells, and the same is the case at Mállí.”
Bilma and Taoudenni were also indispensable trading centers with salt production. Trans-Saharan caravans exchanged their Mediterranean goods for salt and passed through as a transit point to the Sudan (Austen 2010, p.38).
The core trading cities in the pre-colonial period has gradually declined as the European reached to the coastal trading posts. Austen (2010) writes “the beginning of the twentieth century clearly marks the end of trans-Saharan trade as a significant avenue of international commerce.” Since then, the economy in West Africa moved away from the desert toward the Atlantic Ocean (Austen 2010, p.119).
2.2 Islamic States in the 19th Century
From the 17th to the early 19th century, the first wave of jihad occurred throughout Africa, which mainly aimed for purification and extension of Islam and Islamic law (Curtin 1971; Walther and Miles 2017; Ruthven et al. 2004, p.74-75). According to Lovejoy (2016), “the idea of jihad was rooted in the confrontation of established political authority through the purification of Islamic practice and the imposition of governments that were forcefully committed to governance on the basis of Islamic law and tradition.” The green areas in Figure 2 represent pre-colonial Islamic states in the 19th century, some of which involved in jihad against the colonization forces.
The Futa Jallon jihad was done by the Muslim settlers with Fulani pastoralists against the dominant Jalonke landlords to whom they paid taxes on trade and cattle (Lapidus 2002, p.418). The Futa Toro jihad was conducted by religious teachers who took Muslim leadership and itinerant beggars. They rebelled against the local dynasty in protest of fiscal oppression and lack of protection from Mauritanian raids (Lapidus 2002, p.419). Sokoto Califate was founded by Islamic scholar, ’Uthman Don Fodio, who conducted the jihad against the rulers of Gobir.
Among the Islamic states in the same period, Kong and Samori (Wassoulou) empires were established by Muslim merchants and traders. Rather than jihads, their aim was to control over trade without dependence on states. Hence, commercial considerations outweighed Islamic factors in the state formation process (Azarya 1980, p.428).
From the 15th century before colonization, the Atlantic slave trades intensified and fostered the spread of weapons in West Africa. Due to slave raids, individuals and communities obtained weapons, such as iron knives, spears, swords or firearms to defend themselves. These weapons could be obtained from Europeans in exchange for slaves. As a result, slave raids intensified and to protect oneself, individuals and communities seek for weapons. This vicious cycle has been named “gun-slave cycle” (e.g., Lovejoy 2011) or the “iron-slave cycle” (e.g., Hawthorne 2003) among historians. Not only local communities but also states engaged in slave raids to finance army purchases. They purchased firearms and horses which the European traders began to bring large quantities for sale (Law 1976, p.72). For example, Samori, the leader of the Wassoulou Empire, financed arms purchases from the exchange of slaves for horses in the Sahel and Mossi regions (Boahen 1985, p.123). Bornu actively engaged in slave raiding in order to finance trade with the Ottoman Empire in exchange for weapons and luxury goods (e.g., Lovejoy 2011, p.69 and Lapidus 2002, p.405).
2.3 Muslims during the Western Colonization and Independence Periods
During the period 1880 to 1914, Europeans, mainly the French and the British, brought the whole of West Africa except Liberia under colonial rule. The French brought West Africa under control exclusively by military conquest rather than the treaties of protectorate as the British did (Boahen 1985 p.117) 888There are discussions about how aggressive the French imperialists were (McGowan 1981, p.245).. Africans resorted to three options against colonization: confrontation, alliance and acquiescence or submission (Boahen 1985 p.117).999 Appendix F provides historical evidence of strategies taken by Islamic states. The land of Islam falling into hands of non-Muslim and colonial powers caused confrontations between some Islamic states and colonial conquests, the second wave jihad (Walther and Miles 2017).
While some Muslim reactions against the French and the British invasion was militant, after the consolidation, there was little armed resistance. Afterwards, Muslim opposition to foreign rule could generally be expressed only indirectly through schools, reform movements, and Sufi-led brotherhoods (Lapidus 2002, p.737). The Bamidele movement in Ibadan (Nigeria), for example, insisted on preserving Arabic usage, Muslim dress, and reformed Islamic practices. Muslim ethnic groups such as the Hausas and Yorubas were organized to protect Muslim identity.
The colonial powers regarded Muslims as culturally and educationally more advanced than non-Muslim Africans, and appointed Muslim chiefs and clerks as administrators in non-Muslim areas (Lapidus 2002, p.736). However, most Sudanic and West African peoples were and are ruled by narrow—often military—elites, in the name of interests and ideologies that do not, with some exceptions, reflect the values and identities of the masses. The new elites were commonly non-Muslims and were primarily concerned with political and economic modernization. They accepted Islam as a “personal religion” on a par with Christianity and not necessarily as relevant to the political order (Lapidus 2002, p.736).
In both the colonial and independence periods there were significant conversions to Islam among pagan peoples. Between 1900 and 1960, the Muslim population of West Africa approximately doubled, and continues to grow substantially (Lapidus 2002, p.736).
3 Data
The main data and their sources are as follows. Appendix C describes other data.
Pre-Colonial Islamic states. Cultures of West Africa creates the maps that show spatial locations of historical states before colonization as well as modern countries after independence by using multiple sources of references.101010The references and maps are available in the website. We digitize maps of historical states over the centuries from pre-colonial periods to the colonial era (Figure B.1 and Figure B.2). In Appendix B, we describe how to identify Islamic states in detail.
Pre-colonial trade routes and points. We rely on three sources: O’Brien (1999), Kennedy (2002), and Bossard (2014). They provide us with historical trade routes, trade points and ancient cities in pre-colonial period. Regarding the trade routes, we use the mapped ones before 1800 in Kennedy (2002) supplemented by O’Brien (1999). They were digitized by Michalopoulos et al. (2018).111111We appreciate the authors for their generosities to share the digitized data. To identify cities that have been declined or obsolete nowadays, we make use of Bossard (2014) (Map 1.15 p. 39) that shows ancient cities and present day cities on the pre-colonial routes based on multiple sources. Also, we utilize O’Brien (1999) and Kennedy (2002) for information of those cities by using current population information.
History of Sahara. We use the map of ancient lakes and rivers (more than 5 thousand years ago) constructed by Drake et al. (2011).121212 During the “African Humid Period” from around 10,000 years ago, the Sahara enjoyed climatic and environmental conditions favourable for human habitation and cattle raising and it has been referred as the “Green Sahara” (e.g., deMenocal et al. 2000; Dunne et al. 2012). We rely on the map of ancient water sources depicted by a cartographer, Carl Churchill. It is available here. They assess and map the paleohydrology of the entire Sahara. In particular, they use a digital elevation model (DEM) and Landsat satellite imageries to identify ancient river channels and lake shorelines. Ancient lake areas were then basically estimated from the shorelines identified by the DEM. As a complement, remote sensing is also being used to map lake sediment outcrops, which are readily distinguished from other materials observed in the satellite imageries. For more technical details, see Drake and Bristow (2006) and the Supporting Information of Drake et al. (2011).
Contemporary cities. We have two sets of contemporary cities. As the first contemporary city data, we use Urban Centre database UCDB R2019A. This database identifies the cities with over 50,000 population in 2015 all over the world and provides their geolocations. We also construct the contemporary city data with over 10,000 population the countries covering the Sahara (i.e., Chad, Niger, Mali and Mauritania) by using Wikipedia (Figure A.2). For the population information, we assign the information on Wikipedia which is mainly based on the available census between 2005 and 2013.
Night lights. We rely on the two data source. One of which comes from the Defense Meteorological Satellite Program’(DMSP) s Operational Linescan System, which covers from 1992 to 2013. The other data comes from the Visible Infrared Imaging Radiometer Suite (VIIRS), which covers from 2012 to 2020.131313 The detailed explanations and discussions about the night light luminosity data can be found in Chen and Nordhaus (2015), Elvidge et al. (2021), Gibson et al. (2020), and Gibson et al. (2021)
Jihadist groups in the contemporary world. The main data source for contemporary conflict events and actors involved in conflicts is Armed Conflict Location and Event Data (ACLED, Raleigh et al. 2010). Each actor appeared in ACLED is classified into an Islamist group or not by hand. Information about violent Islamist groups causing contemporary conflicts is drawn from several sources. Information sources include ACLED reports, Africa Center for Strategic Studies (ACSS), Mapping Millitants Project (MMP), the Foundations of Rebel Group Emergence (FORGE) Dataset, and Walther and Miles (2017). Appendix D lists major jihadist groups and their stated ideologies and goals.
Contemporary conflict events involving jihadist groups. We restrict our event-level observations from ACLED in the following manner to pick jihadist violence. First, we focus on violent events involving jihadist groups, defined above, categorized as either rebel groups or political militias between 2001 and 2019 (from the year of 9/11 to the year before the COVID-19 pandemic).141414 See the codebook ACLED (2019) for detailed classifications of conflict actors. Rebel groups are defined as “political organizations whose goal is to counter an established national governing regime by violent acts.” Political militias are defined as “a more diverse set of violent actors, who are often created for a specific purpose or during a specific time period and for the furtherance of a political purpose by violence.” Second, we select the following two types of violent events involving the Islamic groups. The first type is violence against state forces in a broad sense. In this type, opponents include both government actors in the country where each event is observed and external/other forces (international organizations, state forces active outside their main country of operation, private security firms and their armed employees, and hired mercenaries acting independently). This event type contains both battles and explosions/remote violence in terms of the classification by ACLED. The second type is violence against civilians. In terms of the classification by ACLED, this event type contains both violence against civilians and explosions/remote violence if civilians are targeted. Note that there is no fatality minimum necessary for inclusions in these events.151515 According to ACLED (2019), a battle is defined as “a violent interaction between two politically organized armed groups at a particular time and location.” Explosions/Remote violence are defined as “one-sided violent events in which the tool for engaging in conflict creates asymmetry by taking away the ability of the target to respond.” Violence against civilians is defined as “violent events where an organized armed group deliberately inflicts violence upon unarmed non-combatants.” We exclude violent interactions between Islamic groups and other non-state actors. Indeed, the selected two types of violent events comprise more than 90 percent of the total violent events involving Islamist groups. Figure A.3 shows violent events involving jihadist groups from 2001 to 2019 in West Africa.
Conflict events versus European conquests. Our source of data on the incidence of conflict against European conquests is Brecke (1999).161616 Raw data is available in this website. Previous research (e.g., Besley and Reynal-Querol 2014 and Fenske and Kala 2017) also made use of Brecke’s database. This database records conflicts with at least 32 deaths between 1400 and 2000. According to Brecke (2012), the conflicts include interstate war, rebellions, and domestic political conflicts. For each conflict, it provides us with name of actors, start and end year and region of its onset. The actors are political entities possessing effective sovereignty over different territories (e.g., state, kingdom, sub-national groups). We use information of conflicts where the actors are historical states and European countries in West Africa. Table E.1 lists all the colonial conflicts involving historical states in West Africa. In total, the database records 42 conflict events while 15 conflict events involve Islamic states.
4 Empirical Analysis
In order to achieve the ultimate goal of understanding the economic geography and jihad over the centuries, our empirical analysis has two sub-goals. First, we aim to identify the origins of pre-colonial and contemporary city formations. Second, we intend to estimate the persistent influence of core pre-colonial trading cities around historical Islamic states on contemporary Islamist insurgencies. To examine these questions empirically, we construct artificial 0.5 × 0.5 degree (about 55km × 55km) grid cells covering the entirety of West Africa. Unless otherwise noted, each grid cell is our unit of analysis throughout the empirical analysis and we report standard errors adjusting for spatial auto-correlation with distance cutoff at 100km.171717 With this distance cutoff, the standard error is equivalent to be clustered by 3 × 3 grid cell squares (the own grid cell at center and surrounding eight grid cells). In a later section of robustness checks, we report standard errors with several higher distance cutoffs.
First, we hypothesize that water access in ancient periods predicts core pre-colonial cities in the trans-Saharan caravan routes founded up to the 1800s when the main transport mode was camel, but with small contemporary populations. The following logic first rationalizes the argument that ancient lakes influenced initial human settlements. The transportation cost in inland trade over the Sahara by camel is arguably high. In the presence of high transportation costs, places with a high capacity to feed humans are attractive as locations for city formation. Locations close to lakes and rivers are thus attractive. Humans can directly benefit from the water from these sources for various purposes, such as drinking and agriculture. Humans can also indirectly benefit from the water through its impact on animals. One benefit is through feeding livestock. In particular, camels, which humans use as their major transport mode, depend on water sources. Another benefit is through fishing and hunting. Fishing is obvious. Terrestrial animals also tend to gather places where water is available for their drinking purpose. Therefore, the human’s search cost for hunting animals would be lower around locations close to water sources. Bosker (2021), a recent review article in regional science and urban economics, also points out the availability of a reliable water source as the primary city seed when transportation costs are high. Moreover, Drake et al. (2011) also empirically support these arguments. Collecting records of refuges, sightings, fossils, and rock art sites, they show that the estimated spatial distributions of various faunal species (such as fish, molluscs, and savannah mammals) significantly overlap with the ancient water sources. Collecting records of barbed bones, whose only usage was for hunting large water-dependent animals, they also show that the estimated spatial distribution of humans significantly overlaps with the ancient water sources.181818 See, again, the Supporting Information of Drake et al. (2011) for more technical details. See, for example, Dunne et al. (2012) and Sereno et al. (2008), for additional evidence of human settlements and animal use in the Sahara in the African Humid Period. Subsequent evolution of cities and historical states would then be based on the initial human settlements directly affected by the initial water sources, as long as transportation costs had been kept high before European colonization. At the same time, locations that had ancient lakes also experienced the decline of water resources until today. Therefore, the lost comparative advantage due to the shrinking of water, along with the invention of modern trading technologies concentrated in coastal areas, can also predict the decline of landlocked historical cities and small contemporary populations.
Next, we investigate the origins of contemporary cities, focusing on the following first- and second-nature forces, all of which could in theory be key determinants of city formation: the persistent effect of the ancient lakes, the effect of changing natural geography over time (i.e., constant shrinkage of water sources), and the opportunities for colonial investments by European countries.
Finally, we test if the presence of pre-colonial Islamic states, even though core cities around these states became obsolete or even extinct, have persistent influences on contemporary Islamist insurgencies. Although areas that historical Islamic states covered were wide and there is no geo-coded information on populations, we presume that populations and key economic activities were concentrated around core trading cities. Obviously from the above argument about the relationship between water access and human settlements, pre-colonial historical city locations were not likely to be randomly determined. OLS estimates are thus likely to be biased. In order to instrument the access to the historical trade points, we exploit an exogenous variation in the ancient water resources that predicts the pre-colonial cities of our focus.
In particular, we focus on the persistent effect of pre-colonial trading cities that satisfy the following two conditions—those located inland and with small contemporary populations—for the following two reasons. First, in trade networks before the invention of modern trade technology and the reversal of economic roles of inland and coastal areas, pre-colonial inland trading cities were the core and places closer to the coast were the periphery. Second, the locations of inland historical cities with higher contemporary populations might have been more likely to be affected by contemporary unobserved factors that caused colonial investments and economic development. In order to study the persistent influence of past economic activities, it is desirable to focus on inland historical cities whose formation was largely determined by factors that do not exist today and are not likely to directly affect contemporary jihadist activities.
4.1 Ancient Water Source as the Origin of Core Pre-Colonial Cities
4.1.1 Empirical Specification
We first test whether proximity to water resources in ancient periods (more than 5 thousand years ago) predicts the formation of core trading cities in the trans-Saharan caravan routes founded up to the 1800s when historical Islamic states played significant economic roles before European colonization. We estimate the following regression:
| (1) |
where represents each grid cell, is a vector of cell-level geographical controls191919 Cell-level geographical controls include a landlocked dummy, average malaria suitability, average caloric suitability in post 1500, average elevation, terrain ruggedness, and proximity to contemporary water sources. , is a contemporary country fixed effect, and is an error term. The dependent variable, , is the accessibility of a trading point in the trans-Saharan caravan routes. In our main specification, takes the accessibility of inland pre-colonial trading cities that have contemporary populations less than 100,000 for the theoretical reason described above. , is the accessibility of an ancient water source. Although our ancient water source data contains both lakes and rivers, we use ancient lakes as our primary measure of ancient water source. We compute the following measures of or .
Straight-line distance. The first measure is the straight-line distance from the centroid of each grid cell to the nearest ancient lake or the nearest core trading city. Trading cities are points and measuring the distance is straightforward. We define the distance to an ancient lake as the distance from the centroid of a grid cell to the nearest border between land and the lake.
Weighted accessibility measure. Each grid cell has access to multiple trading cities or water sources. In order to take this effect into account, we construct the following weighted measures:
where is the distance from grid cell to each city in the trans-Saharan trade routes and is the distance from grid cell to each ancient lake (the nearest border between land and lake from ), both of which are measured in either the straight-line distance or the cost distance defined above. If we follow the conventional market access measure, might include population in city in the numerator. However, the precise information of population in 1700-1800’s is not available. In , we take into account each ancient lake size because larger lakes mean richer accessibility of water resource.
Cost distance based on the Human Mobility Index (days). The third measure incorporates the Human Mobility Index proposed by Özak (2010, 2018). The Human Mobility Index computes travel time to cross any square kilometer on land, taking into account slope and terrain conditions, climate conditions, etc. Based on this index, we construct the travel time from each grid cell centroid to the nearest ancient lake or the nearest core trading city.
We capture walking distance in these measures for the following reasons. First, there were no modern roads in the ancient periods and the pre-colonization age. Second, there were no modern cars in these periods. Camels were the means of transportation for the trans-Saharan trade. Third, walking distance matters even today in insurgent activities. Rebel groups tend to move not only through roads but also through off-road (e.g., Tao et al. 2016).
For the remainder of our analysis, we use the straight-line distance measures for both and because these measures are the simplest and most straightforward ones to capture walking distance without specific assumptions about travel costs. We nonetheless report empirical results with other accessibility measures as well in Appendix.
4.1.2 Results
Table 1 reports the estimation results of (1). Given the exogenous nature of the ancient lakes, the OLS regressions plausibly identify the causal estimates of proximity to the ancient lakes on the formation of core pre-colonial trading points. According to column (3) of panel (A), a 1% increase in proximity to an ancient lake from a grid cell increases proximity to a pre-colonial trade point by 0.07% at the 1% level of statistical significance. Panel (B) shows the result with our main outcome, proximity to a landlocked pre-colonial trade point with small contemporary populations. With our preferred specification in column (3), a 1% increase in proximity to an ancient lake increases proximity to the landlocked trade point by 0.13% at the 1% level of statistical significance. The coefficient size in panel (B) is almost twice as large as that in panel (A), emphasizing that the ancient water access significantly predicts pre-colonial inland trade points and that diminishing water resources led to their decline. Comparing panels (C) and (D) for proximity to a trade route also leads to similar conclusions.
Alternatively, in column (4) through (9), we use proximity to an ancient river and proximity to an ancient water source (a lake or a river) as the accessibility of an ancient water source. The results show that proximity to an ancient lake has the highest power to predict proximity to a core trade city. Recall from Figure 2 that some pre-colonial cities that are far from ancient lakes are located very close to the ancient river lines. However, we observe the overall weak result of the ancient river effects. This would be because overall there is a wide range of areas where ancient rivers were covering but there are no pre-colonial cities overall.
Notably, we control for proximity to a contemporary water source in Table 1. The results show that proximity to a contemporary water source has no explanatory power for proximity to a core trade city. The coefficients on a contemporary water source are statistically insignificant in most specifications and their sizes are also significantly smaller than those on proximity to an ancient water source. These results imply that locations of the core trade cities reflect the initial geography from ancient periods rather than pre-modern water sources.
4.2 Changing Natural Geography, Colonial Investments, and Contemporary City Formation
Table 2 shows the relationship between contemporary economic development and water sources over time with the same other controls of the specification (1). In panel (A), we use the log of one plus distance (km) to the nearest city with contemporary population over 50,000 as an dependent variable. In panel (B), restricting the grid cells in the countries covering the Sahara (i.e., Chad, Niger, Mali and Mauritania), we use the log of one plus distance (km) to the nearest city with contemporary population over 10,000 as an dependent variable, given that these landlocked countries have much smaller population densities than other West African countries many of which face coasts. In panel (C), we use satellite light density at night to proxy for local economic activity since there does not exist national geocoded high-resolution statistics of economic development across West Africa. We rely on the Visible Infrared Imaging Radiometer Suite (VIIRS), which is superior in capturing local economic activity. As a dependent variable, we use the log of one plus total night light luminosity in 2015.
From panels (A) and (B), the effects of proximity to an ancient lake is statistically insignificant with small coefficient sizes, which implies the lack of persistent effects of initial geography on contemporary city formations. From panel (C), we find the negative effect of proximity to an ancient lake on the night light luminocity. In contrast, we find significant (both statistically and economically) positive effects of proximity to a contemporary water source on contemporary city formation and night lights. These results emphasize the importance of examining the effect of changing first-nature geography over time, illustrated by the constant shrinking of water sources and the increase in the relative importance of the Niger river.
However, the changing natural geography would not be the only factor explaining modern cities. We presume that most ancient lakes had shrunk even before the European colonization. Combining these results with the ones from the previous section emphasizes the importance of persistence and path-dependence in shaping economic activities. The results in the previous section confirms the persistent effect of initial geography even though its substance role diminished. The results in this section points to the path-dependence in response to the large historical shocks (European colonization and the invention of modern trading technologies).
Table 3 reports the effects of water sources on colonial activities. We use three variables that capture colonial activities. In panel (A), the dependent variable is proximity to a colonial railway which is one of the direct measure of colonial investment. In panel (B), the dependent variable is proximity to a Christian missionary activity. Christian missionary activities are well-known entities which fostered education and built health facilities in colonial Africa (e.g., Nunn et al. 2014; Cagé and Rueda 2020). In panel (C), we use the Atlantic slave exports.202020 The Atlantic slave exports data come from Nunn (2008). We assign each grid cell to ethnic homeland by Arc GIS. In panel (C), this is grid-cell level analysis although variation of the dependent variable (the logarithm of one plus the number of Atlantic slave exports in the 1800s) comes from ethnic homeland level. Since the data has missing values for the uninhabited areas, the number of observations decreases to 2489. The European colonizers built ports and engaged in colonial trade along the coast. The number of Atlantic slave exports proxy for the intensity of colonial trading activities. As a dependent variable, we use the log of one plus the number of the Atlantic slave exports.
The results show that the relationship with water sources is heterogeneous across different colonial activities, while all the three activities were engaged in closer to coastal areas. Proximity to ancient water sources has an insignificant influence on the missionary activity (both statistically and economically), while it is located closer to contemporary water sources. Importantly, there are more colonial railways and slave exports in locations further from the ancient lakes. The coefficients are statistically significant at the 1% level and also economically significant. According to column (3), a 1% increase in proximity to an ancient lake increases the slave exports by about 0.2%. The role of the slave trade involving colonization forces will be discussed again in a later section when we investigate the local mechanism behind the persistent effect of pre-colonial cities on jihadist violence. In contrast, the relationship between the slave-related activities and contemporary water sources is insignificant.
Table A.1 reports the correlations between variables related to colonial investments and contemporary development, measured by proximity to a large city and the night light luminosity. According to column (1), proximity to a pre-colonial trade point, including both coastal and landlocked, is weakly correlated with contemporary development. According to columns (2) through (4), proximity to coast, colonial railways, and missionary activities are significantly correlated with the both development outcomes, which implies that accessibility for many European colonizers who sailed to West Africa had an important role in contemporary cities and economic activities. These results are consistent with the finding of Ricart-Huguet (2021), which stresses the importance of coastal pre-colonial trade point. According to column (5) of panel (B), a grid cell located in an ethnic homeland with a higher number of Atlantic slave exports is also positively correlated with the night light luminosity though its coefficient size is small.
Finally, in order to look at the effect of a change in trade technology, we are also going to focus on aviation technology. In the early 1900s, the technology was still for the military purpose in WWI and WWII, but the technology gradually was used for trade before the independence in West Africa. Since the airports reflect both colonial investment and a place adopting the technology, we are collecting the locations of airports in West Africa (the data is under construction).
4.3 Persistent Influence of Pre-Colonial Islamic States on Contemporary Islamist Insurgencies
4.3.1 Empirical Specification
Given the endogeneity of the locations of core cities in pre-colonial Islamic states, we instrument (the accessibility of inland pre-colonial trading cities that have contemporary populations less than 100,000) by proximity to an ancient lake. We thus use the predicted trading city access from the first stage to estimate the following two-stage least squares:
| (2) |
where is an outcome of interest regarding insurgent activities by violent Islamist organizations and is the coefficient of interest. In addition to the same geographical controls as in (1), also contains contemporary populations. That is, we conceptually compare same-sized cities but with different past prosperities to examine the persistent effects of historical state presence.212121 Table A.2 reports positive correlations between jihadist events and proximity to contemporaries cities with various sizes. Table A.3 reports the corresponding first-stage regression results, which are equivalent to those in Table 1 except for additionally controlling for contemporary populations.222222 Indeed, the IV has the highest power for predicting the set of cities captured in among possible combinations of pre-colonial cities. In order to show the validity of the IV, we conduct placebo tests, in which we run the same specification with proximity to a currently-populated inland city and a contemporary small coastal city as a dependent variable respectively. Table A.4 reports that proximity to an ancient lake does not predict any of these cities. Insignificant results with other combinations of cities are also available upon request.
In addition to the exogenous water access in ancient periods, we need the following identifying assumption for causal inference. Water access in ancient periods influences contemporary outcomes only through its effect on shaping economic activities in historical states before colonization. That is, after controlling for cell-level geographical characteristics, the unobservable factors of contemporary Islamist insurgencies are uncorrelated with the ancient water access.
There is no direct way to test this assumption, but the following two arguments support it. First, most lakes in ancient periods have now disappeared because of exogenous long-term climate and environmental changes. We presume that the direct effect of lakes is present as long as lakes exist. Our logic is that ancient lakes directly affected human settlements and economic activities when humans and animals depended heavily on these water sources. Subsequent evolution of historical states would then be based on the initial human settlements affected by ancient water sources. Therefore, ancient lakes are not likely to have a direct influence on contemporary Islamist insurgencies.
Second, we check the correlation between ancient water access and a set of pre-determined charasteristics, including geographical conditions and pre-colonial variables of culture and institutions, after controlling for the baseline geographical controls and contemporary country fixed effects. Geographical variables include ecological diversity, temperature, precipitation, caloric suitability, and pastoralism suitability. Pre-colonial variables include jurisdictional hierarchy of local community, polygamy as a marital composition, irrigation potential, degree of class stratification, and rules of political succession of local headman, drawing from the Ethnographic Atlas. Table 4 reports that the accessibility of ancient water sources is mostly uncorrelated with these pre-determined characteristics.232323 We see significant correlations with precipitation and caloric suitability. However, most variations of these variables are concentrated in coastal countries and the high correlations pick these effects.
In our baseline estimations, takes the following three variables: (i) log (distance from the nearest point of violent event by a jihadist organization between 2010 and 2019 from the centroid of cell ); (ii) a dummy which takes 1 if cell has at least one violent event by a jihadist organization in ACLED from 2010-2019; (iii) log (number of violent events by jihadist organizations from 2010-2019 in cell ).
4.3.2 Results
Figure 4 visually illustrates the strong correlation between pre-colonial cities and contemporary jihad. This map overlays two residuals—the red scheme represents residuals from regressing the jihad dummy on the full controls used in the main IV specification; the blue scheme represents negative residuals from regressing log distance to a pre-colonial core inland trade point on the full controls. The color of cells where high residuals overlap turns purple (a mix of red and blue). Around several pre-colonial inland trade points, we observe dark purple cells.
Table 5 reports the IV estimates of the effects of the core pre-colonial cities (up to 1800’s) on contemporary jihad (2001-2019). According to column (1) of all the panels, a 1% increase in proximity to a pre-colonial core city from a grid cell increases the average proximity to a jihadist event from the cell by 1.2%, the probability of experiencing a jihadist event in the cell by 0.3%, and the average number of jihadist events in the cell by 1.2% during 2001-2019. All of these estimates are statistically significant at the 1% level in our preferred specification. These effects are mostly concentrated in 2010-2019, during which the intensity of jihadist events have significantly risen. The mean of log intensity of jihadist events is 0.245 in 2010-2019 and 0.011 in 2001-2009. From column (2) of all the panels, we observe statistically insignificant effects of the core cities during 2001-2010 and their coefficient sizes are also significantly smaller. In column (3) of all the panels, point estimates of the effects of the pre-colonial cities during 2010-2019 and their level of statistical significance are similar to those in column (1). These results indicate that the jihadist events during the past decade (2010-2019) are closely linked to the historical Islamic places, the core trade cities tracing back to more than 200 years ago.
We also use the same specification but with the explanatory variable being proximity to the trade route network up to 1800CE constructed by Michalopoulos et al. (2018). We pick the inland trade route network and calculate the distance to the nearest trade route from each grid cell. Columns (4), (5) and (6) in Table 5 show the results for the alternative measure. We find the qualitatively same results as in columns (1), (2) and (3). Importantly, the coefficient size of proximity to a trade route network is smaller than proximity to a core trading city. These results imply that proximity to a core trading city matters more than proximity to a trade route.
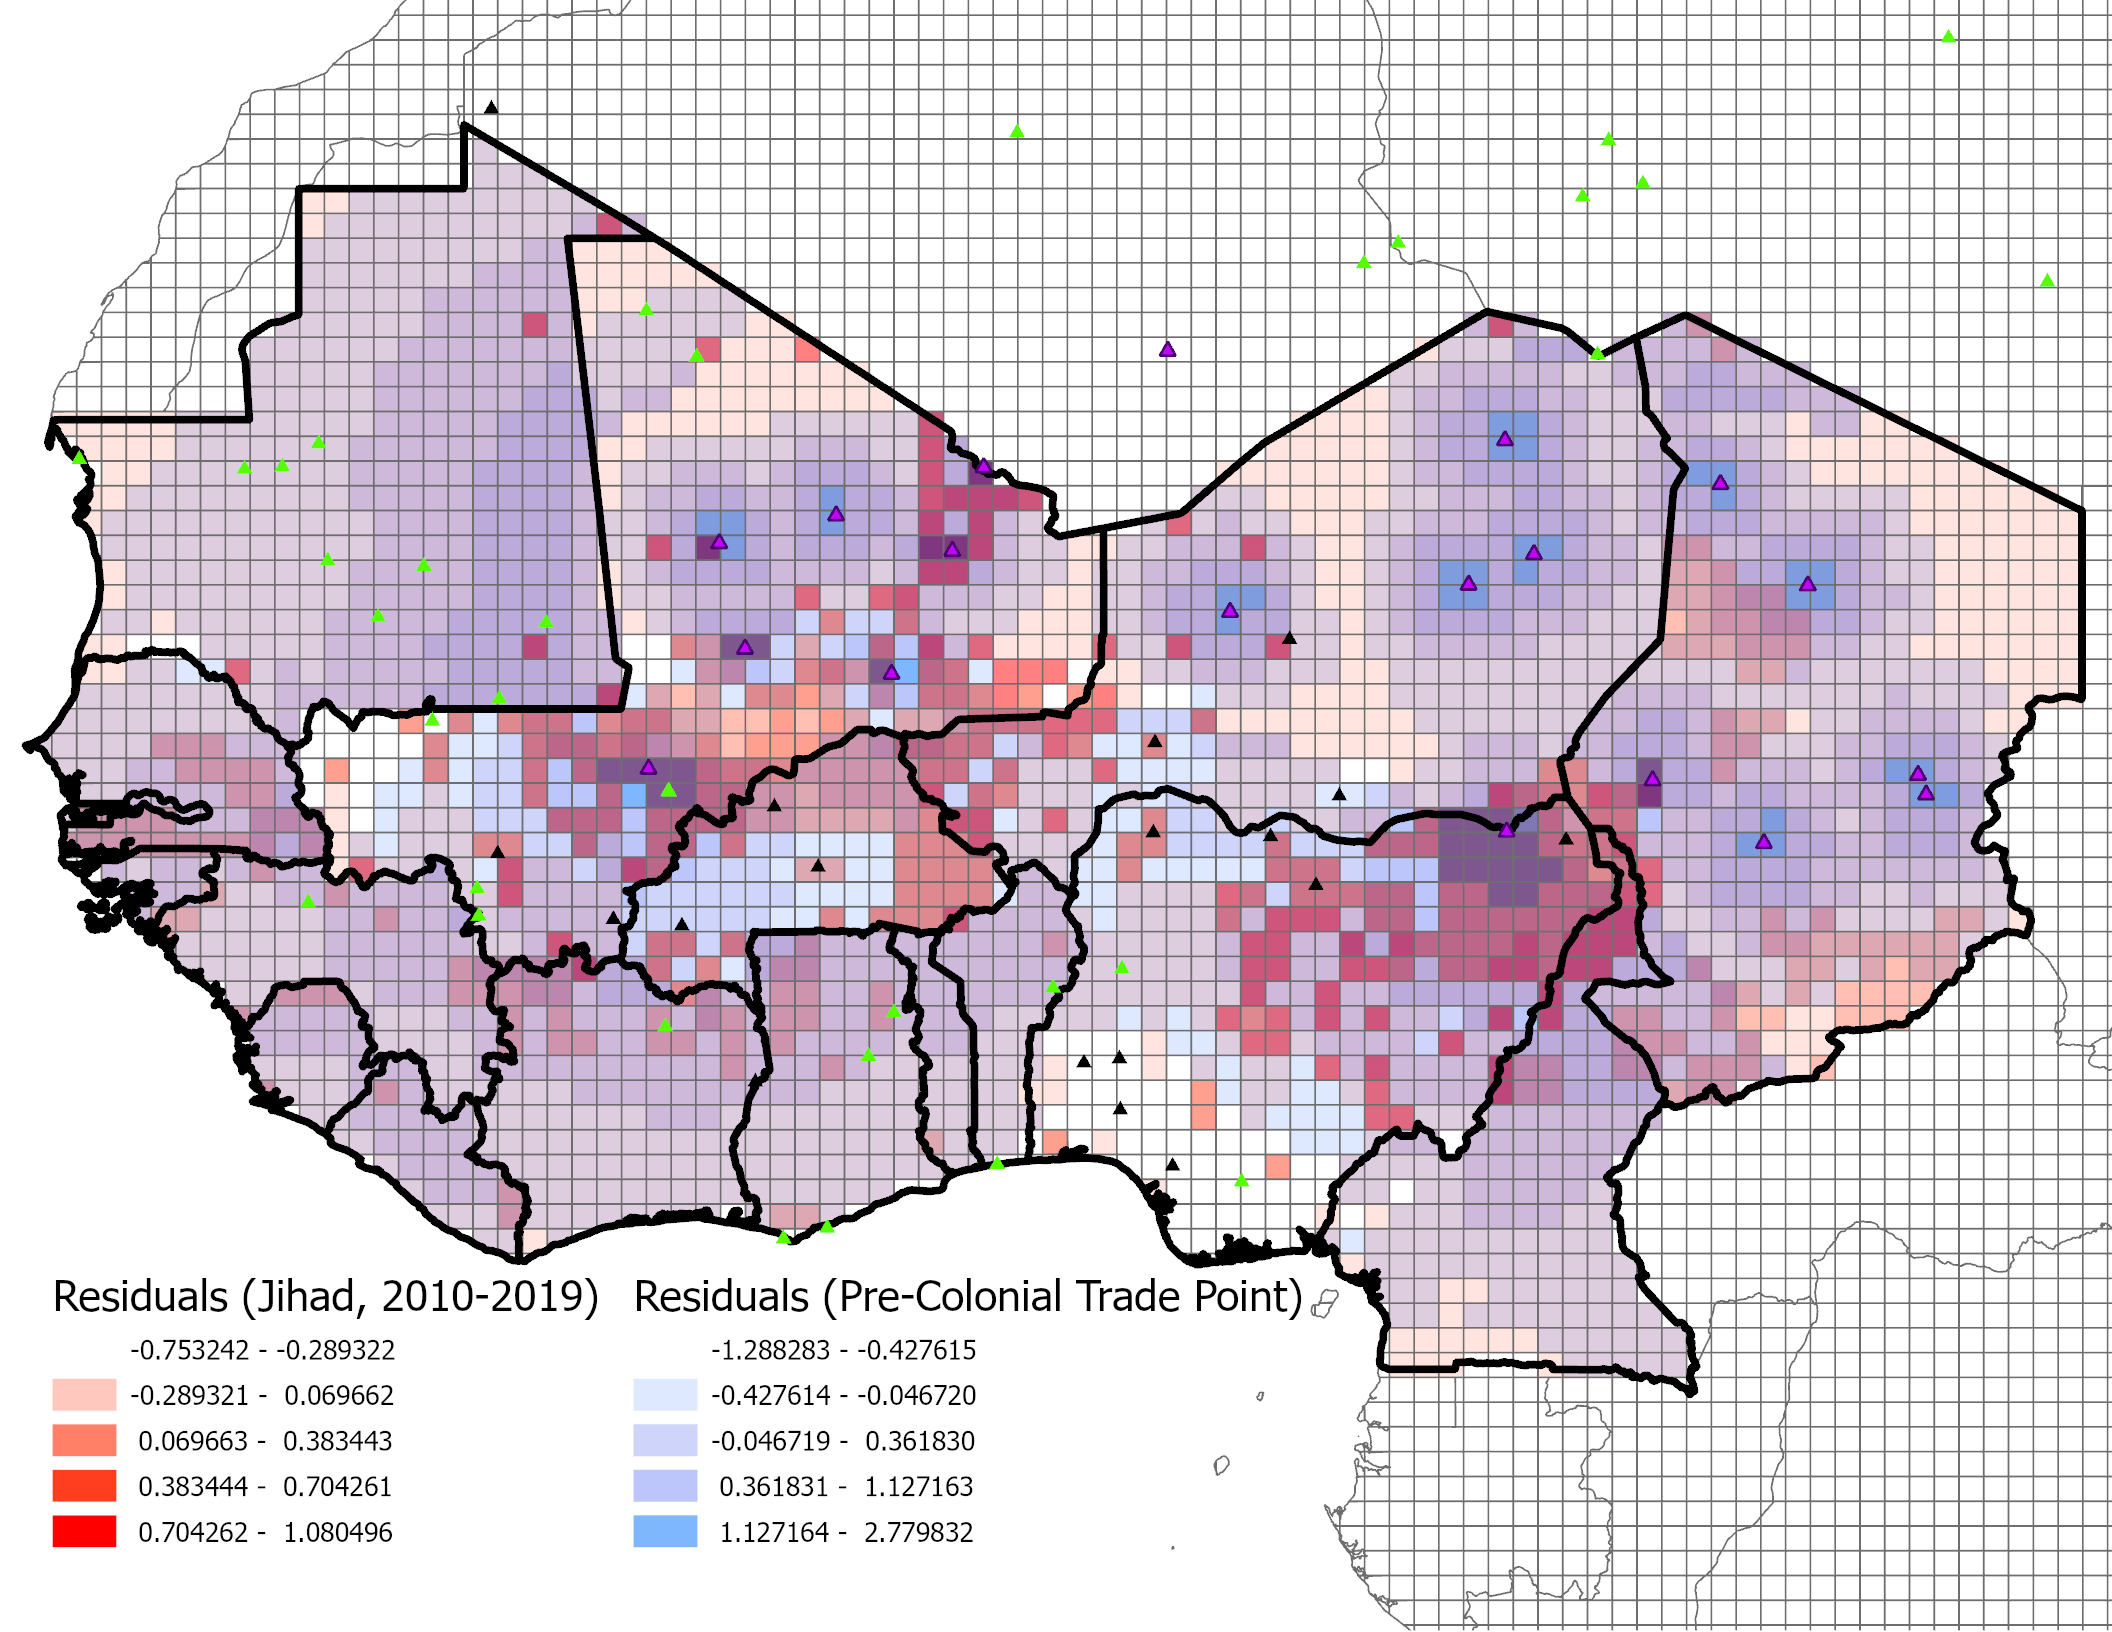
Notes: This figure overlays two residuals—the red scheme represents residuals from the regression of a dummy variable of jihad (2010-2019) on all the control variables; the blue scheme represents negative residuals from the regression of log distance to a pre-colonial inland trade point with less than 100,000 population today on the full controls. The full controls include landlocked dummy, malaria suitability, caloric suitability in post 1500, elevation, ruggedness, and country fixed effects. The purple triangles indicate pre-colonial inland trade points with less than 100,000 population today, the yellow green triangles indicate pre-colonial coastal trade points with less than 100,000 population today, and the black triangles indicate the other pre-colonial trade points. The color of cells where high residuals overlap turns purple (a mix of red and blue).
Furthermore, in order to examine the (lack of) persistent effect of the core pre-colonial cities on the contemporary economic activity, we use the night light luminosity relying on two data sources as in Section 3. We calculate total luminosity in each grid cell in 2005, 2010, and 2013 from DMSP and in 2013, 2015 and 2019 from VIIRS.242424 The correlation between these two night lights data in 2013 in our study region is over 0.9. Table A.5 reports IV estimates of the persistent effect of the core pre-colonial cities on the night light luminosity today (without contemporary population in the controls). The estimated coefficients suggest that the regions closer to the locations of the pre-colonial core cities tend to be less developed in the 2000s.
5 Local Mechanism
This section discusses the local mechanism specific to the West African experiences. The global-scale discussion follows in the next section.
We first emphasize that jihad is not only the contemporary phenomenon, but cyclic over the centuries. We next show that spatial distributions of jihads are nevertheless inconsistent over time. Finally, we argue that the empirical results are consistent with the mechanism that jihadist ideology is persistent as a legacy of European colonization, drawing further on anecdotes and individual-level survey data.
5.1 Cycle of Jihad with Distinct Spatial Distributions over the Centuries
From Figure 2, there are two observations about the relationship between historical state presence before colonization and contemporary Islamist insurgency. First, contemporary conflict events involving Islamist organizations are concentrated in locations of historical Islamic states, but not in locations of historical non-Islamic states. In other words, given that jihads against European colonizers in the 19th century occurred around locations of historical Islamic states, jihad is cyclic over time in similar areas to some extent. Second, there is also a high variation in the contemporary conflicts involving Islamist organizations across different locations of historical Islamic states. Contemporary conflict events are not concentrated in all areas of historical Islamic states, but concentrated in a specific set of locations of historical Islamic states. For example, contemporary jihads are concentrated in the areas of Sokoto Caliphate in modern Nigeria and Tukulor Empire in modern Mali.
Back in the conquest period, Sokoto Caliphate had limited to access to the purchase of the European weapons, which ended up in “no tactics, no personal gallantry and no resistance” against the European conquest (Crowder 1971, p.294). On the other hand, we observe very little contemporary jihadist violence in the area of Wassoulou Empire in modern Mali.
In order to further investigate the spatial distributions of jihads over time, Figure 5 shows both historical and contemporary jihads with the ancient lakes and historical trade cities. The historical jihad information is based on Brecke (1999). This map implies the following two observations. First, locations of historical jihads against colonization forces are distant from both ancient lakes and core cities in the historical trade routes. In other words, historical jihads are distributed more in the periphery of the historical trade routes and in the coastal areas. Second, most historical jihads are distant from areas where contemporary jihads are concentrated.
Table 6 reports results of regressing historical jihads on the ancient water access. That is, the regression specification is identical to our first-stage one except for changing the dependent variable from historical trade points to the historical jihads. According to columns (4) through (6), the locations of ancient lakes have statistically insignificant effects on historical jihads against colonization forces and their coefficient sizes are also small.
Table 7 reports results of the IV regression with the same specification as the main empirical analysis except for changing the dependent variable to the historical jihads. According to columns (3) and (4), the core cities in the historical trade routes also have statistically insignificant effects on historical jihads against colonization forces and their coefficient sizes are smaller than those on contemporary jihads reported in Table 5.
In order to study the link between locations of contemporary jihad (2010-2019), historical jihad and core cities, we estimate the IV regression with the same specification as the main empirical analysis except for the dependent variable. Since neither historical nor contemporary conflict occurred in approximately 85% of the grid cells spanning in West Africa, in order to capture the meaningful variations, we use the relative locations of contemporary jihad to the historical jihad as the dependent variable. Specifically, we calculate the (logarithm of one plus) distance to the nearest contemporary jihad divided by the (logarithm of one plus) distance to the nearest historical jihad. Table 8 reports the results of the IV estimates for the effects of proximity to the core cities. The results show that contemporary jihad occurred closer to a grid cell with more proximity to the core cities relative to locations of historical jihad.
Finally, in order to examine the link between locations of historical and contemporary jihad, we use the distance to the nearest contemporary jihad divided by the distance to the nearest historical jihad as in the above. Table 9 and Figure 5 report the correlations between historical and contemporary jihads. According to column (4) through (6), contemporary jihad occurred in further away from a grid cell with more prevalence of historical jihad in terms of onset, intensity and duration respectively. Since the results in column (1) through (3) indicate that the relative locations of contemporary jihad to historical jihad are significantly correlated with historical conflict including non-jihadistic events, the correlations between contemporary jihad and historical jihad can be simply driven by the common factors with historical conflict. To alleviate this concern, column (7) through (9) report the results of horse race regressions. In these columns, the significance of the estimated coefficients of historical conflicts disappears and the size of the estimated coefficients shrinks towards zero, confirming our arguments about the significantly negative correlations between contemporary jihad and historical jihad.
5.2 Persistence of Jihadist Ideology as a Legacy of Western Colonization
In order to understand the mechanisms behind distinct spatial distributions of jihads over time, we focus on strategies adopted by historical Islamic states against colonization forces. Appendix E and F summarize the confrontation against Europeans and strategies, obtained from several information sources. With Figure F.1, they imply that in locations where historical Islamic empires (e.g., Tukulor Empire) did not adopt hard confrontation as a strategy against European colonization, there are more Islamic violence today. This relationship between these different types of strategies and contemporary Islamic conflicts is consistent with the distinct spatial patterns of conflict events over time that we observed above. Investigations into intensities of historical conflicts also support the previous argument about the strategies against colonization forces. Results reported in column (6) and (9) of Table 9, where we use the total duration years of historical jihads against European countries in the conflict catalogue data, are consistent with the strategies adopted by the Islamic states.
How conflicts end matters for future conflicts through the persistence of jihadist ideology
The interpretation most consistent with the set of our empirical findings is as follows, relating to the power balance between Islamic states and European military during the colonial era.
The Islamic state forces closer to the coastal area could obtain arms and ammunition easily and directly from European traders (Smith 1989). For example, Samori had access to weapons from traders and imported more modern weapons from Sierra Leone to fight the French (Crowder 1971). Like Samori, the Islamic states with better access to weapons adopted the confrontation strategy including guerilla tactics against European colonizers and fought more intensely with them. Consequently, the European military forces militarily defeated such states. These states ceased to exist and the seeds of jihadist ideology in them also diminished.
The Islamic state forces with worse access to weapons, on the other hand, did not fight as intensely against European forces due to the extreme and obvious asymmetry in fighting power between them. For example, Crowder (1971) writes “the reasons for the ineffectiveness of Tukulor military resistance are fairly obvious.” The author then describes the military as “hopelessly outgunned” by French military, which led to no military resistance for most of the conquest period. In these circumstances, such states followed strategies of alliance, acquiescence, or submission with respect to European forces. These states also ceased to exist, but the seeds of jihadist ideology in them did not diminish, which could cause future jihadist conflicts.252525 Recall from section 2.2 that weapons could be obtained from Europeans in exchange for slaves. Recall from Table 3 that slave exports were observed in locations further away from the ancient lakes which strongly predict contemporary jihad. Reasonably assuming that weapon access was higher around locations where slaves were exported, this observation is also consistent with the distinct spatial distributions between historical and contemporary jihads.
However, the presence of jihadist ideology would be a necessary condition but not a sufficient condition for contemporary jihadist activities to take place. Given the persistence of jihadist ideology, a contemporary shock that bolsters the strength of insurgent forces (e.g., inflows of fighters and weapons from Libya after the security collapse there, as presented by Shaw 2013) could be regarded as a trigger to cause the abrupt surge of contemporary jihad. The entire story could be consistently explained by recent theories of conflicts that focus on relative military capability, incomplete information, and preemptive incentives (e.g., Baliga and Sjöström 2020; Chassang and Miquel 2010). To summarize, these arguments imply that how historical conflicts ended matters for explaining contemporary conflicts.
Supportive evidence of persistent jihadist ideology from the Afrobarometer
We exploit the Afrobarometer survey to provide supportive evidence of persistent jihadist ideology. The Afrobarometer contains a series of nationally representative individual-level surveys from several African countries. Geo-coded information in each enumeration area (EA) is available. We use the recent two waves (rounds 6 and 7), implemented between 2014 and 2018, in which variables of interest are available. Although there is obviously no question that directly asks about jihadist ideology and violent extremism, we use variables from questions that ask about individuals’ religious ideology broadly related to jihadism from distinct perspectives. We estimate the following IV regression:
| (3) |
where the unit of analysis is individual who resides in enumeration area and participated in the survey at round . is proximity to a landlocked pre-colonial trade point from enumeration area and we instrument it by the ancient water access from . is a vector of individual-level controls and is a vector of enumeration area-level geographical controls.262626 Individual-level controls include age, age squared, female dummy, nine categorical indicators of education, and four categorical indicators of living condition. Enumeration area-level geographical controls include the logarithm of distance (km) to the nearest water sources today, landlocked dummy, average malaria suitability, average caloric suitability in post 1500, and average elevation. Since the Afrobarometer survey provides us with point data about each enumeration, we create a buffer with 50km radii around the locations of enumeration points when we calculate average malaria suitability, average caloric suitability in post 1500, and average elevation. We additionally control for the round fixed effects when an outcome variable is available in the both rounds. We report standard errors clustered at the country level in this specification.
Table 10 reports results of the IV regression using dependent variables from these questions and restricting the sample to Muslim respondents.272727See Appendix C for detailed sources and definitions of the variables that we use in this analysis. The Afrobarometer data is available in most African countries. Chad is an exceptional country where we observe jihadist events but the data is not available. The dependent variables are ordered and standardized. According to this table, as a respondent’s EA is closer to a pre-colonial core city location, he or she is more likely to dislike people of a different religion as neighbors (panel A), agree with governing a country by religious law rather than secular law (panel B), and disagrees with girls and boys having equal opportunities to education (panel C). All of these three effects are statistically significant at the 1% level.
Jihadism is broadly associated with excluding other religions, governing a country by religious law (in particular, the Shariah law), and limiting female education. Therefore, these empirical results support our view that persistent jihadist ideology is the primary mechanism behind the main results. Note also that, except the three variables used in the present analysis, we do not find any other Afrobarometer variables that appear to be closely related to jihadism, although there are many variables regarding various religious practices.
6 Discussion
6.1 Global Perspective: Jihad in “Past-Core-and-Present-Periphery”
Why do jihadist activities take place in some places but not in other places within the Islamic world? In order to approach this question, we first divide the world into the following four categories: (i) core in the past and core in the present; (ii) core in the past and periphery in the present; (iii) periphery in the past and core in the present; (iv) periphery in the past and periphery in the present.
From empirical analyses so far, we have leant that, in general, contemporary jihadist activities are concentrated around locations classified as (ii) core in the past and periphery in the present. In other words, contemporary jihads occur in areas that experienced reversals of fortune over the centuries. It is not surprising if contemporary jihadist activities are observed more in relatively underdeveloped societies within in the Islamic world, i.e., (ii) and (iv) in the above classification. However, it is not obvious why jihads are concentrated more in the “past-core-and-present-periphery” locations among underdeveloped Islam areas.
Does this pattern hold in the global scale? In order to approach this question, we draw on global-scale information about historical overland trade routes from Michalopoulos et al. (2018), worldwide populations over the centuries from the History database of the Global Environment (Hyde), and contemporary jihadist events (2001-2019) from the Uppsala Conflict Data Program Georeferenced Event Dataset (UCDP GED). Obviously, uncovering the causal relationship between past core locations (or present peripheral locations) and jihads in the global scale is beyond the scope of this paper, without exogenous time-variant natural geography to predict city formation, unlike in West Africa. It is nevertheless worth examining its correlation and case studies.
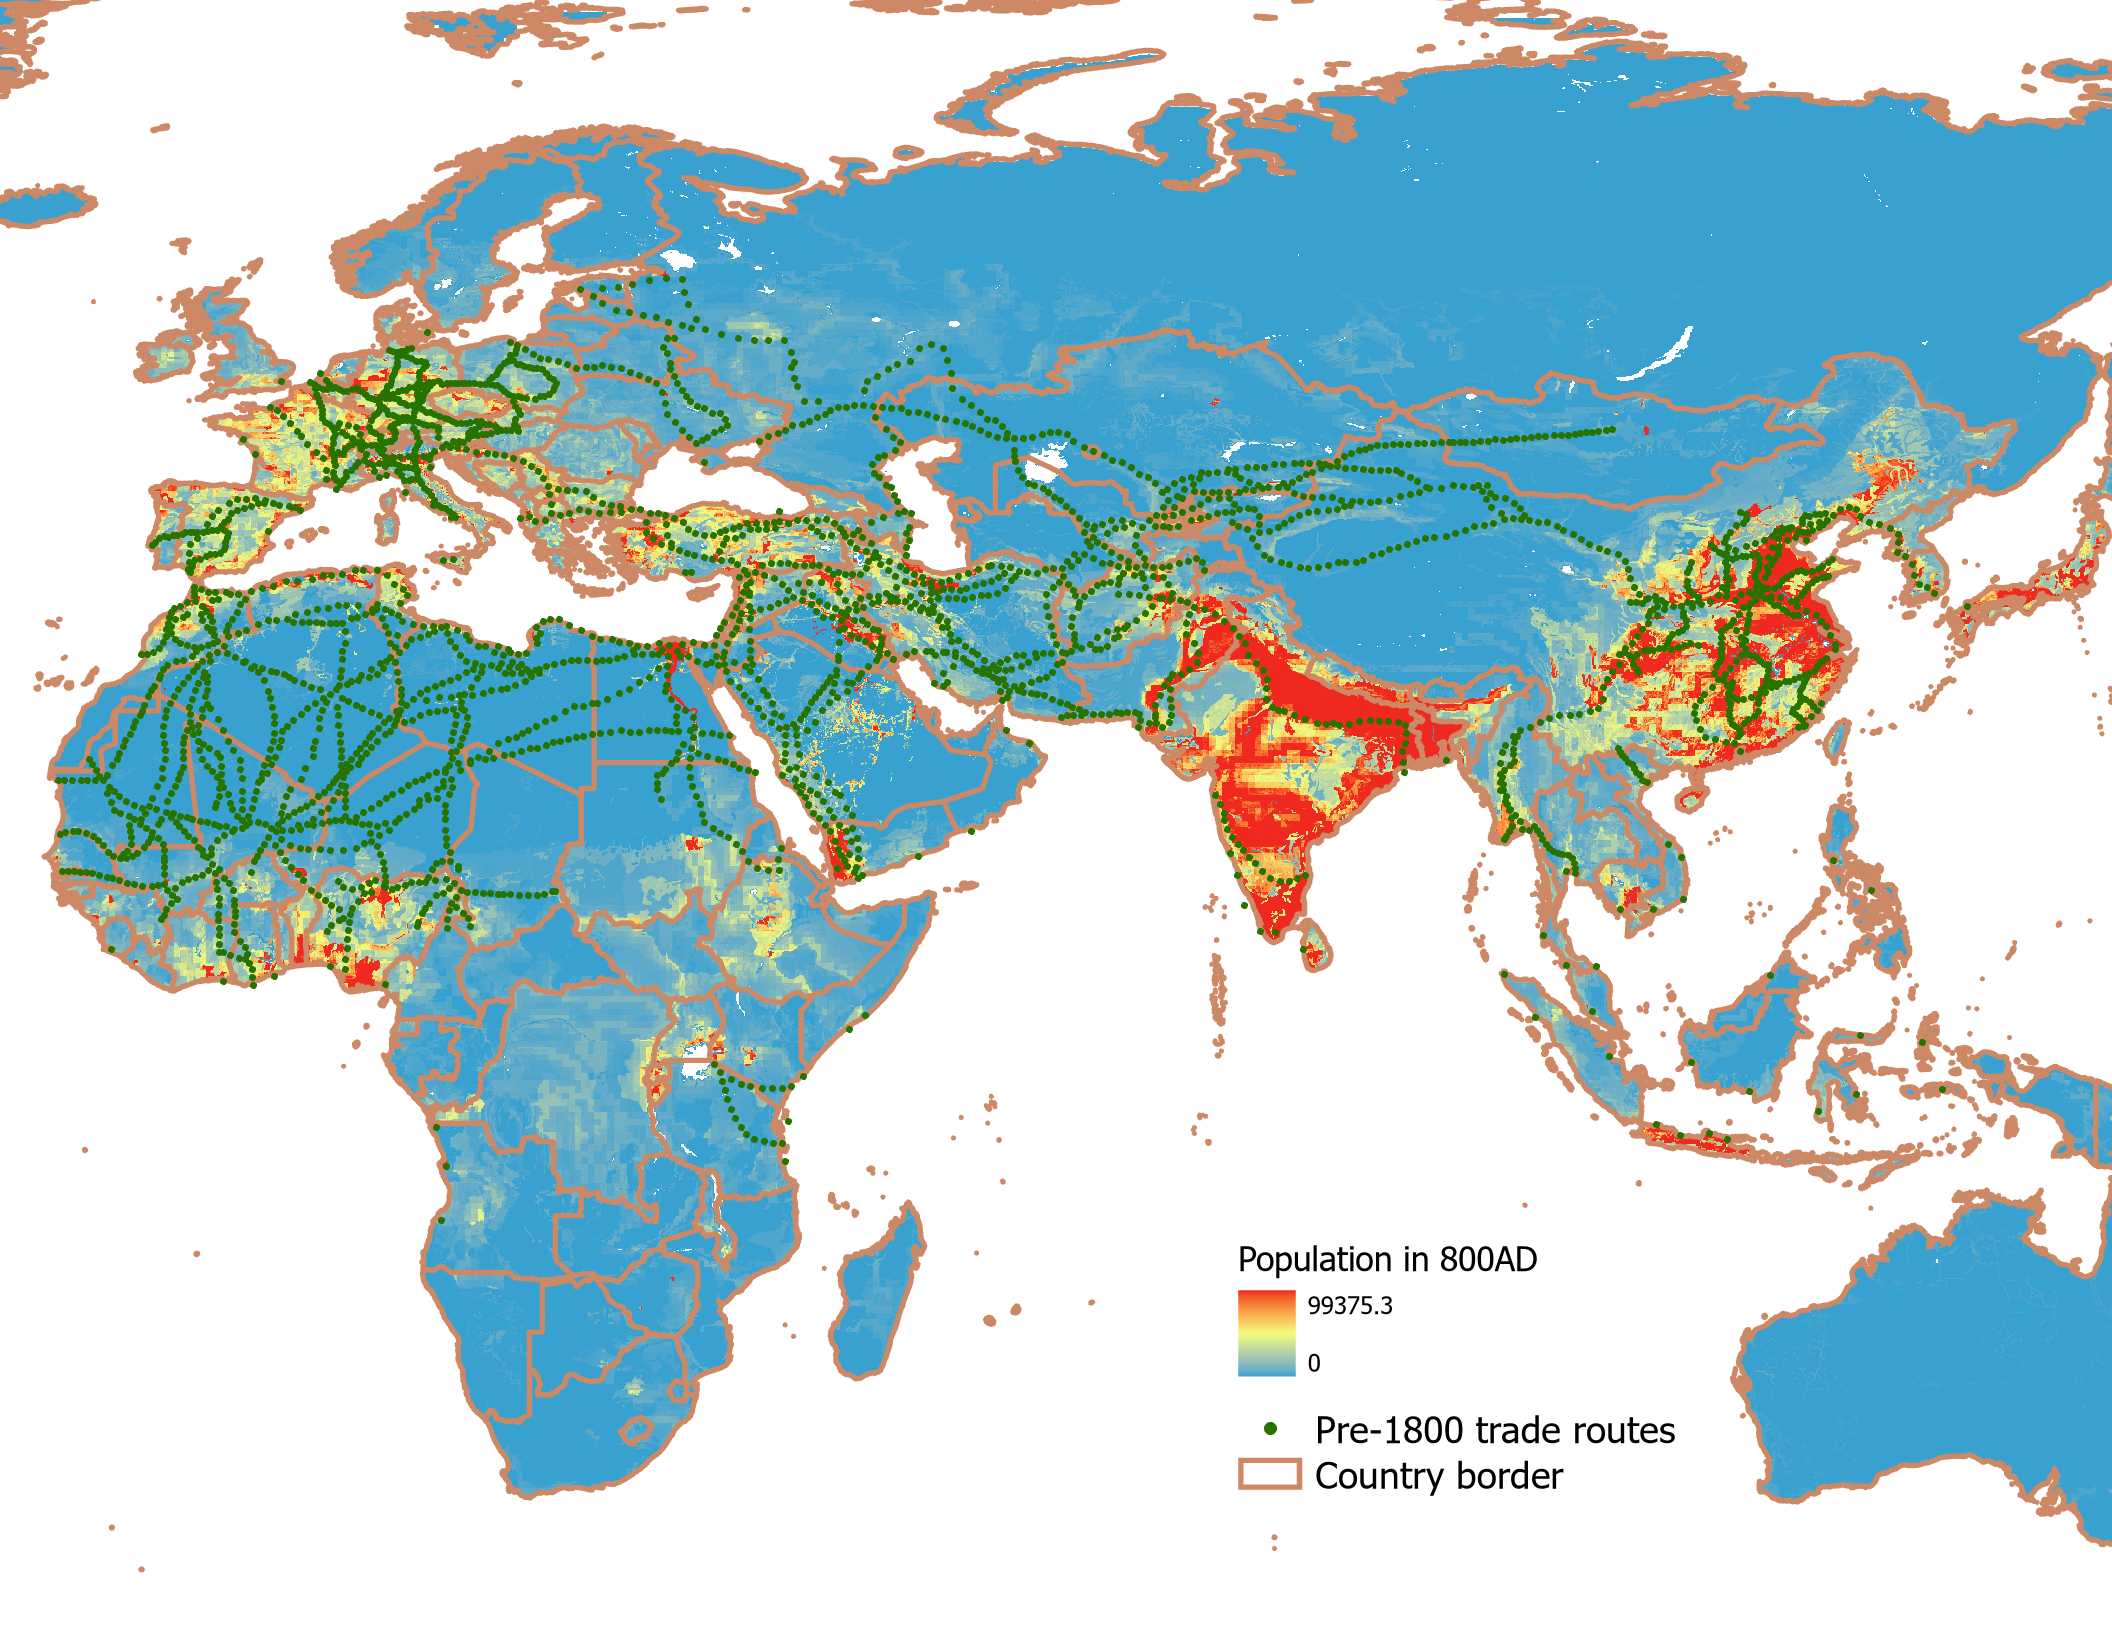
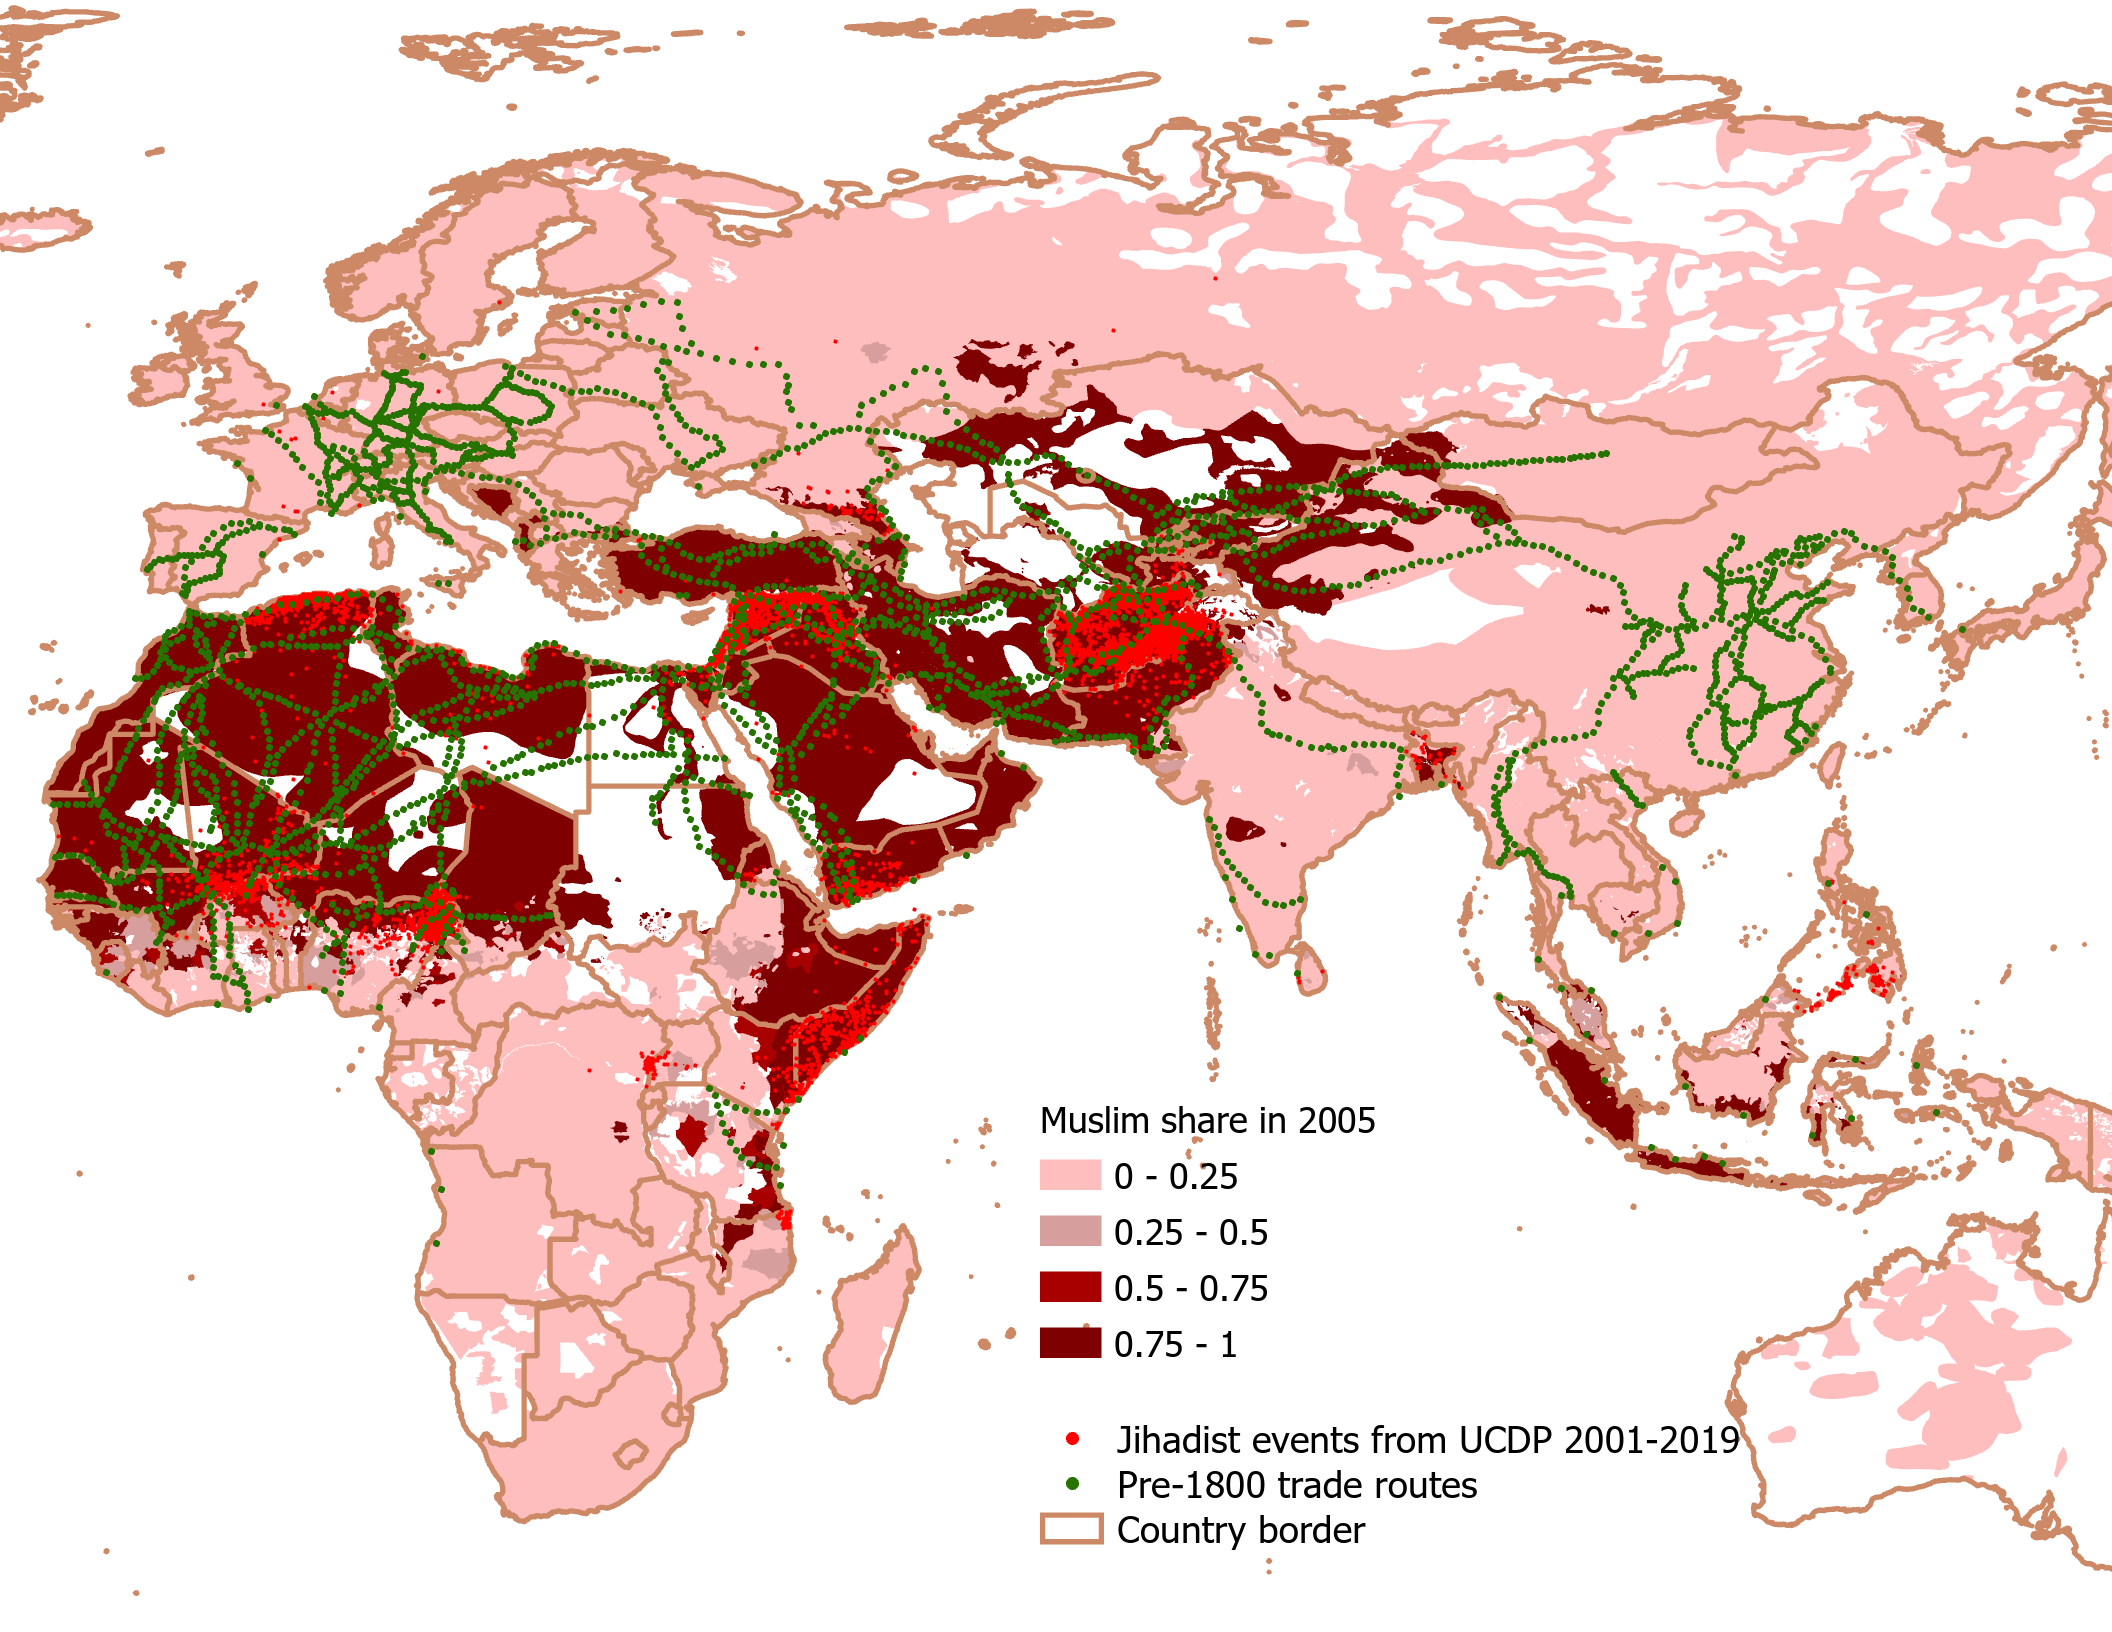
Figure 6 maps these information. We observe the highest concentrations of jihad events in Afghanistan, Pakistan, Syria, and Iraq.282828 The countries with the highest number of contemporary jihad events are, in descending order, as follows: Afghanistan, Syria, Iraq, Pakistan, Somalia, Nigeria, Algeria, Yemen, Philippines, and Mali. While these countries today are relatively thought as peripheries after the invention of modern trading technologies, these locations were historically the cores of global overland trade networks:
Afghanistan and Pakistan. Afghanistan is a landlocked, multi-ethnic country centered on the Hindu Kush mountain range. The region used to be the so-called “crossroads of civilization” connecting India with the east-west traffic routes of Eurasia. Afghanistan has also developed as an important hub along the Silk Road. However, it has been left behind by modernization because it has been less affected by European developments such as scientific and technological progress and the Industrial Revolution. The northern mountains in Pakistan, a neighboring country of Afghanistan, are part of the northern barrier of the Indian subcontinent, and since ancient times, traffic routes to China have passed through here. The Mintaka Pass crossing was one of the major routes. In addition, Balochistan Province, which encompasses several mountains and plateaus, is a major transportation hub for southern Afghanistan and Iran via the Bolan Pass.
Iraq and Syria. In the 8th century, the Abbasid dynasty emerged and Baghdad, the current capital of Iraq, became a center of trade and Islamic culture. Bosker et al. (2013) point out that “In 800, only four decades after its founding, Baghdad had become a metropolis of more than 300,000 inhabitants…it was the center of economic and political power in the Islam world.” Syria, a neighboring country of Iraq, is located at the crossroads of West Asia, at the junction of the Turkish plateau in the north and the Arabian Peninsula in the south, and facing the Mediterranean Sea. It is a strategic point for East-West traffic. For this reason, various ethnic groups have arrived here and have created a diverse history. Around the 7th century, the Arabs, who were followers of Islam, quickly overran the whole of West Asia and established an Islamic empire. Damascus was chosen as the capital during the Umayyad dynasty, and prospered as a commercial and cultural city even after the capital was moved to Baghdad during the Abbasid dynasty. From around the 13th century, Damascus was invaded by the Crusaders from the west and the Mongols from the east, and from the 16th century it became a province of the Ottoman Empire, which ruled it for about 400 years.
To sum up, these observations suggest that our findings from West Africa are consistent with the global phenomenon. We are currently working on constructing market access measures, exploiting time-varying trade networks and populations, in grid cells covering the world over the centuries to augment this correlational claim.
6.2 Spatial Spillovers: Heterogeneity across Jihadist Organizations over Time
In order to explain the mechanism behind deviations from the expected pathways from history, i.e., to understand the spatial spillovers of jihadist events beyond the stylized locations predicted by pre-colonial state presence and core trading cities, we investigate two dimensions of heterogeneity from contemporary perspectives.
The first dimension is the heterogeneity across jihadist groups. There are multiple factions within the Islamic extremist group. We focus on the three largest factions—Al Qaeda, the Islamic State (IS), and Boko Haram—and assign each jihadist group to each of these factions or none of them based on multiple information sources. Recall that Figure A.3 shows violent events involving each of major jihadist groups in West Africa. Table D.1 categorizes the jihadist groups affiliated with Al Qaeda and the Islamic State.
Most jihadist groups in the world are networked. The two cores are Al Qaeda and the Islamic State, which are rivalries after their split in 2014 due to a difference in their ideologies (Hamming 2017; Novenario 2016; Zelin 2014).292929 Note that the relationship between Boko Haram and Al Qaeda is complicated and time-variant. See Cummings (2017) and Zenn (2020) for details. Note also that Islamic State in West Africa was established in 2015 after splitting from Boko Haram (Bohm 2020). Although it is rare that rival jihadist groups militarily fight, these groups compete for supremacy of the global jihadist movement.
The second dimension is the heterogeneity across time in contemporary periods. We divide the contemporary time periods 2001-2019 into the following three periods: 2001-2009, 2010-2015, and 2016-2019. The period 2010-2015 corresponds to the initial stage period of IS-linked groups, given that the split of the Islamic extremist groups into Al Qaeda and Islamic States as two competing factions occurred in February 2014. In the later period 2016-2019, violent events by IS-linked groups became more prevalent compared to the earlier period until 2015.
Figure D.1 maps the overlay of residuals in the same way as Figure 4 but separately for the IS-linked and Al-Qaeda-linked groups over contemporary time periods. While we observe similar areas of dark purple cells in these maps, locations of red cells (i.e., the spatial spillover) look highly heterogeneous both across organizations and across time.
In order to formally investigate these heterogeneity, Table D.2, Table D.3, and Table D.4 report results of the main empirical IV specification for Al Qaeda-linked groups, IS-linked groups, and Boko Haram, respectively. The following two findings stress the importance of examining the interaction between historical and contemporary factors.
Heterogeneous historical persistence across different contemporary time periods
Observing the three signs of coefficients (distance, onset, and intensity) in the tables, the results for all the three factions during 2010-2015 are consistent with the main result (Table 5). However, the explanatory power of historical determinants is highly heterogeneous across time within the Al Qaeda faction. For the Al Qaeda-linked groups, in the initial stage periods (2001-2009), all the three signs are opposite to those in 2010-15. Moreover, historical factors explain less for their evolution over time (2016-19) as well. For the IS-linked groups and Boko Haram, historical factors explain well both their emergence (-2015) and their evolution over time (2016-19), consistent with the main results.
Heterogeneous historical persistence across different factions
Historical and locational dependence and persistence are highly heterogeneous across different factions. Al Qaeda-affiliated groups depend less on the historical determinants compared to IS-affiliated ones or Boko Haram, according the comparison of results between factions during 2016-2019. Uncovering the exact causal mechanism behind this across-group heterogeneity is beyond the scope of this paper. One possible interpretation consistent with these results, from the perspective of groups’ organizational structures and operation strategies, is as follows. If Al Qaeda-linked groups have a core set of members to move around especially in their evolutional stages and the other groups depend more on local recruitment at any given time, and if local recruitment is facilitated in areas with a stronger persistence of jihadist ideology, then this across-faction heterogeneity is reasonably explainable.
Finally, we provide additional supportive arguments on the different operational strategies by Al Qaeda- and IS-affiliated groups. Simply assuming that jihadist groups attack both Muslim and non-Muslim (mostly Christian in West Africa) populations and that operating members of jihadist groups are Muslim, we define two concepts of the “insurgent’s (market) access” measures. Insurgent’s “target access” (ITA) in district is approximately defined as:
and insurgent’s “labor market access” (ILMA) in district is approximately defined as:
where populations are measured using the WorldPop datasets and the World Religion Database (WRD), both of which are introduced in Appendix C. Note that the unit of analysis for this exercise is a second-level subnational administrative division (not a grid cell), given the measurability of Muslim populations. Figure D.2 shows these units, contemporary Muslim population shares, and violent events by Al Qaeda- and IS-linked groups in 2016-19.
Table D.5 reports the regression results to show the correlation between violent events by each faction and ILMA, the key accessibility measure to the potential pool of insurgent’s labor market. The coefficient sign of log (ILMA) is surprisingly negative only for Al Qaeda-linked groups while it is positive for IS-linked groups and Boko Haram. This contrast is consistent with the contrast observed in the previous heterogeneity results in Table D.2 through Table D.4.
6.3 Robustness and Placebo
We check the robustness and placebo of our main empirical results in several distinct ways.
Among only countries covering the Sahara (Mauritania; Mali; Niger; Chad)
There are two motivations behind this robustness check. The first motivation is to check if the main results are not being driven by the Christian-Muslim difference of local populations. There are several areas relatively close to the coast where we observe a lot of jihads and there is a mix of Christian and Muslim populations (e.g., Nigeria and Burkina Faso). In contrast, the Muslim population share is almost 100% in Mauritania, Mali, Niger, and Chad (recall Figure D.2). The second motivation is to check if the main results are not solely being driven by the large ancient Chad Lake and the extreme concentration of jihad events by Boko Haram and the Islamic State in West Africa around north eastern Nigeria. Table A.6 and A.7 confirm the robustness of main results with this restricted sample. Since the significant persistent effects on contemporary jihad concentrate in 2010-2019, we report results in 2010-2019, 2010-2015, and 2016-2019 in the first three robustness checks that change geographical coverage of the sample or the treatment variable.
The persistent effects of pre-colonial cities that have populations smaller than 50,000 today
The motivation behind this robustness check is to defend against the caveat that contemporary jihads happen just around currently-populated locations. Although we confirmed the very weak correlations between contemporary cities and jihads in section 4.3.2, this additional test further strengthens our argument. Table A.8 and A.9 confirm the robustness of main results with this strict definition of the small contemporary cities.
Combination of the above two
By combining the above two restrictions, we can check the persistent effect of pre-colonial cities with smaller contemporary populations only within the sphere of Muslim-dominated areas. Notably, with this condition, we exclude not only the “Chad Lake effect” in Nigeria but also the “Timbuktu effect” in Mali. Table A.10 and A.11 nevertheless confirm the strong robustness of our main results.
Alternative measures of the accessibility of ancient water sources
Standard errors adjusting for spatial auto-correlations with different distance cutoffs
Table A.14 reports standard errors allowing for spatial correlation with higher distance cutoffs (200km, 300km, 400km, 500km, and 1000km) for the main IV estimation results. The size of standard error is non-monotonic in the size of distance cutoff. The main results in terms of statistical significance are robust to different cutoffs. At the largest standard errors, the coefficients from the three main outcomes (distance, onset, and intensity) are statistically significant at 5% levels.
Uppsala Conflict Data Program Georeferenced Event Dataset (UCDP-GED)
We use the UCDP-GED, an alternative conflict event dataset, to check robustness of the main results where we used the ACLED. There are two key differences between these two datasets. First, the UCDP-GED contains conflict and violent events that caused at least 1 fatality with the pair of actors (including the one-sided violence, in which case “civilians” is another side of actors) involved in the conflict that caused at least 25 fatalities in at least one calendar year. Given that the ACLED contains events regardless of the number of fatalities, we check the robustness of our results with relatively severe events. Second, the UCDP-GED contains conflict events in the entire world from 1989-2020 (though we pick events from 2001-2019). That is the reason why we used this dataset in our previous discussion of the global scale.
Table A.15 confirms the robustness of main results. Surprisingly, restricting to the relatively severe events by construction of this data, we also find statistically significant effects of the historical trade points on contemporary jihad (1% for the distance and 5% for the other two measures) during 2001-2009, unlike the main results from the ACLED. Note also that the coefficient size for the distance is similar between 2001-2009 and 2010-2019 and that the coefficient sizes for the onset and intensity in 2001-2009 are smaller than those in 2010-2019.
Other robustness checks
We also check the robustness of our main results with a variety of additional tests, including empirical analyses with, for example, alternative sources of historical trade points; alternative measures of access to historical trade points; alternative thresholds of classifying landlocked areas; various combinations of control variables. Tables of these tests will be available upon request.
Insignificant “persistent effects” on non-jihadist violence
One potential concern is that the IV regression result may not be due to the persistent effect of pre-colonial cities but due possibly to other unobserved structural factors that drive conflicts and violence around these locations. If this were the dominant mechanism, then we would also expect similar IV estimates for non-jihad conflict events. In order to address this concern, Table A.16 reports the result of IV regression with the same specification as the main empirical analysis except for changing the dependent variable to violent events involving non-state and non-jihadist organizations. For this test, we again select the countries covering the Sahara, not only to focus on Muslim-dominated areas for the same reason as above, but also to exclude coastal areas where clearly different types of conflicts (e.g., conflict in the Niger Delta) are taking place. That is, the sample grid cells correspond to those in Table A.7. This test works as another placebo test. For all of the three outcome variables (distance, onset, and intensity) in Table A.16, the coefficients are statistically insignificant and their sizes are also significantly smaller than those in the corresponding results with jihadist events reported in Table A.7.
Note that this contrast between jihadist and non-jihadist events does not mean that typical localized and contemporary factors underlying insurgency, such as economic and political factors, are not important for jihad. For example, proximity to contemporary water sources has similar effects (both statistically and economically) on jihadist events (column (3) in Table A.7) and non-jihadist events (column (3) Table A.16) during 2010-2019. As another example, Dowd (2015) and Dowd and Raleigh (2013) point out that not only the global jihadist ideology but also domestic contexts, such as political marginalization and grievances, are important factors driving jihadist movements in West Africa. Benjaminsen and Ba (2019), through anecdotes and interviews taken in multiple cities in Mali, argue that local land-use conflicts lead pastoral groups to support or join jihadist groups. McGuirk and Nunn (2022) quantitatively show that droughts in Africa, through the mechanism that they disrupt the arrangement between transhumant pastoralists and sedentary agriculturalists, impact both jihadist and non-jihadist events similarly. Combining our findings with these research, it is apparent that both jihad-specific and general factors underlying insurgency matter to explain contemporary jihad. Quantifying relative importance of these factors and understanding local dynamics of jihad are important future research agendas.
7 Conclusion
This paper attempted to uncover the evolution of cities and Islamist insurgency, so called jihad, in the process of the reversal of fortune over the centuries, with focuses on ancient, pre-colonial, colonial, and contemporary periods.
In West Africa, water access in ancient periods predicts the core locations of inland trade routes—the trans-Saharan caravan routes—founded up to the 1800s, when camel was the major transport mode and historical Islamic states played significant roles in the economy before European colonization. In contrast, ancient water access does not have a persistent influence on contemporary city formation and economic activities. After European colonization and the invention of modern trading technologies, along with the constant shrinking of water sources, landlocked pre-colonial core cities contracted or became extinct.
Employing an instrumental variable strategy, we show that these deserted locations have today been replaced by battlefields for jihadist organizations. As a local mechanism behind this main result, we argue that the power relations of Islamic states and European military during the colonial era in the 19th century shaped the persistence of jihadist ideology, driving the backlash in the form of jihad long after the colonial oppression. Moreover, the concentration of jihadist violence in “past-core-and-present-periphery” areas in West Africa is also consistent with a global-scale phenomenon, which we argue by drawing on the historical overland trade routes leading from Asia to Europe. In other words, contemporary jihads occur in areas that experienced reversals of fortune over the centuries. Finally, the spillover of violent events beyond these stylized locations is partly explained by contemporary time trends and organizational heterogeneity among large factions (Al Qaeda; the Islamic State; Boko Haram) with a complicated competition and alliance structure. Future research is warranted to investigate the interaction between historical and contemporary factors.
References
- (1)
- Acemoglu and Wolitzky (2014) Acemoglu, Daron and Alexander Wolitzky, “Cycles of conflict: An economic model,” American Economic Review, 2014, 104 (4), 1350–67.
- Acemoglu et al. (2010) , Andrea Vindigni, and Davide Ticchi, “Persistence of civil wars,” Journal of the European Economic Association, 2010, 8 (2-3), 664–676.
- ACLED (2019) ACLED, “Armed Conflict Location & Event Data Project (ACLED) Codebook,” 2019.
- Alesina et al. (2020) Alesina, Alberto, Sebastian Hohmann, Stelios Michalopoulos, and Elias Papaioannou, “Religion and educational mobility in africa,” Technical Report, National Bureau of Economic Research 2020.
- Alix-Garcia and Sellars (2020) Alix-Garcia, Jennifer and Emily A Sellars, “Locational fundamentals, trade, and the changing urban landscape of Mexico,” Journal of Urban Economics, 2020, 116, 103213.
- Allen et al. (2020) Allen, RC, MC Bertazzini, and L Heldring, “The economic origins of government,” 2020.
- Allen and Donaldson (2021) Allen, Treb and Dave Donaldson, “Persistence and path dependence: A primer,” Regional Science and Urban Economics, 2021, p. 103724.
- Arbatlı et al. (2020) Arbatlı, Cemal Eren, Quamrul H Ashraf, Oded Galor, and Marc Klemp, “Diversity and conflict,” Econometrica, 2020, 88 (2), 727–797.
- Austen (2010) Austen, Ralph A, Trans-Saharan Africa in world history, Oxford University Press, 2010.
- Azarya (1980) Azarya, Victor, “Traders and the center in Massina, Kong, and Samori’s state,” The International Journal of African Historical Studies, 1980, 13 (3), 420–456.
- Bakker et al. (2021) Bakker, Jan David, Stephan Maurer, Jörn-Steffen Pischke, and Ferdinand Rauch, “Of mice and merchants: connectedness and the location of economic activity in the Iron Age,” Review of Economics and Statistics, 2021, 103 (4), 652–665.
- Baliga and Sjöström (2020) Baliga, Sandeep and Tomas Sjöström, “The strategy and technology of conflict,” Journal of Political Economy, 2020, 128 (8), 3186–3219.
- Battuta (2004) Battuta, Ibn, Travels in Asia and Africa: 1325-1354, Routledge, 2004.
- Bauer et al. (2022) Bauer, Vincent, Melina R Platas, and Jeremy M Weinstein, “Legacies of Islamic Rule in Africa: Colonial Responses and Contemporary Development,” World Development, 2022, 152, 105750.
- Bazzi et al. (2020) Bazzi, Samuel, Gabriel Koehler-Derrick, and Benjamin Marx, “The institutional foundations of religious politics: Evidence from indonesia,” The Quarterly Journal of Economics, 2020, 135 (2), 845–911.
- Benjaminsen and Ba (2019) Benjaminsen, Tor A and Boubacar Ba, “Why do pastoralists in Mali join jihadist groups? A political ecological explanation,” The Journal of Peasant Studies, 2019, 46 (1), 1–20.
- Berman (2011) Berman, Eli, Radical, religious, and violent: The new economics of terrorism, MIT press, 2011.
- Berman et al. (2011) , Jacob N Shapiro, and Joseph H Felter, “Can hearts and minds be bought? The economics of counterinsurgency in Iraq,” Journal of Political Economy, 2011, 119 (4), 766–819.
- Besley and Reynal-Querol (2014) Besley, Timothy and Marta Reynal-Querol, “The legacy of historical conflict: Evidence from Africa,” American Political Science Review, 2014, 108 (2), 319–336.
- Bleakley and Lin (2012) Bleakley, Hoyt and Jeffrey Lin, “Portage and path dependence,” The quarterly journal of economics, 2012, 127 (2), 587–644.
- Boahen (1985) Boahen, A Adu, “General History of Africa. VII. Africa under Colonial Domination 1880-1935. Berkeley,” 1985.
- Bohm (2020) Bohm, Vera, “Boko Haram in 2020,” Technical Report, International Institute for Counter-Terrorism (ICT) 2020.
- Bosker (2021) Bosker, Maarten, “City origins,” Regional Science and Urban Economics, 2021, p. 103677.
- Bosker and Buringh (2017) and Eltjo Buringh, “City seeds: geography and the origins of the European city system,” Journal of Urban Economics, 2017, 98, 139–157.
- Bosker et al. (2013) , , and Jan Luiten Van Zanden, “From baghdad to london: Unraveling urban development in europe, the middle east, and north africa, 800–1800,” Review of Economics and Statistics, 2013, 95 (4), 1418–1437.
- Bossard (2014) Bossard, Laurent, “An atlas of the Sahara-Sahel: geography, economics and security,” 2014.
- Bovill (1968) Bovill, Edward, The Golden Trade of the Moors, Oxford University Press, London, 1968.
- Boxell et al. (2019) Boxell, Levi, John T Dalton, and Tin Cheuk Leung, “The Slave Trade and Conflict in Africa, 1400-2000,” Available at SSRN 3403796, 2019.
- Brecke (1999) Brecke, Peter, “Violent conflicts 1400 AD to the present in different regions of the world,” in “1999 Meeting of the Peace Science Society” 1999.
- Brecke (2012) , “Notes regarding the conflict catalog,” Center for Global Economic History, 2012.
- Brockmeyer et al. (2022) Brockmeyer, Anne, Quy-Toan Do, Clément Joubert, Kartika Bhatia, and Mohamed Abdel Jelil, “Transnational Terrorist Recruitment: Evidence from Daesh Personnel Records,” The Review of Economics and Statistics, 01 2022, pp. 1–46.
- Brown and Cuberes (2020) Brown, J and David Cuberes, “The Birth and Persistence of Cities: Evidence from Oklahoma’s First Fifty Years of Urban Growth,” 2020.
- Cagé and Rueda (2020) Cagé, Julia and Valeria Rueda, “Sex and the mission: the conflicting effects of early Christian missions on HIV in sub-Saharan Africa,” Journal of Demographic Economics, 2020, 86 (3), 213–257.
- Canning et al. (2021) Canning, David, Marie Christelle Mabeu, and Roland Pongou, “Colonial Origins and Fertility: Can the Market Overcome History?,” 2021.
- Chaney (2013) Chaney, Eric, “Revolt on the Nile: Economic shocks, religion, and political power,” Econometrica, 2013, 81 (5), 2033–2053.
- Chaney et al. (2012) , George A Akerlof, and Lisa Blaydes, “Democratic change in the Arab world, past and present [with Comments and Discussion],” Brookings Papers on Economic Activity, 2012, pp. 363–414.
- Chassang and Miquel (2010) Chassang, Sylvain and Gerard Padró I Miquel, “Conflict and deterrence under strategic risk,” The Quarterly Journal of Economics, 2010, 125 (4), 1821–1858.
- Chen and Nordhaus (2015) Chen, Xi and William Nordhaus, “A test of the new VIIRS lights data set: Population and economic output in Africa,” Remote Sensing, 2015, 7 (4), 4937–4947.
- Chu and Skinner (1965) Chu, Daniel and Elliott Skinner, A glorious age in Africa, Zenith Books, 1965.
- Condra et al. (2018) Condra, Luke N, James D Long, Andrew C Shaver, and Austin L Wright, “The logic of insurgent electoral violence,” American Economic Review, 2018, 108 (11), 3199–3231.
- Connah (1987) Connah, Graham, African Civilizations: precolonial cities and states in tropical Africa, Cambridge University Press, 1987.
- Cook (2015) Cook, David, “Understanding jihad,” in “Understanding Jihad,” University of California Press, 2015.
- Crowder (1971) Crowder, Michael, West African resistance: The military response to colonial occupation, London: Hutchinson, 1971.
- Cummings (2017) Cummings, Ryan, “A Jihadi Takeover Bid in Nigeria? The Evolving Relationship between Boko Haram and al-Qaida,” CTC Sentinel, 2017, 10 (11), 24–28.
- Curtin (1971) Curtin, Philip D, “Jihad in West Africa: early phases and inter-relations in Mauritania and Senegal,” The Journal of African History, 1971, 12 (1), 11–24.
- deMenocal et al. (2000) deMenocal, Peter, Joseph Ortiz, Tom Guilderson, Jess Adkins, Michael Sarnthein, Linda Baker, and Martha Yarusinsky, “Abrupt onset and termination of the African Humid Period:: rapid climate responses to gradual insolation forcing,” Quaternary science reviews, 2000, 19 (1-5), 347–361.
- Depetris-Chauvin (2015) Depetris-Chauvin, Emilio, “State history and contemporary conflict: Evidence from sub-saharan africa,” Available at SSRN 2679594, 2015.
- Depetris-Chauvin and Özak (2020) Depetris-Chauvin, Emilio and Ömer Özak, “Borderline Disorder:(De facto) Historical Ethnic Borders and Contemporary Conflict in Africa,” Available at SSRN 3541025, 2020.
- Dincecco et al. (2019) Dincecco, Mark, James Fenske, and Massimiliano Gaetano Onorato, “Is Africa different? Historical conflict and state development,” Economic History of Developing Regions, 2019, 34 (2), 209–250.
- Dowd (2015) Dowd, Caitriona, “Grievances, governance and Islamist violence in sub-Saharan Africa,” The Journal of Modern African Studies, 2015, 53 (4), 505–531.
- Dowd and Raleigh (2013) and Clionadh Raleigh, “The myth of global Islamic terrorism and local conflict in Mali and the Sahel,” African affairs, 2013, 112 (448), 498–509.
- Drake et al. (2011) Drake, Nick A, Roger M Blench, Simon J Armitage, Charlie S Bristow, and Kevin H White, “Ancient watercourses and biogeography of the Sahara explain the peopling of the desert,” Proceedings of the National Academy of Sciences, 2011, 108 (2), 458–462.
- Drake and Bristow (2006) Drake, Nick and Charlie Bristow, “Shorelines in the Sahara: geomorphological evidence for an enhanced monsoon from palaeolake Megachad,” The Holocene, 2006, 16 (6), 901–911.
- Dunne et al. (2012) Dunne, Julie, Richard P Evershed, Mélanie Salque, Lucy Cramp, Silvia Bruni, Kathleen Ryan, Stefano Biagetti, and Savino di Lernia, “First dairying in green Saharan Africa in the fifth millennium BC,” Nature, 2012, 486 (7403), 390–394.
- Ellingsen (2021) Ellingsen, Sebastian, “Long-distance trade and long-term persistence,” Technical Report, Mimeo, Universitat Pompeu Fabra and IPEG 2021.
- Elvidge et al. (2021) Elvidge, Christopher D, Mikhail Zhizhin, Tilottama Ghosh, Feng-Chi Hsu, and Jay Taneja, “Annual time series of global VIIRS nighttime lights derived from monthly averages: 2012 to 2019,” Remote Sensing, 2021, 13 (5), 922.
- Esposito (1999) Esposito, John L, The Islamic threat: Myth or reality?, Oxford University Press, USA, 1999.
- Fenske (2014) Fenske, James, “Ecology, trade, and states in pre-colonial Africa,” Journal of the European Economic Association, 2014, 12 (3), 612–640.
- Fenske and Kala (2017) and Namrata Kala, “1807: Economic shocks, conflict and the slave trade,” Journal of Development Economics, 2017, 126, 66–76.
- Fetzer et al. (2021) Fetzer, Thiemo, Pedro CL Souza, Oliver Vanden Eynde, and Austin L Wright, “Security transitions,” American Economic Review, 2021, 111 (7), 2275–2308.
- Fouka (2020) Fouka, Vasiliki, “Backlash: The unintended effects of language prohibition in US schools after World War I,” The Review of Economic Studies, 2020, 87 (1), 204–239.
- García Ponce and Wantchekon (2011) García Ponce, Omar and Leonard Wantchekon, “Echoes of Colonial Repression: The Long-Term Effects of the 1947 Revolt upon Political Attitudes in Madagascar,” 2011.
- Gibson et al. (2020) Gibson, John, Susan Olivia, and Geua Boe-Gibson, “Night lights in economics: Sources and uses 1,” Journal of Economic Surveys, 2020, 34 (5), 955–980.
- Gibson et al. (2021) , , , and Chao Li, “Which night lights data should we use in economics, and where?,” Journal of Development Economics, 2021, 149, 102602.
- Hamming (2017) Hamming, Tore Refslund, “Jihadi competition and political preferences,” Perspectives on terrorism, 2017, 11 (6), 63–88.
- Hawthorne (2003) Hawthorne, Walter, Planting rice and harvesting slaves, Heinemann, 2003.
- Heldring (2021) Heldring, Leander, “The origins of violence in Rwanda,” The Review of Economic Studies, 2021, 88 (2), 730–763.
- Heldring and Robinson (2018) and James A Robinson, “Colonialism and Development in Africa,” The Oxford Handbook of the Politics of Development, 2018, p. 295.
- Henderson et al. (2018) Henderson, J Vernon, Tim Squires, Adam Storeygard, and David Weil, “The global distribution of economic activity: nature, history, and the role of trade,” The Quarterly Journal of Economics, 2018, 133 (1), 357–406.
- Huillery (2011) Huillery, Elise, “The impact of European settlement within French West Africa: did pre-colonial prosperous areas fall behind?,” Journal of African Economies, 2011, 20 (2), 263–311.
- Iyer (2016) Iyer, Sriya, “The new economics of religion,” Journal of Economic Literature, 2016, 54 (2), 395–441.
- Jedwab et al. (2017) Jedwab, Remi, Edward Kerby, and Alexander Moradi, “History, path dependence and development: Evidence from colonial railways, settlers and cities in Kenya,” The Economic Journal, 2017, 127 (603), 1467–1494.
- Jedwab et al. (2022) , Federico Haslop, Roman David Zarate, and Rodriguez-Castelan Carlos, “The Real Effects of Climate Change in the Poorest Countries: Evidence from the Permanent Shrinking of Lake Chad,” 2022.
- Jha (2013) Jha, Saumitra, “Trade, institutions, and ethnic tolerance: Evidence from South Asia,” American political Science review, 2013, 107 (4), 806–832.
- Kane (2017) Kane, Ousmane Oumar, Beyond Timbuktu, Harvard University Press, 2017.
- Kennedy (2002) Kennedy, Hugh, “An historical atlas of Islam,” 2002.
- Ki-Zerbo et al. (1997) Ki-Zerbo, Joseph, Djibril Tamsir Niane et al., “General history of Africa, abridged edition, v. 4: Africa from the twelfth to the sixteenth century,” 1997.
- Kitamura and Lagerlöf (2021) Kitamura, Shuhei and Nils-Petter Lagerlöf, “Cities, Conflict, and Corridors,” 2021.
- Kuran (2018) Kuran, Timur, “Islam and economic performance: Historical and contemporary links,” Journal of Economic Literature, 2018, 56 (4), 1292–1359.
- Lapidus (2002) Lapidus, Ira M, A history of Islamic societies, Cambridge University Press, 2002.
- Law (1976) Law, Robin, “Horses, firearms, and political power in pre-colonial West Africa,” Past & Present, 1976, 72 (1), 112–132.
- Limodio (2021) Limodio, Nicola, “Terrorism financing, recruitment and attacks: Evidence from a natural experiment in pakistan,” Technical Report, Working Paper 2021.
- Lovejoy (2011) Lovejoy, Paul E, Transformations in slavery: a history of slavery in Africa, Vol. 117, Cambridge University Press, 2011.
- Lovejoy (2016) , Jihād in West Africa during the age of revolutions, Ohio University Press, 2016.
- Maloney and Valencia Caicedo (2016) Maloney, William F and Felipe Valencia Caicedo, “The persistence of (subnational) fortune,” The Economic Journal, 2016, 126 (598), 2363–2401.
- McGowan (1981) McGowan, Winston, “Fula Resistance to French Expansion into Futa Jallon 1889–1896,” The Journal of African History, 1981, 22 (2), 245–261.
- McGuirk and Nunn (2022) McGuirk, Eoin F and Nathan Nunn, “Transhumant Pastoralism, Climate Change, and Conflict in Africa,” Technical Report, Working Paper 2022.
- Michaels and Rauch (2018) Michaels, Guy and Ferdinand Rauch, “Resetting the urban network: 117–2012,” The Economic Journal, 2018, 128 (608), 378–412.
- Michalopoulos (2012) Michalopoulos, Stelios, “The origins of ethnolinguistic diversity,” American Economic Review, 2012, 102 (4), 1508–39.
- Michalopoulos et al. (2016) , Alireza Naghavi, and Giovanni Prarolo, “Islam, inequality and pre-industrial comparative development,” Journal of Development Economics, 2016, 120, 86–98.
- Michalopoulos et al. (2018) , , and , “Trade and Geography in the Spread of Islam,” The Economic Journal, 2018, 128 (616), 3210–3241.
- Michalopoulos and Papaioannou (2013) and Elias Papaioannou, “Pre-colonial ethnic institutions and contemporary African development,” Econometrica, 2013, 81 (1), 113–152.
- Michalopoulos and Papaioannou (2016) and , “The long-run effects of the scramble for Africa,” American Economic Review, 2016, 106 (7), 1802–48.
- Michalopoulos and Papaioannou (2020) and , “Historical legacies and African development,” Journal of Economic Literature, 2020, 58 (1), 53–128.
- Moscona et al. (2020) Moscona, Jacob, Nathan Nunn, and James A Robinson, “Segmentary Lineage Organization and Conflict in Sub-Saharan Africa,” Econometrica, 2020, 88 (5), 1999–2036.
- Nagy (2020) Nagy, Dávid Krisztián, “Hinterlands, city formation and growth: Evidence from the US westward expansion,” 2020.
- Novenario (2016) Novenario, Celine Marie I, “Differentiating Al Qaeda and the Islamic State through strategies publicized in Jihadist magazines,” Studies in Conflict & Terrorism, 2016, 39 (11), 953–967.
- Nunn (2008) Nunn, Nathan, “The long-term effects of Africa’s slave trades,” The Quarterly Journal of Economics, 2008, 123 (1), 139–176.
- Nunn and Puga (2012) and Diego Puga, “Ruggedness: The blessing of bad geography in Africa,” Review of Economics and Statistics, 2012, 94 (1), 20–36.
- Nunn et al. (2014) , Emmanuel Akyeampong, Robert Bates, and James A Robinson, “Gender and missionary influence in colonial Africa,” African development in historical perspective, 2014.
- O’Brien (1999) O’Brien, PK, “(Ed.). Atlas of World History. New York, NY: Oxford University Press,” 1999.
- Okoye et al. (2019) Okoye, Dozie, Roland Pongou, and Tite Yokossi, “New technology, better economy? The heterogeneous impact of colonial railroads in Nigeria,” Journal of Development Economics, 2019, 140, 320–354.
- Özak (2010) Özak, Ömer, “The voyage of homo-economicus: Some economic measures of distance,” 2010.
- Özak (2018) , “Distance to the pre-industrial technological frontier and economic development,” Journal of Economic Growth, 2018, 23 (2), 175–221.
- Raleigh et al. (2010) Raleigh, Clionadh, Andrew Linke, Håvard Hegre, and Joakim Karlsen, “Introducing ACLED: an armed conflict location and event dataset: special data feature,” Journal of peace research, 2010, 47 (5), 651–660.
- Redding et al. (2011) Redding, Stephen J, Daniel M Sturm, and Nikolaus Wolf, “History and industry location: evidence from German airports,” Review of Economics and Statistics, 2011, 93 (3), 814–831.
- Rexer (2021) Rexer, Jonah, “The Brides of Boko Haram: Economic Shocks, Marriage Practices, and Insurgency in Nigeria,” 2021.
- Ricart-Huguet (2021) Ricart-Huguet, Joan, “The Origins of Colonial Investments in Former British and French Africa,” British Journal of Political Science, 2021, p. 1–22.
- Rohner et al. (2013) Rohner, Dominic, Mathias Thoenig, and Fabrizio Zilibotti, “War signals: A theory of trade, trust, and conflict,” Review of Economic Studies, 2013, 80 (3), 1114–1147.
- Rubin (2017) Rubin, Jared, Rulers, Religion, and Riches: Why the West got rich and the Middle East did not, Cambridge University Press, 2017.
- Ruthven et al. (2004) Ruthven, Malise, Azim Nanji, Abdou Filali-Ansary et al., Historical atlas of Islam, Harvard University Press, 2004.
- Sereno et al. (2008) Sereno, PC, EAA Garcea, H Jousse, CM Stojanowski, JF Saliege et al., “Lakeside Cemeteries in the Sahara: 5000 Years of Holocene Population and,” 2008.
- Seror (2020) Seror, Marlon, “Random river: Trade and rent extraction in imperial China,” Technical Report, Document de travail 2020.
- Shaw (2013) Shaw, Scott, “Fallout in the Sahel: the geographic spread of conflict from Libya to Mali,” Canadian Foreign Policy Journal, 2013, 19 (2), 199–210.
- Singleton (2004) Singleton, Brent D, “African bibliophiles: Books and libraries in medieval Timbuktu,” Libraries & Culture, 2004, 39 (1), 1–12.
- Smith (1989) Smith, Robert Sydney, Warfare & diplomacy in pre-colonial West Africa, Univ of Wisconsin Press, 1989.
- Tao et al. (2016) Tao, Ran, Daniel Strandow, Michael Findley, Jean-Claude Thill, and James Walsh, “A hybrid approach to modeling territorial control in violent armed conflicts,” Transactions in GIS, 2016, 20 (3), 413–425.
- Trimingham (1962) Trimingham, John Spencer, A History of Islam in West Africa.[With Maps.]., Oxford University Press, 1962.
- Walther and Miles (2017) Walther, Olivier J and William FS Miles, African Border Disorders: Addressing Transnational Extremist Organizations, Routledge, 2017.
- Zelin (2014) Zelin, Aaron Y, “The war between ISIS and al-Qaeda for supremacy of the global jihadist movement,” The Washington Institute for Near East Policy, 2014, 20 (1), 1–11.
- Zenn (2020) Zenn, Jacob, “Boko Haram’s conquest for the Caliphate: how Al Qaeda helped Islamic State acquire territory,” Studies in Conflict & Terrorism, 2020, 43 (2), 89–122.
(A) Log (Distance to a pre-colonial trade point) (1) (2) (3) (4) (5) (6) (7) (8) (9) Log (Distance to an ancient lake) 0.0371∗ 0.0377∗∗ 0.0679∗∗∗ (0.0198) (0.0188) (0.0196) Log (Distance to an ancient river) 0.0613∗∗ 0.0466∗ 0.00563 (0.0267) (0.0258) (0.0209) Log (Distance to an ancient lake/river) 0.0476∗∗ 0.0354∗ 0.0414∗∗ (0.0221) (0.0210) (0.0175) Log (Distance to a lake/river today) -0.00600 -0.0168 0.0371 -0.0117 -0.0207 0.0327 -0.0114 -0.0205 0.0280 (0.0293) (0.0280) (0.0241) (0.0297) (0.0286) (0.0253) (0.0295) (0.0285) (0.0249) R2 0.095 0.150 0.338 0.100 0.150 0.322 0.097 0.148 0.327 Adj-R2 0.093 0.147 0.336 0.097 0.147 0.320 0.095 0.146 0.325 Observations 2616 2616 2616 2616 2616 2616 2616 2616 2616 Mean (Dep. Var.) 5.149 5.149 5.149 5.149 5.149 5.149 5.149 5.149 5.149 SD (Dep. Var.) 0.726 0.726 0.726 0.726 0.726 0.726 0.726 0.726 0.726 (B) Log (Distance to a landlocked trade point ( 100,000)) (1) (2) (3) (4) (5) (6) (7) (8) (9) Log (Distance to an ancient lake) 0.105∗∗∗ 0.106∗∗∗ 0.127∗∗∗ (0.0162) (0.0163) (0.0179) Log (Distance to an ancient river) 0.0526∗∗∗ 0.0488∗∗∗ 0.0184 (0.0160) (0.0160) (0.0172) Log (Distance to an ancient lake/river) 0.0843∗∗∗ 0.0818∗∗∗ 0.0757∗∗∗ (0.0133) (0.0133) (0.0151) Log (Distance to a lake/river today) 0.0148 0.0114 0.0313∗ 0.00908 0.00718 0.0217 0.00476 0.00293 0.0145 (0.0224) (0.0221) (0.0190) (0.0219) (0.0216) (0.0202) (0.0220) (0.0218) (0.0198) R2 0.663 0.666 0.729 0.633 0.635 0.688 0.646 0.648 0.699 Adj-R2 0.662 0.666 0.729 0.632 0.634 0.687 0.645 0.647 0.699 Observations 2616 2616 2616 2616 2616 2616 2616 2616 2616 Mean (Dep. Var.) 5.951 5.951 5.951 5.951 5.951 5.951 5.951 5.951 5.951 SD (Dep. Var.) 0.840 0.840 0.840 0.840 0.840 0.840 0.840 0.840 0.840 (C) Log (Distance to a trade route up to 1800) (1) (2) (3) (4) (5) (6) (7) (8) (9) Log (Distance to an ancient lake) 0.0464 0.0429 0.105∗∗∗ (0.0340) (0.0338) (0.0282) Log (Distance to an ancient river) 0.115∗∗∗ 0.0999∗∗∗ 0.00481 (0.0315) (0.0308) (0.0258) Log (Distance to an ancient lake/river) 0.0733∗∗ 0.0597∗ 0.0770∗∗∗ (0.0316) (0.0310) (0.0269) Log (Distance to a lake/river today) -0.0333 -0.0416 0.0230 -0.0437 -0.0498 0.0169 -0.0415 -0.0477 0.00711 (0.0369) (0.0362) (0.0314) (0.0379) (0.0374) (0.0342) (0.0374) (0.0369) (0.0332) R2 0.121 0.149 0.379 0.136 0.160 0.358 0.127 0.152 0.367 Adj-R2 0.119 0.147 0.377 0.134 0.158 0.356 0.124 0.150 0.365 Observations 2616 2616 2616 2616 2616 2616 2616 2616 2616 Mean (Dep. Var.) 4.462 4.462 4.462 4.462 4.462 4.462 4.462 4.462 4.462 SD (Dep. Var.) 0.984 0.984 0.984 0.984 0.984 0.984 0.984 0.984 0.984 (D) Log (Distance to a landlocked trade route up to 1800) (1) (2) (3) (4) (5) (6) (7) (8) (9) Log (Distance to an ancient lake) 0.0886∗∗ 0.0872∗∗ 0.170∗∗∗ (0.0347) (0.0350) (0.0287) Log (Distance to an ancient river) 0.0806∗∗∗ 0.0753∗∗∗ -0.000969 (0.0237) (0.0241) (0.0241) Log (Distance to an ancient lake/river) 0.0859∗∗∗ 0.0814∗∗∗ 0.112∗∗∗ (0.0264) (0.0265) (0.0255) Log (Distance to a lake/river today) -0.0183 -0.0209 0.0288 -0.0262 -0.0272 0.0204 -0.0283 -0.0292 0.00480 (0.0363) (0.0363) (0.0272) (0.0383) (0.0381) (0.0324) (0.0377) (0.0376) (0.0313) R2 0.533 0.535 0.703 0.527 0.529 0.665 0.530 0.532 0.678 Adj-R2 0.531 0.534 0.702 0.525 0.528 0.664 0.529 0.531 0.677 Observations 2616 2616 2616 2616 2616 2616 2616 2616 2616 Mean (Dep. Var.) 5.587 5.587 5.587 5.587 5.587 5.587 5.587 5.587 5.587 SD (Dep. Var.) 1.175 1.175 1.175 1.175 1.175 1.175 1.175 1.175 1.175 Colonizer FE No Yes No No Yes No No Yes No Country FE No No Yes No No Yes No No Yes Geographic Controls Yes Yes Yes Yes Yes Yes Yes Yes Yes • Notes: All regressions are estimated using OLS. The unit of observation is a grid cell (about 55km × 55km). All Log(Distance) variables indicate the logarithm of one plus distance (km) to the nearest object. The dependent variables are (A) the logarithm of one plus distance (km) to the nearest pre-colonial trade point, (B) the logarithm of one plus distance (km) to the nearest pre-colonial landlocked trade point whose contemporary population is less than 100,000, (C) the logarithm of one plus distance (km) to the nearest pre-colonial trade route up to 1800, (D) the logarithm of one plus distance (km) to the nearest pre-colonial landlocked trade route up to 1800. Landlocked is defined as the 1000km faraway from the nearest coast point. We control for landlocked dummy, average malaria suitability, average caloric suitability in post 1500, average elevation, and ruggedness in all the specifications. We report standard errors adjusting for spatial auto-correlation with distance cutoff at 100km in parentheses. • ∗ , ∗∗ , ∗∗∗ .
(A) The entire West Africa Log (Distance to a city ( 50,000)) (1) (2) Log (Distance to an ancient lake) -0.0259 -0.00935 (0.0212) (0.0179) Log (Distance to a lake/river today) 0.346∗∗∗ 0.315∗∗∗ (0.0254) (0.0243) R2 0.660 0.730 Adj-R2 0.659 0.729 Observations 2616 2616 Mean (Dep. Var.) 4.497 4.497 SD (Dep. Var.) 1.167 1.167 (B) Countries with the Sahara Log (Distance to a city ( 10,000)) (1) (2) Log (Distance to an ancient lake) -0.00809 -0.0149 (0.0203) (0.0207) Log (Distance to a lake/river today) 0.420∗∗∗ 0.411∗∗∗ (0.0412) (0.0403) R2 0.557 0.573 Adj-R2 0.556 0.571 Observations 1616 1616 Mean (Dep. Var.) 4.780 4.426 SD (Dep. Var.) 0.919 0.931 (C) The entire West Africa Night light luminosity in 2015 (1) (2) Log (Distance to an ancient lake) 0.252∗∗∗ 0.140∗∗∗ (0.0402) (0.0467) Log (Distance to a lake/river today) -0.522∗∗∗ -0.439∗∗∗ (0.0704) (0.0643) R2 0.432 0.531 Adj-R2 0.430 0.529 Observations 2616 2616 Mean (Dep. Var.) 1.875 1.875 SD (Dep. Var.) 2.636 2.636 Country FE No Yes Geographic Controls Yes Yes • Notes: All regressions are estimated using OLS. The unit of observation is a grid cell (about 55km × 55km). All Log(Distance) variables indicate the logarithm of one plus distance (km) to the nearest object. The dependent variables are (A) the logarithm of one plus distance (km) to the nearest city whose contemporary population over 50,000, (B) the logarithm of one plus distance (km) to the nearest city whose contemporary population over 10,000, (C) the logarithm of one plus total night light luminosity (VIISR) in 2015. In only (B), the observations restrict grid cells in Mauritania, Mali, Niger and Chad. We control for landlocked dummy, average malaria suitability, average caloric suitability in post 1500, average elevation, and ruggedness in all the specifications. We report standard errors adjusting for spatial auto-correlation with distance cutoff at 100km in parentheses. • ∗ , ∗∗ , ∗∗∗ .
(A) Log(Distance to a colonial railway) (1) (2) (3) Log (Distance to an ancient lake) -0.133∗∗∗ -0.0976∗∗∗ (0.0142) (0.0118) Log (Distance to a coast) 0.325∗∗∗ 0.256∗∗∗ (0.0725) (0.0727) Log (Distance to a lake/river today) 0.0743∗∗∗ 0.0483∗ 0.0536∗∗ (0.0263) (0.0266) (0.0261) R2 0.509 0.516 0.536 Adj-R2 0.508 0.515 0.534 Observations 2616 2616 2616 Mean (Dep. Var.) 6.135 6.135 6.135 SD (Dep. Var.) 0.988 0.988 0.988 (B) Log(Distance to a missionary activity) (1) (2) (3) Log (Distance to an ancient lake) -0.0578∗∗∗ 0.0155 (0.0140) (0.0127) Log (Distance to a coast) 0.524∗∗∗ 0.535∗∗∗ (0.0475) (0.0500) Log (Distance to a lake/river today) 0.113∗∗∗ 0.0706∗∗∗ 0.0697∗∗∗ (0.0252) (0.0195) (0.0195) R2 0.679 0.767 0.768 Adj-R2 0.678 0.767 0.767 Observations 2616 2616 2616 Mean (Dep. Var.) 5.757 5.757 5.757 SD (Dep. Var.) 1.127 1.127 1.127 (C) Log(Atlantic slave exports in 1800s) (1) (2) (3) Log (Distance to an ancient lake) 0.309∗∗∗ 0.186∗∗∗ (0.0721) (0.0714) Log (Distance to a coast) -1.019∗∗∗ -0.886∗∗∗ (0.227) (0.234) Log (Distance to a lake/river today) 0.0786 0.144 0.133 (0.106) (0.102) (0.103) R2 0.300 0.317 0.322 Adj-R2 0.298 0.315 0.320 Observations 2489 2489 2489 Mean (Dep. Var.) 2.720 2.720 2.720 SD (Dep. Var.) 3.827 3.827 3.827 Colonizer FE Yes Yes Yes Geographic Controls Yes Yes Yes • Notes: All regressions are estimated using OLS. The unit of observation is a grid cell (about 55km × 55km). All Log(Distance) variables indicate the logarithm of one plus distance (km) to the nearest object. The dependent variables are (A) the logarithm of one plus distance (km) to the nearest colonial railway line, (B) the logarithm of one plus distance (km) to the nearest Christian mission station in late 19th century, (C) the logarithm of one plus the number of Atlantic slave trade exports in 1800s. In Panel (C), the number of observations decreases due to the missing values for the dependent variable. We control for landlocked dummy, average malaria suitability, average caloric suitability in post 1500, average elevation, and ruggedness in all the specifications. We report standard errors adjusting for spatial auto-correlation with distance cutoff at 100km in parentheses. • ∗ , ∗∗ , ∗∗∗ .
(A) Geography (1) (2) (3) (4) (5) Ecological diversity Temperature Precipitation Caloric suitability Pastoralism suitability Log (Distance to an ancient lake) 0.00144 -0.0149 3.356∗∗∗ 0.00522∗∗∗ -0.00426 (0.00526) (0.0411) (0.654) (0.00127) (0.00642) R2 0.011 0.606 0.875 0.994 0.519 Adj-R2 0.008 0.605 0.874 0.994 0.518 Observations 2571 2615 2615 2616 2616 Mean (Dep. Var.) 0.416 28.065 54.530 0.532 0.375 SD (Dep. Var.) 0.422 2.007 52.202 0.533 0.194 (B) Pre-colonial culture and institution (1) (2) (3) (4) (5) Jurisdictional hierarchy Polygamy Irrigation Class stratification Local headman Log (Distance to an ancient lake) -0.0279 -0.0190 0.000665 -0.0119 -0.0104 (0.0357) (0.0125) (0.0118) (0.0213) (0.00789) R2 0.356 0.336 0.563 0.189 0.616 Adj-R2 0.353 0.333 0.561 0.185 0.614 Observations 1749 1869 1880 1700 1345 Mean (Dep. Var.) 2.443 0.836 0.272 1.332 0.182 SD (Dep. Var.) 0.888 0.371 0.445 0.705 0.386 Country FE Yes Yes Yes Yes Yes Geographic Controls Yes Yes Yes Yes Yes • Notes: All regressions are estimated using OLS. The unit of observation is a grid cell (about 55km × 55km). In panel (A), the dependent varibles are (1) ecological diversity (2) average temperature (3) average precipitation (4) average caloric suitability (5) average pastoralism suitability. In panel (B), the dependent varibles from the Ethnographic Atlas are (1) jurisdictional hierarchy (v33) (2) polygamy (v9) (3) irrigation (v28) (4) class stratification (v66) (5) local headman (v72). We control for the logarithm of distance (km) to the nearest water sources today, landlocked dummy, average malaria suitability, average caloric suitability in post 1500, average elevation, ruggedness, and logarithm of one plus population in 2010 in all the specifications. We report standard errors adjusting for spatial auto-correlation with distance cutoff at 100km in parentheses. • ∗ , ∗∗ , ∗∗∗ .
(A) Log(Distance) (1) (2) (3) (4) (5) (6) All 2001-09 2010-19 All 2001-09 2010-19 Log (Distance to a landlocked trade point ( 100,000)) 1.164∗∗∗ 0.310 1.306∗∗∗ (0.274) (0.211) (0.283) Log (Distance to a landlocked trade route up to 1800) 0.874∗∗∗ 0.233∗ 0.980∗∗∗ (0.167) (0.139) (0.173) Log (Distance to a lake/river today) 0.139∗∗∗ 0.0206 0.130∗∗∗ 0.142∗∗∗ 0.0212 0.132∗∗∗ (0.0409) (0.0313) (0.0413) (0.0337) (0.0299) (0.0331) Observations 2616 2616 2616 2616 2616 2616 Mean (Dep. Var.) 4.816 5.698 4.932 4.816 5.698 4.932 SD (Dep. Var.) 1.101 0.743 1.157 1.101 0.743 1.157 (B) Onset (1) (2) (3) (4) (5) (6) All 2001-09 2010-19 All 2001-09 2010-19 Log (Distance to a landlocked trade point ( 100,000)) -0.325∗∗∗ -0.00422 -0.327∗∗∗ (0.0786) (0.0135) (0.0787) Log (Distance to a landlocked trade route up to 1800) -0.244∗∗∗ -0.00317 -0.246∗∗∗ (0.0550) (0.00996) (0.0548) Log (Distance to a lake/river today) -0.0405∗∗∗ 0.00344 -0.0439∗∗∗ -0.0411∗∗∗ 0.00343 -0.0446∗∗∗ (0.0121) (0.00316) (0.0120) (0.0109) (0.00317) (0.0108) Observations 2616 2616 2616 2616 2616 2616 Mean (Dep. Var.) 0.133 0.011 0.129 0.133 0.011 0.129 SD (Dep. Var.) 0.339 0.106 0.335 0.339 0.106 0.335 (C) Intensity (1) (2) (3) (4) (5) (6) All 2001-09 2010-19 All 2001-09 2010-19 Log (Distance to a landlocked trade point ( 100,000)) -1.233∗∗∗ -0.0236 -1.234∗∗∗ (0.357) (0.0218) (0.357) Log (Distance to a landlocked trade route up to 1800) -0.926∗∗∗ -0.0177 -0.926∗∗∗ (0.235) (0.0158) (0.235) Log (Distance to a lake/river today) -0.0913∗∗ 0.00352 -0.0952∗∗∗ -0.0937∗∗∗ 0.00348 -0.0976∗∗∗ (0.0370) (0.00336) (0.0369) (0.0315) (0.00342) (0.0314) Observations 2616 2616 2616 2616 2616 2616 Mean (Dep. Var.) 0.249 0.011 0.244 0.249 0.011 0.244 SD (Dep. Var.) 0.775 0.109 0.771 0.775 0.109 0.771 Country FE Yes Yes Yes Yes Yes Yes Geographic Controls Yes Yes Yes Yes Yes Yes • Notes: All regressions are estimated using IV with logarithm of one plus distance (km) to the nearest ancient lake as an instrument. The unit of observation is a grid cell (about 55km × 55km). The dependent variables are (A) logarithm of one plus distance (km) to the nearest jihad during a period given in each column, (B) dummy variables which take a value of 1 if jihad occurred during a period given in each column, otherwise take a value of 0, (C) logarithm of one plus the number of jihad events during a given period in each column. All Log(Distance) variables indicate the logarithm of one plus distance (km) to the nearest object. Landlocked is defined as the 1000km faraway from the nearest coast point. The interest variables are the logarithm of one plus distance (km) to the nearest pre-colonial landlocked trade point whose contemporary population is less than 100,000 in columns (1)-(3), and the logarithm of one plus distance (km) to the nearest pre-colonial landlocked trade route up to 1800 in columns (4)-(6). We control for landlocked dummy, average malaria suitability, average caloric suitability in post 1500, average elevation, ruggedness, and logarithm of one plus population in 2010 in all the specifications. We report standard errors adjusting for spatial auto-correlation with distance cutoff at 100km in parentheses. • ∗ , ∗∗ , ∗∗∗ .
All Jihad (1) (2) (3) (4) (5) (6) Log(Distance) Onset Duration Log(Distance) Onset Duration Log (Distance to an ancient lake) -0.0471∗∗ 0.00360∗ 0.00964∗ 0.0263 0.0000728 0.00371 (0.0216) (0.00186) (0.00579) (0.0224) (0.00151) (0.00541) Log (Distance to a lake/river today) 0.0737∗∗ -0.00805∗∗ -0.0174∗ 0.0533∗ -0.00489 -0.00562 (0.0288) (0.00367) (0.0102) (0.0299) (0.00316) (0.00754) Colonizer FE Yes Yes Yes Yes Yes Yes R2 0.418 0.056 0.011 0.214 0.009 0.003 Adj-R2 0.417 0.054 0.009 0.212 0.006 0.000 Observations 2616 2616 2616 2616 2616 2616 Mean (Dep. Var.) 5.397 0.024 0.058 5.612 0.013 0.036 SD (Dep. Var.) 0.896 0.152 0.552 0.802 0.112 0.450 • Notes: All regressions are estimated using OLS. The unit of observation is a grid cell (about 55km × 55km). The dependent variables are logarithm of one plus distance (km) to the nearest historical conflict (Log(Distance)), dummy variables which take a value of 1 if any historical conflict, otherwise take a value of 0 (Onset), and total duration years of historical conflicts in the unit of analysis (Duration). We control for landlocked dummy, average malaria suitability, average caloric suitability in post 1500, average elevation, and ruggedness in all the specifications. We report standard errors adjusting for spatial auto-correlation with distance cutoff at 100km in parentheses. • ∗ , ∗∗ , ∗∗∗ .
(A) Log(Distance) All Jihad (1) (2) (3) (4) Log (Distance to a landlocked trade point ( 100,000)) -0.443∗ 0.248 (0.227) (0.203) Log (Distance to a landlocked trade route up to 1800) -0.540 0.301 (0.394) (0.215) Observations 2616 2616 2616 2616 Mean (Dep. Var.) 5.397 5.397 5.612 5.612 SD (Dep. Var.) 0.896 0.896 0.802 0.802 (B) Onset All Jihad (1) (2) (3) (4) Log (Distance to a landlocked trade point ( 100,000)) 0.0339∗ 0.000685 (0.0189) (0.0142) Log (Distance to a landlocked trade route up to 1800) 0.0413 0.000834 (0.0275) (0.0174) Observations 2616 2616 2616 2616 Mean (Dep. Var.) 0.024 0.024 0.013 0.013 SD (Dep. Var.) 0.152 0.152 0.112 0.112 (C) Duration All Jihad (1) (2) (3) (4) Log (Distance to a landlocked trade point ( 100,000)) 0.0907 0.0349 (0.0582) (0.0523) Log (Distance to a landlocked trade route up to 1800) 0.110 0.0425 (0.0830) (0.0670) Observations 2616 2616 2616 2616 Mean (Dep. Var.) 0.058 0.058 0.036 0.036 SD (Dep. Var.) 0.552 0.552 0.450 0.450 Colonizer FE Yes Yes Yes Yes Geographic Controls Yes Yes Yes Yes • Notes: All regressions are estimated using IV with logarithm of one plus distance (km) to the nearest ancient lake as an instrument. The unit of observation is a grid cell (about 55km × 55km). The dependent variables are logarithm of one plus distance (km) to the nearest historical conflict (Log(Distance)), dummy variables which take a value of 1 if any historical conflict, otherwise take a value of 0 (Onset), and total duration years of historical conflicts in the unit of analysis (Duration). The interest variables are the logarithm of one plus distance (km) to the nearest pre-colonial landlocked trade point whose contemporary population is less than 100,000 in columns (1) and (3), and the logarithm of one plus distance (km) to the nearest pre-colonial landlocked trade route up to 1800 in columns (2) and (4). We control for the logarithm of distance (km) to the nearest water sources today, landlocked dummy, average malaria suitability, average caloric suitability in post 1500, average elevation, and ruggedness in all the specifications. We report standard errors adjusting for spatial auto-correlation with distance cutoff at 100km in parentheses. • ∗ , ∗∗ , ∗∗∗ .
Distance Log (Distance) (1) (2) (3) (4) Log (Distance to a landlocked trade point ( 100,000)) 0.412∗∗∗ 0.154∗∗∗ (0.148) (0.0467) Log (Distance to a landlocked trade route up to 1800) 0.309∗∗∗ 0.115∗∗∗ (0.108) (0.0296) Log (Distance to a lake/river today) -0.0308 -0.0268 0.0215∗∗∗ 0.0230∗∗∗ (0.0527) (0.0526) (0.00758) (0.00723) Country FE Yes Yes Yes Yes Observations 2616 2616 2616 2616 Mean (Dep. Var.) 0.818 0.818 0.884 0.884 SD (Dep. Var.) 1.154 1.154 0.202 0.202 • Notes: All regressions are estimated using IV with logarithm of one plus distance (km) to the nearest ancient lake as an instrument. The unit of observation is a grid cell (about 55km × 55km). The dependent variable is distance (km) to the nearest contemporary jihad (2010-2019) divided by distance (km) to the nearest historical jihad. Likewise, we calculate the relative distance by taking log for each distance. The interest variables are the logarithm of one plus distance (km) to the nearest pre-colonial landlocked trade point whose contemporary population is less than 100,000 in columns (1) and (3), and the logarithm of one plus distance (km) to the nearest pre-colonial landlocked trade route up to 1800 in columns (2) and (4). We control for landlocked dummy, average malaria suitability, average caloric suitability in post 1500, average elevation, and ruggedness in all the specifications. We report standard errors adjusting for spatial auto-correlation with distance cutoff at 100km in parentheses. • ∗ , ∗∗ , ∗∗∗ .
(1) (2) (3) (4) (5) (6) (7) (8) (9) Onset of Africa vs European (1850-) 2.456∗∗∗ -0.0543 (0.745) (0.100) Intensity of Africa vs European (1850-) 2.775∗∗∗ -0.0899 (0.918) (0.111) Duration of Africa vs European (1850-) 0.447∗∗∗ -0.0297 (0.157) (0.0256) Onset of jihad vs European (1850-) 4.417∗∗∗ 4.471∗∗∗ (1.123) (1.123) Intensity of jihad vs European (1850-) 5.399∗∗∗ 5.487∗∗∗ (1.444) (1.441) Duration of jihad vs European (1850-) 0.687∗∗∗ 0.716∗∗∗ (0.213) (0.216) Country FE Yes Yes Yes Yes Yes Yes Yes Yes Yes R2 0.327 0.320 0.275 0.408 0.410 0.301 0.408 0.410 0.301 Adj-R2 0.325 0.318 0.273 0.407 0.408 0.299 0.406 0.408 0.298 Observations 2616 2616 2616 2616 2616 2616 2616 2616 2616 Mean (Dep. Var.) 0.818 0.818 0.818 0.818 0.818 0.818 0.818 0.818 0.818 SD (Dep. Var.) 1.154 1.154 1.154 1.154 1.154 1.154 1.154 1.154 1.154 • Notes: All regressions are estimated using OLS. The unit of observation is a grid cell (about 55km × 55km). The dependent variable is distance (km) to the nearest contemporary jihad (2010-2019) divided by distance (km) to the nearest historical jihad. The definitions of variables as follows: the dummy variable which takes a value of 1 if African entities confronted against Europeans after 1850 in column (1), the logarithm of one plus number of conflicts where African entities confronted against Europeans after 1850 in column (2), the total duration (years) of conflict event where African entities confronted against Europeans after 1850 in column (3), the dummy variable which takes a value of 1 if African entities confronted against Europeans after 1850 in Islamic areas in column (4), the logarithm of one plus number of conflicts where African entities confronted against Europeans after 1850 in Islamic areas in column (5), and the total duration (years) of conflict event where African entities confronted against Europeans after 1850 in Islamic areas in column (6). We control for the logarithm of distance (km) to the nearest water sources today, landlocked dummy, average malaria suitability, average caloric suitability in post 1500, average elevation, ruggedness, and logarithm of one plus population in 2010 in all the specifications. We report standard errors adjusting for spatial auto-correlation with distance cutoff at 100km in parentheses. • ∗ , ∗∗ , ∗∗∗ .
(A) Neighbors from different religion: 1 (strongly like) to 5 (strongly dislike) (1) (2) Log (Distance to a landlocked trade point ( 100,000)) -0.477∗∗∗ (0.117) Log (Distance to a landlocked trade route in 1800) -0.398∗∗∗ (0.0872) Observations 17427 17427 Mean (Dep. Var.) 2.322 2.322 SD (Dep. Var.) 1.416 1.416 F-stat 32.616 34.927 Round FE Yes Yes (B) Governed by religious law: 1 (strongly disagree) to 5 (stronlgy agree) (1) (2) Log (Distance to a landlocked trade point ( 100,000)) -0.445∗∗∗ (0.116) Log (Distance to a landlocked trade route in 1800) -0.342∗∗∗ (0.0975) Observations 9166 9166 Mean (Dep. Var.) 2.611 2.611 SD (Dep. Var.) 1.702 1.702 F-stat 49.731 50.773 Round FE No No (C) Equal opportunities to education: 1 (strongly agree) to 5 (stronlgy disagree) (1) (2) Log (Distance to a landlocked trade point ( 100,000)) -0.321∗∗∗ (0.0741) Log (Distance to a landlocked trade route in 1800) -0.245∗∗∗ (0.0464) Observations 9252 9252 Mean (Dep. Var.) 1.637 1.637 SD (Dep. Var.) 0.960 0.960 F-stat 52.063 52.193 Round FE No No Country FE Yes Yes Geographic Controls Yes Yes Individual Controls Yes Yes • Notes: All regressions are estimated using IV with logarithm of one plus distance (km) to the nearest ancient lake as an instrument. The unit of observation is a respondent who is Muslim in countries of West Africa surveyed in Afrobarometer. In panel (A), the dependent variable is the ordered variable which indicates how much a respondent would dislike having people of a different religion as neighbors. This variable is available in round 6 (surveyed between 2014 and 2015) and 7 (surveyed between 2016 and 2018). In panel (B), the dependent variable is the ordered variable which indicates how much a respondent agrees with governance by religious law rather than civil law. This variable is available in round 7. In panel (C), the dependent variable is the ordered variable which indicates how much a respondent disagrees with girls and boys having equal opportunities to get an education. This variable is available in round 7. The interest variables are the logarithm of one plus distance (km) to the nearest pre-colonial landlocked trade point whose contemporary population is less than 100,000 in columns (1), and the logarithm of one plus distance (km) to the nearest pre-colonial landlocked trade route up to 1800 in columns (2). Landlocked is defined as the 1000km faraway from the nearest coast point. Geographic controls include the logarithm of distance (km) to the nearest water sources today, landlocked dummy, average malaria suitability, average caloric suitability in post 1500, and average elevation. Individual controls include age, age squared, female dummy, nine categorical indicators of education, and four categorical indicators of living condition. If a dependent variable is available from multiple rounds of Afrobarometer, we additionally control for round fixed effects. Standard errors clustered at the country levels in parentheses. • ∗ , ∗∗ , ∗∗∗ .
— Appendix —
The Golden City on the Edge:
Economic Geography and Jihad over Centuries
Masahiro Kubo & Shunsuke Tsuda
[sections] \printcontents[sections]l1
Appendix A Additional Figures and Tables
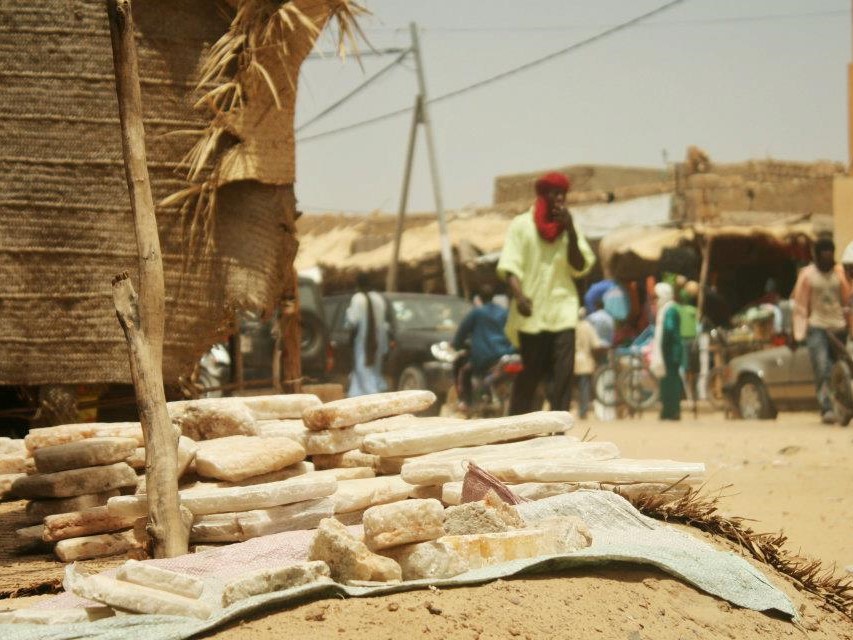
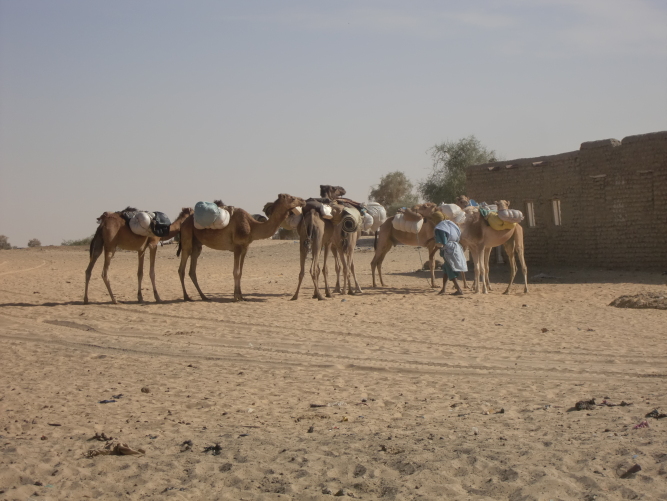


Notes: Salt (top-left), which has been used for various purposes (bottom-left), is still transported by caravan (top-right) even today. The bottom-right picture shows the Djinguereber mosque, which was broken by a jihadist group Ansar Dine in 2012. The top-left picture was taken by Daiki Kobayashi and the other three ones were taken by Shunsuke Tsuda in 2010, before the surge of Islamist insurgencies in Mali.
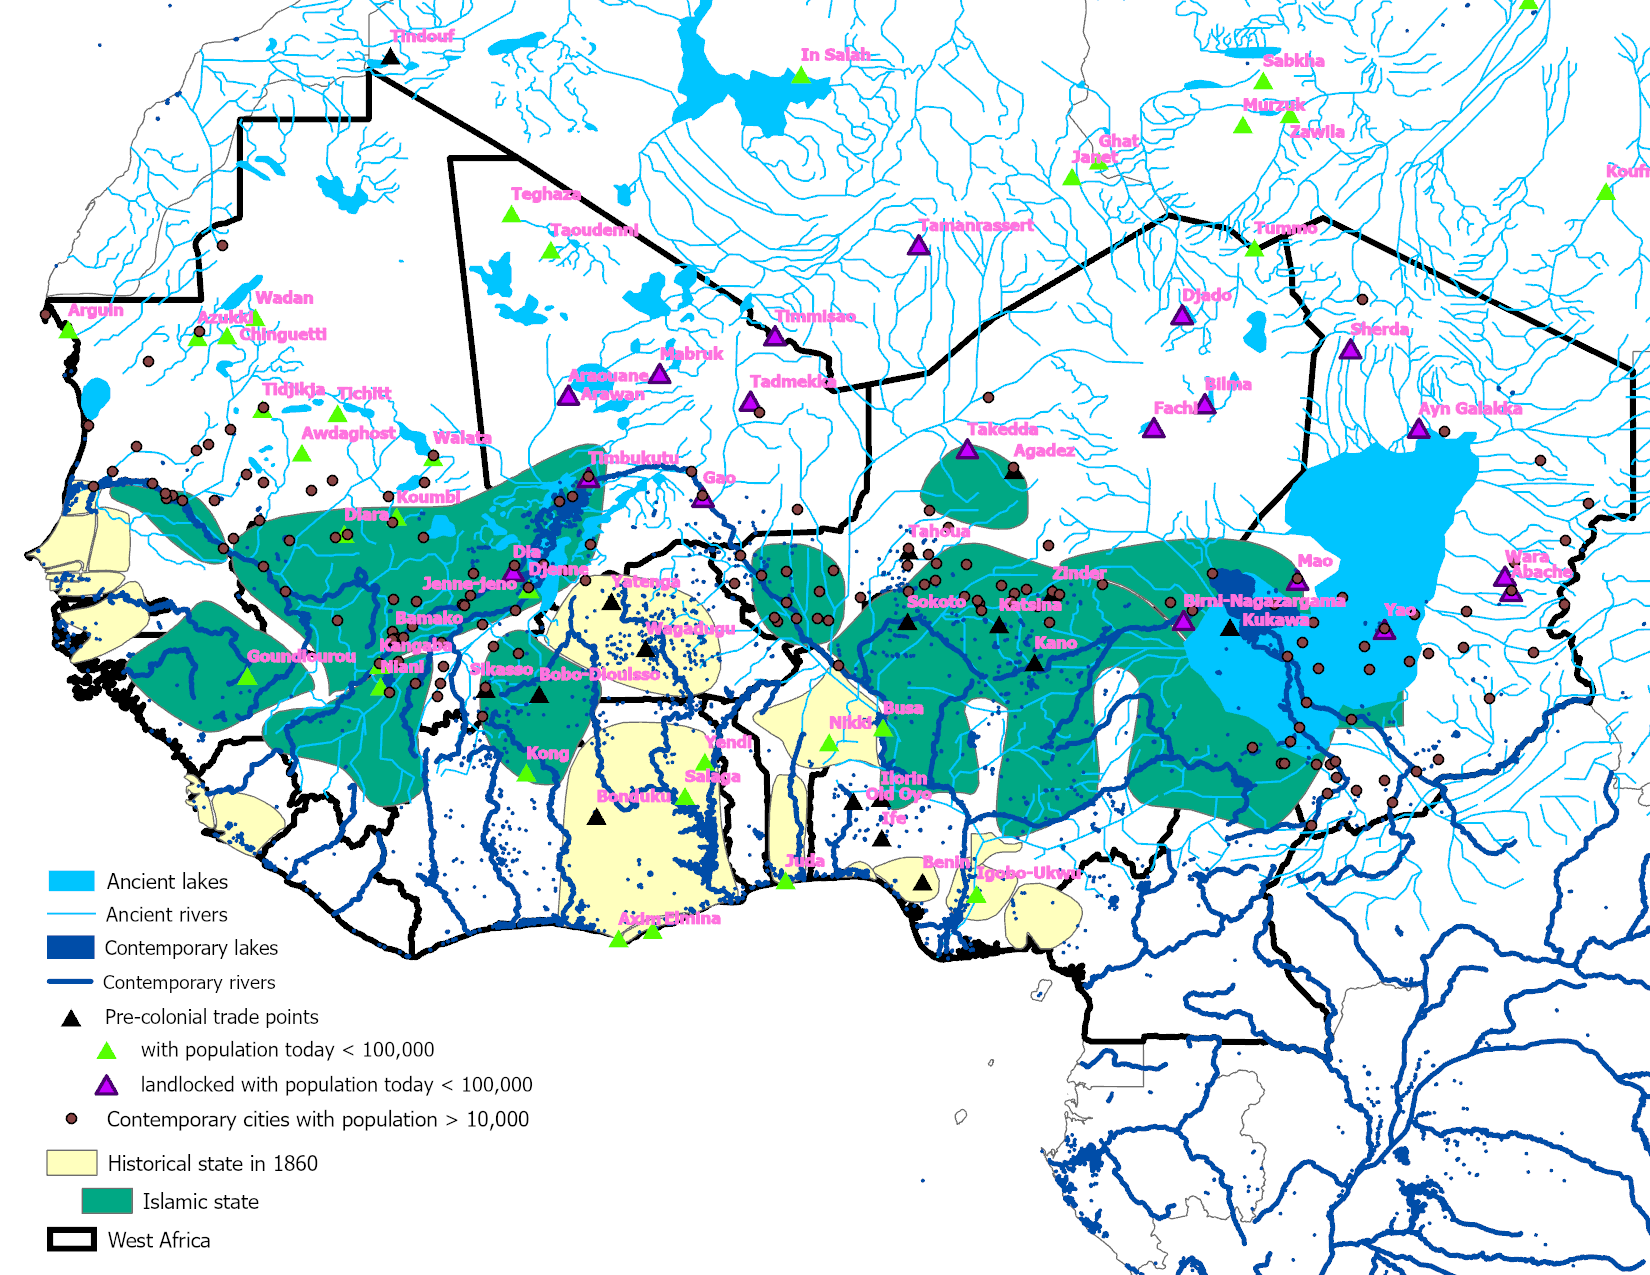
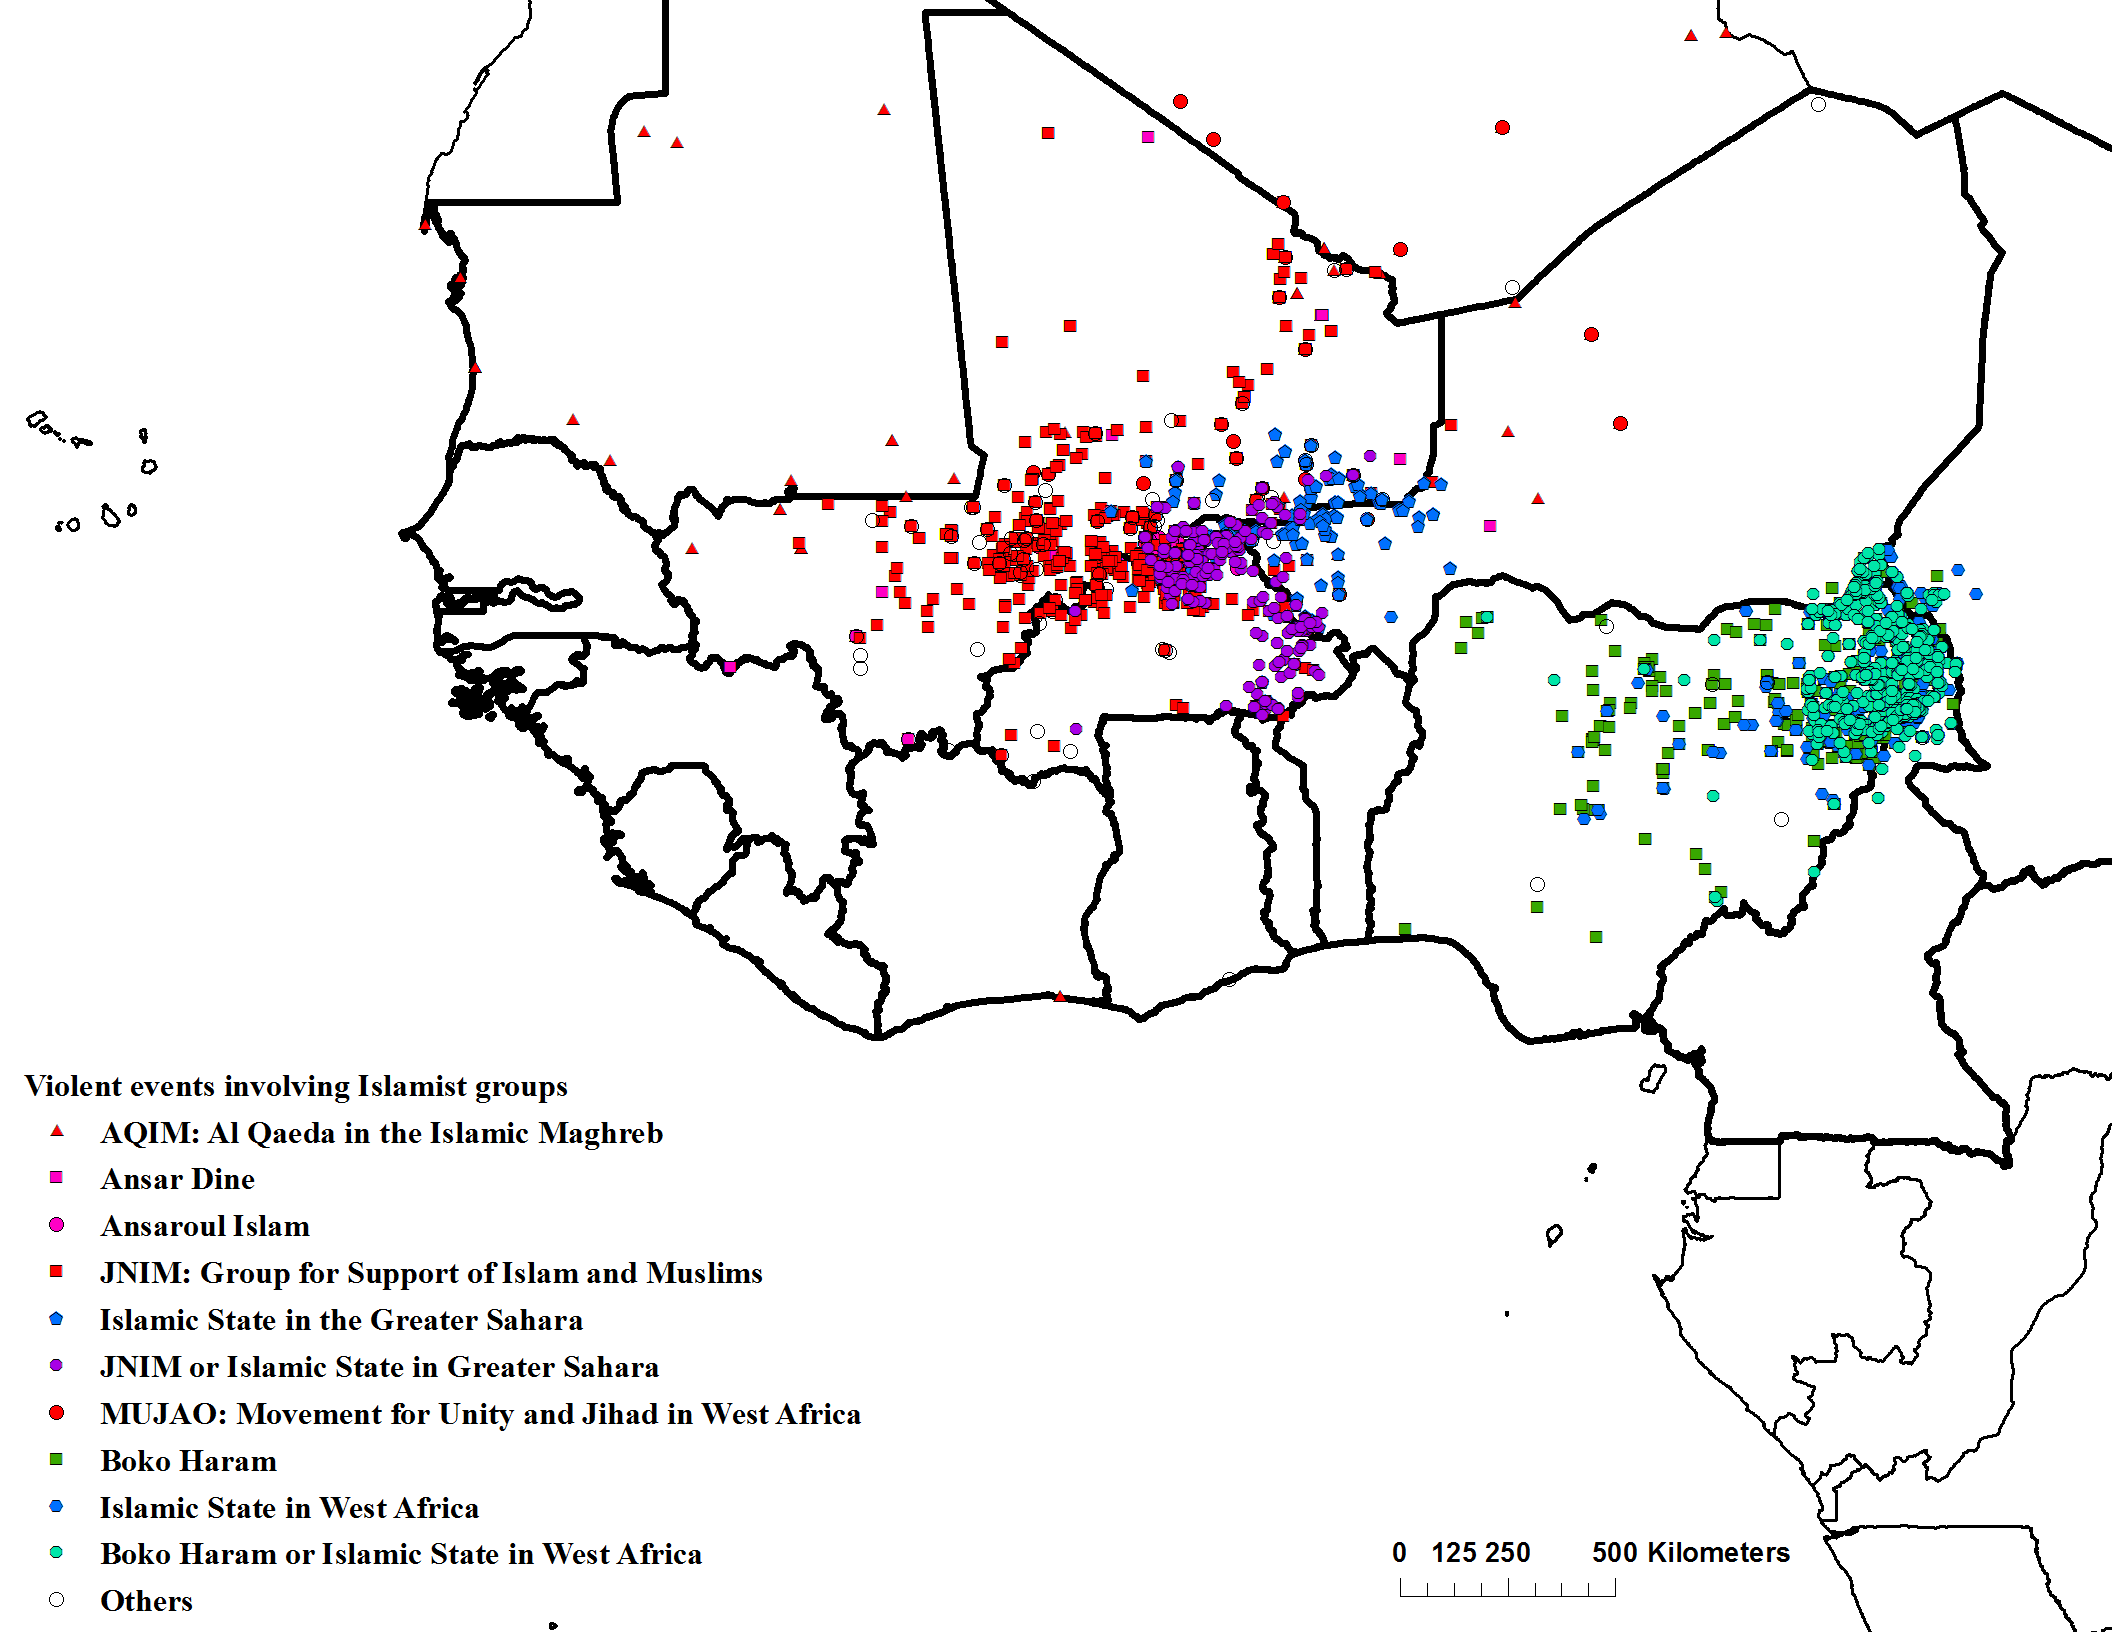
(A) Log(Distance to a city ( 50,000)) (1) (2) (3) (4) (5) Log (Distance to a pre-colonial trade point) 0.0743∗ (0.0421) Log (Distance to a coast) 0.136∗∗∗ (0.0351) Log (Distance to a colonial railway) 0.131∗∗∗ (0.0415) Log (Distance to a mission) 0.241∗∗∗ (0.0329) Log (Atlantic slave exports in 1800s) -0.0115 (0.00723) R2 0.731 0.734 0.735 0.743 0.705 Adj-R2 0.731 0.734 0.734 0.743 0.704 Observations 2616 2616 2616 2616 2489 Mean (Dep. Var.) 4.497 4.497 4.497 4.497 4.497 SD (Dep. Var.) 1.167 1.167 1.167 1.167 1.167 (B) Night light luminosity in 2015 (1) (2) (3) (4) (5) Log (Distance to a pre-colonial trade point) -0.300∗∗∗ (0.112) Log (Distance to a coast) -0.963∗∗∗ (0.131) Log (Distance to a colonial railway) -0.591∗∗∗ (0.112) Log (Distance to a mission) -0.955∗∗∗ (0.124) Log (Atlantic slave exports in 1800s) 0.0617∗∗∗ (0.0226) R2 0.530 0.570 0.544 0.567 0.518 Adj-R2 0.529 0.569 0.542 0.566 0.517 Observations 2616 2616 2616 2616 2489 Mean (Dep. Var.) 1.875 1.875 1.875 1.875 1.875 SD (Dep. Var.) 2.636 2.636 2.636 2.636 2.636 Country FE Yes Yes Yes Yes Yes Geographic Controls Yes Yes Yes Yes Yes • Notes: All regressions are estimated using OLS. The unit of observation is a grid cell (about 55km × 55km). All Log(Distance) variables indicate the logarithm of one plus distance (km) to the nearest object. The dependent variables are (A) the logarithm of one plus distance (km) to the nearest city whose contemporary population over 50,000, (B) the logarithm of one plus total night light luminosity (VIISR) in 2015. The interest variables are (1) the logarithm of one plus distance (km) to the nearest pre-colonial trade point, (2) the logarithm of one plus distance (km) to the nearest coast point, (3) the logarithm of one plus distance (km) to the nearest colonial railway line, (4) the logarithm of one plus distance (km) to the nearest Christian mission station in late 19th century, (5) the logarithm of one plus the number of Atlantic slave trade exports in 1800s. We control for landlocked dummy, average malaria suitability, average caloric suitability in post 1500, average elevation, and ruggedness in all the specifications. We report standard errors adjusting for spatial auto-correlation with distance cutoff at 100km in parentheses. • ∗ , ∗∗ , ∗∗∗ .
(A) Log(Distance) (1) (2) (3) (4) (5) (6) (7) (8) (9) All 2001-09 2010-19 All 2001-09 2010-19 All 2001-09 2010-19 Log (Distance to a city ( 50,000)) 0.182∗∗∗ 0.0716∗ 0.215∗∗∗ (0.0533) (0.0410) (0.0518) Log (Distance to a city ( 10,000)) 0.263∗∗∗ 0.289∗∗∗ 0.174∗∗ (0.0668) (0.0687) (0.0677) Log (Distance to a city (10,000 - 50,000)) 0.152∗∗ 0.262∗∗∗ 0.121∗ (0.0646) (0.0692) (0.0624) R2 0.521 0.356 0.570 0.576 0.310 0.638 0.560 0.298 0.633 Adj-R2 0.520 0.354 0.569 0.574 0.307 0.636 0.558 0.295 0.631 Observations 2616 2616 2616 1616 1616 1616 1616 1616 1616 Mean (Dep. Var.) 4.816 5.698 4.932 4.816 5.698 4.932 4.816 5.698 4.932 SD (Dep. Var.) 1.101 0.743 1.157 1.101 0.743 1.157 1.101 0.743 1.157 (B) Onset (1) (2) (3) (4) (5) (6) (7) (8) (9) All 2001-09 2010-19 All 2001-09 2010-19 All 2001-09 2010-19 Log (Distance to a city ( 50,000)) -0.0357∗∗∗ -0.00813∗ -0.0343∗∗ (0.0137) (0.00417) (0.0136) Log (Distance to a city ( 10,000)) -0.0355∗∗ -0.0277∗∗∗ -0.0234 (0.0180) (0.00877) (0.0174) Log (Distance to a city (10,000 - 50,000)) -0.0120 -0.0197∗∗∗ -0.00647 (0.0187) (0.00764) (0.0187) R2 0.293 0.013 0.305 0.321 0.030 0.338 0.317 0.019 0.336 Adj-R2 0.291 0.011 0.303 0.318 0.025 0.335 0.314 0.015 0.333 Observations 2616 2616 2616 1616 1616 1616 1616 1616 1616 Mean (Dep. Var.) 0.133 0.011 0.129 0.133 0.011 0.129 0.133 0.011 0.129 SD (Dep. Var.) 0.339 0.106 0.335 0.339 0.106 0.335 0.339 0.106 0.335 (C) Intensity (1) (2) (3) (4) (5) (6) (7) (8) (9) All 2001-09 2010-19 All 2001-09 2010-19 All 2001-09 2010-19 Log (Distance to a city ( 50,000)) -0.0956∗∗ -0.0102∗ -0.0912∗∗ (0.0402) (0.00531) (0.0401) Log (Distance to a city ( 10,000)) -0.0465 -0.0253∗∗∗ -0.0314 (0.0361) (0.00772) (0.0357) Log (Distance to a city (10,000 - 50,000)) -0.0170 -0.0188∗∗∗ -0.00736 (0.0374) (0.00681) (0.0371) R2 0.250 0.014 0.253 0.302 0.027 0.309 0.300 0.018 0.308 Adj-R2 0.248 0.011 0.251 0.299 0.023 0.306 0.297 0.013 0.305 Observations 2616 2616 2616 1616 1616 1616 1616 1616 1616 Mean (Dep. Var.) 0.249 0.011 0.244 0.249 0.011 0.244 0.249 0.011 0.244 SD (Dep. Var.) 0.775 0.109 0.771 0.775 0.109 0.771 0.775 0.109 0.771 Country FE Yes Yes Yes Yes Yes Yes Yes Yes Yes Geographic Controls Yes Yes Yes Yes Yes Yes Yes Yes Yes • Notes: All regressions are estimated using OLS. The unit of observation is a grid cell (about 55km × 55km). All Log(Distance) variables indicate the logarithm of one plus distance (km) to the nearest object. The dependent variables are (A) logarithm of one plus distance (km) to the nearest jihad during a period given in each column, (B) dummy variables which take a value of 1 if jihad occurred during a period given in each column, otherwise take a value of 0, (C) logarithm of one plus the number of jihad events during a given period in each column. In column (4)-(9), the observations restrict grid cells in Mauritania, Mali, Niger and Chad. The interest variables are the logarithm of one plus distance (km) to the nearest city whose contemporary population over 50,000 in column (1)-(3), the logarithm of one plus distance (km) to the nearest city whose contemporary population over 10,000 in column (4)-(6), and the logarithm of one plus distance (km) to the nearest city whose contemporary population over 10,000 and less than 50,000 in column (7)-(9). We control for the logarithm of distance (km) to the nearest water sources today, landlocked dummy, average malaria suitability, average caloric suitability in post 1500, average elevation, and ruggedness in all the specifications. We report standard errors adjusting for spatial auto-correlation with distance cutoff at 100km in parentheses. • ∗ , ∗∗ , ∗∗∗ .
(A) Log (Distance to a landlocked trade point ( 100,000)) (1) (2) (3) (4) (5) (6) (7) (8) (9) Log (Distance to an ancient lake) 0.108∗∗∗ 0.108∗∗∗ 0.128∗∗∗ (0.0161) (0.0162) (0.0177) Log (Distance to an ancient river) 0.0519∗∗∗ 0.0484∗∗∗ 0.0173 (0.0160) (0.0161) (0.0173) Log (Distance to an ancient lake/river) 0.0830∗∗∗ 0.0808∗∗∗ 0.0741∗∗∗ (0.0134) (0.0134) (0.0151) Log (Distance to a lake/river today) -0.0162 -0.0140 0.00787 -0.0131 -0.0120 -0.000681 -0.0148 -0.0136 -0.00516 (0.0222) (0.0222) (0.0190) (0.0222) (0.0220) (0.0209) (0.0220) (0.0218) (0.0199) F-stat 44.52 44.08 50.81 10.38 8.97 0.98 37.94 35.90 23.59 Observations 2616 2616 2616 2616 2616 2616 2616 2616 2616 (B) Log (Distance to a landlocked trade route up to 1800) (1) (2) (3) (4) (5) (6) (7) (8) (9) Log (Distance to an ancient lake) 0.0898∗∗ 0.0879∗∗ 0.170∗∗∗ (0.0352) (0.0354) (0.0286) Log (Distance to an ancient river) 0.0805∗∗∗ 0.0752∗∗∗ -0.00196 (0.0239) (0.0241) (0.0241) Log (Distance to an ancient lake/river) 0.0858∗∗∗ 0.0814∗∗∗ 0.111∗∗∗ (0.0264) (0.0264) (0.0254) Log (Distance to a lake/river today) -0.0304 -0.0291 0.00791 -0.0305 -0.0301 0.000343 -0.0304 -0.0298 -0.0106 (0.0412) (0.0414) (0.0294) (0.0424) (0.0426) (0.0362) (0.0420) (0.0422) (0.0344) F-stat 6.41 6.08 34.84 11.18 9.54 0.01 10.42 9.32 18.73 Observations 2616 2616 2616 2616 2616 2616 2616 2616 2616 Colonizer FE No Yes No No Yes No No Yes No Country FE No No Yes No No Yes No No Yes Geographic Controls Yes Yes Yes Yes Yes Yes Yes Yes Yes • Notes: All regressions are estimated using OLS. The unit of observation is a grid cell (about 55km × 55km). All Log(Distance) variables indicate the logarithm of one plus distance (km) to the nearest object. The dependent variables are (A) the logarithm of one plus distance (km) to the nearest pre-colonial landlocked trade point whose contemporary population is less than 100,000, (B) the logarithm of one plus distance (km) to the nearest pre-colonial landlocked trade route up to 1800. Landlocked is defined as the 1000km faraway from the nearest coast point. We control for landlocked dummy, average malaria suitability, average caloric suitability in post 1500, average elevation, ruggedness, and logarithm of one plus population in 2010 in all the specifications. We report standard errors adjusting for spatial auto-correlation with distance cutoff at 100km in parentheses. • ∗ , ∗∗ , ∗∗∗ .
(A) Log (Distance to a landlocked trade point ( 100,000)) (1) (2) (3) (4) (5) (6) (7) (8) (9) Log (Distance to an ancient lake) -0.0246 -0.0236 0.0227 (0.0182) (0.0169) (0.0172) Log (Distance to an ancient river) 0.0250 0.0136 -0.0417∗∗ (0.0231) (0.0224) (0.0165) Log (Distance to an ancient lake/river) 0.0183 0.0102 0.0196 (0.0196) (0.0186) (0.0168) Log (Distance to a lake/river today) -0.0264 -0.0169 0.0158 -0.0297 -0.0191 0.0212 -0.0291 -0.0187 0.0129 (0.0307) (0.0297) (0.0256) (0.0310) (0.0298) (0.0259) (0.0303) (0.0292) (0.0254) F-stat 1.81 1.92 1.72 1.16 0.37 6.33 0.86 0.30 1.33 Observations 2616 2616 2616 2616 2616 2616 2616 2616 2616 (B) Log (Distance to a coastal trade point ( 100,000)) (1) (2) (3) (4) (5) (6) (7) (8) (9) Log (Distance to an ancient lake) -0.0387 -0.0424∗ -0.00604 (0.0241) (0.0241) (0.0223) Log (Distance to an ancient river) 0.0485∗ 0.0388 0.0359∗ (0.0257) (0.0255) (0.0190) Log (Distance to an ancient lake/river) -0.0260 -0.0354 0.00449 (0.0236) (0.0231) (0.0174) Log (Distance to a lake/river today) -0.0500 -0.0473 -0.0457∗ -0.0559∗ -0.0522∗ -0.0510∗∗ -0.0507 -0.0472 -0.0459∗ (0.0312) (0.0307) (0.0244) (0.0314) (0.0310) (0.0248) (0.0316) (0.0310) (0.0245) F-stat 2.55 3.06 0.07 3.50 2.28 3.51 1.19 2.31 0.07 Observations 2616 2616 2616 2616 2616 2616 2616 2616 2616 (C) Log (Distance to a coastal trade route up to 1800) (1) (2) (3) (4) (5) (6) (7) (8) (9) Log (Distance to an ancient lake) 0.0559∗∗ 0.0528∗∗ 0.0685∗∗∗ (0.0236) (0.0231) (0.0237) Log (Distance to an ancient river) 0.101∗∗∗ 0.0858∗∗∗ 0.0128 (0.0285) (0.0274) (0.0228) Log (Distance to an ancient lake/river) 0.0917∗∗∗ 0.0793∗∗∗ 0.0648∗∗∗ (0.0254) (0.0245) (0.0237) Log (Distance to a lake/river today) 0.0150 0.0221 0.0392 0.0113 0.0186 0.0341 0.0125 0.0198 0.0298 (0.0310) (0.0305) (0.0279) (0.0315) (0.0310) (0.0298) (0.0308) (0.0304) (0.0287) F-stat 5.51 5.13 8.18 12.45 9.63 0.31 12.82 10.28 7.35 Observations 2616 2616 2616 2616 2616 2616 2616 2616 2616 Colonizer FE No Yes No No Yes No No Yes No Country FE No No Yes No No Yes No No Yes Geographic Controls Yes Yes Yes Yes Yes Yes Yes Yes Yes • Notes: All regressions are estimated using OLS. The unit of observation is a grid cell (about 55km × 55km). All Log(Distance) variables indicate the logarithm of one plus distance (km) to the nearest object. The dependent variables are (A) the logarithm of one plus distance (km) to the nearest pre-colonial landlocked trade point whose contemporary population is more than 100,000, (B) the logarithm of one plus distance (km) to the nearest pre-colonial coastal (non-landlocked) trade point whose contemporary population is less than 100,000, (C) the logarithm of one plus distance (km) to the nearest pre-colonial coastal (non-landlocked) trade route up to 1800. Landlocked is defined as the 1000km faraway from the nearest coast point. We control for landlocked dummy, average malaria suitability, average caloric suitability in post 1500, average elevation, ruggedness, and logarithm of one plus population in 2010 in all the specifications. We report standard errors adjusting for spatial auto-correlation with distance cutoff at 100km in parentheses. • ∗ , ∗∗ , ∗∗∗ .
(A) DMSP (1) (2) (3) (4) (5) (6) 2005 2010 2013 2005 2010 2013 Log (Distance to a landlocked trade point ( 100,000)) 0.593∗ 0.559∗ 0.704∗∗ (0.317) (0.334) (0.348) Log (Distance to a landlocked trade route up to 1800) 0.445∗ 0.419∗ 0.528∗∗ (0.246) (0.248) (0.259) Log (Distance to a lake/river today) -0.503∗∗∗ -0.561∗∗∗ -0.556∗∗∗ -0.497∗∗∗ -0.556∗∗∗ -0.550∗∗∗ (0.0669) (0.0696) (0.0655) (0.0666) (0.0695) (0.0662) Observations 2616 2616 2616 2616 2616 2616 Mean (Dep. Var.) 1.763 2.332 2.300 1.763 2.332 2.300 SD (Dep. Var.) 2.749 3.192 3.140 2.749 3.192 3.140 (B) VIIRS (1) (2) (3) (4) (5) (6) 2013 2015 2019 2013 2015 2019 Log (Distance to a landlocked trade point ( 100,000)) 0.975∗∗∗ 1.102∗∗∗ 0.857∗∗ (0.350) (0.377) (0.343) Log (Distance to a landlocked trade route up to 1800) 0.731∗∗∗ 0.826∗∗∗ 0.643∗∗∗ (0.252) (0.265) (0.246) Log (Distance to a lake/river today) -0.402∗∗∗ -0.473∗∗∗ -0.515∗∗∗ -0.393∗∗∗ -0.463∗∗∗ -0.506∗∗∗ (0.0605) (0.0664) (0.0670) (0.0598) (0.0632) (0.0642) Observations 2616 2616 2616 2616 2616 2616 Mean (Dep. Var.) 1.751 1.875 2.057 1.751 1.875 2.057 SD (Dep. Var.) 2.565 2.636 2.783 2.565 2.636 2.783 Country FE Yes Yes Yes Yes Yes Yes Geographic Controls Yes Yes Yes Yes Yes Yes • Notes: All regressions are estimated using IV with logarithm of one plus distance (km) to the nearest ancient lake as an instrument. The unit of observation is a grid cell (about 55km × 55km). The dependent variables are (A) logarithm of one plus total luminosity from DMSP in 2005, 2010 and 2013, (B) logarithm of one plus total luminosity from VIIRS in 2013, 2015 and 2019. All Log(Distance) variables indicate the logarithm of one plus distance (km) to the nearest object. Landlocked is defined as the 1000km faraway from the nearest coast point. The interest variable are the logarithm of one plus distance (km) to the nearest pre-colonial landlocked trade point whose contemporary population is less than 100,000 in columns (1)-(3), and the logarithm of one plus distance (km) to the nearest pre-colonial landlocked trade route up to 1800 in columns (4)-(6). We control for landlocked dummy, average malaria suitability, average caloric suitability in post 1500, average elevation, and ruggedness in all the specifications. We report standard errors adjusting for spatial auto-correlation with distance cutoff at 100km in parentheses. • ∗ , ∗∗ , ∗∗∗ .
(A) Log (Distance to a landlocked trade point ( 100,000)) (1) (2) (3) (4) (5) (6) (7) (8) (9) Log (Distance to an ancient lake) 0.0664∗∗∗ 0.0664∗∗∗ 0.0876∗∗∗ (0.0177) (0.0177) (0.0211) Log (Distance to an ancient river) -0.0271 -0.0271 -0.0371∗ (0.0211) (0.0211) (0.0217) Log (Distance to an ancient lake/river) 0.0182 0.0182 0.0178 (0.0181) (0.0181) (0.0192) Log (Distance to a lake/river today) -0.0364 -0.0364 -0.0110 -0.0365 -0.0365 -0.0197 -0.0430 -0.0430 -0.0282 (0.0393) (0.0393) (0.0351) (0.0405) (0.0405) (0.0370) (0.0400) (0.0400) (0.0363) F-stat 13.70 13.70 16.82 1.62 1.62 2.87 1.00 1.00 0.84 Observations 1616 1616 1616 1616 1616 1616 1616 1616 1616 (B) Log (Distance to a landlocked trade route up to 1800) (1) (2) (3) (4) (5) (6) (7) (8) (9) Log (Distance to an ancient lake) -0.0164 -0.0164 0.119∗∗∗ (0.0371) (0.0371) (0.0303) Log (Distance to an ancient river) 0.00164 0.00164 -0.0636∗∗ (0.0368) (0.0368) (0.0312) Log (Distance to an ancient lake/river) -0.0572 -0.0572 0.0466 (0.0364) (0.0364) (0.0291) Log (Distance to a lake/river today) -0.0982 -0.0982 -0.0164 -0.0972 -0.0972 -0.0256 -0.0929 -0.0929 -0.0408 (0.0874) (0.0874) (0.0607) (0.0870) (0.0870) (0.0674) (0.0877) (0.0877) (0.0681) F-stat 0.19 0.19 15.24 0.00 0.00 4.08 2.42 2.42 2.52 Observations 1616 1616 1616 1616 1616 1616 1616 1616 1616 Colonizer FE No Yes No No Yes No No Yes No Country FE No No Yes No No Yes No No Yes Geographic Controls Yes Yes Yes Yes Yes Yes Yes Yes Yes • Notes: All regressions are estimated using OLS. The unit of observation is a grid cell (about 55km × 55km). The observations restrict grid cells in Mauritania, Mali, Niger and Chad. All Log(Distance) variables indicate the logarithm of one plus distance (km) to the nearest object. The dependent variables are (A) the logarithm of one plus distance (km) to the nearest pre-colonial landlocked trade point whose contemporary population is less than 100,000, (B) the logarithm of one plus distance (km) to the nearest pre-colonial landlocked trade route up to 1800. Landlocked is defined as the 1000km faraway from the nearest coast point. We control for landlocked dummy, average malaria suitability, average caloric suitability in post 1500, average elevation, ruggedness, and logarithm of one plus population in 2010 in all the specifications. We report standard errors adjusting for spatial auto-correlation with distance cutoff at 100km in parentheses. • ∗ , ∗∗ , ∗∗∗ .
(A) Log(Distance) (1) (2) (3) (4) (5) (6) 2010-19 2010-15 2016-19 2010-19 2010-15 2016-19 Log (Distance to a landlocked trade point ( 100,000)) 0.575∗ 0.978∗∗ 0.600∗ (0.337) (0.388) (0.326) Log (Distance to a landlocked trade route up to 1800) 0.421∗∗ 0.717∗∗∗ 0.440∗∗ (0.202) (0.210) (0.194) Log (Distance to a lake/river today) 0.217∗∗∗ 0.128∗ 0.277∗∗∗ 0.217∗∗∗ 0.129∗∗∗ 0.278∗∗∗ (0.0632) (0.0722) (0.0573) (0.0497) (0.0488) (0.0441) Observations 1616 1616 1616 1616 1616 1616 Mean (Dep. Var.) 5.038 5.270 5.333 5.038 5.270 5.333 SD (Dep. Var.) 1.114 0.961 1.157 1.114 0.961 1.157 (B) Onset (1) (2) (3) (4) (5) (6) 2010-19 2010-15 2016-19 2010-19 2010-15 2016-19 Log (Distance to a landlocked trade point ( 100,000)) -0.139∗ -0.188∗∗ -0.137 (0.0841) (0.0790) (0.0842) Log (Distance to a landlocked trade route up to 1800) -0.102∗ -0.138∗∗ -0.101 (0.0610) (0.0568) (0.0619) Log (Distance to a lake/river today) -0.0791∗∗∗ -0.0643∗∗∗ -0.0895∗∗∗ -0.0792∗∗∗ -0.0645∗∗∗ -0.0896∗∗∗ (0.0176) (0.0194) (0.0171) (0.0155) (0.0158) (0.0150) Observations 1616 1616 1616 1616 1616 1616 Mean (Dep. Var.) 0.110 0.051 0.095 0.110 0.051 0.095 SD (Dep. Var.) 0.312 0.220 0.293 0.312 0.220 0.293 (C) Intensity (1) (2) (3) (4) (5) (6) 2010-19 2010-15 2016-19 2010-19 2010-15 2016-19 Log (Distance to a landlocked trade point ( 100,000)) -0.458∗∗ -0.301∗∗ -0.392∗ (0.224) (0.131) (0.206) Log (Distance to a landlocked trade route up to 1800) -0.336∗∗ -0.221∗∗ -0.287∗ (0.164) (0.0934) (0.153) Log (Distance to a lake/river today) -0.200∗∗∗ -0.0888∗∗∗ -0.184∗∗∗ -0.201∗∗∗ -0.0891∗∗∗ -0.185∗∗∗ (0.0482) (0.0284) (0.0436) (0.0403) (0.0233) (0.0373) Observations 1616 1616 1616 1616 1616 1616 Mean (Dep. Var.) 0.186 0.070 0.154 0.186 0.070 0.154 SD (Dep. Var.) 0.619 0.355 0.551 0.619 0.355 0.551 Country FE Yes Yes Yes Yes Yes Yes Geographic Controls Yes Yes Yes Yes Yes Yes • Notes: All regressions are estimated using IV with logarithm of one plus distance (km) to the nearest ancient lake as an instrument. The unit of observation is a grid cell (about 55km × 55km). The dependent variables are (A) logarithm of one plus distance (km) to the nearest jihad during a period given in each column, (B) dummy variables which take a value of 1 if jihad occurred during a period given in each column, otherwise take a value of 0, (C) logarithm of one plus the number of jihad events during a given period in each column. All Log(Distance) variables indicate the logarithm of one plus distance (km) to the nearest object. The interest variables are the logarithm of one plus distance (km) to the nearest pre-colonial landlocked trade point whose contemporary population is less than 100,000 in columns (1)-(3), and the logarithm of one plus distance (km) to the nearest pre-colonial landlocked trade route up to 1800 in columns (4)-(6). Landlocked is defined as the 1000km faraway from the nearest coast point. We control for the logarithm of distance (km) to the nearest water sources today, landlocked dummy, average malaria suitability, average caloric suitability in post 1500, average elevation, ruggedness, and logarithm of one plus population in 2010 in all the specifications. We report standard errors adjusting for spatial auto-correlation with distance cutoff at 100km in parentheses. • ∗ , ∗∗ , ∗∗∗ .
(1) (2) (3) (4) (5) (6) (7) (8) (9) Log (Distance to an ancient lake) 0.105∗∗∗ 0.106∗∗∗ 0.128∗∗∗ (0.0170) (0.0170) (0.0186) Log (Distance to an ancient river) 0.0536∗∗∗ 0.0498∗∗∗ 0.0175 (0.0155) (0.0155) (0.0166) Log (Distance to an ancient lake/river) 0.0829∗∗∗ 0.0806∗∗∗ 0.0744∗∗∗ (0.0141) (0.0141) (0.0154) Log (Distance to a lake/river today) -0.0703∗∗∗ -0.0671∗∗∗ -0.0422∗∗ -0.0675∗∗∗ -0.0654∗∗∗ -0.0508∗∗ -0.0692∗∗∗ -0.0668∗∗∗ -0.0552∗∗∗ (0.0199) (0.0200) (0.0181) (0.0208) (0.0207) (0.0204) (0.0201) (0.0200) (0.0192) Colonizer FE No Yes No No Yes No No Yes No Country FE No No Yes No No Yes No No Yes F-stat 37.97 38.44 46.86 11.77 10.14 1.08 34.09 32.32 23.09 Observations 2616 2616 2616 2616 2616 2616 2616 2616 2616 • Notes: All regressions are estimated using OLS. The unit of observation is a grid cell (about 55km × 55km). All Log(Distance) variables indicate the logarithm of one plus distance (km) to the nearest object. The dependent variable is the logarithm of one plus distance (km) to the nearest pre-colonial landlocked trade point whose contemporary population is less than 50,000 Landlocked is defined as the 1000km faraway from the nearest coast point. We control for landlocked dummy, average malaria suitability, average caloric suitability in post 1500, average elevation, ruggedness, and logarithm of one plus population in 2010 in all the specifications. We report standard errors adjusting for spatial auto-correlation with distance cutoff at 100km in parentheses. • ∗ , ∗∗ , ∗∗∗ .
(A) Log(Distance) (1) (2) (3) 2010-19 2010-15 2016-19 Log (Distance to a landlocked trade point ( 50,000)) 1.300∗∗∗ 1.415∗∗∗ 1.487∗∗∗ (0.289) (0.277) (0.310) Observations 2616 2616 2616 Mean (Dep. Var.) 4.932 5.211 5.264 SD (Dep. Var.) 1.157 1.021 1.180 (B) Onset (1) (2) (3) 2010-19 2010-15 2016-19 Log (Distance to a landlocked trade point ( 50,000)) -0.326∗∗∗ -0.339∗∗∗ -0.312∗∗∗ (0.0786) (0.0749) (0.0850) Observations 2616 2616 2616 Mean (Dep. Var.) 0.129 0.071 0.100 SD (Dep. Var.) 0.335 0.258 0.301 (C) Intensity (1) (2) (3) 2010-19 2010-15 2016-19 Log (Distance to a landlocked trade point ( 50,000)) -1.229∗∗∗ -0.888∗∗∗ -1.037∗∗∗ (0.351) (0.266) (0.330) Observations 2616 2616 2616 Mean (Dep. Var.) 0.244 0.118 0.188 SD (Dep. Var.) 0.771 0.520 0.668 Country FE Yes Yes Yes Geographic Controls Yes Yes Yes • Notes: All regressions are estimated using IV with logarithm of one plus distance (km) to the nearest ancient lake as an instrument. The unit of observation is a grid cell (about 55km × 55km). The dependent variables are (A) logarithm of one plus distance (km) to the nearest jihad during a period given in each column, (B) dummy variables which take a value of 1 if jihad occurred during a period given in each column, otherwise take a value of 0, (C) logarithm of one plus the number of jihad events during a given period in each column. All Log(Distance) variables indicate the logarithm of one plus distance (km) to the nearest object. In all the columns, the interest variable is the logarithm of one plus distance (km) to the nearest pre-colonial landlocked trade point whose contemporary population is less than 50,000. Landlocked is defined as the 1000km faraway from the nearest coast point. We control for the logarithm of distance (km) to the nearest water sources today, landlocked dummy, average malaria suitability, average caloric suitability in post 1500, average elevation, ruggedness, and logarithm of one plus population in 2010 in all the specifications. We report standard errors adjusting for spatial auto-correlation with distance cutoff at 100km in parentheses. • ∗ , ∗∗ , ∗∗∗ .
(1) (2) (3) (4) (5) (6) (7) (8) (9) Log (Distance to an ancient lake) 0.0618∗∗∗ 0.0618∗∗∗ 0.0873∗∗∗ (0.0189) (0.0189) (0.0220) Log (Distance to an ancient river) -0.0105 -0.0105 -0.0208 (0.0208) (0.0208) (0.0212) Log (Distance to an ancient lake/river) 0.0267 0.0267 0.0306 (0.0187) (0.0187) (0.0190) Log (Distance to a lake/river today) -0.135∗∗∗ -0.135∗∗∗ -0.106∗∗∗ -0.138∗∗∗ -0.138∗∗∗ -0.118∗∗∗ -0.142∗∗∗ -0.142∗∗∗ -0.123∗∗∗ (0.0334) (0.0334) (0.0329) (0.0356) (0.0356) (0.0351) (0.0345) (0.0345) (0.0339) Colonizer FE No Yes No No Yes No No Yes No Country FE No No Yes No No Yes No No Yes F-stat 10.46 10.46 15.44 0.25 0.25 0.94 1.99 1.99 2.52 Observations 1616 1616 1616 1616 1616 1616 1616 1616 1616 • Notes: All regressions are estimated using OLS. The unit of observation is a grid cell (about 55km × 55km). The observations restrict grid cells in Mauritania, Mali, Niger and Chad. All Log(Distance) variables indicate the logarithm of one plus distance (km) to the nearest object. The dependent variable is the logarithm of one plus distance (km) to the nearest pre-colonial landlocked trade point whose contemporary population is less than 50,000. Landlocked is defined as the 1000km faraway from the nearest coast point. We control for landlocked dummy, average malaria suitability, average caloric suitability in post 1500, average elevation, ruggedness, and logarithm of one plus population in 2010 in all the specifications. We report standard errors adjusting for spatial auto-correlation with distance cutoff at 100km in parentheses. • ∗ , ∗∗ , ∗∗∗ .
(A) Log(Distance) (1) (2) (3) 2010-19 2010-15 2016-19 Log (Distance to a landlocked trade point ( 50,000)) 0.577∗ 0.981∗∗ 0.603∗ (0.345) (0.404) (0.335) Observations 1616 1616 1616 Mean (Dep. Var.) 5.038 5.270 5.333 SD (Dep. Var.) 1.114 0.961 1.157 (B) Onset (1) (2) (3) 2010-19 2010-15 2016-19 Log (Distance to a landlocked trade point ( 50,000)) -0.140∗ -0.189∗∗ -0.138 (0.0847) (0.0781) (0.0851) Observations 1616 1616 1616 Mean (Dep. Var.) 0.110 0.051 0.095 SD (Dep. Var.) 0.312 0.220 0.293 (C) Intensity (1) (2) (3) 2010-19 2010-15 2016-19 Log (Distance to a landlocked trade point ( 50,000)) -0.460∗∗ -0.303∗∗ -0.393∗ (0.223) (0.130) (0.205) Observations 1616 1616 1616 Mean (Dep. Var.) 0.186 0.070 0.154 SD (Dep. Var.) 0.619 0.355 0.551 Country FE Yes Yes Yes Geographic Controls Yes Yes Yes • Notes: All regressions are estimated using IV with logarithm of one plus distance (km) to the nearest ancient lake as an instrument. The unit of observation is a grid cell (about 55km × 55km). The observations restrict grid cells in Mauritania, Mali, Niger and Chad. The dependent variables are (A) logarithm of one plus distance (km) to the nearest jihad during a period given in each column, (B) dummy variables which take a value of 1 if jihad occurred during a period given in each column, otherwise take a value of 0, (C) logarithm of one plus the number of jihad events during a given period in each column. All Log(Distance) variables indicate the logarithm of one plus distance (km) to the nearest object. In all the columns, the interest variable is the logarithm of one plus distance (km) to the nearest pre-colonial landlocked trade point whose contemporary population is less than 50,000. Landlocked is defined as the 1000km faraway from the nearest coast point. We control for the logarithm of distance (km) to the nearest water sources today, landlocked dummy, average malaria suitability, average caloric suitability in post 1500, average elevation, ruggedness, and logarithm of one plus population in 2010 in all the specifications. We report standard errors adjusting for spatial auto-correlation with distance cutoff at 100km in parentheses. • ∗ , ∗∗ , ∗∗∗ .
(A) Log (Distance to a landlocked trade point ( 100,000)) (1) (2) (3) Log (Ancient Water Access) -0.0892∗∗∗ -0.0869∗∗∗ -0.144∗∗∗ (0.0192) (0.0188) (0.0221) Log (Distance to a lake/river today) 0.00558 0.00402 0.0259 (0.0232) (0.0230) (0.0193) R2 0.649 0.651 0.722 Adj-R2 0.648 0.650 0.721 Observations 2616 2616 2616 Mean (Dep. Var.) 5.951 5.951 5.951 SD (Dep. Var.) 0.840 0.840 0.840 (B) Log (Distance to a landlocked trade route up to 1800) (1) (2) (3) Log (Ancient Water Access) -0.00173 0.00216 -0.193∗∗∗ (0.0445) (0.0444) (0.0398) Log (Distance to a lake/river today) -0.0194 -0.0209 0.0216 (0.0383) (0.0383) (0.0271) R2 0.520 0.523 0.696 Adj-R2 0.518 0.522 0.696 Observations 2616 2616 2616 Mean (Dep. Var.) 5.587 5.587 5.587 SD (Dep. Var.) 1.175 1.175 1.175 Colonizer FE No Yes No Country FE No No Yes Geographic Controls Yes Yes Yes • Notes: All regressions are estimated using OLS. The unit of observation is a grid cell (about 55km × 55km). All Log(Distance) variables indicate the logarithm of one plus distance (km) to the nearest object. The dependent variables are (A) the logarithm of one plus distance (km) to the nearest pre-colonial landlocked trade point whose contemporary population is less than 100,000, (B) the logarithm of one plus distance (km) to the nearest pre-colonial landlocked trade route up to 1800. Landlocked is defined as the 1000km faraway from the nearest coast point. We control for landlocked dummy, average malaria suitability, average caloric suitability in post 1500, average elevation, and ruggedness in all the specifications. We report standard errors adjusting for spatial auto-correlation with distance cutoff at 100km in parentheses. • ∗ , ∗∗ , ∗∗∗ .
(A) Log(Distance) (1) (2) (3) (4) (5) (6) All 2001-09 2010-19 All 2001-09 2010-19 Log (Distance to a landlocked trade point ( 100,000)) 1.609∗∗∗ 0.726∗∗∗ 1.833∗∗∗ (0.330) (0.217) (0.355) Log (Distance to a landlocked trade route up to 1800) 1.193∗∗∗ 0.538∗∗∗ 1.358∗∗∗ (0.210) (0.117) (0.242) Log (Distance to a lake/river today) 0.138∗∗∗ 0.0198 0.129∗∗∗ 0.142∗∗∗ 0.0212 0.132∗∗∗ (0.0430) (0.0319) (0.0443) (0.0363) (0.0301) (0.0371) Observations 2616 2616 2616 2616 2616 2616 Mean (Dep. Var.) 4.816 5.698 4.932 4.816 5.698 4.932 SD (Dep. Var.) 1.101 0.743 1.157 1.101 0.743 1.157 (B) Onset (1) (2) (3) (4) (5) (6) All 2001-09 2010-19 All 2001-09 2010-19 Log (Distance to a landlocked trade point ( 100,000)) -0.395∗∗∗ -0.0142 -0.400∗∗∗ (0.0942) (0.0144) (0.0945) Log (Distance to a landlocked trade route up to 1800) -0.293∗∗∗ -0.0105 -0.297∗∗∗ (0.0639) (0.00984) (0.0641) Log (Distance to a lake/river today) -0.0403∗∗∗ 0.00346 -0.0438∗∗∗ -0.0411∗∗∗ 0.00343 -0.0446∗∗∗ (0.0123) (0.00315) (0.0122) (0.0112) (0.00318) (0.0111) Observations 2616 2616 2616 2616 2616 2616 Mean (Dep. Var.) 0.133 0.011 0.129 0.133 0.011 0.129 SD (Dep. Var.) 0.339 0.106 0.335 0.339 0.106 0.335 (C) Intensity (1) (2) (3) (4) (5) (6) All 2001-09 2010-19 All 2001-09 2010-19 Log (Distance to a landlocked trade point ( 100,000)) -1.565∗∗∗ -0.0324 -1.569∗∗∗ (0.447) (0.0250) (0.448) Log (Distance to a landlocked trade route up to 1800) -1.160∗∗∗ -0.0240 -1.163∗∗∗ (0.285) (0.0175) (0.285) Log (Distance to a lake/river today) -0.0907∗∗ 0.00354 -0.0946∗∗ -0.0937∗∗∗ 0.00348 -0.0976∗∗∗ (0.0392) (0.00337) (0.0392) (0.0348) (0.00346) (0.0347) Observations 2616 2616 2616 2616 2616 2616 Mean (Dep. Var.) 0.249 0.011 0.244 0.249 0.011 0.244 SD (Dep. Var.) 0.775 0.109 0.771 0.775 0.109 0.771 Country FE Yes Yes Yes Yes Yes Yes Geographic Controls Yes Yes Yes Yes Yes Yes • Notes: All regressions are estimated using IV with logarithm of the Ancient Water Access as an instrument. The unit of observation is a grid cell (about 55km × 55km). The dependent variables are (A) logarithm of one plus distance (km) to the nearest jihad during a period given in each column, (B) dummy variables which take a value of 1 if jihad occurred during a period given in each column, otherwise take a value of 0, (C) logarithm of one plus the number of jihad events during a given period in each column. All Log(Distance) variables indicate the logarithm of one plus distance (km) to the nearest object. Landlocked is defined as the 1000km faraway from the nearest coast point. The interest variables are the logarithm of one plus distance (km) to the nearest pre-colonial landlocked trade point whose contemporary population is less than 100,000 in columns (1)-(3), and the logarithm of one plus distance (km) to the nearest pre-colonial landlocked trade route up to 1800 in columns (4)-(6). We control for landlocked dummy, average malaria suitability, average caloric suitability in post 1500, average elevation, ruggedness, and logarithm of one plus population in 2010 in all the specifications. We report standard errors adjusting for spatial auto-correlation with distance cutoff at 100km in parentheses. • ∗ , ∗∗ , ∗∗∗ .
(A) Log(Distance) (1) (2) (3) 2010-19 2010-15 2016-19 Log (Distance to a landlocked trade point ( 100,000)) 1.306 1.421 1.493 200km cutoff [0.466]∗∗∗ [0.415]∗∗∗ [0.515]∗∗∗ 300km cutoff [0.525]∗∗ [0.445]∗∗∗ [0.595]∗∗ 400km cutoff [0.520]∗∗ [0.420]∗∗∗ [0.598]∗∗ 500km cutoff [0.498]∗∗∗ [0.388]∗∗∗ [0.573]∗∗∗ 1000km cutoff [0.588]∗∗ [0.427]∗∗∗ [0.666]∗∗ Observations 2616 2616 2616 Mean (Dep. Var.) 4.932 5.211 5.264 SD (Dep. Var.) 1.157 1.021 1.180 (B) Onset (1) (2) (3) 2010-19 2010-15 2016-19 Log (Distance to a landlocked trade point ( 100,000)) -0.327 -0.340 -0.314 200km cutoff [0.125]∗∗∗ [0.121]∗∗∗ [0.142]∗∗ 300km cutoff [0.134]∗∗ [0.132]∗∗ [0.155]∗∗ 400km cutoff [0.122]∗∗∗ [0.121]∗∗∗ [0.140]∗∗ 500km cutoff [0.102]∗∗∗ [0.102]∗∗∗ [0.116]∗∗∗ 1000km cutoff [0.108]∗∗∗ [0.0927]∗∗∗ [0.121]∗∗∗ Observations 2616 2616 2616 Mean (Dep. Var.) 0.129 0.071 0.100 SD (Dep. Var.) 0.335 0.258 0.301 (C) Intensity (1) (2) (3) 2010-19 2010-15 2016-19 Log (Distance to a landlocked trade point ( 100,000)) -1.234 -0.892 -1.042 200km cutoff [0.576]∗∗ [0.425]∗∗ [0.540]∗ 300km cutoff [0.613]∗∗ [0.449]∗∗ [0.570]∗ 400km cutoff [0.558]∗∗ [0.419]∗∗ [0.510]∗∗ 500km cutoff [0.474]∗∗∗ [0.364]∗∗ [0.429]∗∗ 1000km cutoff [0.474]∗∗∗ [0.339]∗∗∗ [0.425]∗∗ Observations 2616 2616 2616 Mean (Dep. Var.) 0.244 0.118 0.188 SD (Dep. Var.) 0.771 0.520 0.668 Country FE Yes Yes Yes Geographic Controls Yes Yes Yes • Notes: All regressions are estimated using IV with logarithm of the Ancient Water Access as an instrument. The unit of observation is a grid cell (about 55km × 55km). The dependent variables are (A) logarithm of one plus distance (km) to the nearest jihad during a period given in each column, (B) dummy variables which take a value of 1 if jihad occurred during a period given in each column, otherwise take a value of 0, (C) logarithm of one plus the number of jihad events during a given period in each column. All Log(Distance) variables indicate the logarithm of one plus distance (km) to the nearest object. Landlocked is defined as the 1000km faraway from the nearest coast point. The interest variables are the logarithm of one plus distance (km) to the nearest pre-colonial landlocked trade point whose contemporary population is less than 100,000 in columns (1)-(3). We control for landlocked dummy, average malaria suitability, average caloric suitability in post 1500, average elevation, ruggedness, and logarithm of one plus population in 2010 in all the specifications. We report standard errors adjusting for spatial auto-correlation with distance cutoffs in brackets. • ∗ , ∗∗ , ∗∗∗ .
(A) Log(Distance) (1) (2) (3) (4) (5) (6) All 2001-09 2010-19 All 2001-09 2010-19 Log (Distance to a landlocked trade point ( 100,000)) 1.322∗∗∗ 1.112∗∗∗ 1.473∗∗∗ (0.270) (0.214) (0.280) Log (Distance to a landlocked trade route up to 1800) 0.992∗∗∗ 0.834∗∗∗ 1.105∗∗∗ (0.175) (0.138) (0.184) Log (Distance to a lake/river today) 0.159∗∗∗ 0.0685∗∗ 0.155∗∗∗ 0.162∗∗∗ 0.0706∗∗ 0.158∗∗∗ (0.0396) (0.0275) (0.0412) (0.0341) (0.0291) (0.0343) Observations 2616 2616 2616 2616 2616 2616 Mean (Dep. Var.) 4.959 5.866 5.070 4.959 5.866 5.070 SD (Dep. Var.) 1.099 0.779 1.169 1.099 0.779 1.169 (B) Onset (1) (2) (3) (4) (5) (6) All 2001-09 2010-19 All 2001-09 2010-19 Log (Distance to a landlocked trade point ( 100,000)) -0.363∗∗∗ -0.0840∗∗ -0.374∗∗∗ (0.0808) (0.0406) (0.0814) Log (Distance to a landlocked trade route up to 1800) -0.273∗∗∗ -0.0631∗∗ -0.281∗∗∗ (0.0588) (0.0300) (0.0591) Log (Distance to a lake/river today) -0.0463∗∗∗ -0.000444 -0.0468∗∗∗ -0.0470∗∗∗ -0.000607 -0.0476∗∗∗ (0.0120) (0.00362) (0.0121) (0.0107) (0.00407) (0.0108) Observations 2616 2616 2616 2616 2616 2616 Mean (Dep. Var.) 0.123 0.015 0.120 0.123 0.015 0.120 SD (Dep. Var.) 0.328 0.123 0.325 0.328 0.123 0.325 (C) Intensity (1) (2) (3) (4) (5) (6) All 2001-09 2010-19 All 2001-09 2010-19 Log (Distance to a landlocked trade point ( 100,000)) -1.248∗∗∗ -0.0827∗∗ -1.250∗∗∗ (0.354) (0.0402) (0.355) Log (Distance to a landlocked trade route up to 1800) -0.937∗∗∗ -0.0621∗∗ -0.938∗∗∗ (0.236) (0.0295) (0.236) Log (Distance to a lake/river today) -0.0747∗∗ -0.00109 -0.0746∗∗ -0.0771∗∗ -0.00125 -0.0770∗∗ (0.0368) (0.00358) (0.0368) (0.0319) (0.00405) (0.0318) Observations 2616 2616 2616 2616 2616 2616 Mean (Dep. Var.) 0.217 0.013 0.214 0.217 0.013 0.214 SD (Dep. Var.) 0.712 0.112 0.708 0.712 0.112 0.708 Country FE Yes Yes Yes Yes Yes Yes Geographic Controls Yes Yes Yes Yes Yes Yes • Notes: All regressions are estimated using IV with logarithm of one plus distance (km) to the nearest ancient lake as an instrument. The unit of observation is a grid cell (about 55km × 55km). In this table, the jihadistic events data comes from Uppsala Conflict Data Program (UCDP) in 2001-2019. The dependent variables are (A) logarithm of one plus distance (km) to the nearest jihad during a period given in each column, (B) dummy variables which take a value of 1 if jihad occurred during a period given in each column, otherwise take a value of 0, (C) logarithm of one plus the number of jihad events during a given period in each column. All Log(Distance) variables indicate the logarithm of one plus distance (km) to the nearest object. Landlocked is defined as the 1000km faraway from the nearest coast point. The interest variables are the logarithm of one plus distance (km) to the nearest pre-colonial landlocked trade point whose contemporary population is less than 100,000 in columns (1)-(3), and the logarithm of one plus distance (km) to the nearest pre-colonial landlocked trade route up to 1800 in columns (4)-(6). We control for landlocked dummy, average malaria suitability, average caloric suitability in post 1500, average elevation, ruggedness, and logarithm of one plus population in 2010 in all the specifications. We report standard errors adjusting for spatial auto-correlation with distance cutoff at 100km in parentheses. • ∗ , ∗∗ , ∗∗∗ .
(A) Log(Distance) (1) (2) (3) (4) (5) (6) All 2001-09 2010-19 All 2001-09 2010-19 Log (Distance to a landlocked trade point ( 100,000)) -0.259 -0.867∗∗∗ 0.00606 (0.275) (0.309) (0.248) Log (Distance to a landlocked trade route up to 1800) -0.190 -0.636∗∗ 0.00444 (0.203) (0.260) (0.182) Log (Distance to a lake/river today) 0.138∗∗∗ 0.0857 0.201∗∗∗ 0.138∗∗∗ 0.0848 0.201∗∗∗ (0.0500) (0.0619) (0.0447) (0.0500) (0.0575) (0.0447) Observations 1616 1616 1616 1616 1616 1616 Mean (Dep. Var.) 4.433 5.047 4.576 4.433 5.047 4.576 SD (Dep. Var.) 0.930 0.934 0.892 0.930 0.934 0.892 (B) Onset (1) (2) (3) (4) (5) (6) All 2001-09 2010-19 All 2001-09 2010-19 Log (Distance to a landlocked trade point ( 100,000)) 0.0185 0.132∗ -0.0732 (0.0947) (0.0711) (0.0826) Log (Distance to a landlocked trade route up to 1800) 0.0136 0.0967∗ -0.0537 (0.0691) (0.0547) (0.0640) Log (Distance to a lake/river today) -0.0397∗ 0.0168 -0.0613∗∗∗ -0.0397∗ 0.0169 -0.0614∗∗∗ (0.0217) (0.0142) (0.0190) (0.0217) (0.0143) (0.0198) Observations 1616 1616 1616 1616 1616 1616 Mean (Dep. Var.) 0.166 0.063 0.130 0.166 0.063 0.130 SD (Dep. Var.) 0.372 0.242 0.336 0.372 0.242 0.336 (C) Intensity (1) (2) (3) (4) (5) (6) All 2001-09 2010-19 All 2001-09 2010-19 Log (Distance to a landlocked trade point ( 100,000)) 0.137 0.201 -0.0391 (0.193) (0.126) (0.153) Log (Distance to a landlocked trade route up to 1800) 0.100 0.148 -0.0287 (0.140) (0.0967) (0.114) Log (Distance to a lake/river today) -0.0953∗∗ 0.0368 -0.133∗∗∗ -0.0951∗∗ 0.0370 -0.133∗∗∗ (0.0462) (0.0234) (0.0393) (0.0457) (0.0235) (0.0396) Observations 1616 1616 1616 1616 1616 1616 Mean (Dep. Var.) 0.256 0.085 0.194 0.256 0.085 0.194 SD (Dep. Var.) 0.676 0.383 0.590 0.676 0.383 0.590 Country FE Yes Yes Yes Yes Yes Yes Geographic Controls Yes Yes Yes Yes Yes Yes • Notes: All regressions are estimated using IV with logarithm of one plus distance (km) to the nearest ancient lake as an instrument. The unit of observation is a grid cell (about 55km × 55km). The observations restrict grid cells in Mauritania, Mali, Niger and Chad. The dependent variables are (A) logarithm of one plus distance (km) to the nearest non-jihadist event during a period given in each column, (B) dummy variables which take a value of 1 if non-jihadist event occurred during a period given in each column, otherwise take a value of 0, (C) logarithm of one plus the number of non-jihadist events during a given period in each column. All Log(Distance) variables indicate the logarithm of one plus distance (km) to the nearest object. Landlocked is defined as the 1000km faraway from the nearest coast point. The interest variables are the logarithm of one plus distance (km) to the nearest pre-colonial landlocked trade point whose contemporary population is less than 100,000 in columns (1)-(3), and the logarithm of one plus distance (km) to the nearest pre-colonial landlocked trade route up to 1800 in columns (4)-(6). We control for landlocked dummy, average malaria suitability, average caloric suitability in post 1500, average elevation, ruggedness, and logarithm of one plus population in 2010 in all the specifications. We report standard errors adjusting for spatial auto-correlation with distance cutoff at 100km in parentheses. • ∗ , ∗∗ , ∗∗∗ .
Appendix B Construction of Historical States
Cultures of West Africa creates the maps that show spatial locations of historical states before colonization as well as modern countries after independence by using multiple sources of references. They provide maps about state landscapes from 0 AD to 1980 AD. We digitized maps for historical states from 1330 AD to 1914 AD just after colonization conquest, using Arc GIS. Figure B.1 and Figure B.2 shows our digitized maps.
To identify which states consist of Muslims predominantly, we rely on \citetAppKasule1998 (p.58) and \citetAppRNF2004 (p.74-75) that show the extent of Islam circa 1800 AD and locations of states. However, Mossi state and Kong state extended out of Islamic extent. Hence, we rely on additional resources to judge if they were Islamic states. According to \citetAppAzarya1980 (p.425), since Kong state was ruled by Muslim, we judge it as the Islamic state. On the other hand, according to \citetAppSkinner1958 (p. 1102), since Mossi state was pagan until European conquests, it was not the Islamic state.
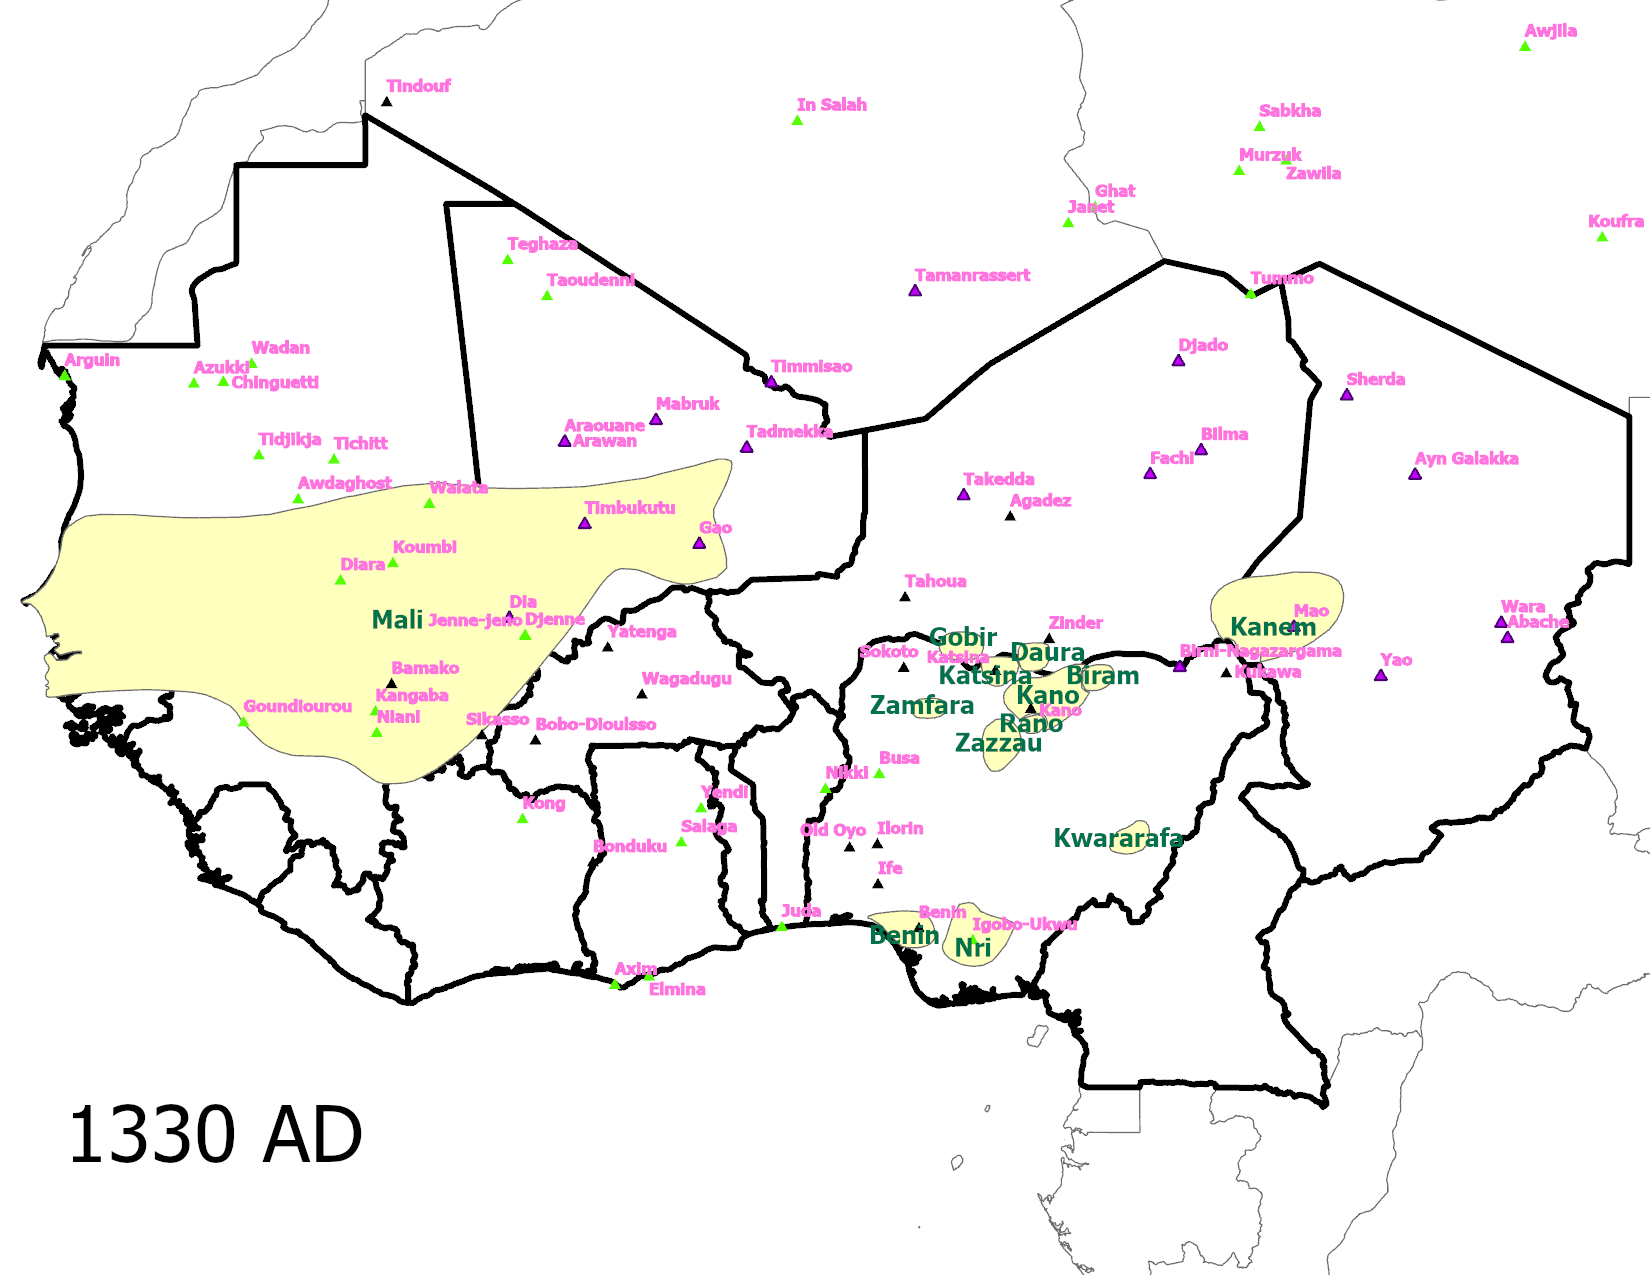
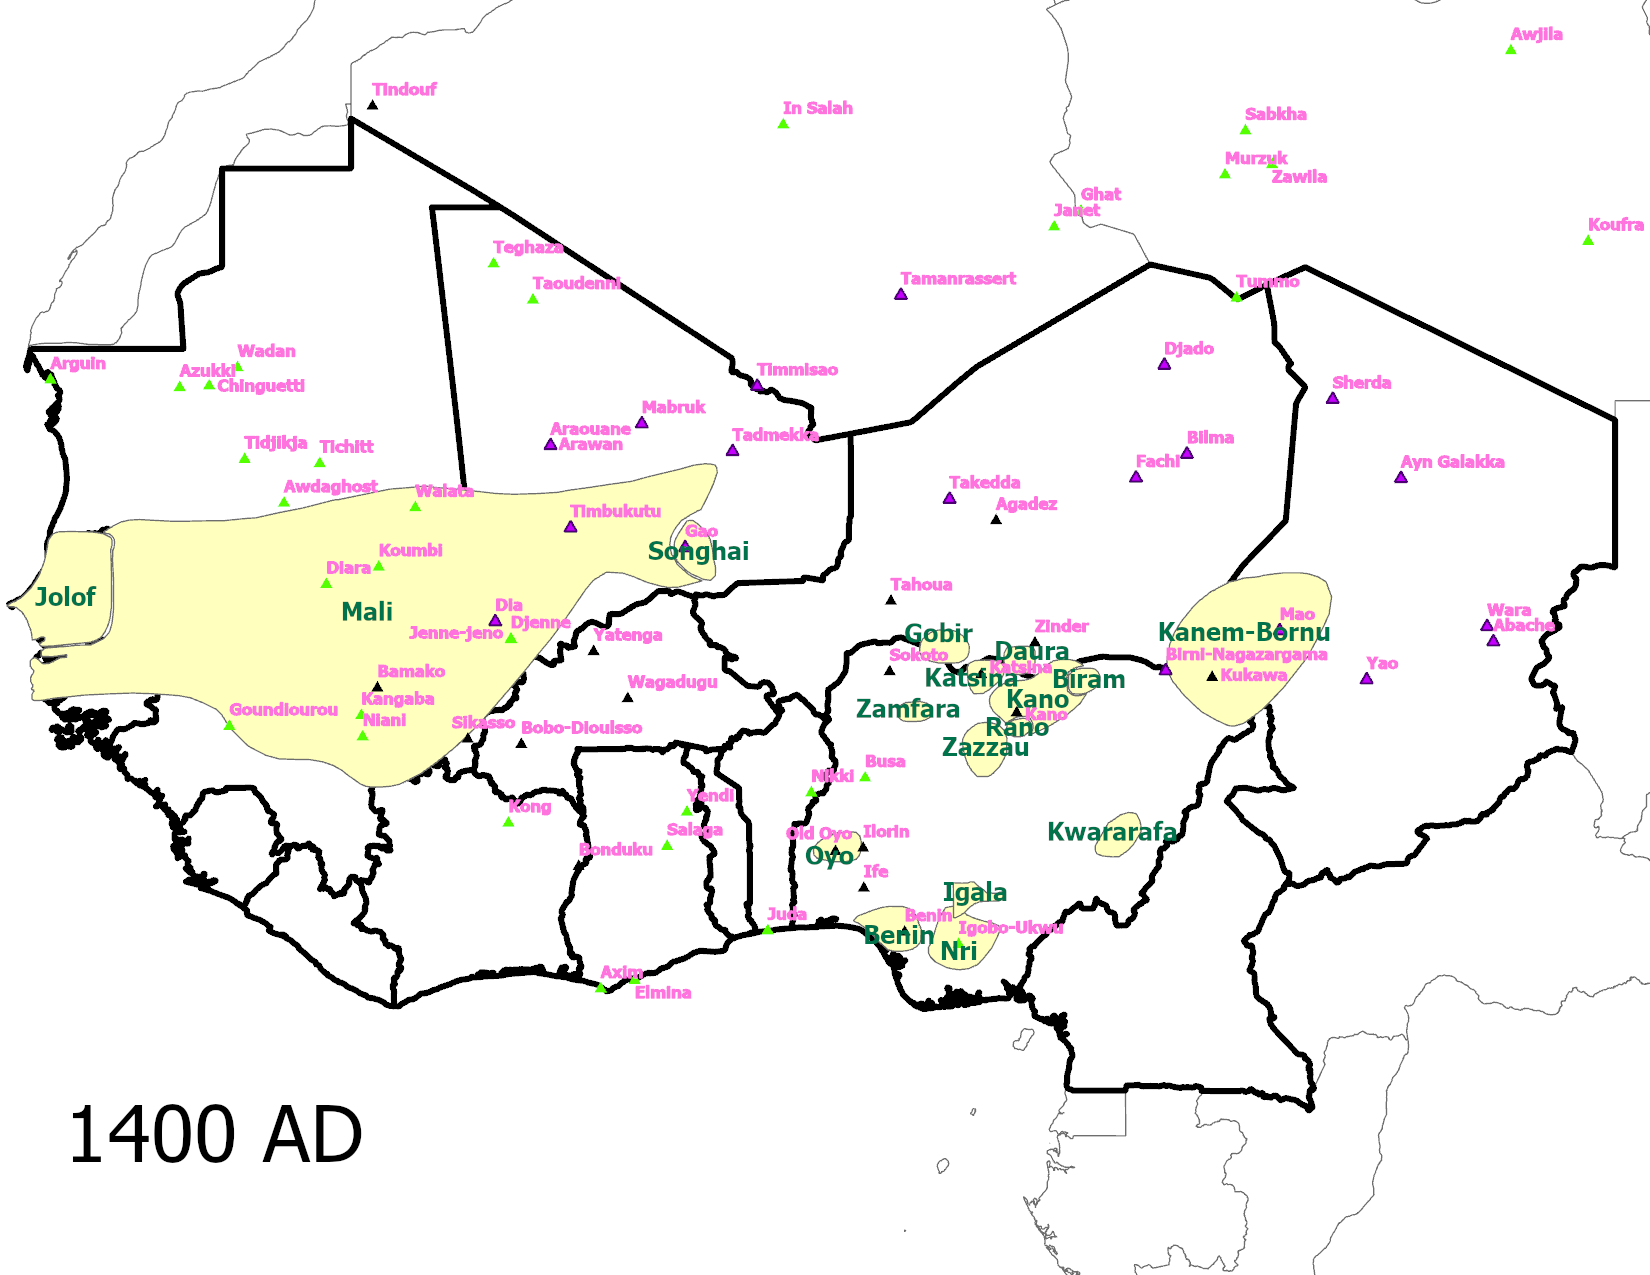
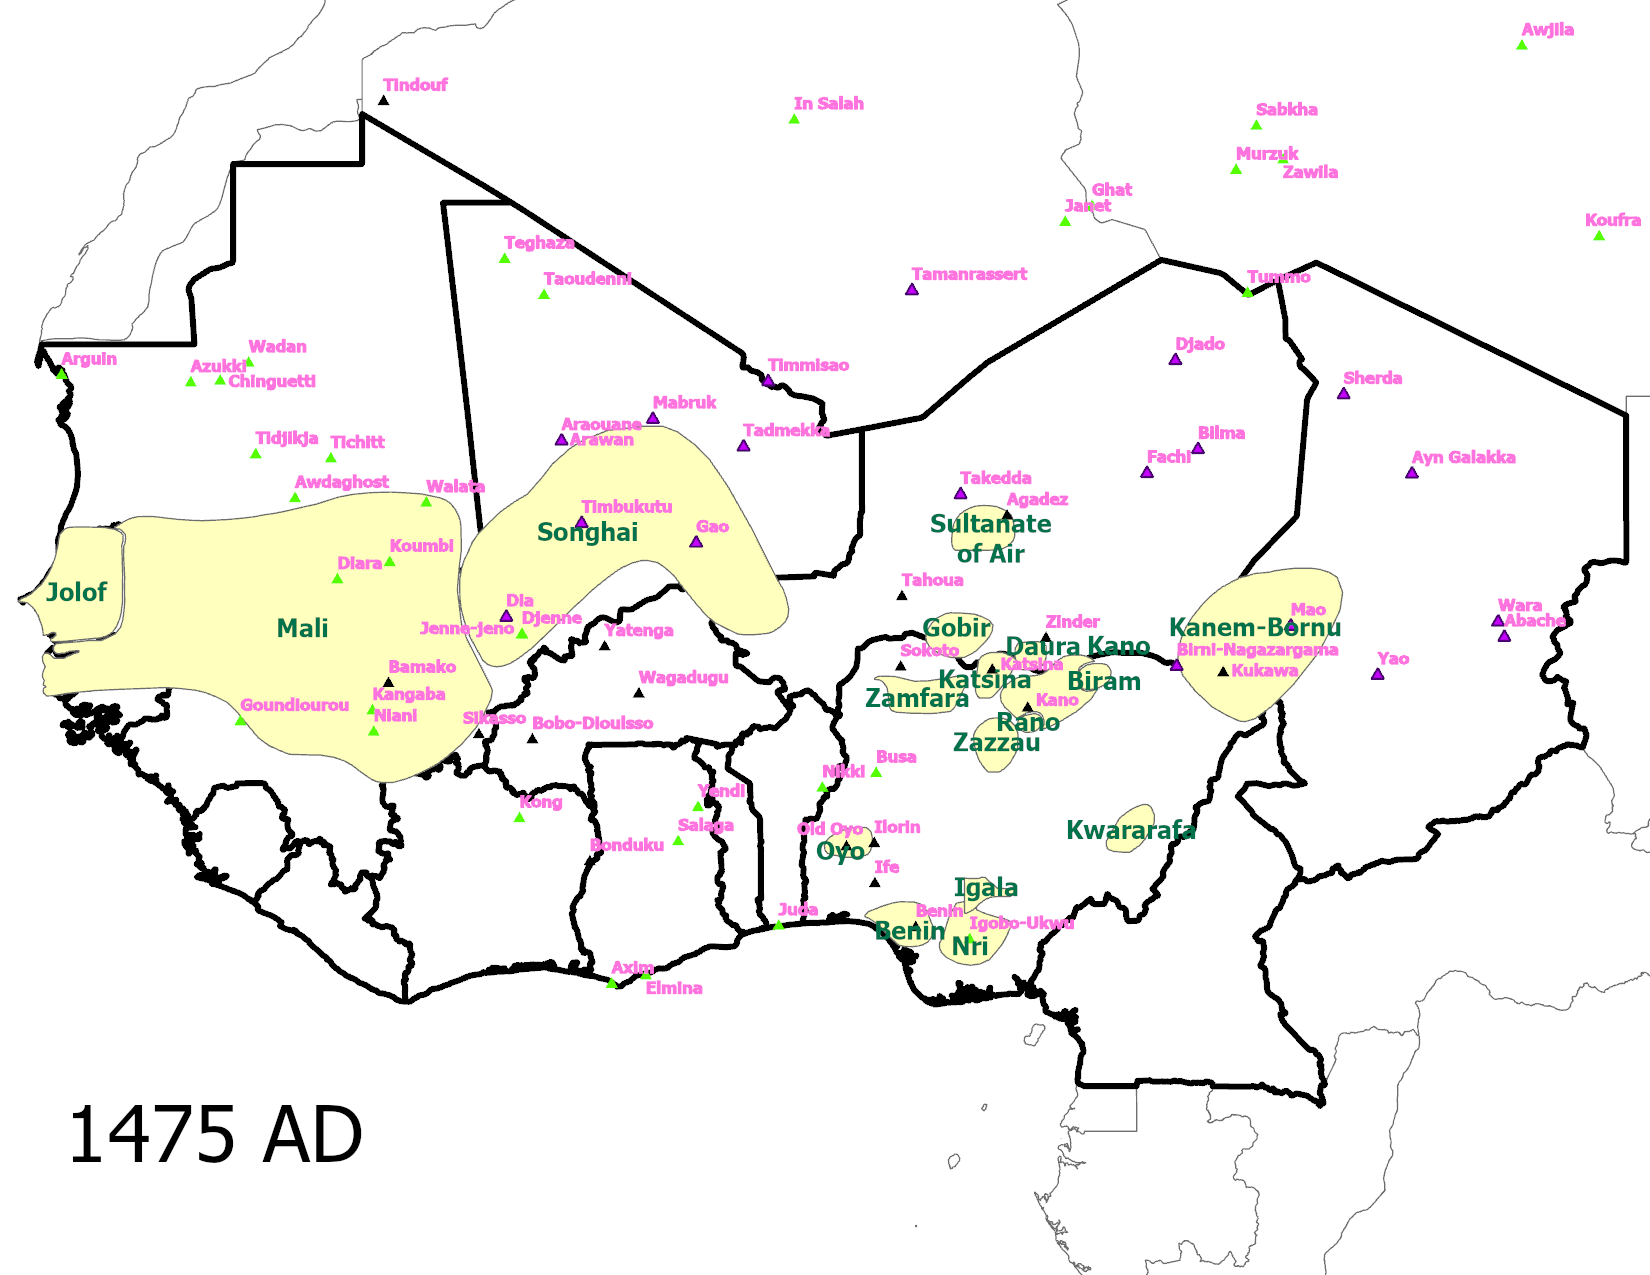
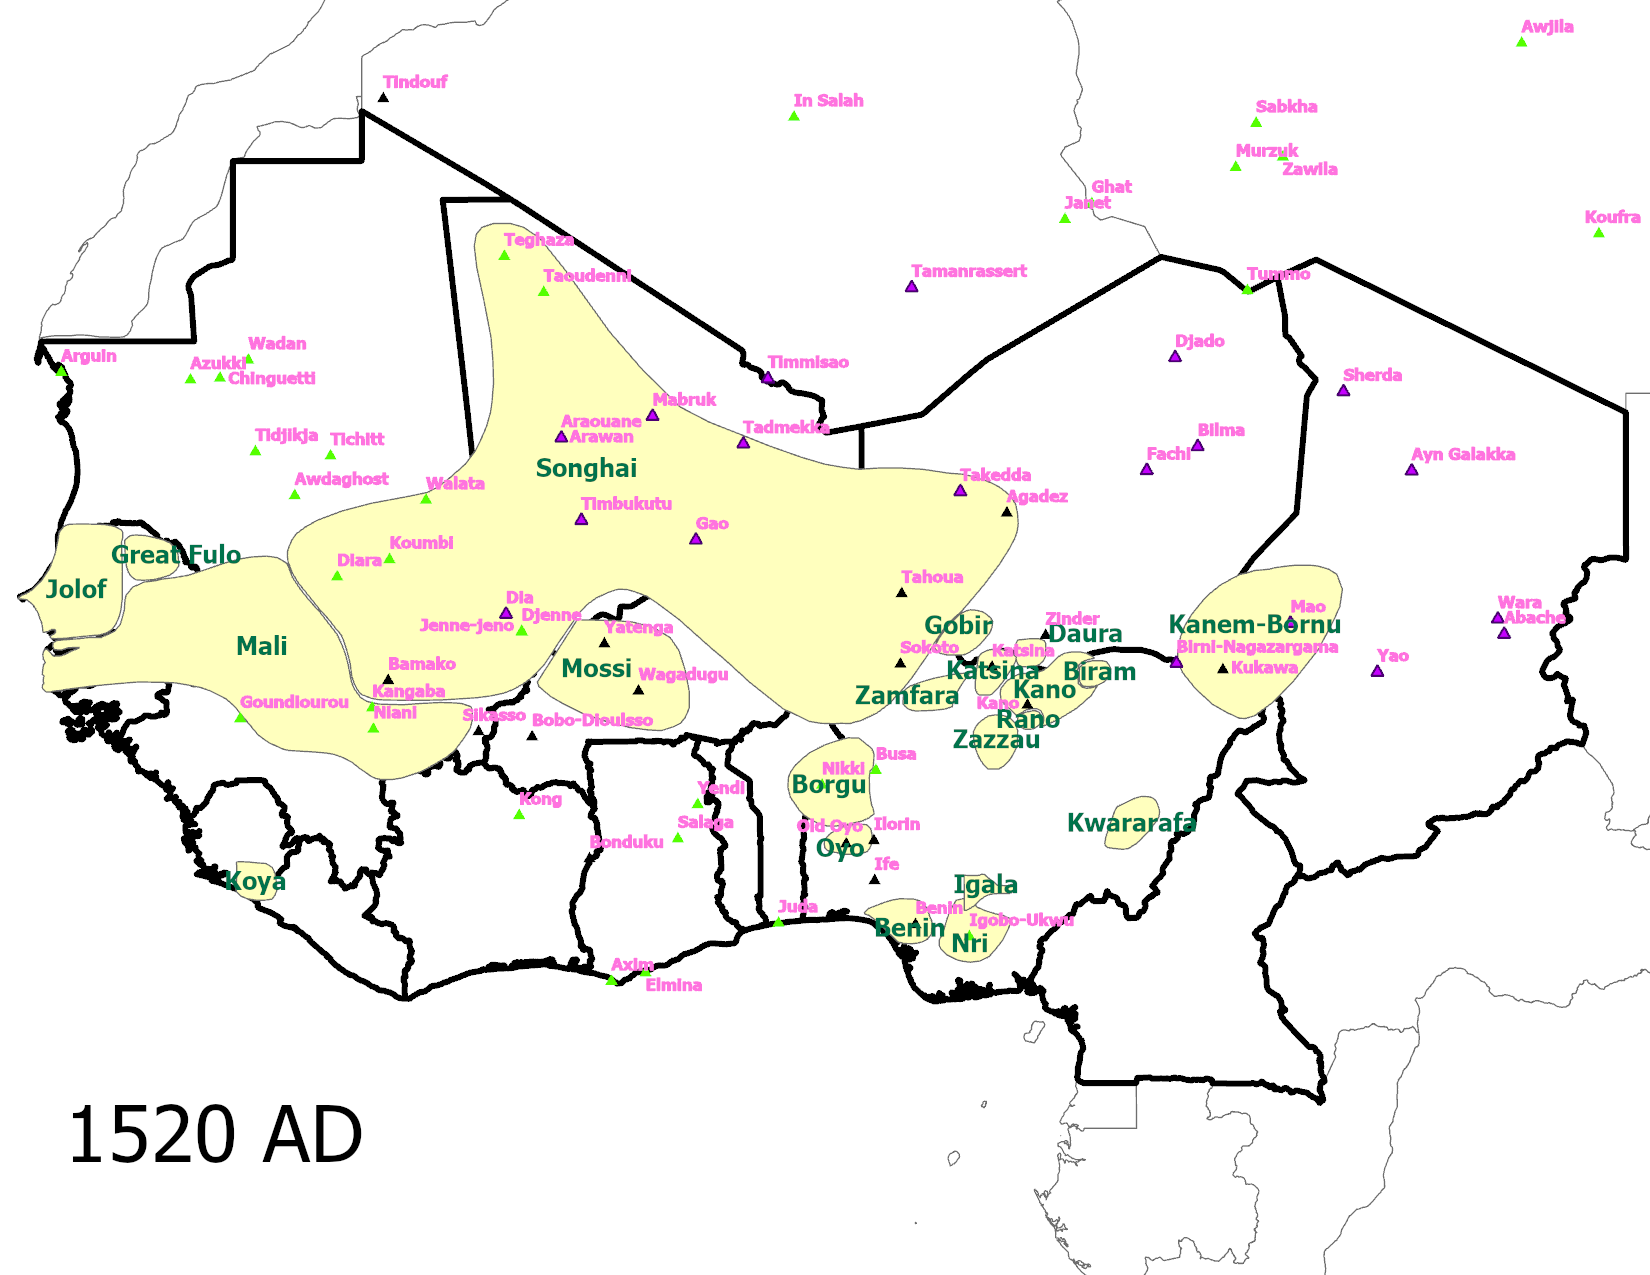
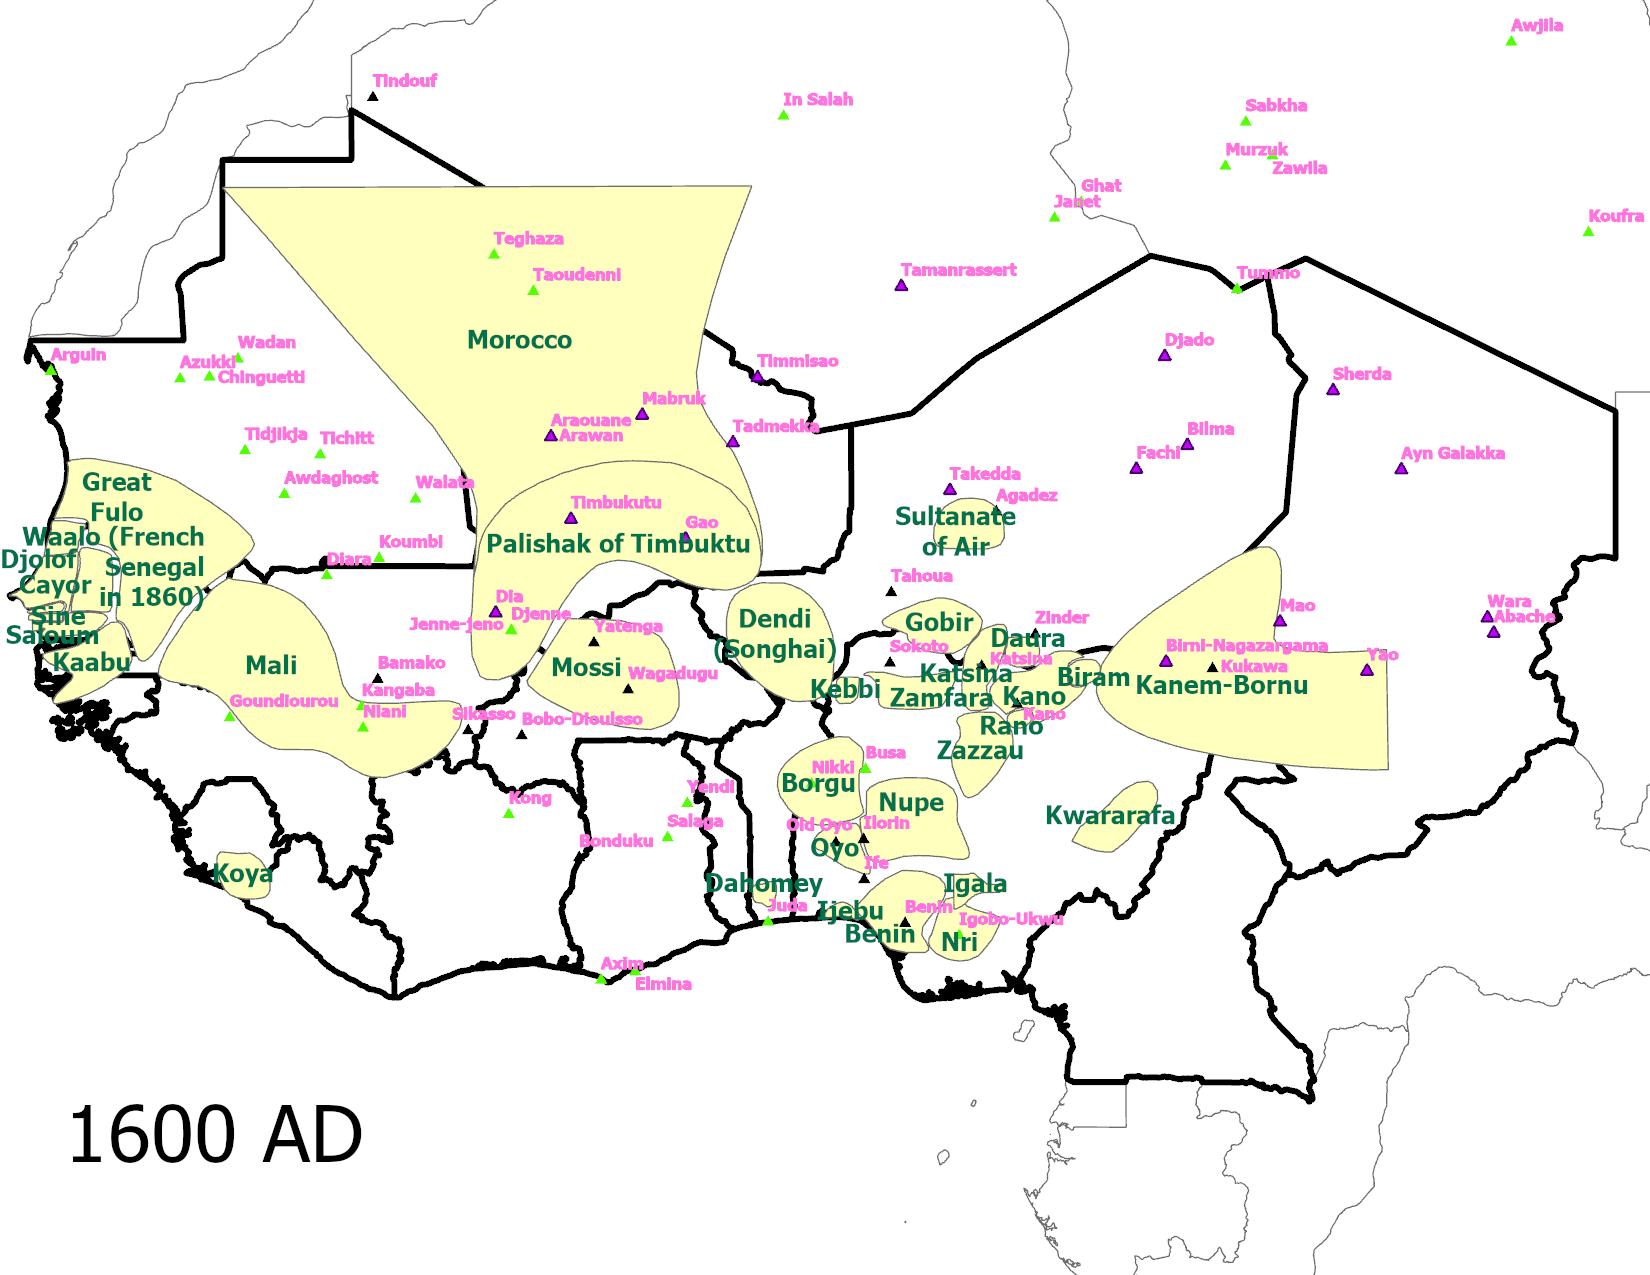
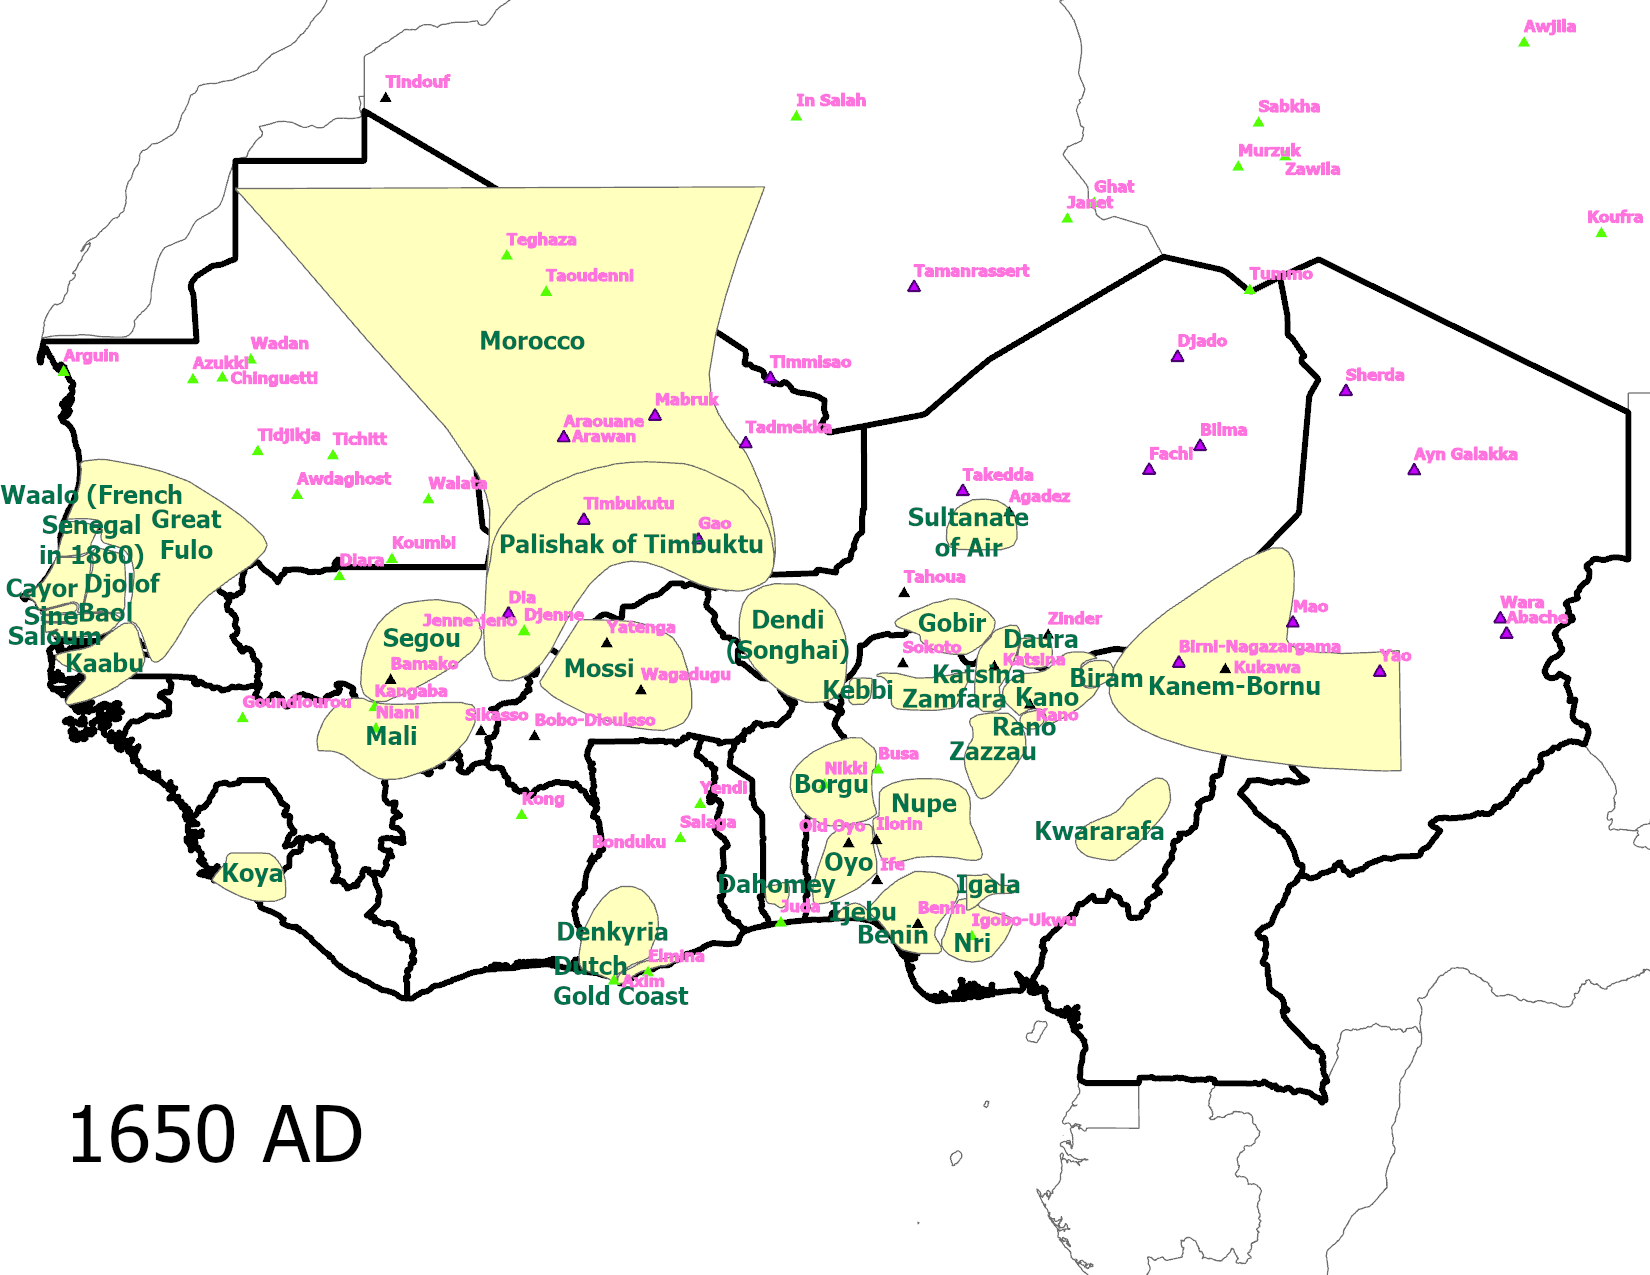
Notes: These maps show the evolution of historical states from 1330 AD to 1650 AD. Yellow regions indicate historical states. We digitize the maps from Cultures of West Africa. The purple triangles indicate pre-colonial inland trade points with less than 100,000 population today, the yellow green triangles indicate pre-colonial coastal trade points with less than 100,000 population today, and the black triangles indicate the other pre-colonial trade points.
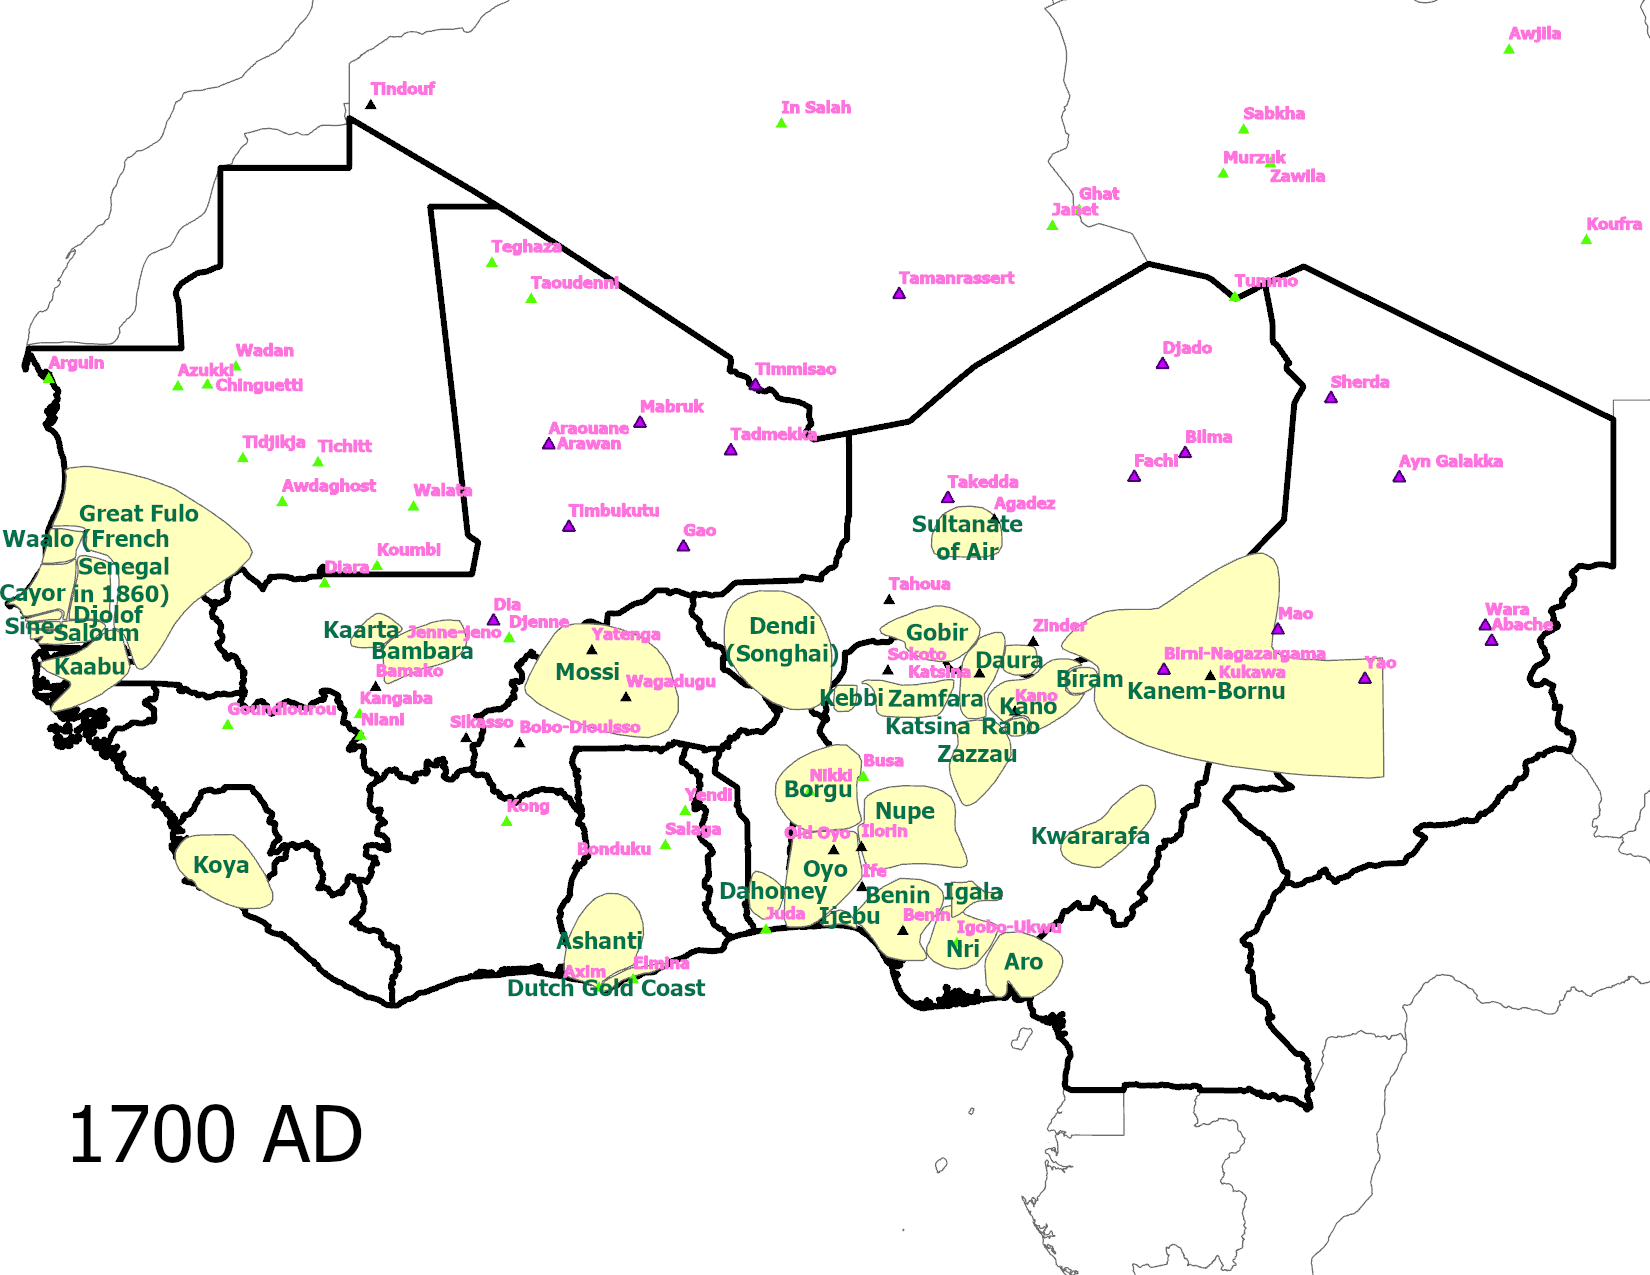
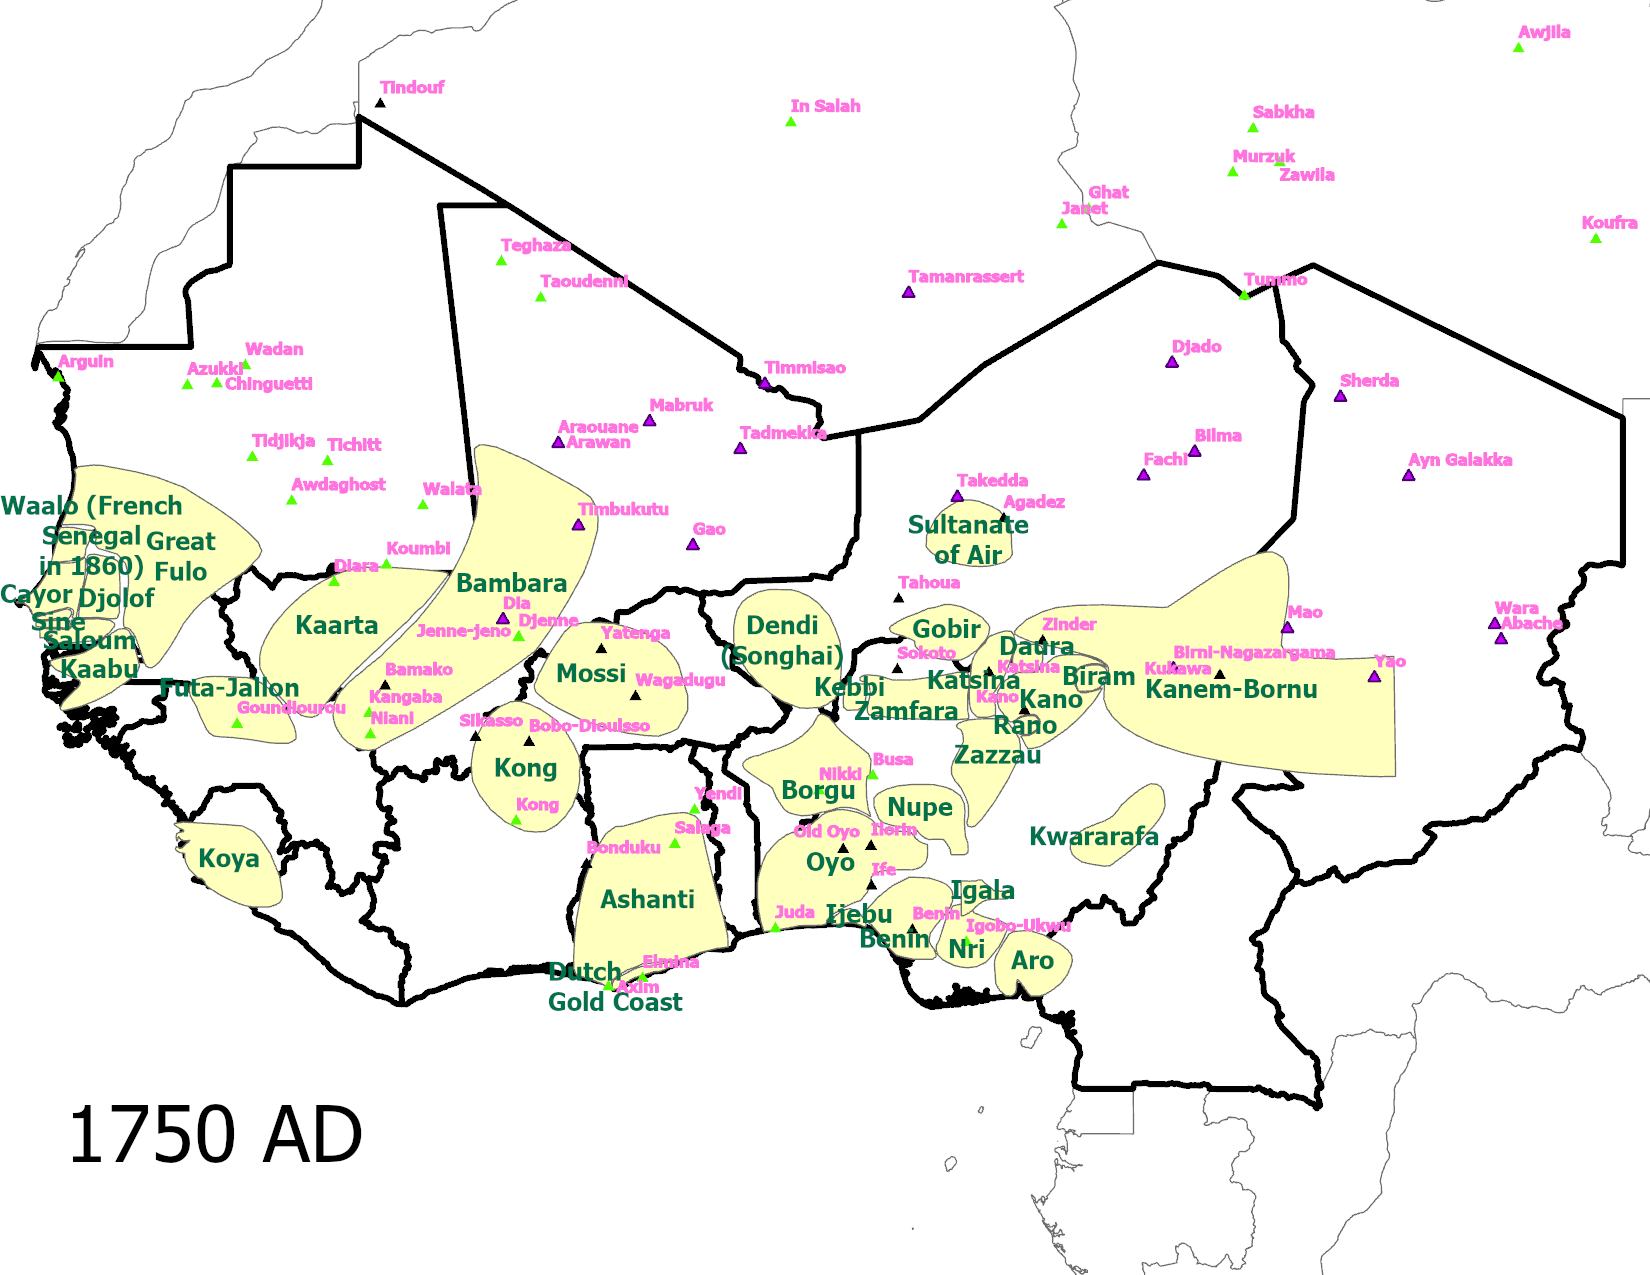
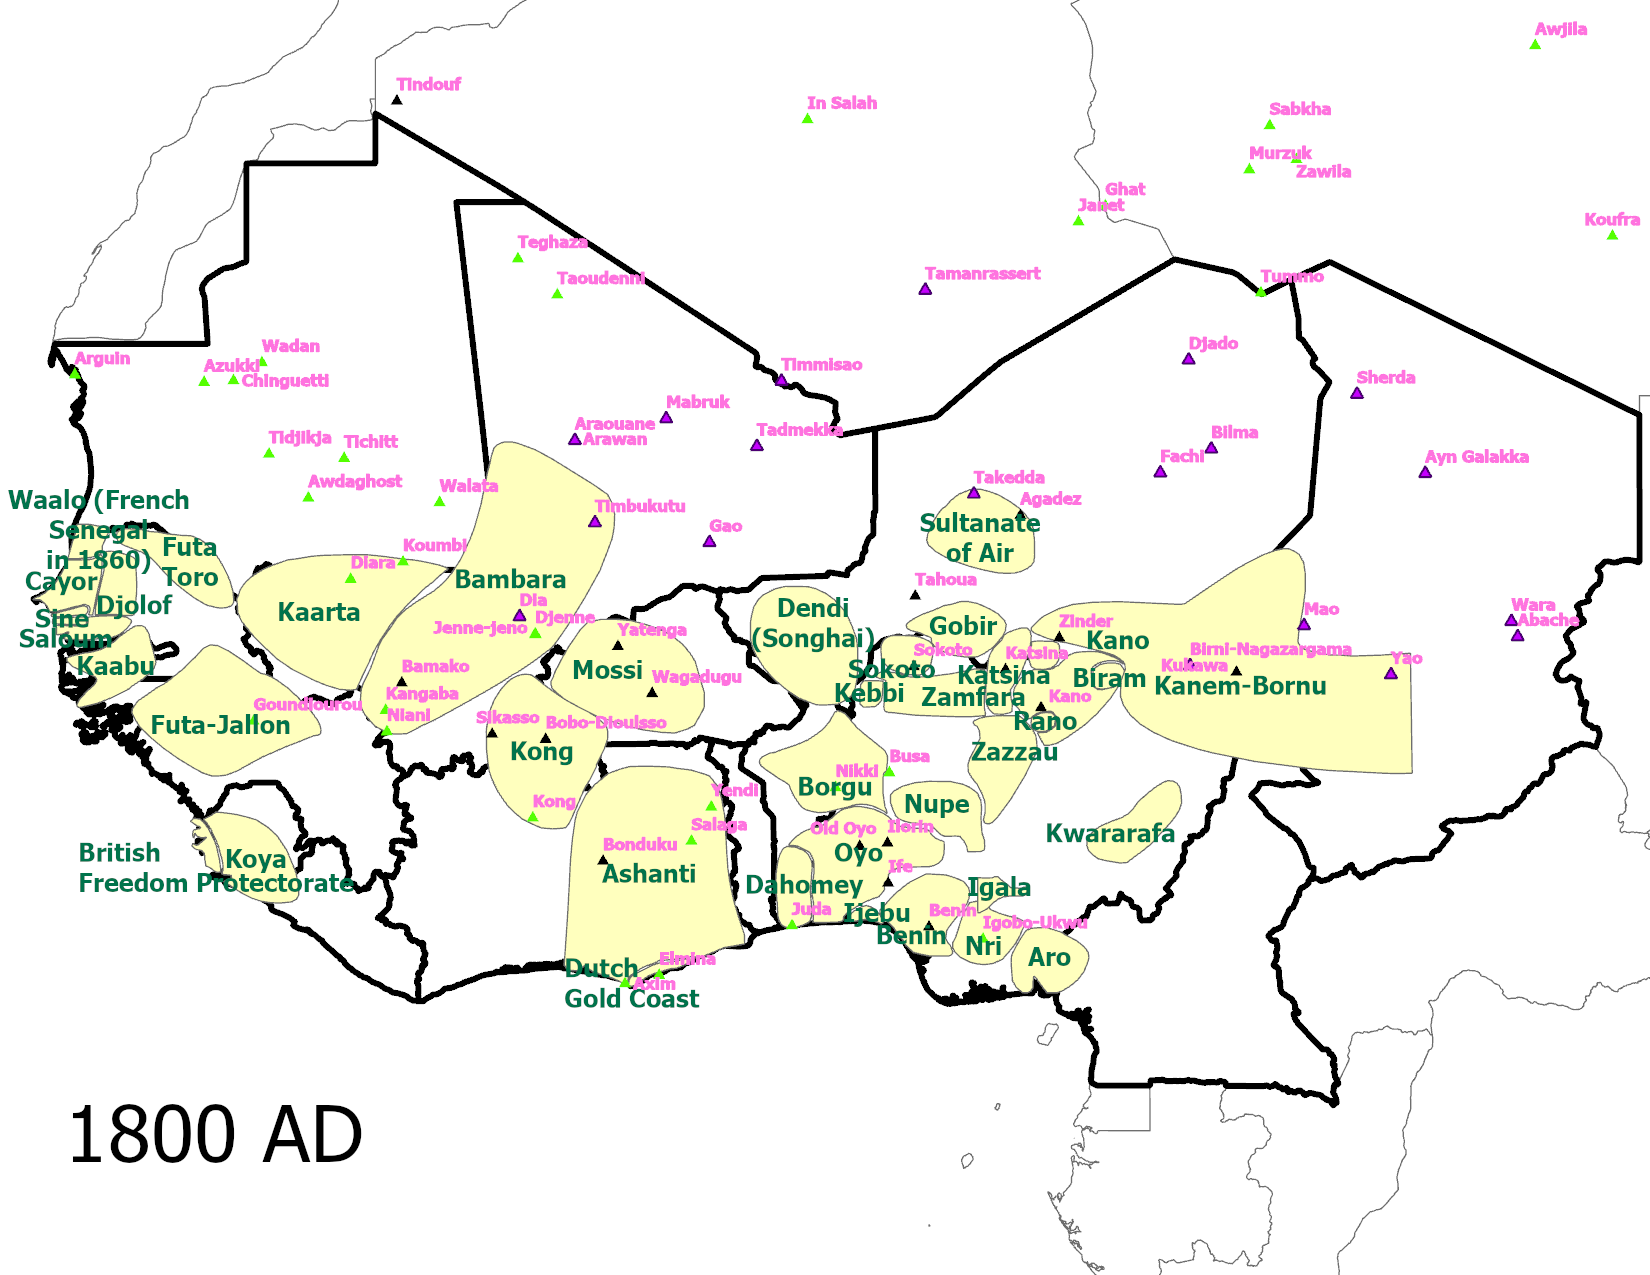
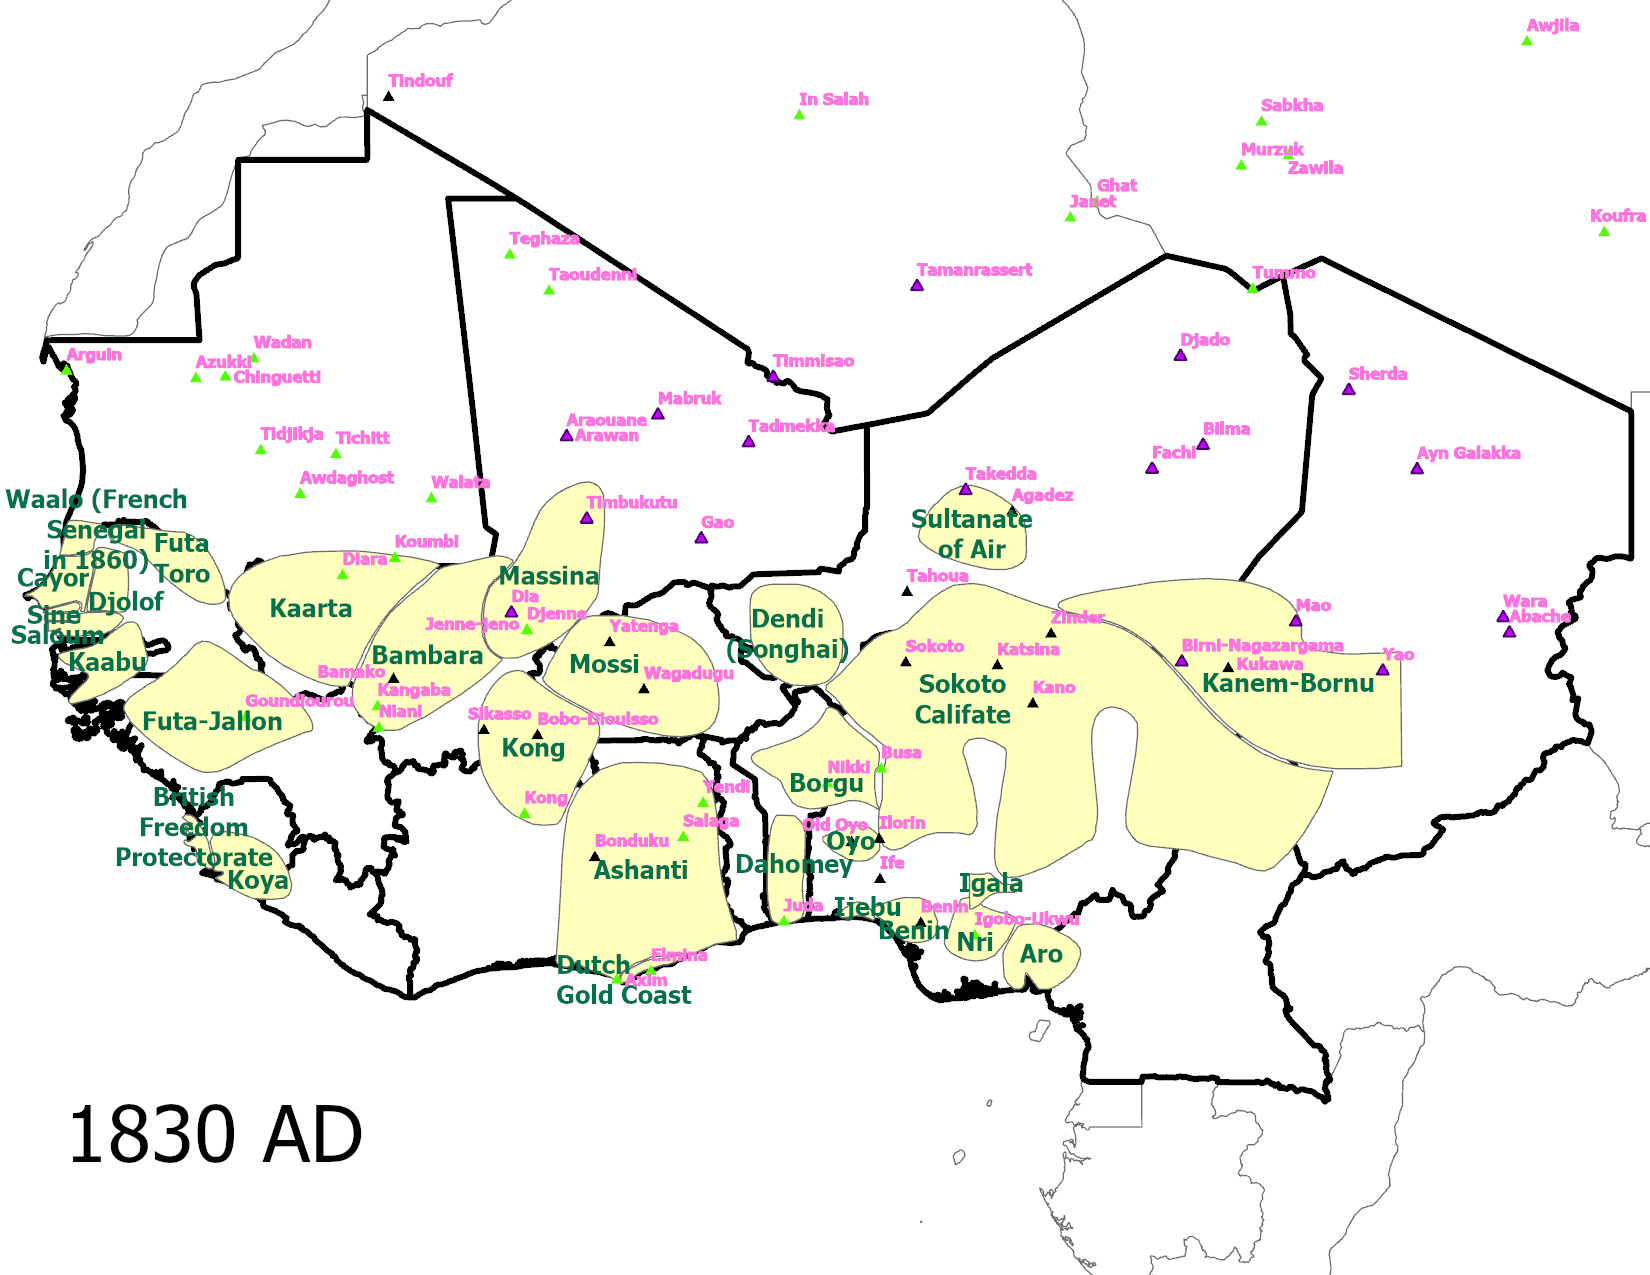
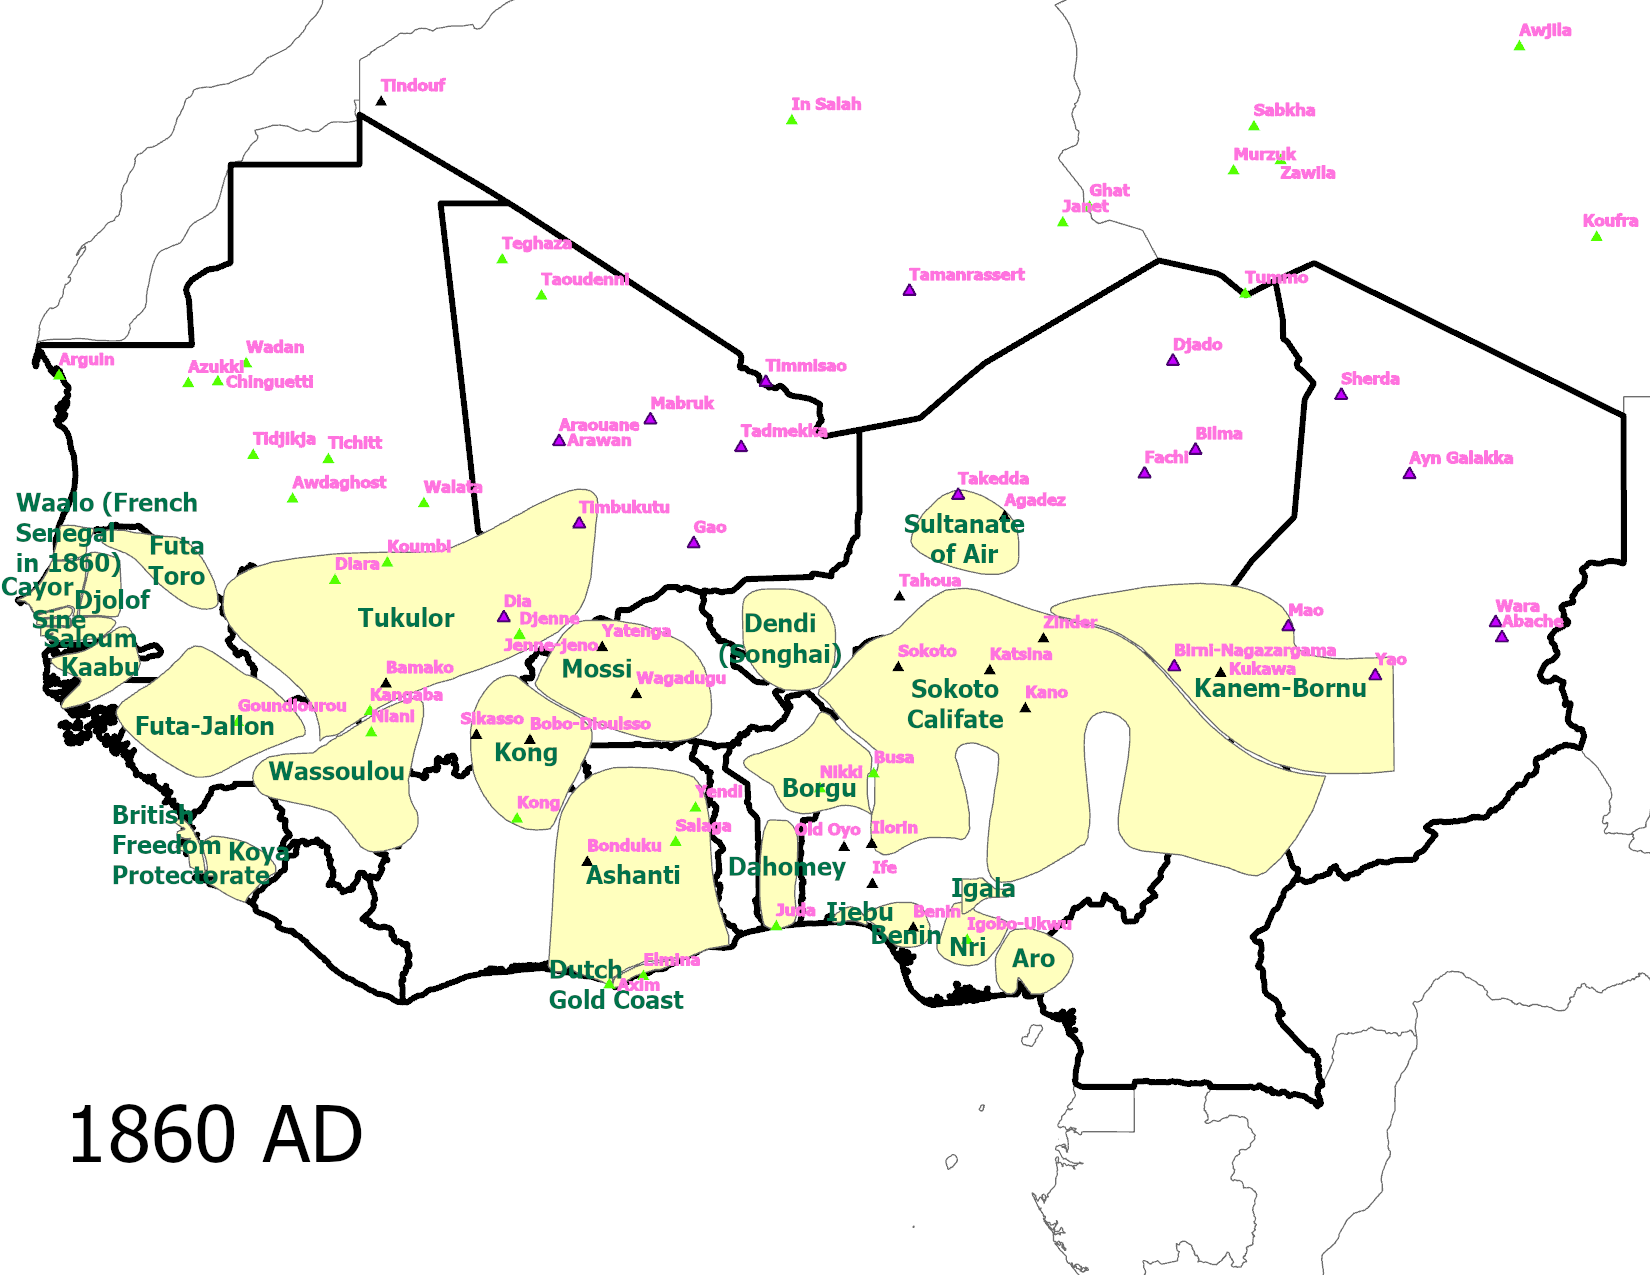
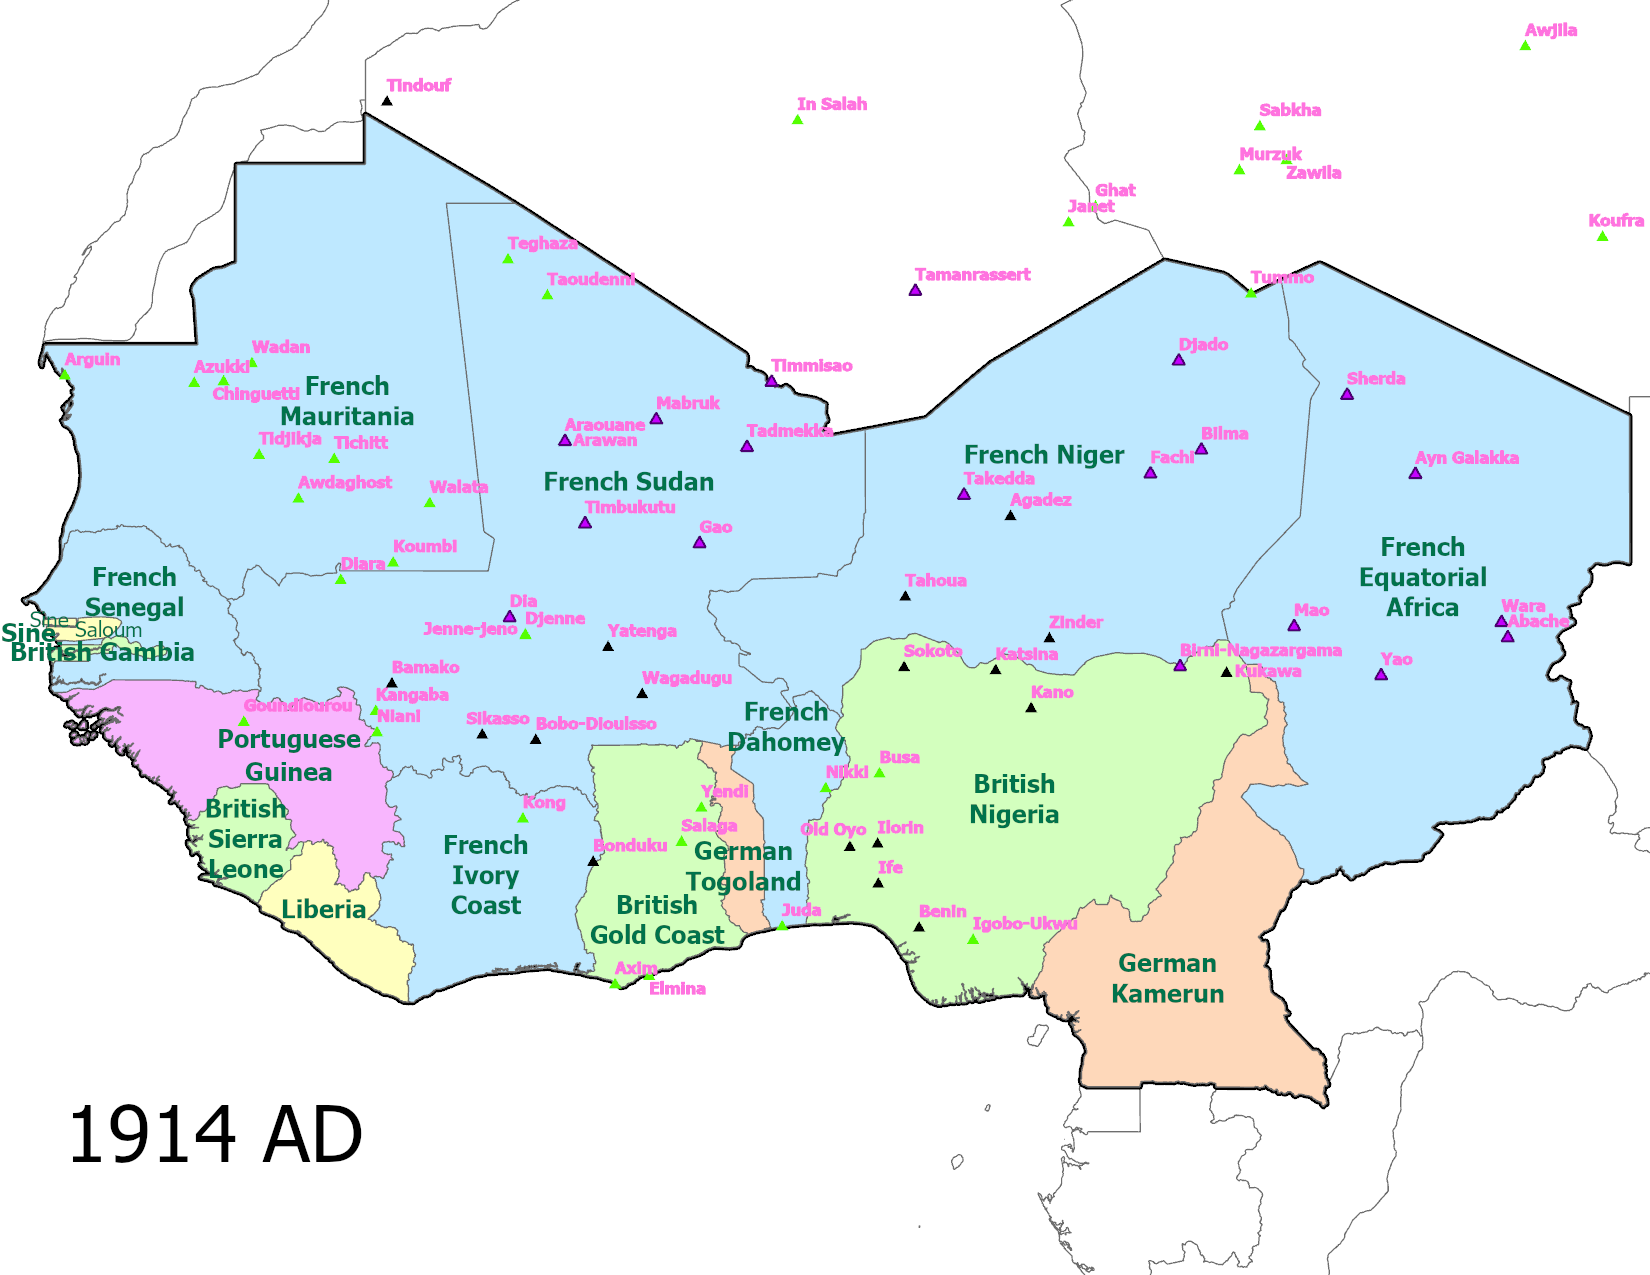
Notes: These maps show the evolution of historical states from 1700 AD to 1914 AD. Yellow regions indicate historical states before 1860 AD. In 1914 AD, the light blue regions indicate the French territory, the light green regions indicate British territory, the light purple region indicates Portuguese territory, the light orange regions indicate German territory, and the yellow regions indicate independent states. We digitize the maps from Cultures of West Africa. The purple triangles indicate pre-colonial inland trade points with less than 100,000 population today, the yellow green triangles indicate pre-colonial coastal trade points with less than 100,000 population today, and the black triangles indicate the other pre-colonial trade points.
Appendix C Additional Data Sources and Variables
Pre-Colonial Variables
Cities in 1400. Indicator for whether a city with a population
larger than 200,000 in 1400 was in a given area. Source: \citetAppChandler1987.
Population in 800. We use the History Database of the Global Environment (HYDE, version 3.1) constructed by \citetAppKBJ2010.
Historical Islamic states. The indicator which takes a value of one if a grid cell locates in historical Islamic states (given by Appendix B), otherwise takes a value of 0. If a grid cell strands in both Islamic states and Non-Islamic states, we assign the state information with larger size in a grid cell.
Jurisdictional hierarchy. We use “Jurisdictional Hierarchy beyond the Local Community” (v33) in Ethnographic Atlas.
This is an ordered variable which indicates 1. “No political authority beyond local community (e.g., autonomous bands and villages),” 2. “One level (e.g., petty chiefdoms),” 3.“Two levels (e.g., larger chiefdoms),” 4.“Three levels (e.g., states),” and 5.“Four levels (e.g., large states).”
Polygamy. We use “Marital composition: monogamy and polygamy” (v9) in Ethnographic Atlas.
This is an categorical variable which indicates 1. “Monogamous,” 2. “Polygynous, with polygyny occasional or limited,” 3.“Polygynous, with polygyny common and preferentially sororal, and co-wives not reported to occupy separate quarters,” 4.“Polygynous, with polygyny common and preferentially sororal, and co-wives typically occupying separate quarters,” 5.“Polygynous, with polygyny general and not reported to be preferentially sororal, and co-wives typically occupying separate quarters,” 6. “Polygynous, with polygyny general and not reported to be preferentially sororal, and co-wives not reported to occupy separate quarters,” and 7.“Polyandrous.”
For our analyses, we use an indicator variable which takes a value of 0 if the categorical variable takes a value of either 0 or 7, otherwise takes a value of 1.
Irrigation. We use “Agriculture: intensity” (v28) in Ethnographic Atlas.
This is an ordered variables which indicates 1. “Complete absence of agriculture,” 2. “Casual agriculture, i.e., the slight or sporadic cultivation of food or other plants incidental to a primary dependence upon other subsistence practices,” 3.“Extensive or shifting cultivation, as where new fields are cleared annually, cultivated for a year or two, and then allowed to revert to forest or brush for a long fallow period,” 4.“Horticulture, i.e., semi-intensive agriculture limited mainly to vegetable gardens or groves of fruit trees rather than the cultivation of field crops,” 5.“Intensive agriculture on permanent fields, utilizing fertilization by compost or animal manure, crop rotation, or other techniques so that fallowing is either unnecessary or is confined to relatively short periods,” and 6.“Intensive cultivation where it is largely dependent upon irrigation.”
For our analyses, we use an indicator variable which takes a value of 1 if the ordered variable takes a value of 6, otherwise takes a value of 0.
Class stratification. We use “Class differentiation: primary” (v66) in Ethnographic Atlas.
This is an categorical variable which indicates 1. “Absence of significant class distinctions among freemen (slavery is treated in EA070), ignoring variations in individual repute achieved through skill, valor, piety, or wisdom,” 2. “Wealth distinctions, based on the possession or distribution of property, present and socially important but not crystallized into distinct and hereditary social classes,” 3.“Elite stratification, in which an elite class derives its superior status from, and perpetuates it through, control over scarce resources, particularly land, and is thereby differentiated from a property-less proletariat or serf class,” 4.“Dual stratification into a hereditary aristocracy and a lower class of ordinary commoners or freemen, where traditionally ascribed noble status is at least as decisive as control over scarce resources,” and 5.“Complex stratification into social classes correlated in large measure with extensive differentiation of occupational statuses.”
For our analyses, we use an ordered variable which takes a value of 0 if the categorical variable takes a value of 1, and takes a value of 1 if the categorical variable takes a value of 1otherwise takes a value of either 2 or 3, otherwise takes a value of 2.
Local headman. We use “Political succession” (v72) in Ethnographic Atlas.
This is an categorical variable which indicates 1. “Patrilineal heir,” 2. “Matrilineal heir,” 3.“Nonhereditary succession through appointment by some higher authority,” 4.“Nonhereditary succession on the basis primarily of seniority or age,” 5.“Nonhereditary succession through influence, e.g., of wealth or social status,” 6.“Nonhereditary succession through election or some other mode of formal consensus,” 7.“Nonhereditary succession through informal consensus,” and 8.“Absence of any office resembling that of a local headman.”
For our analyses, we use an indicator variable which takes a value of 1 if the categorical variable takes a value of either 6 or 7, otherwise takes a value of 0.
Colonial Variables
Atlantic slave exports. The logarithm of one plus the number of the Atlantic slave trade exports at ethnic homeland in the 1800s.
Source: \citetAppNunn2008.
Distance to a mission station. The logarithm of one plus distance (km) to the nearest mission station from a centroid of each grid cell.
Source: \citetAppNunn2010.
Distance to a colonial railway. The logarithm of one plus distance (km) to the nearest colonial railway from a centroid of each grid cell.
Source: \citetAppNW2011.
Geographical Variables
Distance to water sources today. The minimum distance to either river or lakes from a unit of analysis. The source of river centerlines come from Natural Earth. “Rivers + lake centerlines” version4.1.0. and lakes from HydroLAKES.
Elevation. Mean elevation within a given area in kilometers. Source: Four Tiles: “GT30W020N40,” “GT30E020N40,” “GT30W020S10,” and “GT30E020S10” from GTOPO30.
Agricultural suitability. Mean land quality for agriculture within a given area. Source: \citetAppMichalopoulos2012.
Caloric suitability. The average caloric suitability (1000 Cal) within the unit of analysis. Source: \citetAppGO2015, \citetAppGO2016 and \citetAppGOS2017.
Ecological diversity. Ecological diversity constructed by \citetAppFenske2014.
Temperature. The average temperature within the unit of analysis for the period 2001-2017, calculated based on Terrestrial Air Temperature: 1900-2017 Gridded Monthly Time Series (V 5.01) from \citetAppMW2018.
Precipitation. The average precipitation within the unit of analysis for the period 2001-2017, calculated based on Terrestrial Precipitation: 1900-2017 Gridded Monthly Time Series (V 5.01) from \citetAppMW2018.
Malaria suitability. Mean malaria suitability index within a given area. Source: \citetAppSKMSMS2004
Distance to the coast. The logarithm of one plus distance (km) to the nearest coastal point from a centroid of each grid cell. Source: Natural Earth. “Coastline” version 4.1.0.
Ruggedness. Index of terrain ruggedness as constructed by \citetAppNP2012 for cells at 30 arc-second resolution. The variable used in the analysis is the average value of the index within the unit of analysis.
Contemporary Variables
Ethnologue.
World Language Mapping System (WLMS) Database maps the location of ethnic groups’ homelands.
It maps the traditional homelands which correspond to the ones covered by the 15th edition of \citetAppEthnologue2005.
However, the WLMS does not map in the following: populations away from their homelands (e.g., in cities, refugee populations, etc.), immigrant languages, ethnic groups of unknown location, widespread ethnicities (i.e., groups whose boundaries are essentially identical to a countries boundary) and extinct languages.
We match between Ethnologue and WRD based on the unique Ethnologue identifier for each ethnic group within a country.303030
There are fifteen groups which cannot be matched to WRD.
For the ethnic groups, we utilize the percent of each religion from Joshua Project.
Muslims in 2005.
World Religion Database (WRD) provides us with fractions of Muslims at ethnic group level within a country in 2005.
Population. WorldPop datasets provide approximately 100m100m cell-level estimated population density (\citealtAppTatem2017).
See \citetAppSGLT2015 and \citetAppLloyd2019 for the technical detail for constructing this dataset. From this raw data, we construct approximately 1km1km cell-level estimated population density in the both countries.
Alternative conflict events data. Additional data on conflict comes from Uppsala Conflict Data Program Georeferenced Event Dataset Version 21.1 (UCDP GED) (\citealtAppCS2013; \citealtAppPTO2020; \citealtAppPettersson_etal2021; \citealtAppSM2013). The UCDP GED codes geo-locations of events, times of events, and names of conflict actors which engage in each event, covering the period between 1989 and 2020.
We follow a similar strategy as what we did with the ACLED to pick jihadist organizations.
Afrobarometer
We use respondents in West African countries available in rounds 6 and 7.
The West African countries include Benin, Burkina Faso, Cabo Verde, Cameroon, Côte d’Ivoire, Gambia (round 7 only), Ghana, Guinea, Liberia, Mali, Niger, Nigeria, Senegal, Sierra Leone and Togo.
Round 6 was surveyed between 2014 and 2015.
Round 7 was surveyed between 2016 and 2018.
Age.
A respondent’s age. Survey questions: Q1 (rounds 6 and 7).
Female.
A dummy for whether a respondent is female.
Survey questions: Q101 (rounds 6 and 7).
Education.
The ten categories of educational attainment.
They are classified as “no formal schooling,” “Informal schooling only,” “Some primary schooling,” “Primary school completed,” “Some secondary school/high school,” “Secondary school completed/high school,” “Post-secondary qualifications, not univ,” “Some university,” “University completed,” or “Post-graduate.”
Survey questions: Q97 (rounds 6 and 7).
Living conditions.
The five categories of present living conditions.
They are classified as “Very Bad,” “Fairly bad,” “Neither good nor bad,” “Fairly good,” or “Very good.”
Survey questions: Q4B (rounds 6 and 7).
Religion.
A respondent’s religion was asked in Q98A (round 6) and Q98 (round 7).
They are condensed as “Christian,” “Muslim,” or “Other” in the variable “RELIG_COND” of rounds 6 and 7.
We use the variable to restrict the sample to Muslim respondents.
Neighbors from different religion.
A respondent was asked whether she would like having people of a different religion as neighbors, dislike it, or not care.
A respondent chose one of the following answers: 1.“Strongly dislike,” 2.“Somewhat dislike,” 3.“Would not care,” 4.“Somewhat like,” or 5.“Strongly like.” We use the variable which takes the values of 1 through 5 as a dependent variable.
Survey questions: Q89A (round 6) and Q87A (round 7).
In Table 10, we re-scaled the variable to the following for the clearer interpretation of the results: 1.“Strongly like,” 2.“Somewhat like,” 3.“Would not care,” 4.“Somewhat dislike,” and 5.“Strongly like.”
Governed by religious law.
A respondent was asked which of the following statements is closest to her view:
“Our country should be governed primarily by religious law” (Statement 1)
or “Our country should be governed only by civil law” (Statement 2).
A respondent chose one of the following answers: 1.“Agree very strongly with statement 2,” 2.“Agree with statement 2,” 3.“Agree with neither,” 4.“Agree with statement 1,” or 5.“Agree very strongly with statement 1.”
We use the variable which takes the values of 1 through 5 as a dependent variable.
Survey question: Q65 (round 7).
Equal opportunities to education.
A respondent was asked whether she disagrees or agrees with the following statement:
“In our country today, girls and boys have equal opportunities to get an education.”
A respondent chose one of the following answers: 1.“Strongly disagree,” 2.“Disagree,” 3. “Neither agree nor disagree,” 4.“Agree,” or 5.“Strongly agree.”
We use the variable which takes the values of 1 through 5 as a dependent variable.
Survey question: Q77A (round 7).
In Table 10, we re-scaled the variable to the following for the clearer interpretation of the results: 1.“Strongly agree,” 2.“Agree,” 3.“Neither agree nor disagree,” 4.“Disagree,” and 5.“Strongly disagree.”
Appendix D Appendix for Heterogeneity across Jihadist Organizations
Recall that Figure A.3 shows violence events by jihadist groups in West Africa.
Table D.1 lists groups affiliated with Al Qaeda and the Islamic State, the two largest factions under global competition.
Drawing directly from Mapping Millitants Project (MMP), we list stated ideologies and goals of major jihadist organizations below.
Al Qaeda.
“Al Qaeda aims to rid the Muslim world of Western influence, to destroy Israel, and to create an Islamic caliphate stretching from Spain to Indonesia that imposes strict Sunni interpretation of Shariah law.”
The Islamic State.
“The Islamic State’s ideology is rooted in Salafism—a fundamentalist movement within Sunni Islam—and Jihadism—a modern interpretation of the Islamic concept of struggle, often used in the context of defensive warfare…Salafis believe the most pure, virtuous form of Islam was practiced by the early generation of Muslims (known as Salaf) who lived around the lifetime of the prophet Muhammed…Since its inception, the Islamic State has sought to establish an Islamic caliphate based on its Salafi philosophy and fundamentalist interpretation of Shariah law.”
AQIM: Al Qaeda in the Islamic Maghreb.
“The group’s main focus was the overthrow of the Algerian government and establishment of an Islamic caliphate in the Maghreb that would enforce Shariah law…expanded this goal in the early 2000s to include the overthrow of the governments of Mauritania, Morocco, Tunisia, and Mali, and the reclamation of lost Islamic lands in southern Spain.”
Ansar Dine.
“Ansar Dine was a Salafi-jihadist group that aimed to establish Shariah law across Mali and targeted western civilians, especially peacekeepers in Mali.
Ansar Dine’s ideology closely mirrored that of AQIM, which came to view Ansar Dine as its southern arm in Mali. Unlike the MNLA, Ansar Dine did not seek independence for northern Mali but rather a country unified under Islam.”
Ansaroul Islam.
“Ansaroul Islam’s main goal is allegedly to reconquer and rebuild Djeelgodji, an ancient Fulani empire that disappeared after French colonization in the late 19th century…Ansaroul Islam interacts closely with AQ front groups and affiliates in North Africa; Ansaroul Islam activity has purportedly created a front allowing AQ to achieve its primary aim—inspiring Muslims globally to attack enemies of Islam—in Burkina Faso.”
JNIM: Group for Support of Islam and Muslims.
“The group’s goals and ideological basis are closely aligned with those of AQIM, and it seeks to build up a Salafi-Islamist state while restoring the caliphate.
The merger of various AQ-affiliates into the JNIM was consistent with AQ’s new operational focus on “unity” as a means to fully and effectively implement Shariah law in areas where the jihadists previously had not possessed complete control.”
MUJAO: Movement for Unity and Jihad in West Africa.
“MUJAO’s stated goal was to engage in and encourage the spread of jihad in West Africa, as well as establish Shariah law in the region…MUJAO’s ideology and goals closely mirrored those of AQ and AQIM, the group it broke off from.”
Al Mulathamun Battalion.
“Despite its split from AQIM, the AMB claimed to remain loyal to the ideology and command of Al Qaeda Central.
The militant group aimed to spread jihad through all of the Sahara and impose Shariah law in North Africa.”
Islamic State in the Greater Sahara.
“The ISGS draws much of its strategic direction and ideological goals from the IS. As an affiliate of the Islamic State, the ISGS has pledged loyalty to the IS’s goal of restoring the Islamic caliphate.”
Boko Haram.
“Boko Haram, which translates roughly to “Western education is forbidden,” is a Sunni Islamist militant organization that opposes Western education and influence in Nigeria.
Its founder Mohammad Yusuf…originally followed and preached the Izala doctrine, which advocates the establishment of a Muslim society that follows the lessons of its pious ancestors.
After his initial radicalization in 2002, Yusuf’s ideology evolved and radicalized into a philosophy that rejected all Western and secular aspects of Nigerian society.
Boko Haram originally advocated a doctrine of withdrawal from society but did not aim to overthrow the Nigerian government.
Yusuf’s death and increased conflict with the Nigerian government in 2009 sparked the political opposition and violent campaign that Boko Haram became known for.
Under the leadership of Abubakar Shekau and Abu Musab al-Barnawi, the group sought to establish an Islamic caliphate to replace the Nigerian government.”
| Al Qaeda-affiliated groups | IS-affiliated groups |
|---|---|
| AQIM: Al Qaeda in the Islamic Maghreb | Islamic State in West Africa |
| Ansar Dine | Islamic State in the Greater Sahara |
| Ansaroul Islam | |
| JNIM: Group for Support of Islam and Muslims | |
| MUJAO: Movement for Unity and Jihad in West Africa | |
| Katiba Macina | |
| Al Mourabitoune Battalion | |
| GMA: Mourabitounes Group of Azawad | |
| Ansaru | |
| Katiba Salaheddine | |
| MIA: Islamic Movement of Azawad |
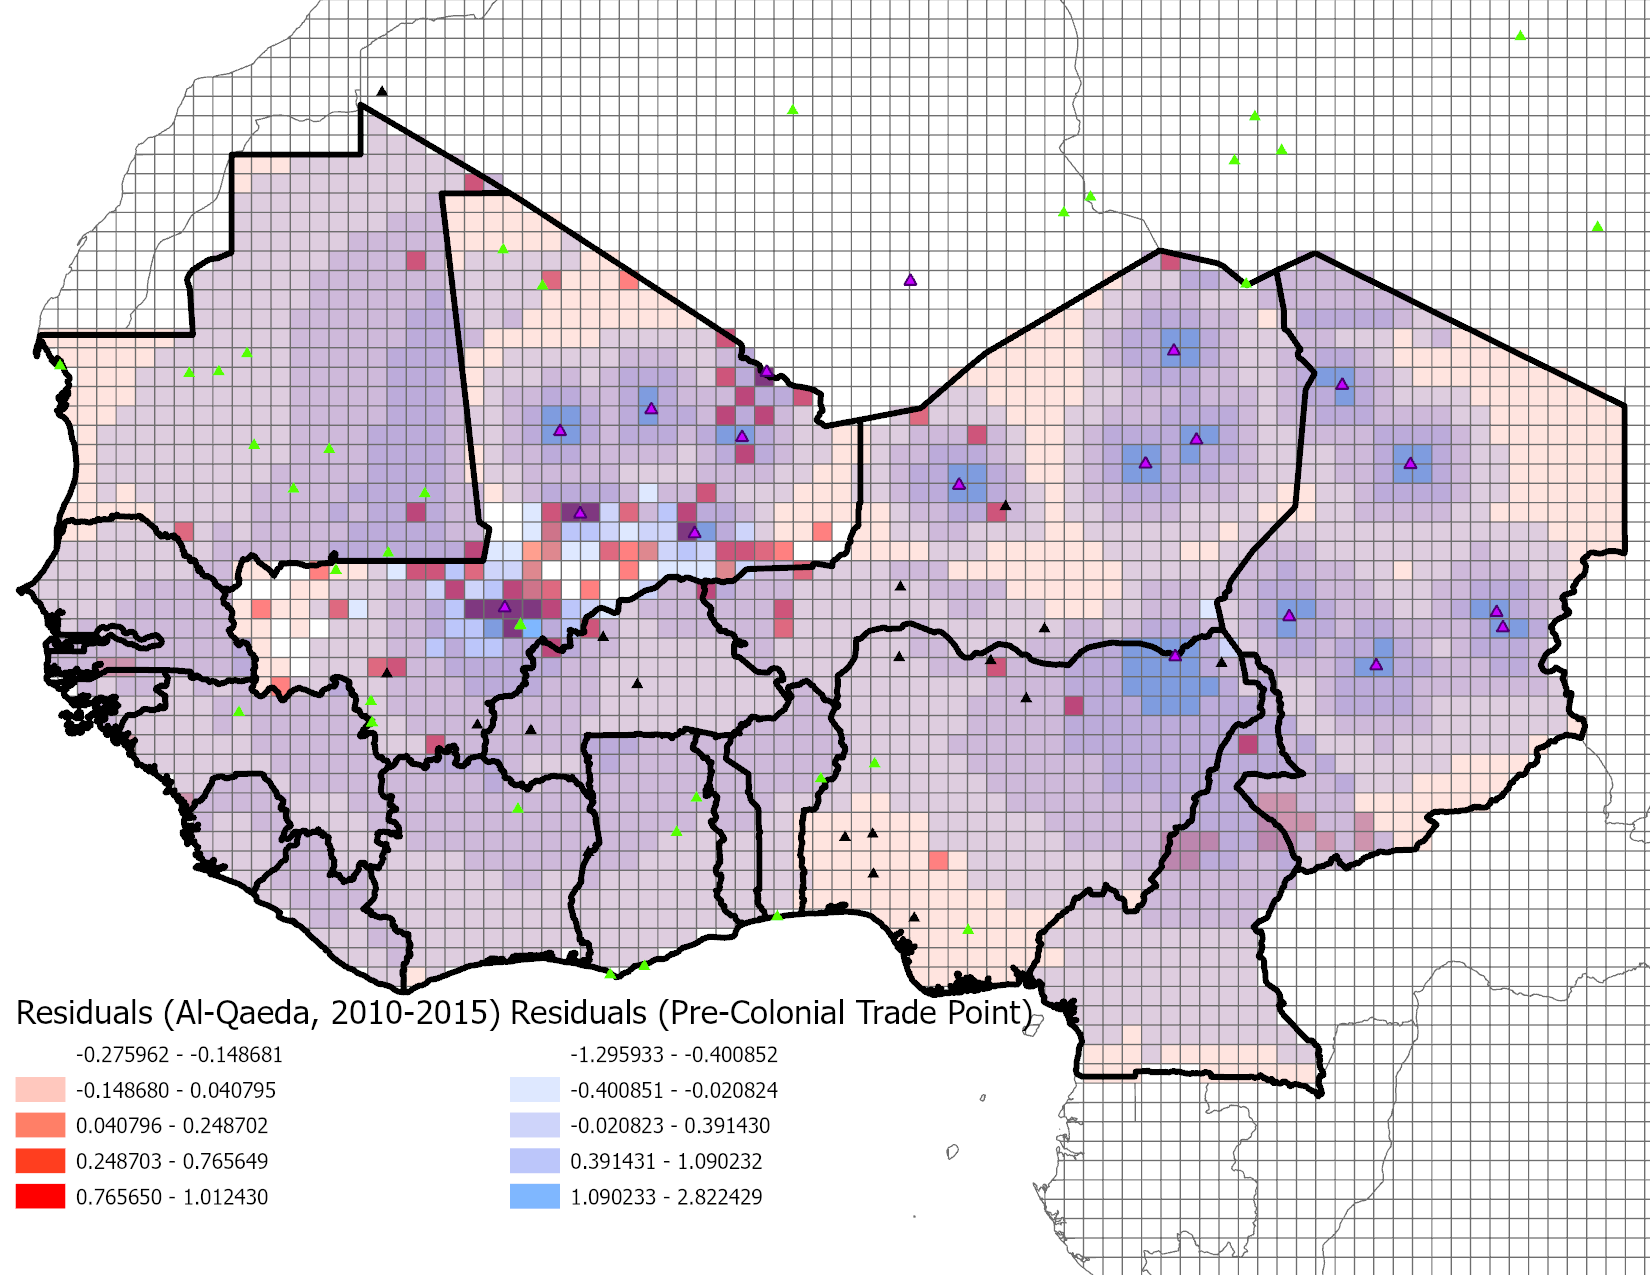
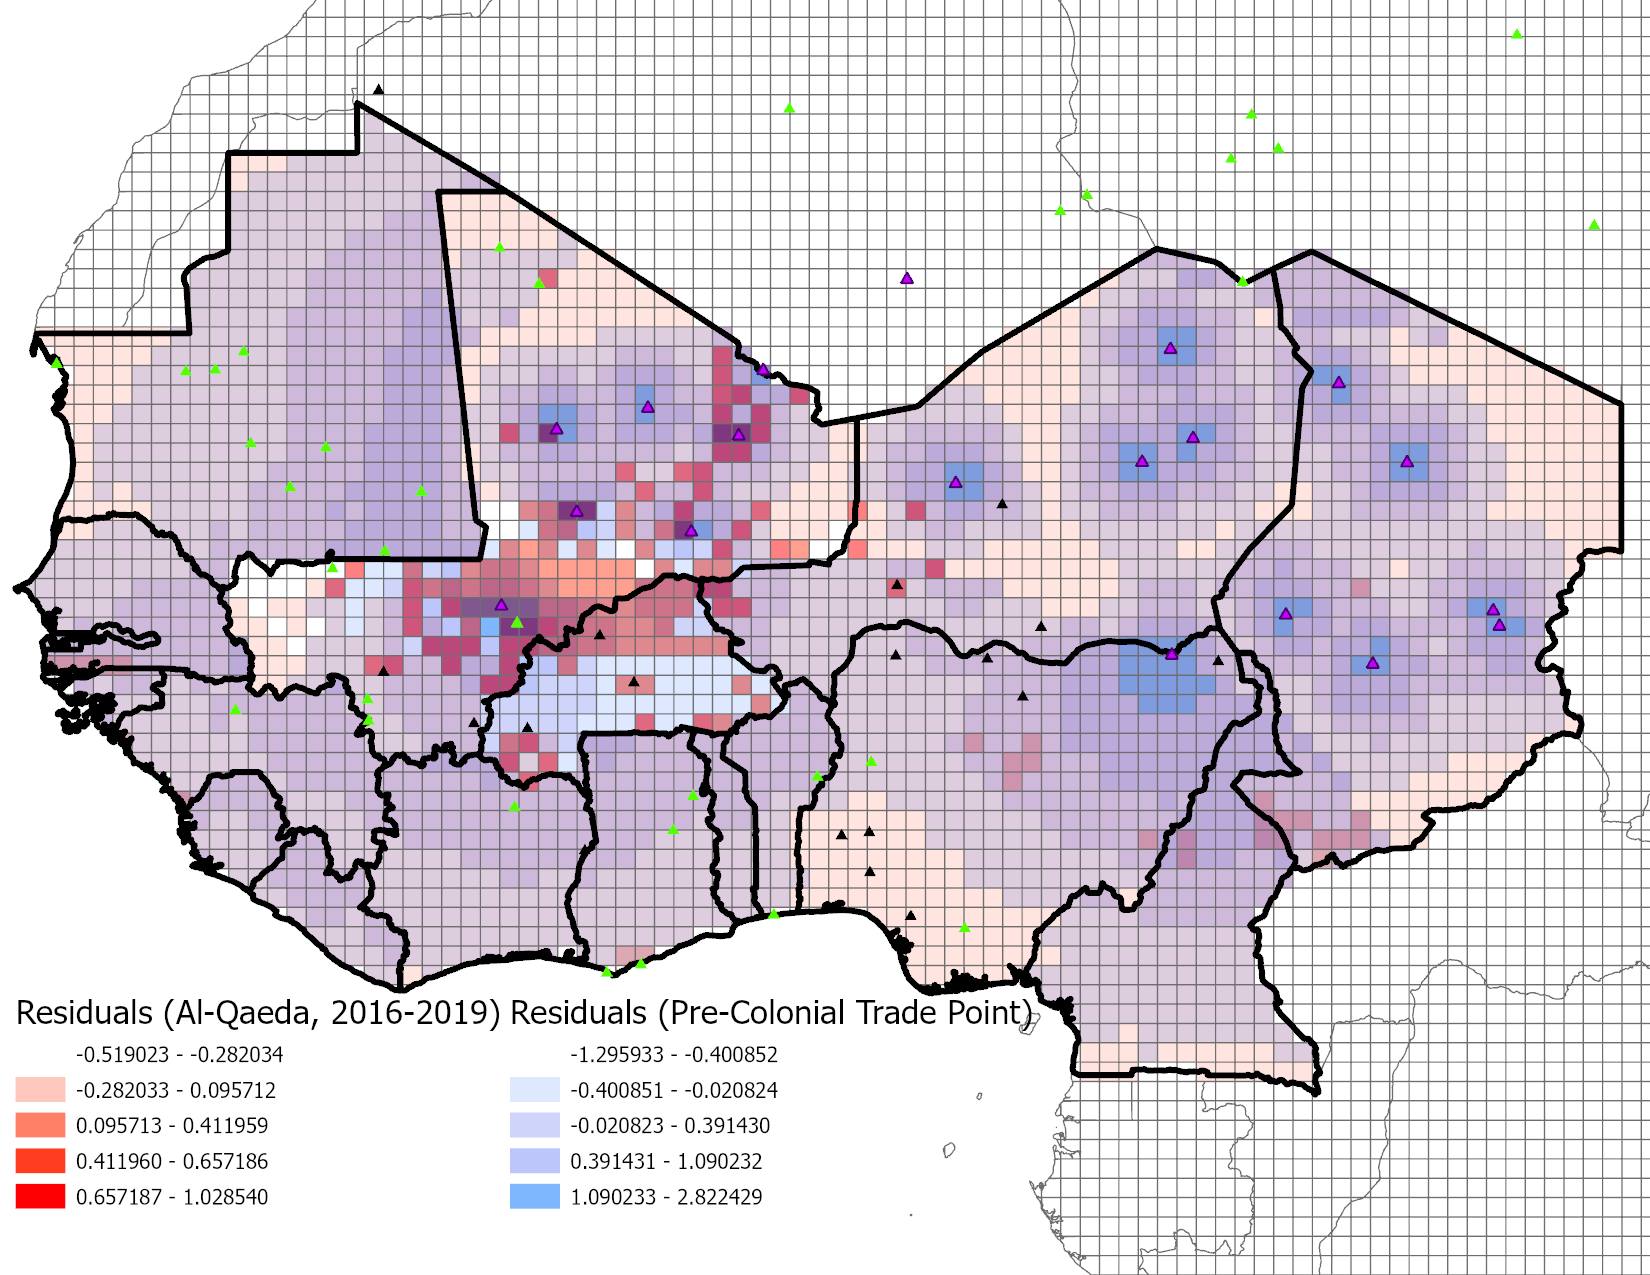
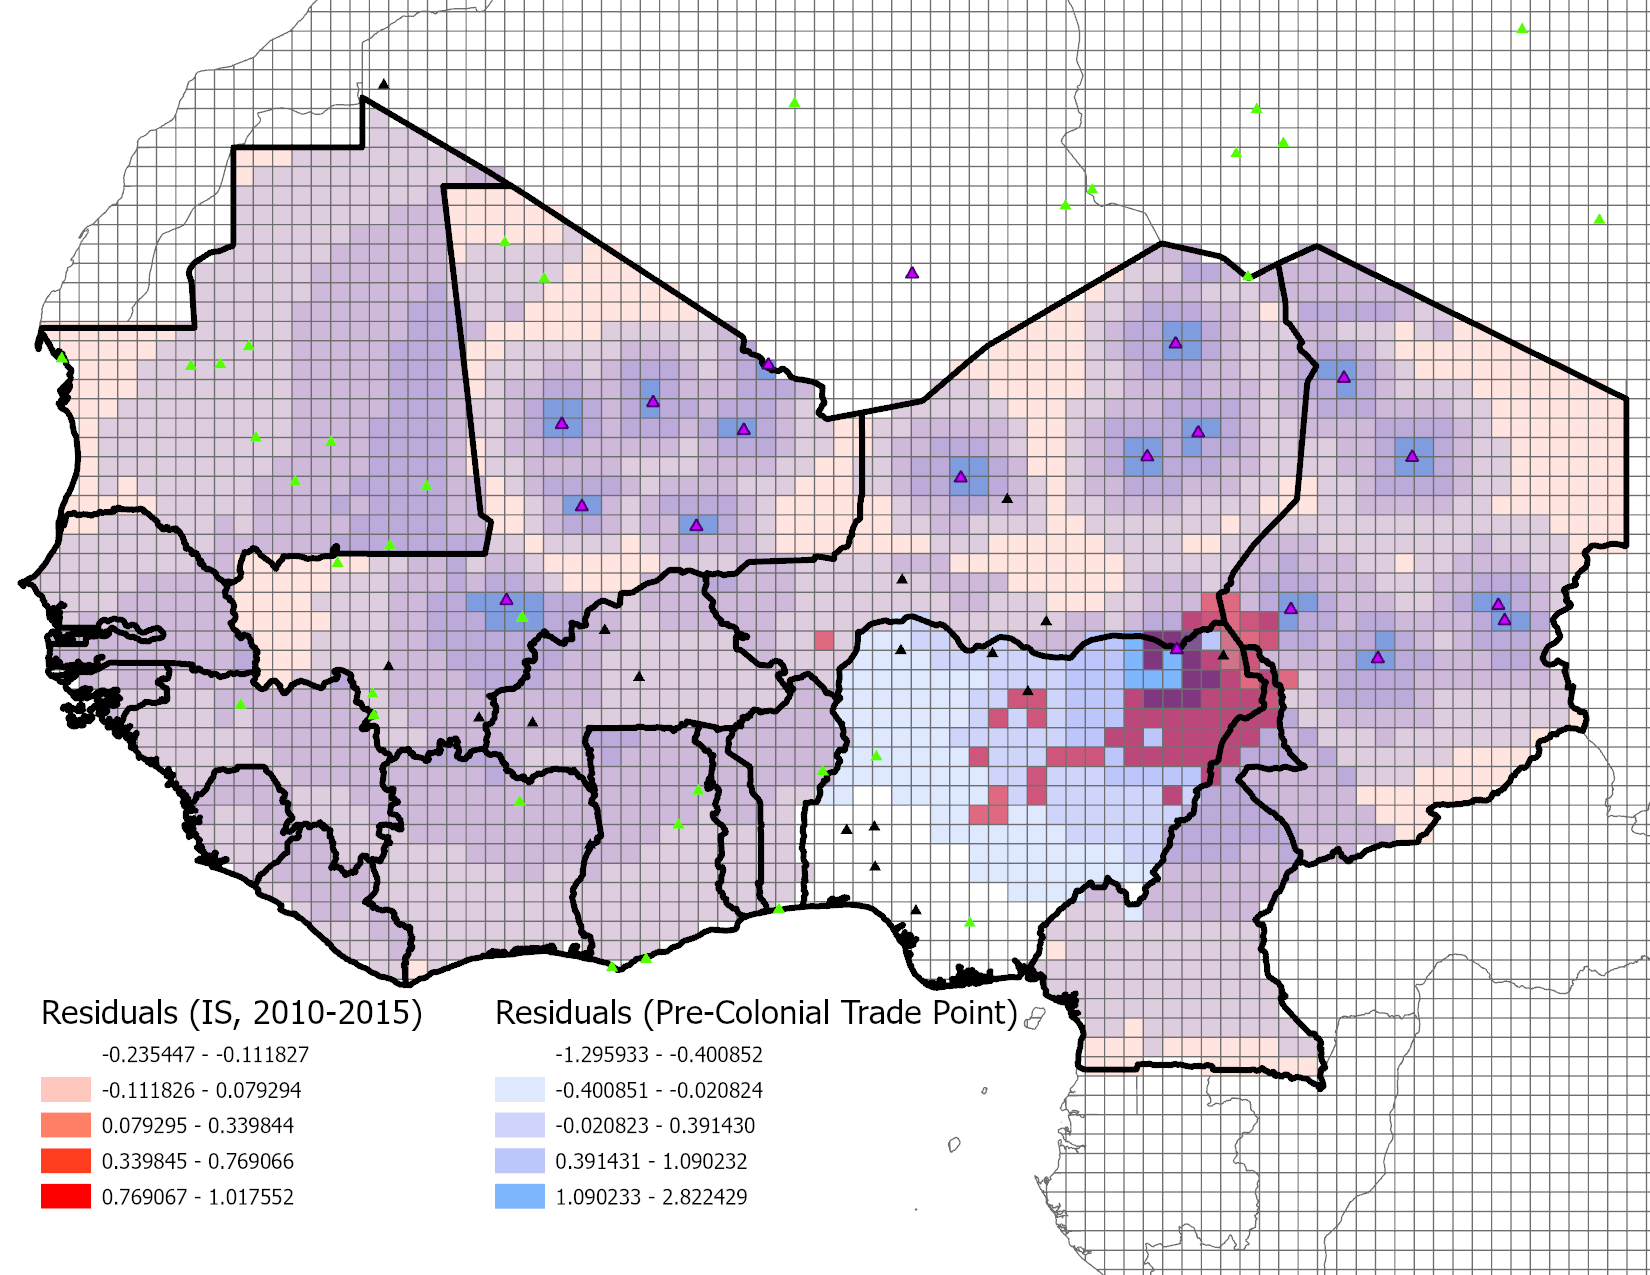
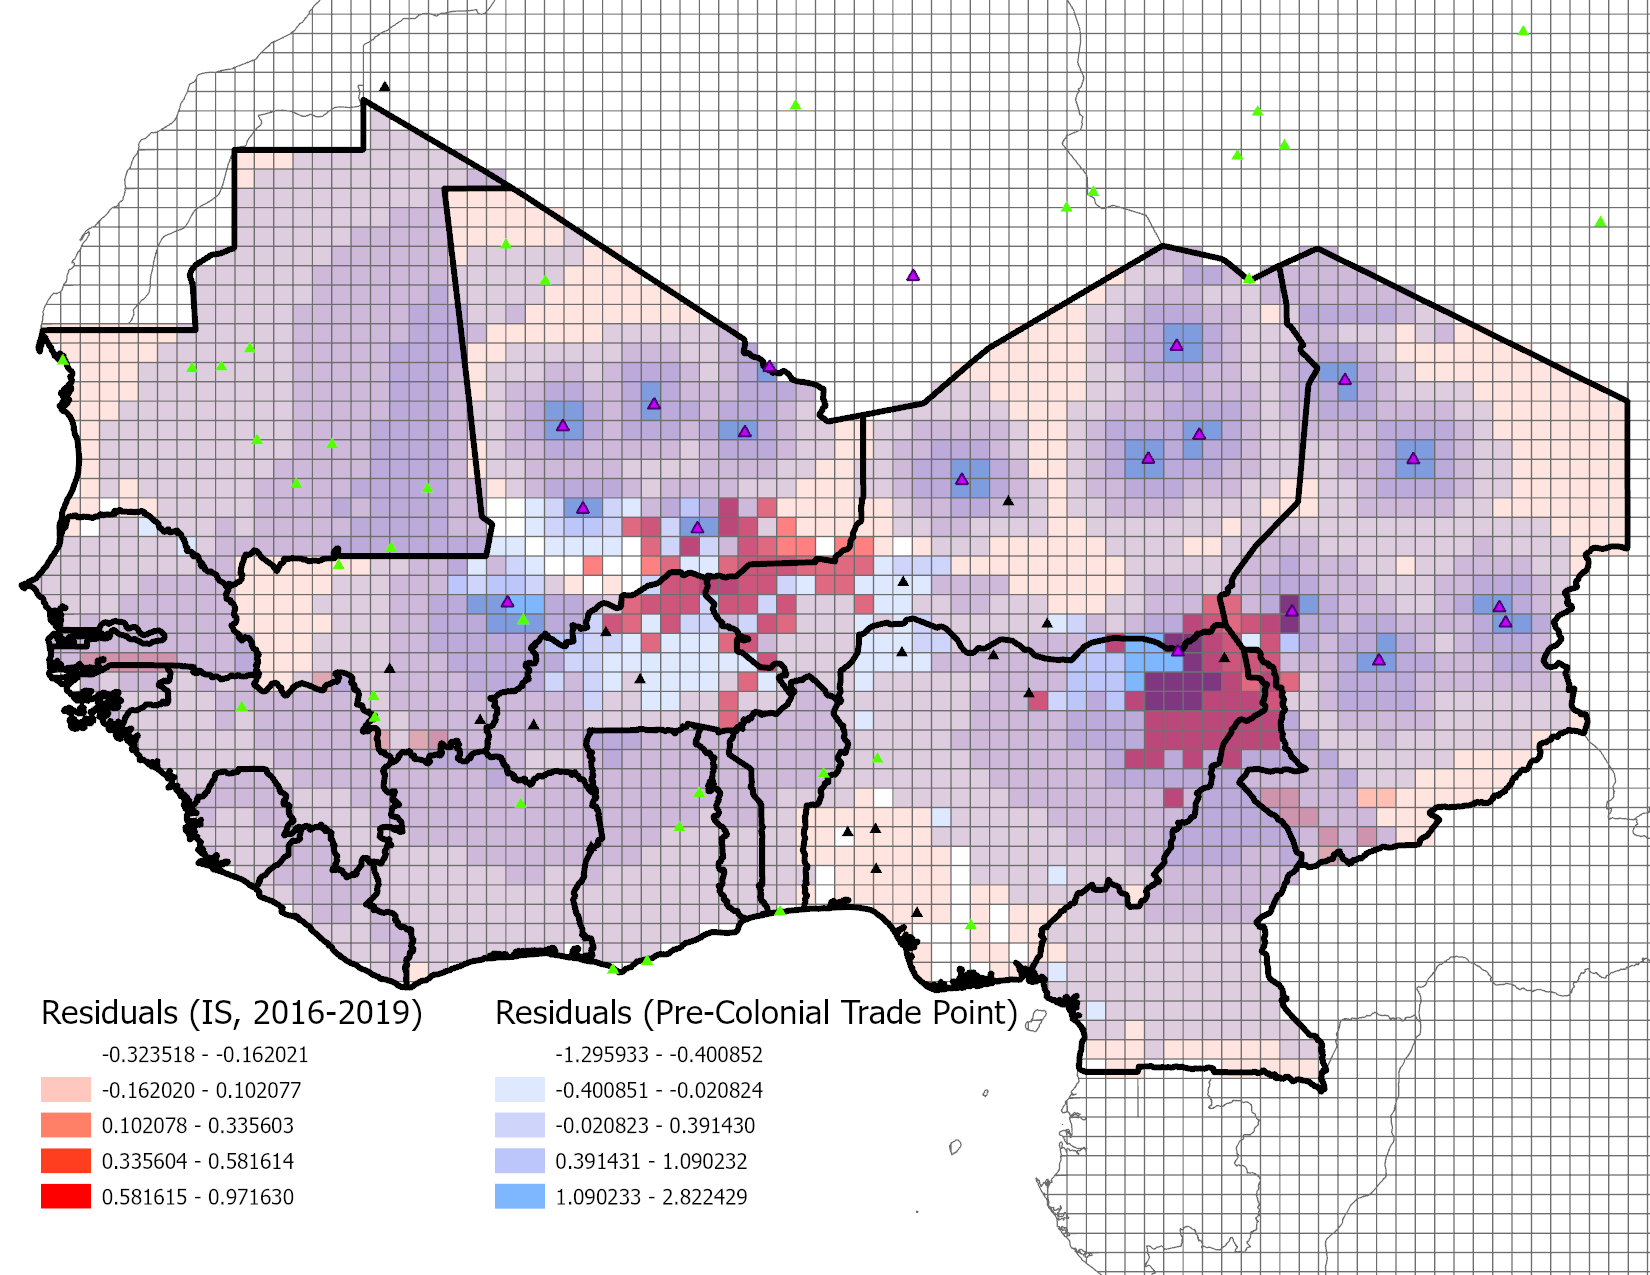
Notes: These maps overlay of two residuals—the red scheme represents residuals from the regression of a dummy variable of jihad on the full controls; the blue scheme indicates negative residuals from the regression of log distance to a pre-colonial inland trade point with less than 100,000 population today on the full controls. The full controls include landlocked dummy, malaria suitability, caloric suitability in post 1500, elevation. ruggedness, and country fixed effects. The purple triangles indicate pre-colonial inland trade points with less than 100,000 population today, the yellow green triangles indicate pre-colonial coastal trade points with less than 100,000 population today, and the black triangles indicate the other pre-colonial trade points. The color of cells where high residuals overlap turns purple (a mix of red and blue).
(A) Log(Distance) (1) (2) (3) (4) (5) (6) (7) (8) All 2001-09 2010-15 2016-19 All 2001-09 2010-15 2016-19 Log (Distance to a landlocked trade point ( 100,000)) 0.251 -0.740∗∗∗ 0.559∗∗∗ -0.204 (0.193) (0.157) (0.185) (0.143) Log (Distance to a landlocked trade route up to 1800) 0.189 -0.555∗∗∗ 0.420∗∗∗ -0.153 (0.140) (0.144) (0.123) (0.105) Log (Distance to a lake/river today) 0.0587∗∗ -0.0115 0.0167 0.0751∗∗∗ 0.0592∗∗ -0.0129 0.0178 0.0747∗∗∗ (0.0283) (0.0304) (0.0248) (0.0283) (0.0295) (0.0313) (0.0255) (0.0274) Observations 2616 2616 2616 2616 2616 2616 2616 2616 Mean (Dep. Var.) 5.155 5.938 5.524 5.856 5.155 5.938 5.524 5.856 SD (Dep. Var.) 0.984 0.804 0.884 1.201 0.984 0.804 0.884 1.201 (B) Onset (1) (2) (3) (4) (5) (6) (7) (8) All 2001-09 2010-15 2016-19 All 2001-09 2010-15 2016-19 Log (Distance to a landlocked trade point ( 100,000)) -0.0550 0.0198∗∗ -0.0480 -0.0569 (0.0421) (0.00918) (0.0316) (0.0410) Log (Distance to a landlocked trade route up to 1800) -0.0413 0.0149∗∗ -0.0360 -0.0427 (0.0339) (0.00715) (0.0252) (0.0334) Log (Distance to a lake/river today) -0.0168∗∗ 0.00405 -0.0139∗∗ -0.0202∗∗∗ -0.0169∗∗ 0.00408 -0.0140∗∗ -0.0203∗∗∗ (0.00778) (0.00262) (0.00614) (0.00735) (0.00819) (0.00263) (0.00642) (0.00782) Observations 2616 2616 2616 2616 2616 2616 2616 2616 Mean (Dep. Var.) 0.069 0.009 0.027 0.053 0.069 0.009 0.027 0.053 SD (Dep. Var.) 0.253 0.093 0.162 0.224 0.253 0.093 0.162 0.224 (C) Intensity (1) (2) (3) (4) (5) (6) (7) (8) All 2001-09 2010-15 2016-19 All 2001-09 2010-15 2016-19 Log (Distance to a landlocked trade point ( 100,000)) -0.144 0.0109 -0.0493 -0.139 (0.0984) (0.0110) (0.0461) (0.0926) Log (Distance to a landlocked trade route up to 1800) -0.108 0.00821 -0.0370 -0.104 (0.0799) (0.00834) (0.0362) (0.0754) Log (Distance to a lake/river today) -0.0328∗∗ 0.00433∗ -0.0160∗ -0.0312∗∗ -0.0331∗∗ 0.00435∗ -0.0161∗ -0.0314∗∗ (0.0152) (0.00231) (0.00817) (0.0136) (0.0164) (0.00230) (0.00857) (0.0147) Observations 2616 2616 2616 2616 2616 2616 2616 2616 Mean (Dep. Var.) 0.104 0.008 0.035 0.080 0.104 0.008 0.035 0.080 SD (Dep. Var.) 0.451 0.085 0.245 0.391 0.451 0.085 0.245 0.391 Country FE Yes Yes Yes Yes Yes Yes Yes Yes Geographic Controls Yes Yes Yes Yes Yes Yes Yes Yes • Notes: All regressions are estimated using IV with logarithm of one plus distance (km) to the nearest ancient lake as an instrument. The unit of observation is a grid cell (about 55km × 55km). The dependent variables are (A) logarithm of one plus distance (km) to the nearest jihad during a period given in each column, (B) dummy variables which take a value of 1 if jihad occurred during a period given in each column, otherwise take a value of 0, (C) logarithm of one plus the number of jihad events during a given period in each column. All Log(Distance) variables indicate the logarithm of one plus distance (km) to the nearest object. Landlocked is defined as the 1000km faraway from the nearest coast point. The interest variables are the logarithm of one plus distance (km) to the nearest pre-colonial landlocked trade point whose contemporary population is less than 100,000 in columns (1)-(3), and the logarithm of one plus distance (km) to the nearest pre-colonial landlocked trade route up to 1800 in columns (4)-(6). We control for landlocked dummy, average malaria suitability, average caloric suitability in post 1500, average elevation, ruggedness, and logarithm of one plus population in 2010 in all the specifications. We report standard errors adjusting for spatial auto-correlation with distance cutoff at 100km in parentheses. • ∗ , ∗∗ , ∗∗∗ .
(A) Log(Distance) (1) (2) (3) (4) (5) (6) All 2010-15 2016-19 All 2010-15 2016-19 Log (Distance to a landlocked trade point ( 100,000)) 1.319∗∗∗ 1.496∗∗∗ 1.371∗∗∗ (0.306) (0.282) (0.317) Log (Distance to a landlocked trade route up to 1800) 0.990∗∗∗ 1.123∗∗∗ 1.029∗∗∗ (0.180) (0.163) (0.182) Log (Distance to a lake/river today) 0.215∗∗∗ 0.0908∗∗ 0.214∗∗∗ 0.217∗∗∗ 0.0937∗∗∗ 0.217∗∗∗ (0.0425) (0.0434) (0.0415) (0.0356) (0.0309) (0.0352) Observations 2616 2616 2616 2616 2616 2616 Mean (Dep. Var.) 5.858 6.376 5.927 5.858 6.376 5.927 SD (Dep. Var.) 1.094 1.028 1.037 1.094 1.028 1.037 (B) Onset (1) (2) (3) (4) (5) (6) All 2010-15 2016-19 All 2010-15 2016-19 Log (Distance to a landlocked trade point ( 100,000)) -0.254∗∗∗ -0.284∗∗∗ -0.223∗∗ (0.0880) (0.0825) (0.0888) Log (Distance to a landlocked trade route up to 1800) -0.190∗∗∗ -0.213∗∗∗ -0.167∗∗∗ (0.0559) (0.0525) (0.0571) Log (Distance to a lake/river today) -0.0322∗∗ -0.0120 -0.0286∗∗ -0.0327∗∗∗ -0.0126 -0.0291∗∗∗ (0.0135) (0.0130) (0.0119) (0.0112) (0.0104) (0.00995) Observations 2616 2616 2616 2616 2616 2616 Mean (Dep. Var.) 0.050 0.026 0.042 0.050 0.026 0.042 SD (Dep. Var.) 0.219 0.160 0.201 0.219 0.160 0.201 (C) Intensity (1) (2) (3) (4) (5) (6) All 2010-15 2016-19 All 2010-15 2016-19 Log (Distance to a landlocked trade point ( 100,000)) -0.685∗∗∗ -0.539∗∗∗ -0.499∗∗ (0.258) (0.191) (0.214) Log (Distance to a landlocked trade route up to 1800) -0.514∗∗∗ -0.404∗∗∗ -0.375∗∗∗ (0.167) (0.125) (0.139) Log (Distance to a lake/river today) -0.0475∗ -0.00919 -0.0426∗ -0.0488∗∗ -0.0102 -0.0435∗∗ (0.0276) (0.0182) (0.0221) (0.0219) (0.0148) (0.0181) Observations 2616 2616 2616 2616 2616 2616 Mean (Dep. Var.) 0.082 0.041 0.063 0.082 0.041 0.063 SD (Dep. Var.) 0.416 0.281 0.347 0.416 0.281 0.347 Country FE Yes Yes Yes Yes Yes Yes Geographic Controls Yes Yes Yes Yes Yes Yes • Notes: All regressions are estimated using IV with logarithm of one plus distance (km) to the nearest ancient lake as an instrument. The unit of observation is a grid cell (about 55km × 55km). The dependent variables are (A) logarithm of one plus distance (km) to the nearest jihad during a period given in each column, (B) dummy variables which take a value of 1 if jihad occurred during a period given in each column, otherwise take a value of 0, (C) logarithm of one plus the number of jihad events during a given period in each column. All Log(Distance) variables indicate the logarithm of one plus distance (km) to the nearest object. Landlocked is defined as the 1000km faraway from the nearest coast point. The interest variables are the logarithm of one plus distance (km) to the nearest pre-colonial landlocked trade point whose contemporary population is less than 100,000 in columns (1)-(3), and the logarithm of one plus distance (km) to the nearest pre-colonial landlocked trade route up to 1800 in columns (4)-(6). We control for landlocked dummy, average malaria suitability, average caloric suitability in post 1500, average elevation, ruggedness, and logarithm of one plus population in 2010 in all the specifications. We report standard errors adjusting for spatial auto-correlation with distance cutoff at 100km in parentheses. • ∗ , ∗∗ , ∗∗∗ .
(A) Log(Distance) (1) (2) (3) (4) (5) (6) All 2010-15 2016-19 All 2010-15 2016-19 Log (Distance to a landlocked trade point ( 100,000)) 1.266∗∗∗ 1.261∗∗∗ 1.498∗∗∗ (0.255) (0.254) (0.275) Log (Distance to a landlocked trade route up to 1800) 0.950∗∗∗ 0.946∗∗∗ 1.124∗∗∗ (0.141) (0.141) (0.167) Log (Distance to a lake/river today) 0.0926∗∗ 0.0926∗∗ 0.0262 0.0951∗∗∗ 0.0950∗∗∗ 0.0291 (0.0380) (0.0380) (0.0376) (0.0278) (0.0278) (0.0290) Observations 2616 2616 2616 2616 2616 2616 Mean (Dep. Var.) 6.198 6.198 6.945 6.198 6.198 6.945 SD (Dep. Var.) 1.166 1.165 0.884 1.166 1.165 0.884 (B) Onset (1) (2) (3) (4) (5) (6) All 2010-15 2016-19 All 2010-15 2016-19 Log (Distance to a landlocked trade point ( 100,000)) -0.273∗∗∗ -0.273∗∗∗ -0.116∗∗ (0.0748) (0.0748) (0.0569) Log (Distance to a landlocked trade route up to 1800) -0.205∗∗∗ -0.205∗∗∗ -0.0873∗∗ (0.0477) (0.0477) (0.0405) Log (Distance to a lake/river today) -0.0139 -0.0139 0.00401 -0.0144 -0.0144 0.00379 (0.0113) (0.0113) (0.00352) (0.00936) (0.00936) (0.00366) Observations 2616 2616 2616 2616 2616 2616 Mean (Dep. Var.) 0.037 0.037 0.007 0.037 0.037 0.007 SD (Dep. Var.) 0.190 0.190 0.083 0.190 0.190 0.083 (C) Intensity (1) (2) (3) (4) (5) (6) All 2010-15 2016-19 All 2010-15 2016-19 Log (Distance to a landlocked trade point ( 100,000)) -0.730∗∗∗ -0.714∗∗∗ -0.170∗ (0.253) (0.246) (0.0932) Log (Distance to a landlocked trade route up to 1800) -0.548∗∗∗ -0.536∗∗∗ -0.128∗ (0.169) (0.164) (0.0665) Log (Distance to a lake/river today) -0.00624 -0.00707 0.00625 -0.00766 -0.00845 0.00592 (0.0205) (0.0202) (0.00516) (0.0197) (0.0193) (0.00555) Observations 2616 2616 2616 2616 2616 2616 Mean (Dep. Var.) 0.070 0.069 0.009 0.070 0.069 0.009 SD (Dep. Var.) 0.422 0.415 0.119 0.422 0.415 0.119 Country FE Yes Yes Yes Yes Yes Yes Geographic Controls Yes Yes Yes Yes Yes Yes • Notes: All regressions are estimated using IV with logarithm of one plus distance (km) to the nearest ancient lake as an instrument. The unit of observation is a grid cell (about 55km × 55km). The dependent variables are (A) logarithm of one plus distance (km) to the nearest jihad during a period given in each column, (B) dummy variables which take a value of 1 if jihad occurred during a period given in each column, otherwise take a value of 0, (C) logarithm of one plus the number of jihad events during a given period in each column. All Log(Distance) variables indicate the logarithm of one plus distance (km) to the nearest object. Landlocked is defined as the 1000km faraway from the nearest coast point. The interest variables are the logarithm of one plus distance (km) to the nearest pre-colonial landlocked trade point whose contemporary population is less than 100,000 in columns (1)-(3), and the logarithm of one plus distance (km) to the nearest pre-colonial landlocked trade route up to 1800 in columns (4)-(6). We control for landlocked dummy, average malaria suitability, average caloric suitability in post 1500, average elevation, ruggedness, and logarithm of one plus population in 2010 in all the specifications. We report standard errors adjusting for spatial auto-correlation with distance cutoff at 100km in parentheses. • ∗ , ∗∗ , ∗∗∗ .
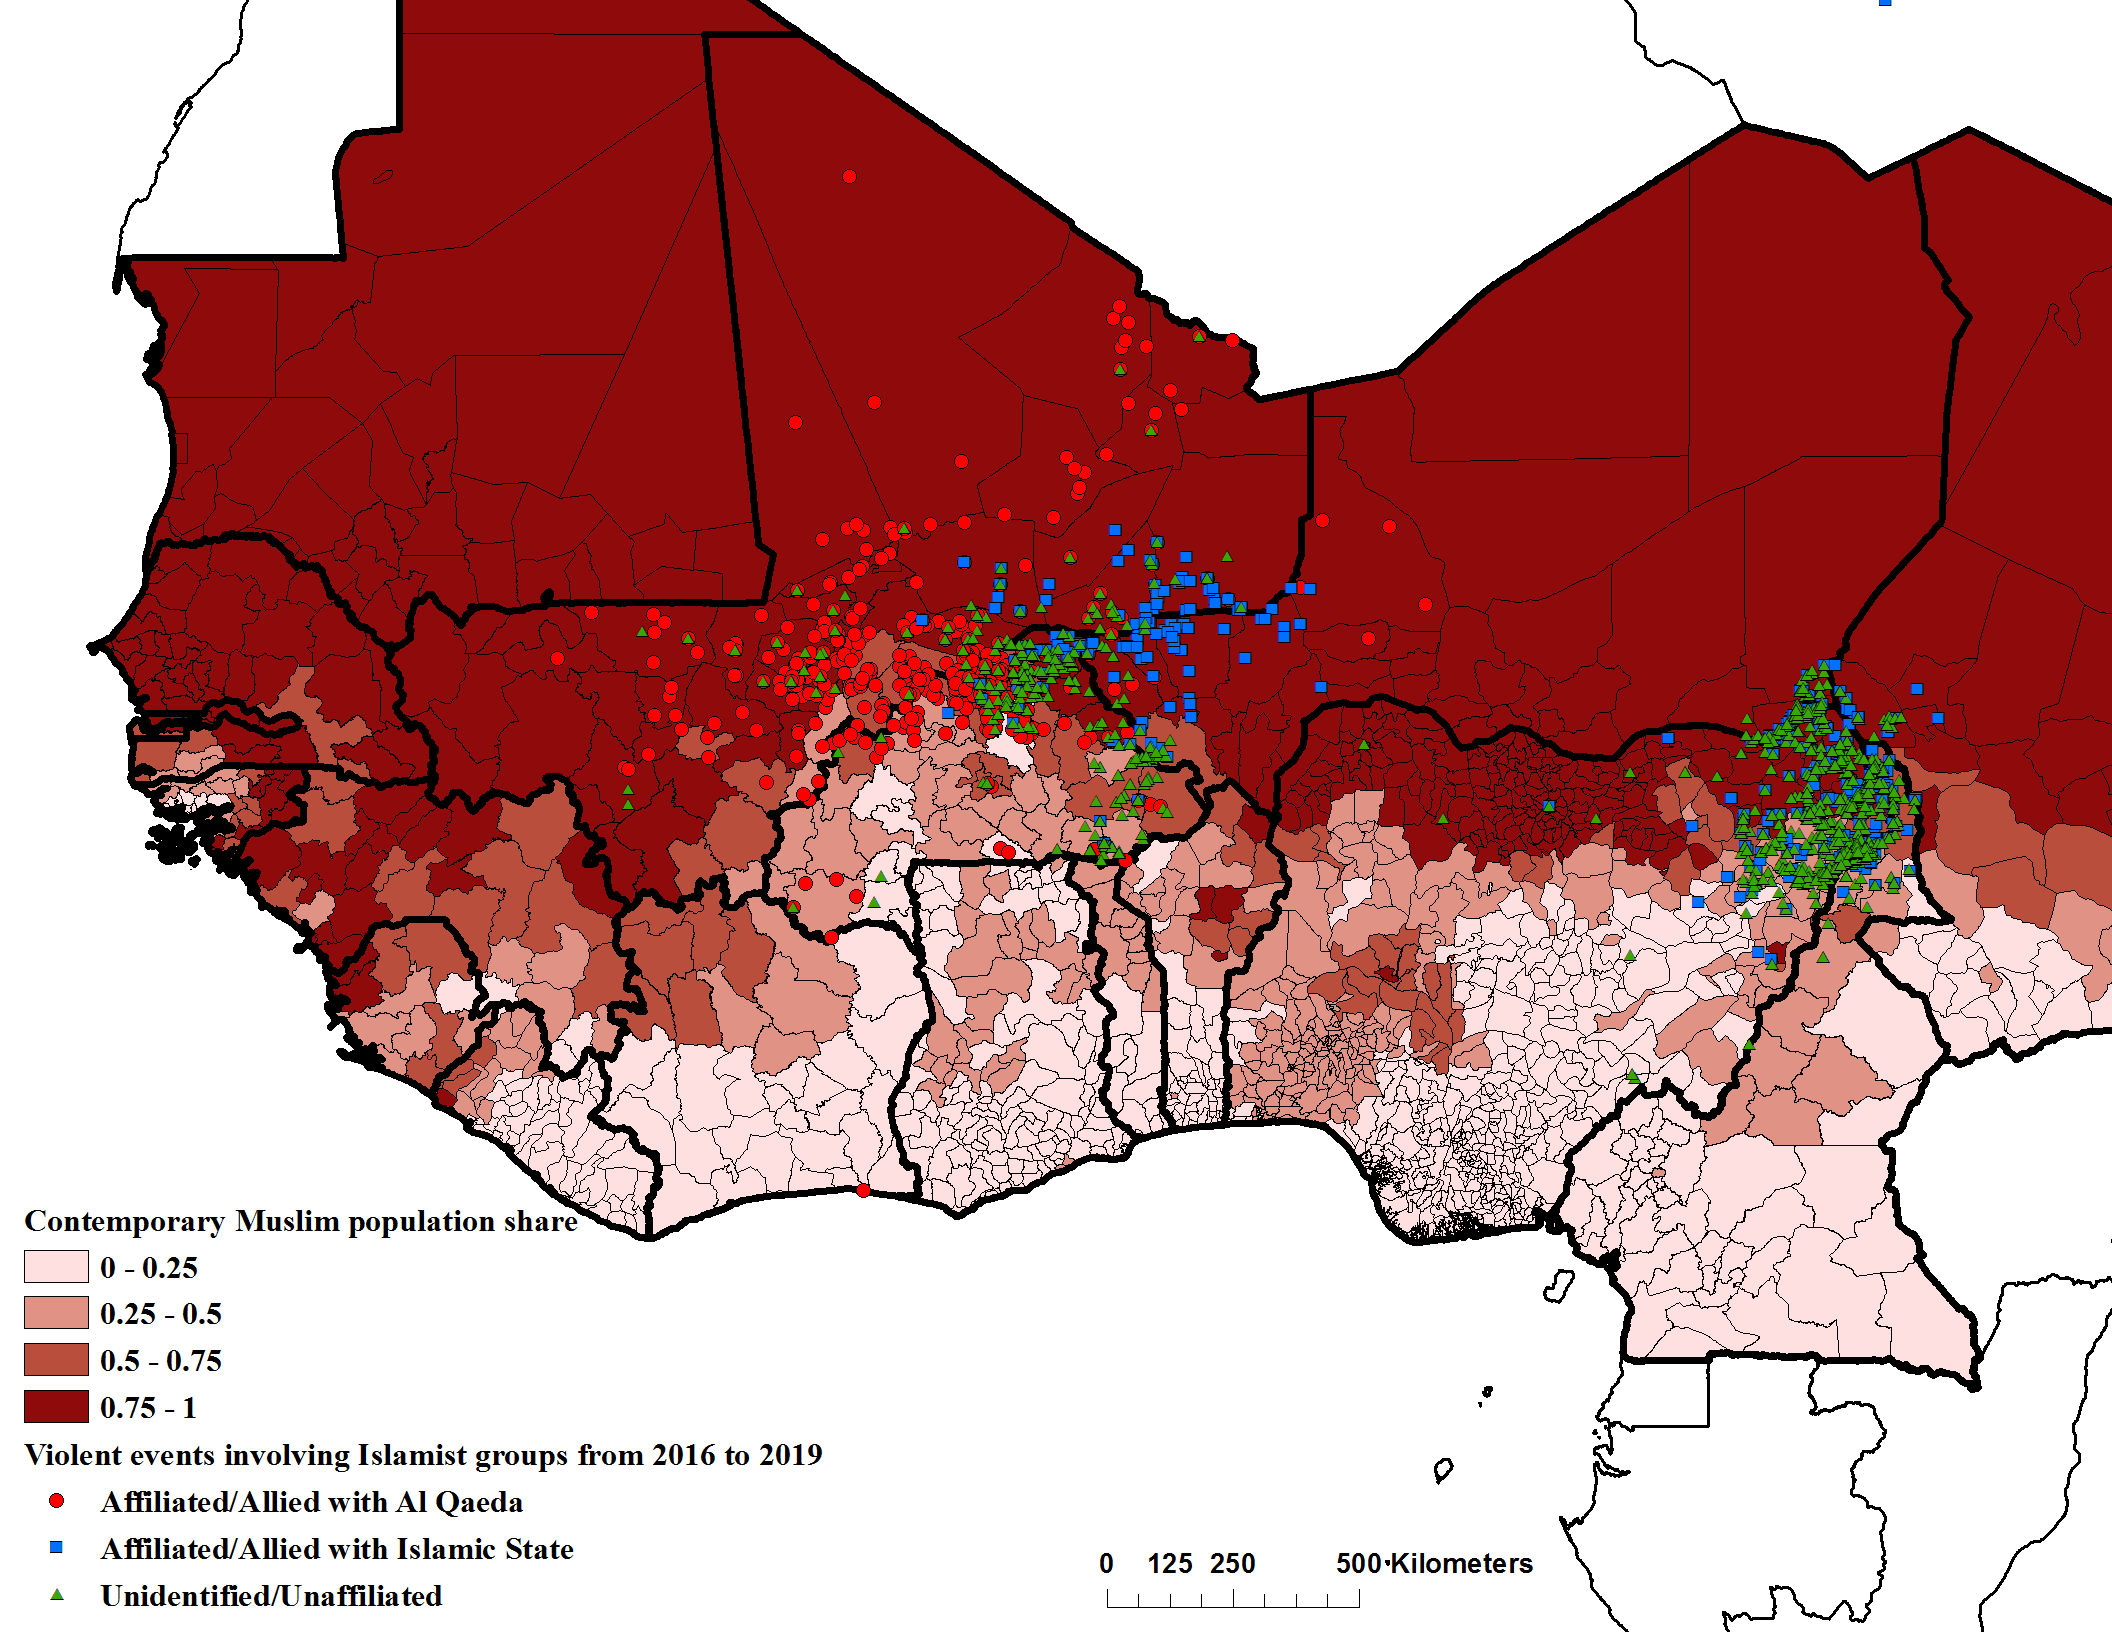
(Source: ACLED and World Religion Database)
log (Number of Jihadist Violence) Al Qaeda Islamic State Boko Haram (1) (2) (3) (4) (5) (6) log (ILMA) -0.00554∗∗ -0.00321 0.0256∗∗∗ 0.0171∗∗∗ 0.0454∗∗∗ 0.0286∗∗∗ (0.00225) (0.00213) (0.00404) (0.00369) (0.00561) (0.00497) log (ITA) -0.0189∗∗∗ 0.00409 -0.0591∗∗∗ -0.143∗∗∗ -0.0831∗∗∗ -0.249∗∗∗ (0.00734) (0.0102) (0.00826) (0.0181) (0.00888) (0.0224) log (Population) -0.0109∗∗∗ 0.0399∗∗∗ 0.0789∗∗∗ (0.00397) (0.00559) (0.00768) Country Year FE Yes Yes Yes Yes Yes Yes R2 0.307 0.307 0.069 0.075 0.052 0.069 Adjusted R2 0.299 0.299 0.059 0.064 0.041 0.058 Mean (Dep. Var.) 0.020 0.020 0.018 0.018 0.024 0.024 SD (Dep. Var.) 0.194 0.194 0.185 0.185 0.209 0.209 Observations 15320 15320 15320 15320 15320 15320 • Notes: Robust standard errors in parentheses. The sample includes all districts in West Africa from 2010 to 2019. Other controls include district area size. ITA Insurgent’s Target Market Access. ILMA Insurgent’s Labor Market Access. • ∗ , ∗∗ , ∗∗∗ .
Appendix E Conflict Catalogue
In this section, we construct conflict confrontation sample between European actors and historical states from conflict catalogue. We match conflict actors in the database with historical states in 1860 from Cultures of West Africa by using online resources.313131 We mainly depend on wikipedia, and Joshua Project. We follow the procedures below:
-
1.
We match a historical state with a conflict actor by its name (direct match).
-
2.
If a state name cannot be found in conflict catalogue, we match by its alternate names or spellings (alternate name match). Matched conflicts must occur following the establishment years.
However, \citetAppBrecke1999 includes many conflicts that indicate only larger ethnic groups (e.g., Fulani) or larger areas (e.g., Sierra Leone) that may have been related to historical states. As additional sources, we make use of information about locations of conflict from \citetAppFK2017 and \citetAppBDL2019. \citetAppFK2017 provides the information about conflicts between 1700 and 1900. Regarding conflicts after 1901, we use digitized information by ourselves, using web sources (e.g., wikipedia and google maps).
Below Table E.1 lists up all the conflicts related to historical states in West Africa from \citetAppBrecke1999.323232 We exclude the following conflicts from the list since they are not identified in alternative sources: “France-England (Benin), 1792”, “Nikki-France (Borgou, Benin), 1916” and “Adja-France (Mono, Benin), 1918-19”.
| Historical State | Islamic | European Enemy | Start Year | End Year |
|---|---|---|---|---|
| Djolof | N | Portugal | 1697 | 1697 |
| Ashanti | N | Britain | 1711 | 1712 |
| Dahomey | N | Britain | 1727 | 1729 |
| Ashanti | N | Denmark | 1742 | 1742 |
| Ashanti | N | Denmark | 1743 | 1743 |
| Ashanti | N | Britain | 1823 | 1826 |
| Ijebu | N | Britain | 1851 | 1851 |
| Tukulor | Y | France | 1854 | 1861 |
| Saloum | N | France | 1856 | 1858 |
| Koya | N | Britain | 1861 | 1861 |
| Futa Toro | Y | France | 1862 | 1862 |
| Ashanti | N | Britain | 1863 | 1864 |
| Cayor | N | France | 1864 | 1864 |
| Dahomey | N | Britain | 1864 | 1865 |
| Ashanti | N | Britain | 1865 | 1865 |
| Ashanti | N | Britain | 1868 | 1869 |
| Cayor | N | France | 1869 | 1869 |
| Ashanti | N | Britain | 1873 | 1874 |
| Futa Toro | Y | France | 1875 | 1875 |
| Dahomey | N | Britain | 1878 | 1878 |
| Wassoulou | Y | France | 1881 | 1888 |
| Wassoulou | Y | France | 1885 | 1886 |
| Wassoulou | Y | France | 1888 | 1891 |
| Dahomey | N | France | 1889 | 1890 |
| Dahomey | N | France | 1892 | 1893 |
| Ashanti | N | Britain | 1893 | 1894 |
| Wassoulou | Y | France | 1894 | 1895 |
| Ashanti | N | Britain | 1895 | 1896 |
| Benin | N | Britain | 1897 | 1897 |
| Wassoulou | Y | France | 1898 | 1898 |
| Kanem-Bornu | Y | France | 1899 | 1901 |
| Ashanti | N | Britain | 1900 | 1903 |
| Aro | N | Britain | 1901 | 1901 |
| Kanem-Bornu | Y | Britain | 1902 | 1902 |
| Kanem-Bornu | Y | Britain | 1902 | 1902 |
| Sokoto Califate | Y | Britain | 1903 | 1903 |
| Sokoto Califate | Y | Britain | 1906 | 1906 |
| Ijebu | N | Britain | 1912 | 1913 |
| Benin | N | France | 1914 | 1914 |
| Benin | N | France | 1915 | 1916 |
| Wassoulou | Y | France | 1915 | 1915 |
| Wassoulou | Y | France | 1916 | 1916 |
-
•
Note: The names of the historical states come from Culture of West Africa. Y indicates a state is Islamic and N indicates it is not. The two conflicts against Britain in 1902 involving with Kanem-Bornu are not the same.
Appendix F Strategies against Colonization
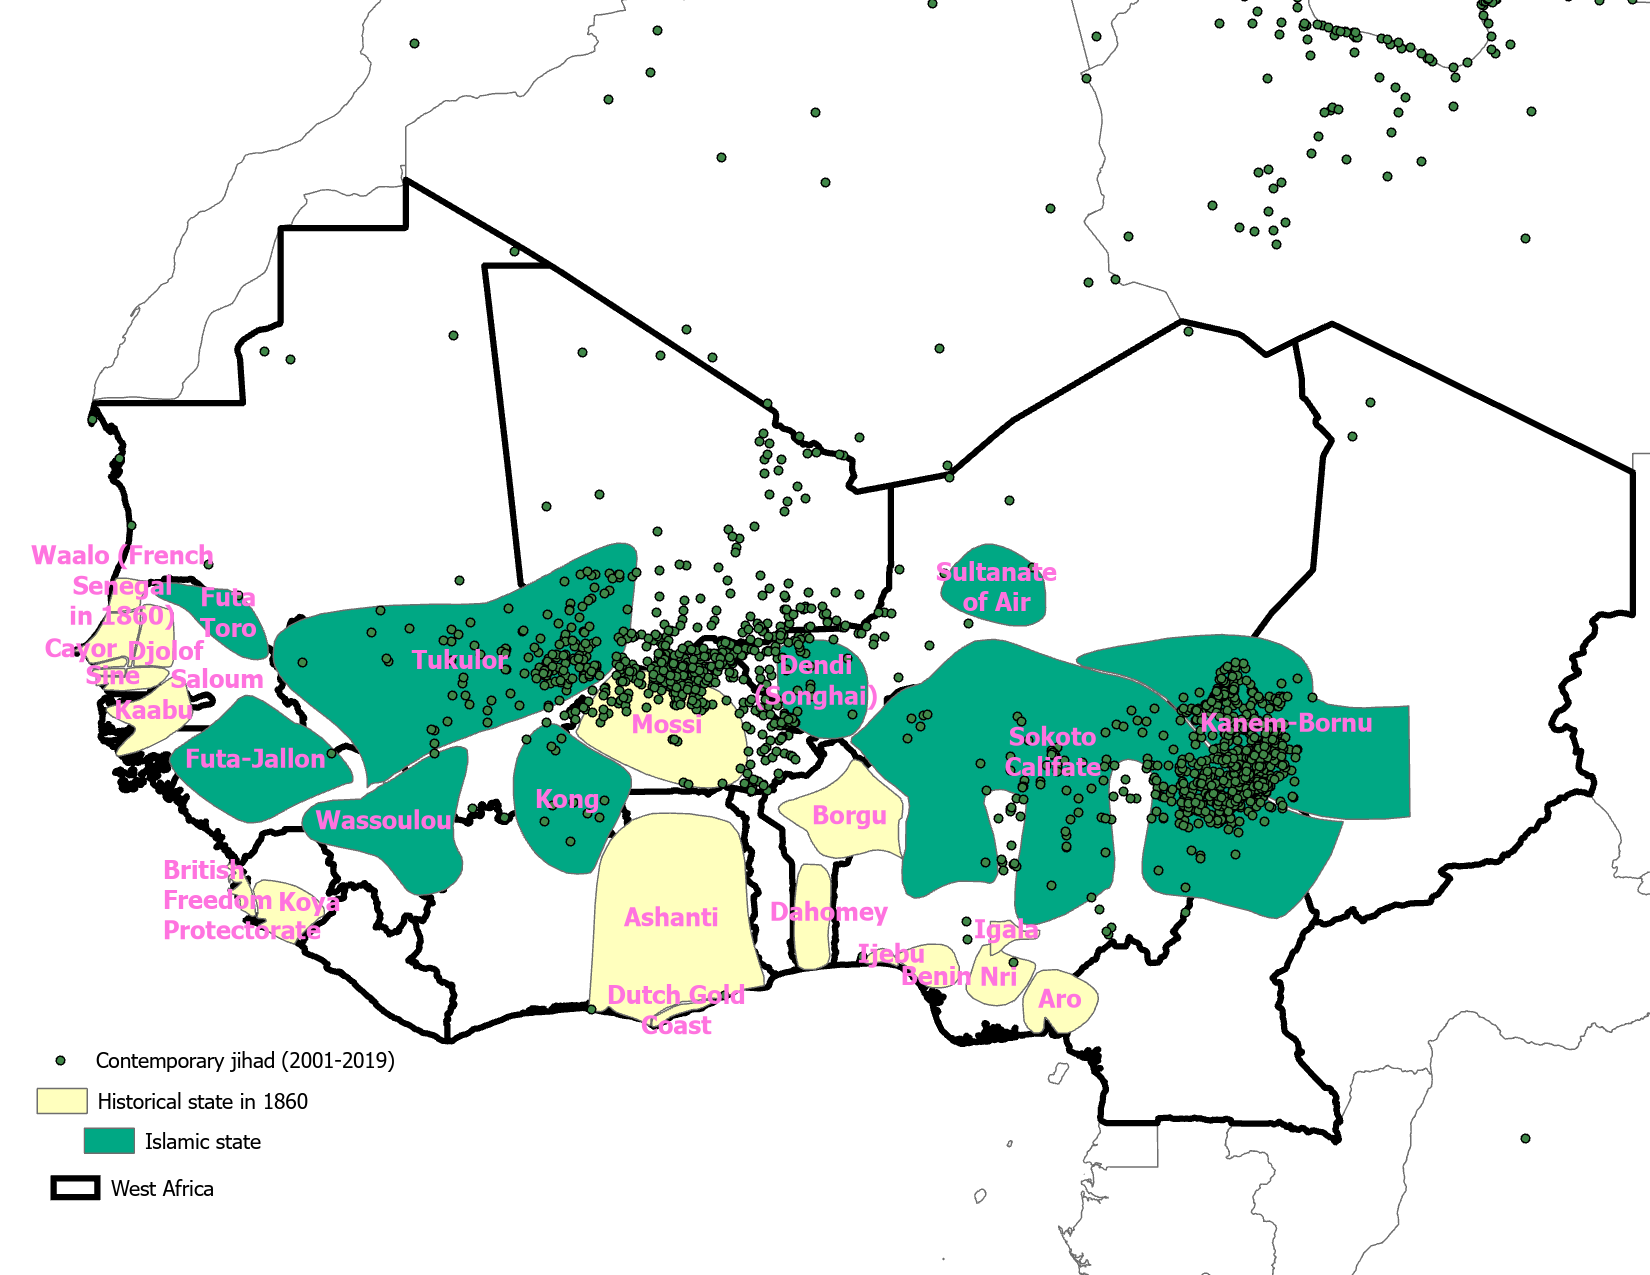
(Source: ACLED and Cultures of West Africa)
Futa Toro. The leader of Tukulor empire, Ahmadu, recruited talibés (i.e., students of religion who formed the backbone of his father’s army) from Futa Toro (\citealtAppBoahen1985 p.120).
Futa Jallon. Futa Jallon resistance to French expansion relied on the use of diplomacy rather than military measures (\citealtAppMcgowan1981, p.246).
Kong Empire. Kong empire was destroyed in 1895 by Samori who accused of soliciting French protection (\citealtAppAzarya1980 p.434).
Sokoto Califate. The Sokoto Caliphate was conquered by British colonial forces in 1903. It was military conquest (\citealtAppBoahen1985 p.137). The territory was divided between British, French, and German powers.
Tukulor Empire. The leader Ahmadu, who succeeded the founder of the empire, chose strategies of alliance and militant confrontation and relied more on the alliance than confrontation (\citealtAppBoahen1985 p.119). Besides the French, he was forced to fight on other two fronts: against his brothers who contested his authority and rebellions of his subjects. To deal with these two, he needed arms and ammunition as well as financial resources through trade, both of which necessitated friendly relations with the French (\citealtAppBoahen1985 p.119-120).
Wassoulou (Mandingo/Mandinka) Empire. The ruler, Samori Ture, chose the strategy of confrontation (\citealtAppBoahen1985 p.123).
aer
References
- (1)
- Azarya (1980) Azarya, Victor, “Traders and the center in Massina, Kong, and Samori’s state,” The International Journal of African Historical Studies, 1980, 13 (3), 420–456.
- Boahen (1985) Boahen, A Adu, “General History of Africa. VII. Africa under Colonial Domination 1880-1935. Berkeley,” 1985.
- Boxell et al. (2019) Boxell, Levi, John T Dalton, and Tin Cheuk Leung, “The Slave Trade and Conflict in Africa, 1400-2000,” Available at SSRN 3403796, 2019.
- Brecke (1999) Brecke, Peter, “Violent conflicts 1400 AD to the present in different regions of the world,” in “1999 Meeting of the Peace Science Society” 1999.
- Chandler (1987) Chandler, Tertius, Four thousand years of urban growth: An historical census, Mellen, 1987.
- Croicu and Sundberg (2013) Croicu, Mihai and Ralph Sundberg, UCDP GED Codebook version 18.1, Department of Peace and Conflict Research, Uppsala University, 2013.
- Ethnologue (2005) Ethnologue, “: Languages of the World,” 2005.
- Fenske (2014) Fenske, James, “Ecology, trade, and states in pre-colonial Africa,” Journal of the European Economic Association, 2014, 12 (3), 612–640.
- Fenske and Kala (2017) and Namrata Kala, “1807: Economic shocks, conflict and the slave trade,” Journal of Development Economics, 2017, 126, 66–76.
- Galor and Özak (2016) Galor, Oded and Ömer Özak, “The Agricultural Origins of Time Preference,” American Economic Review, October 2016, 106 (10), 3064–3103.
- Galor and Özak (2015) and Ömer Özak, “Land productivity and economic development: Caloric suitability vs. agricultural suitability,” Agricultural Suitability (July 12, 2015), 2015.
- Galor et al. (2017) , Ömer Özak, and Assaf Sarid, “Geographical Origins and Economic Consequences of Language Structures,” 2017. Mimeo, Available at SSRN: https://ssrn.com/abstract=2820889.
- Klein Goldewijk et al. (2010) Goldewijk, Kees Klein, Arthur Beusen, and Peter Janssen, “Long-term dynamic modeling of global population and built-up area in a spatially explicit way: HYDE 3.1,” The Holocene, 2010, 20 (4), 565–573.
- Kasule (1998) Kasule, Samuel, The history atlas of Africa, Macmillan General Reference, 1998.
- Lloyd et al. (2019) Lloyd, Christopher T, Heather Chamberlain, David Kerr, Greg Yetman, Linda Pistolesi, Forrest R Stevens, Andrea E Gaughan, Jeremiah J Nieves, Graeme Hornby, Kytt MacManus et al., “Global spatio-temporally harmonised datasets for producing high-resolution gridded population distribution datasets,” Big earth data, 2019, 3 (2), 108–139.
- Matsuura and Willmott (2018) Matsuura, Kenji and Cort J Willmott, “Terrestrial precipitation: 1900–2017 gridded monthly time series,” Electronic. Department of Geography, University of Delaware, Newark, DE, 2018, 19716.
- McGowan (1981) McGowan, Winston, “Fula Resistance to French Expansion into Futa Jallon 1889–1896,” The Journal of African History, 1981, 22 (2), 245–261.
- Michalopoulos (2012) Michalopoulos, Stelios, “The origins of ethnolinguistic diversity,” American Economic Review, 2012, 102 (4), 1508–39.
- Nunn (2008) Nunn, Nathan, “The long-term effects of Africa’s slave trades,” The Quarterly Journal of Economics, 2008, 123 (1), 139–176.
- Nunn (2010) , “Religious conversion in colonial Africa,” American Economic Review, 2010, 100 (2), 147–52.
- Nunn and Puga (2012) and Diego Puga, “Ruggedness: The blessing of bad geography in Africa,” Review of Economics and Statistics, 2012, 94 (1), 20–36.
- Nunn and Wantchekon (2011) and Leonard Wantchekon, “The slave trade and the origins of mistrust in Africa,” American Economic Review, 2011, 101 (7), 3221–52.
- Pettersson and Öberg (2020) Pettersson, Therése and Magnus Öberg, “Organized violence, 1989–2019,” Journal of peace research, 2020, 57 (4), 597–613.
- Pettersson et al. (2021) Pettersson, Therese, Shawn Davies, Amber Deniz, Garoun Engström, Nanar Hawach, Stina Högbladh, and Margareta Sollenberg Magnus Öberg, “Organized violence 1989–2020, with a special emphasis on Syria,” Journal of Peace Research, 2021, 58 (4), 809–825.
- Ruthven et al. (2004) Ruthven, Malise, Azim Nanji, Abdou Filali-Ansary et al., Historical atlas of Islam, Harvard University Press, 2004.
- Sachs et al. (2004) Sachs, Jeffrey, Anthony Kiszewski, Andrew Mellinger, Andrew Spielman, Pia Malaney, and Sonia Ehrlich Sachs, “A global index of the stability of malaria transmission,” American Journal of Tropical Medicine and Hygiene, 2004, 70 (5), 486–498.
- Skinner (1958) Skinner, Elliott P, “Christianity and Islam among the Mossi,” American Anthropologist, 1958, 60 (6), 1102–1119.
- Stevens et al. (2015) Stevens, Forrest R, Andrea E Gaughan, Catherine Linard, and Andrew J Tatem, “Disaggregating census data for population mapping using random forests with remotely-sensed and ancillary data,” PloS one, 2015, 10 (2), e0107042.
- Sundberg and Melander (2013) Sundberg, Ralph and Erik Melander, “Introducing the UCDP Georeferenced Event Dataset,” Journal of Peace Research, 2013, 50 (4), 523–532.
- Tatem (2017) Tatem, Andrew J, “WorldPop, open data for spatial demography,” Scientific data, 2017, 4 (1), 1–4.