KELT-9 and its ultra-hot Jupiter: stellar parameters, composition, and planetary pollution
Abstract
KELT-9b is an ultra-hot Jupiter observed to be undergoing extreme mass loss. Its A0-type host star has a radiative envelope, which makes its surface layers prone to retaining recently accreted material. To search for potential signs of planetary material polluting the stellar surface, we carry out the most comprehensive chemical characterisation of KELT-9 to-date. New element detections include Na and Y, which had previously been detected in the ultra-hot Jupiter but not studied in the star; these detections complete the set of nine elements measured in both star and planet. In comparing KELT-9 with similar open cluster stars we find no strong anomalies. This finding is consistent with calculations of photospheric pollution accounting for stellar mixing and using observationally estimated KELT-9b mass loss rates. We also rule out recent, short-lived intensive mass transfer such as the stellar ingestion of an Earth-mass exomoon.
keywords:
stars: early-type – stars: abundances – planet-star interactions1 Introduction
Accretion of planetary material can potentially affect the photospheric composition of the host star. This can occur due to engulfment (Israelian et al., 2001; Nagar et al., 2020) or transfer of mass by a planetary wind (Jura, 2015) and has the potential to offer diagnostic power complementary to methods like transit spectroscopy. We analyse a high signal-to-noise ratio (SNR) spectrum of KELT-9 (HD 195689), which hosts the hottest and most rapidly evaporating planet found to-date, with the aim of looking for composition anomalies caused by accretion of planetary material.
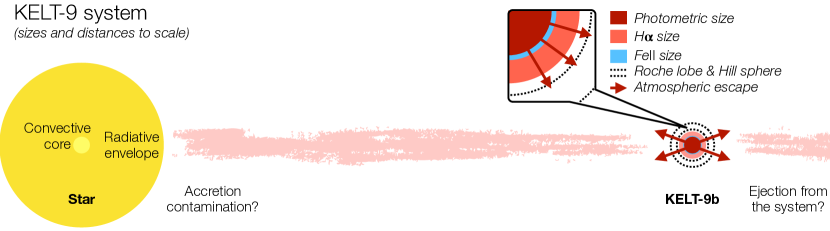
KELT-9b is an intensely irradiated ultra-hot Jupiter around an A0-type star (Gaudi et al., 2017). Orbiting at au from its star with a period of days, KELT-9b has a mass of MJup, radius of RJup, and an equilibrium temperature of K with K measured on the dayside (Gaudi et al., 2017). Atmospheric mass loss measurements range from g s-1 (Yan & Henning, 2018; Cauley et al., 2019; Wyttenbach et al., 2020). A recent result using NLTE calculations finds a pure oxygen loss rate of to g s-1 (Fossati et al., 2020, 2021; Borsa et al., 2021). The observational estimates for the bulk mass loss mostly fall within the theoretical UV-flux limited rate of to g s-1 ( to M⊙ yr-1; see Gaudi et al., 2017; Fossati et al., 2018), where the upper end may be based on a stellar extreme-UV luminosity that is too high for A-type stars. A to-scale diagram of KELT-9 and its evaporating planet is shown in Figure 1.
For stars of mass M⊙ (spectral type F5), which have slowly-mixing radiative envelopes, accretion can dominate the composition of the surface more easily than for stars with large convective envelopes (Charbonneau & Michaud, 1991; Turcotte & Charbonneau, 1993; Turcotte, 2002; Jermyn & Kama, 2018). This characteristic makes mid-F and A-type stars interesting candidates to seek signs of recent or ongoing ingestion of planetary material.
2 Observations
We obtained a Gemini/GRACES spectrum of HD 195689 (KELT-9) on September 13th, 2017, through proposal GN-2017B-DD-1. GRACES, or the Gemini Remote Access to CFHT ESPaDOnS Spectrograph (Tollestrup et al., 2012; Chene et al., 2014), combines the collecting power of the 8.1m Gemini North telescope with the resolving power and efficiency of the ESPaDOnS spectrograph on the CFHT through a 270m fiber feed. We used the 1-fiber mode, which provides a maximum spectral resolution of . This fixed instrument configuration provides nearly continuous spectra from to Å in 35 echelle orders. During our observations the average airmass and seeing were 1.1 and , respectively, and we used 16x60s consecutive exposures to achieve a SNR per km s-1 spectral pixel around Å (and SNR at Å). The data were reduced with both the DRAGRACES (Chené et al., 2021) and OPERA extraction pipelines and cross-checked. At wavelengths Å DRAGRACES resulted in a better SNR, while at longer wavelengths the SNR of the reductions were consistent but OPERA had a smoother continuum so it was used in analysing the longest wavelength window.
3 Determining the stellar properties and composition
In order to discuss any potential anomalies in the composition of KELT-9, such as signatures of contamination by mass lost from its ultra-hot Jupiter, we first determine the stellar parameters and photospheric chemical element abundances.
The analysis closely followed the approach of Folsom et al. (2012). The approach was to directly fit the observations with model spectra, simultaneously deriving abundances and stellar parameters through minimization. We fit six large spectral windows independently and use the average and standard deviation of results from these window to, approximately, account for systematic uncertainties. To calculate synthetic spectra we used the Zeeman spectrum synthesis code (Landstreet, 1988; Wade et al., 2001), with a Levenberg-Marquardt fitting routine and optimizations for a negligibly magnetic star (Folsom et al., 2012). Zeeman performs polarized radiative transfer in LTE including the Zeeman effect and produces model spectra integrated across the visible disk of a star. A grid of model atmospheres from ATLAS9 (Kurucz, 1993; Castelli & Kurucz, 2003) were used as input, and a bi-linear interpolation of the log of the model quantities was used to produce an atmosphere for a specific and . Atomic line data was taken from the Vienna Atomic Line Database (VALD Piskunov et al., 1995; Ryabchikova et al., 1997; Kupka et al., 1999, 2000; Ryabchikova et al., 2015), using an ‘extract stellar’ request for the parameters of KELT-9.
The free parameters in the fit were , , , microturbulence (), radial velocity, and chemical abundances (). We assumed an instrumental resolution of 65000 for GRACES. The magnetic field and the macroturbulence, which is likely , were assumed to be negligible.
We normalized the observed spectrum by fitting low degree polynomials through carefully selected continuum points in individual spectral orders. Each spectral order was normalized independently then merged, rejecting the lower SNR order edges, to produce a continuous well normalized observation.
We selected six large spectral window that were fit independently: 4147–4292.5 Å, 4406–4785 Å (excluding the Mg ii 4481 Å line), 4999–5500 Å, 5500–6000 Å (excluding the Na D doublet and stronger telluric H2O lines between 5885 and 5980 Å), 6000–6460 Å (excluding the strong telluric O2 band between 6275 and 6330 Å), and portions of 6660–7590 Å with little telluric contamination (specifically 6660–6860 + 7085–7130 + 7400–7590 Å). These windows were chosen to span most of the available spectrum where the SNR is good. Balmer lines were avoided since their precise normalization in echelle spectra is unreliable. The particularly strong Mg ii 4481 Å line was excluded since it produced results discrepant with all other Mg lines in the spectrum. Large windows were used to provide many lines with a range of ionization, excitation potential, and strength, in order to simultaneously constrain stellar parameters and abundances. The exact window edges were adjusted to fully include lines but exclude potential sources of systematic error.
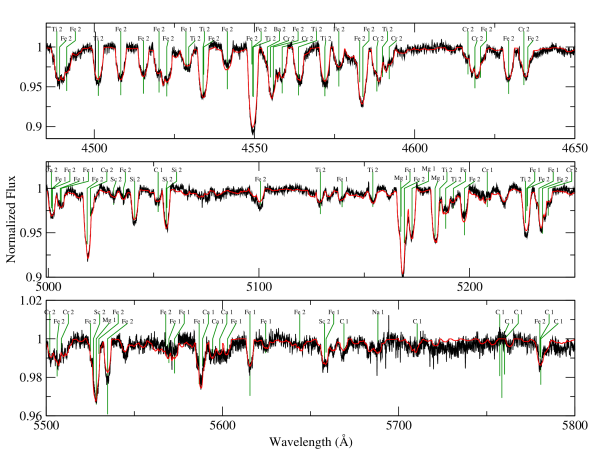
Sections of the observed and best-fit spectra are shown in Figure 2. The specific elemental abundances included as free parameters in the fit for each window depended on the presence of useful lines from that element. Lines were first identified by comparing the VALD line list with features in the observation, with the help of the estimated line depths provided by the ‘extract stellar’ feature of VALD. Elements with lines that were visible in the observation beyond the noise level were included, unless they were the substantially weaker component in the blend. An element whose only line was part of an similar strength blend was included in the initial fit, with a note to scrutinize the result. An initial fit was then performed with the initial selection of element abundances, as well as , , , and as free parameters. The fit was checked by eye to ensure good quality and validate uncertain elements. The resulting abundances were checked for anomalous values, or anomalously large formal uncertainties (as measured by the diagonal of the covariance matrix). In cases where an element was found to not be reliably constrained, the element was rejected as a free parameter for the window, a solar abundance (Asplund et al., 2009) was assumed for the purpose of spectrum synthesis, and the fit to that window was repeated with the abundance fixed.
After good fits to all six windows were achieved, a final consistency check was performed on abundances from different windows. In cases where an abundance for one window was particularly discrepant, the reliability of that abundance was reassessed. In cases where the discrepant abundance was based on a particularly weak line near the noise level, or a weaker component of a blended line, it was excluded from the final average.
We found that was poorly constrained in the 6660–7590 Å window, providing results that were clearly inconsistent with the other five windows. This window has relatively few lines, most of which are weak, and relatively low SNR, thus the simultaneous determination of and is particularly venerable to small errors in atomic data, line blending, or continuum normalization. For the final results we fixed for this window to the average value from the other five windows and fit for and the other parameters.
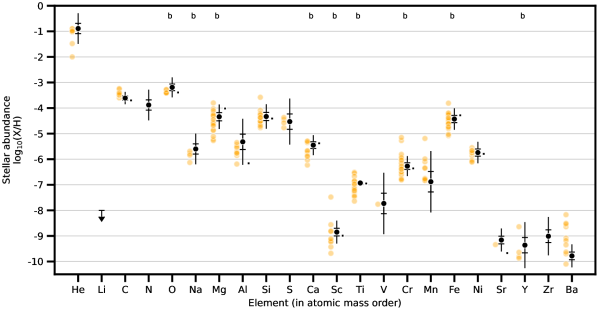
The final abundances and stellar parameters are presented in Table 1 and Figure 3. These are averages of the results from individual windows. The uncertainties are the standard deviation of results from the windows, except for abundances from three or fewer windows, to approximately account for systematic errors. If errors are normally distributed, the standard error (standard deviation divided by the square root of the number of measurements) provides a better estimate on the uncertainty of the mean. Thus the uncertainties may be over-estimated, although the standard error can be calculated easily from the quantities in Table 1. However, the sampling of atomic data from different spectral windows may not fully account for all systematic errors, and the number of windows provides small number statistics, so in some cases the uncertainties may be under-estimated. Thus we consider the standard deviation a reasonable approximation of the real uncertainty.
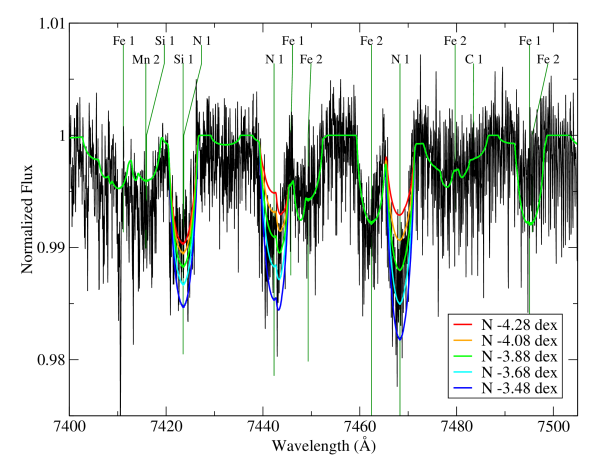
For elements with abundances from three or fewer windows, uncertainties were estimated by visually comparing models with modified abundances to the observation. An example (N/H) is shown in Figure 4. The estimates were chosen to span the range of results from different lines, and included possible errors due to continuum normalization or blended lines. Some of these uncertainties may be over-estimates, however the abundances may also be regarded as less reliable or more vulnerable to systematic errors.
Our stellar parameters match those in previous analyses (Borsa et al., 2019; Saffe et al., 2021). In comparison to a previous study of the composition of KELT-9, carried out with HARPS-N data (Saffe et al., 2021), our wavelength coverage extends further into the red by Å and we obtain abundances for more elements. New elements include He, N, V, Mn, Zr, and Ba, as well as Na and Y which were previously found in the extended atmosphere around KELT-9b (Hoeijmakers et al., 2019). We also report a conservative upper limit on Li.
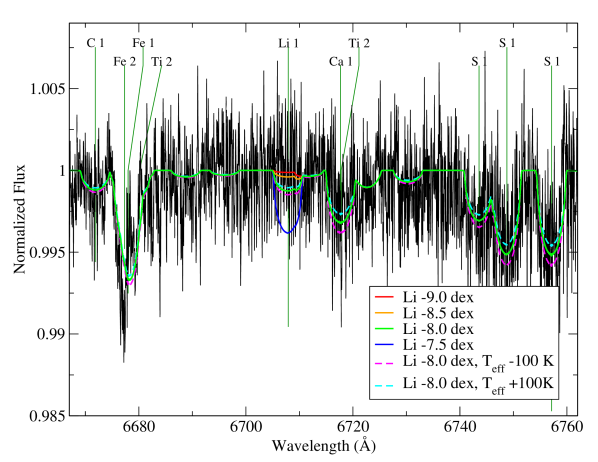
The Li analysis relies on the Li i line at 6708 Å, and since it is not detected we can only place an upper limit on the abundance (Figure 5). We obtain a formal limit by comparing the for a model with no Li to for models with increased Li abundances, looking for a change in that is statistically worse than the null model. From this process we find a Li abundance dex for a confidence level. However, this neglects any potential systematic errors. If we consider possible continuum normalization errors comparable to the noise level, which is plausible due to the high , then by visually comparing models to the observation we only confidently find a Li abundance dex. A change in by K changes the abundance limit by roughly dex. We adopt a cautious dex limit on Li/H, but the real limit is likely between and .
4 Analysis
As depicted in Figure 1, our aim is to constrain any accretion stream coming from the planet and reaching the stellar surface by examining the composition of the star’s photosphere. To do this, we follow Jermyn & Kama (2018) and introduce the parameter , which is the mass fraction of the photosphere composed of accreted material. That is,
| (1) |
where by native we mean the composition of the material in the star prior to accretion from the planet.
We compute by comparing the time-scale over which material in the photosphere mixes with material deeper in the star to that over which new material enters the photosphere (Jermyn & Kama, 2018). We do this assuming that KELT-9 is a typical main-sequence star characterised by temperature , mass , radius and rotation speed (Gaudi et al., 2017). The uncertainties on these parameters are small compared with uncertainties in the mixing processes at work so we neglect them. We assume for simplicity, producing an upper bound on the rotational mixing and therefore a lower bound on .
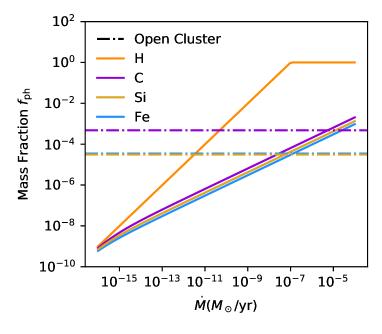
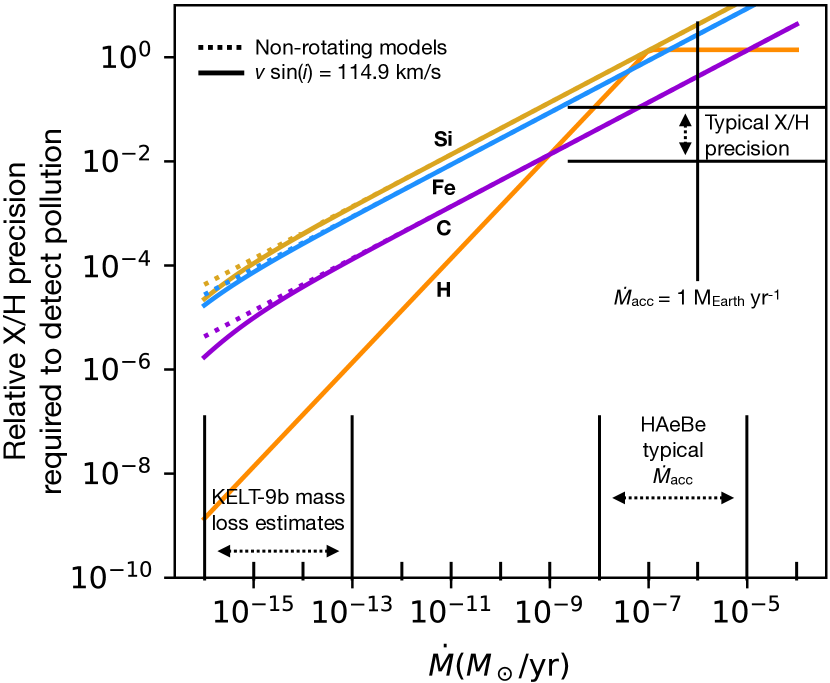
The results are shown in Figure 6. Because thermohaline mixing occurs at a rate that depends on the mean molecular weight of the accreted material, we sample the two extreme possibilities of pure hydrogen and pure iron, as well as the intermediate cases of pure carbon and silicon. For reference the abundances C ,Si, and Fe inferred from a sample of comparable open-cluster stars are shown as well. For below these abundances the chemical signatures of accreting material should be difficult to detect unless the composition of accreting material is highly unusual. Thus these horizontal lines should be interpreted as setting effective lower bounds on the detectable . The calculations hence suggest that we should only detect accretion if the planetary mass loss is M⊙ yr-1, which is impossible to achieve with planet evaporation except in a time-limited, catastrophic event. In Figure 7, we cast this in the form of measurement sensitivity required to detect a composition (in terms of ratios of elemental number abundances) anomaly as a function of mass accretion rate onto the star. We define “anomaly” as a deviation from the mean of similar stars in three open clusters as listed in Table 1.
For a high-mass planet such as KELT-9b, we expect the heavy element content to be enhanced over that of the star by perhaps a factor of five to ten (Thorngren et al., 2016). Such an enhanced iron abundance has indeed been inferred for KELT-9b (Pino et al., 2020). This might be measurable if the star was accreting pure planetary material at a high rate (see Figure 6). Unfortunately the mixing ratio of accreted material in the stellar photosphere is unfavourable because, for a planetary mass loss rate M⊙ yr-1 and a % transfer efficiency onto the star, the mass fraction of KELT-9b material in the photosphere of KELT-9 would be if accreting hydrogen-dominated material, or if iron-dominated. The fact that we find no significant peculiarity in any element or group of elements in KELT-9 is thus consistent with our calculations of which suggest the planetary evaporation rate is insufficient by four to five orders of magnitude to significantly pollute the stellar surface.
4.1 Constraining the recent ingestion of an exomoon
The stellar ingestion of a large, Earth-mass exomoon detached from KELT-9b and consisting primarily of refractory elements would provide a temporary source of very high effective accretion rate. This constitutes a testable hypothesis for our data. We caution that orbital stability considerations disfavor the retention of Earth-mass exomoons at the orbital distance of KELT-9 at the Myr age of the system i.e., such a moon should have been ingested at a fraction of the system’s current age (Barnes & O’Brien, 2002). We therefore examine this scenario mostly as an instructive case for future studies. The accretion of an Earth-mass moon within a year would provide M⊙ yr-1. As Earth’s iron content is wt% (% atomic fraction; McDonough & Sun, 1995), we can simplify this to assume accreting a large rocky moon is equivalent to temporarily accreting M⊙ yr-1 of pure Fe. Tracing this in Figure 6, we see that the photospheric iron abundance would be increased by over % and yield a measurable effect in such an event.
Accretion rates to M⊙ yr-1 overwhelm the stellar photospheric composition. This has been confirmed observationally for Herbig Ae/Be (“HAeBe”) stars, which are young early-type stars with rapidly accreting protoplanetary disks. Such stars exhibit a correlation of photospheric refractory element abundance with the availability of dust in the inner disk (Kama et al., 2015). These findings are consistent with calculations such as those shown in Figure 7. Recent studies have confirmed that anomalous HAeBe photospheric compositions are indeed limited to a polluted surface layer (Murphy et al., 2021). Once accretion stops, the contamination signature disappears from the stellar atmosphere on approximately the same timescale as the duration of the accretion (Jermyn & Kama, 2018), one year in the above example where we arbitrarily chose to accrete the whole M⊕ within yr.
From Figure 7, we see that Fe-rich material could be measurable on the star for ongoing accretion at rates as low as M⊙ yr-1. A disrupted Earth-mass moon could supply such a rate for up to yr. We can conclude that much depends on the fate of disrupted exomoon material. If the material accretes onto the star, the lifetime of the accretion disk containing the destroyed exomoon will control whether or not the signature is detectable over a significant amount of time. Our data in Figure 3 rule out a significant enhancement of refractory elements, and thus limit the potential stellar ingestion of any Earth-sized moons of KELT-9b to have ended years ago, where is the time needed for the exomoon material to fall onto the star.
| Parameter | Value | Error | In 9b? | ||
| (K) | |||||
| H | 0.00 | H I | |||
| He | -0.89 | 0.201 | |||
| Li | <-8.01 | ||||
| C | -3.61 | 0.084 | |||
| N | -3.88 | 0.201 | |||
| O | -3.19 | 0.135 | O I | ||
| Na | -5.60 | 0.201 | Na I | ||
| Mg | -4.34 | 0.165 | Mg I | ||
| Al | -5.32 | 0.302 | |||
| Si | -4.33 | 0.165 | |||
| S | -4.53 | 0.302 | |||
| Ca | -5.45 | 0.135 | Ca II | ||
| Sc | -8.85 | 0.154 | Sc II | ||
| Ti | -6.93 | 0.054 | Ti II | ||
| V | -7.73 | 0.401 | |||
| Cr | -6.27 | 0.134 | Cr II | ||
| Mn | -6.88 | 0.402 | |||
| Fe | -4.43 | 0.146 | Fe I, Fe II | ||
| Ni | -5.74 | 0.142 | |||
| Sr | -9.16 | 0.151 | |||
| Y | -9.36 | 0.302 | Y II | ||
| Zr | -9.01 | 0.251 | |||
| Ba | -9.78 | 0.152 |
Notes. Detections of atomic species in the atmosphere of the planet KELT-9b can be found in Yan & Henning (2018) for H; Cauley et al. (2019) for H, H, Mg I; Hoeijmakers et al. (2019) for Na I, Mg I, Sc II, Ti II, Cr II, Fe I, Fe II; Turner et al. (2020) for H and Ca II; and Borsa et al. (2021) for O I.
5 Conclusions
We have measured the currently most comprehensive photospheric composition for the star KELT-9 (HD 195689), including for the first time all nine elements previously detected in its rapidly evaporating ultra-hot Jupiter, KELT-9b.
We observe no significant deviation in any elemental abundance with respect to a sample of similar stars in several open clusters. In spite of the relatively slow mixing processes in the envelopes of A0 stars such as KELT-9, this lack of anomalies is consistent with our calculations for the photospheric contamination fraction using observationally derived evaporation rates for KELT-9b, where we find for hydrogen-dominated material and for iron.
The results also rule out any recent (yr) ingestion by the star of rocky Earth-mass moons lost by the planet. This is in line with calculations of satellite orbital stability in the literature, which suggest that if the hot Jupiter arrived at its present orbit shortly after formation, any such moons would likely have been lost to the star while the system was still a fraction of its current Gyr age.
Our analysis can serve as a template for seeking chemical fingerprints of planetary mass transfer or ingestion in the photospheres of other early-type stars, which can be relatively easily polluted by recently accreted material.
Acknowledgements
The authors thank the anonymous referee and Luca Fossati for their constructive feedback on the manuscript. The authors contributed equally to this work. MK gratefully acknowledges funding from the European Union’s Horizon 2020 research and innovation programme under the Marie Sklodowska-Curie grant agreement No 753799. ASJ thanks the UK Marshall Commission for financial support. The Flatiron Institute is funded by the Simons Foundation. This research is funded by the Gordon and Betty Moore Foundation through Grant GBMF7392. This research was supported in part by the National Science Foundation under Grant No. NSF PHY-1748958. Based on observations obtained through the Gemini Remote Access to CFHT ESPaDOnS Spectrograph (GRACES) at the international Gemini Observatory, a program of NSF’s NOIRLab, which is managed by the Association of Universities for Research in Astronomy (AURA) under a cooperative agreement with the National Science Foundation on behalf of the Gemini Observatory partnership: the National Science Foundation (United States), National Research Council (Canada), Agencia Nacional de Investigación y Desarrollo (Chile), Ministerio de Ciencia, Tecnología e Innovación (Argentina), Ministério da Ciência, Tecnologia, Inovações e Comunicações (Brazil), and Korea Astronomy and Space Science Institute (Republic of Korea). This work was enabled by observations made from the Gemini North telescope, located within the Maunakea Science Reserve and adjacent to the summit of Maunakea. We are grateful for the privilege of observing the Universe from a place that is unique in both its astronomical quality and its cultural significance.
Data Availability
The Gemini/GRACES spectroscopic observations of KELT-9 (HD 195689) are stored and openly accessible in the Gemini Observatory Archive111https://archive.gemini.edu. The FITS files for program GN-2017-DD-1 can be found by searching under PI name “Kama” with the target “HD 195689”. The CAMstars software instrument with its associated data is available on GitHub222https://github.com/adamjermyn/CAMstars..
References
- Asplund et al. (2009) Asplund M., Grevesse N., Sauval A. J., Scott P., 2009, ARA&A, 47, 481
- Barnes & O’Brien (2002) Barnes J. W., O’Brien D. P., 2002, ApJ, 575, 1087
- Borsa et al. (2019) Borsa F., et al., 2019, A&A, 631, A34
- Borsa et al. (2021) Borsa F., Fossati L., Koskinen T., Young M. E., Shulyak D., 2021, Nature Astronomy, 6, 226
- Castelli & Kurucz (2003) Castelli F., Kurucz R. L., 2003, in Piskunov N., Weiss W. W., Gray D. F., eds, IAU Symposium Vol. 210, Modelling of Stellar Atmospheres. p. A20 (arXiv:astro-ph/0405087)
- Cauley et al. (2019) Cauley P. W., Shkolnik E. L., Ilyin I., Strassmeier K. G., Redfield S., Jensen A., 2019, AJ, 157, 69
- Charbonneau & Michaud (1991) Charbonneau P., Michaud G., 1991, ApJ, 370, 693
- Chene et al. (2014) Chene A.-N., et al., 2014, in Navarro R., Cunningham C. R., Barto A. A., eds, Society of Photo-Optical Instrumentation Engineers (SPIE) Conference Series Vol. 9151, Advances in Optical and Mechanical Technologies for Telescopes and Instrumentation. p. 915147 (arXiv:1409.7448), doi:10.1117/12.2057417
- Chené et al. (2021) Chené A.-N., Mao S., Lundquist M., Gemini Collaboration Martioli E., Opera Collaboration Carlin J. L., Usability Testing 2021, AJ, 161, 109
- Folsom et al. (2012) Folsom C. P., Bagnulo S., Wade G. A., Alecian E., Landstreet J. D., Marsden S. C., Waite I. A., 2012, MNRAS, 422, 2072
- Fossati et al. (2011) Fossati L., Folsom C. P., Bagnulo S., Grunhut J. H., Kochukhov O., Landstreet J. D., Paladini C., Wade G. A., 2011, MNRAS, 413, 1132
- Fossati et al. (2018) Fossati L., Koskinen T., Lothringer J. D., France K., Young M. E., Sreejith A. G., 2018, ApJ, 868, L30
- Fossati et al. (2020) Fossati L., et al., 2020, A&A, 643, A131
- Fossati et al. (2021) Fossati L., Young M. E., Shulyak D., Koskinen T., Huang C., Cubillos P. E., France K., Sreejith A. G., 2021, A&A, 653, A52
- Gaudi et al. (2017) Gaudi B. S., et al., 2017, Nature, 546, 514
- Hoeijmakers et al. (2019) Hoeijmakers H. J., et al., 2019, A&A, 627, A165
- Israelian et al. (2001) Israelian G., Santos N. C., Mayor M., Rebolo R., 2001, Nature, 411, 163
- Jermyn & Kama (2018) Jermyn A. S., Kama M., 2018, MNRAS, 476, 4418
- Jura (2015) Jura M., 2015, AJ, 150, 166
- Kama et al. (2015) Kama M., Folsom C. P., Pinilla P., 2015, A&A, 582, L10
- Kupka et al. (1999) Kupka F., Piskunov N., Ryabchikova T. A., Stempels H. C., Weiss W. W., 1999, A&AS, 138, 119
- Kupka et al. (2000) Kupka F. G., Ryabchikova T. A., Piskunov N. E., Stempels H. C., Weiss W. W., 2000, Baltic Astronomy, 9, 590
- Kurucz (1993) Kurucz R. L., 1993, ATLAS9 Stellar Atmosphere Programs and 2 km s-1 Grid, Kurucz CD-ROM No. 13, Smithsonian Astrophys. Obs.
- Landstreet (1988) Landstreet J. D., 1988, ApJ, 326, 967
- Martin et al. (2017) Martin A. J., Stift M. J., Fossati L., Bagnulo S., Scalia C., Leone F., Smalley B., 2017, MNRAS, 466, 613
- McDonough & Sun (1995) McDonough W. F., Sun S. s., 1995, Chemical Geology, 120, 223
- Murphy et al. (2021) Murphy S. J., Joyce M., Bedding T. R., White T. R., Kama M., 2021, MNRAS, 502, 1633
- Nagar et al. (2020) Nagar T., Spina L., Karakas A. I., 2020, ApJ, 888, L9
- Pino et al. (2020) Pino L., et al., 2020, ApJ, 894, L27
- Piskunov et al. (1995) Piskunov N. E., Kupka F., Ryabchikova T. A., Weiss W. W., Jeffery C. S., 1995, A&AS, 112, 525
- Ryabchikova et al. (1997) Ryabchikova T. A., Piskunov N. E., Kupka F., Weiss W. W., 1997, Baltic Astronomy, 6, 244
- Ryabchikova et al. (2015) Ryabchikova T., Piskunov N., Kurucz R. L., Stempels H. C., Heiter U., Pakhomov Y., Barklem P. S., 2015, Phys. Scr., 90, 054005
- Saffe et al. (2021) Saffe C., et al., 2021, A&A, 647, A49
- Thorngren et al. (2016) Thorngren D. P., Fortney J. J., Murray-Clay R. A., Lopez E. D., 2016, ApJ, 831, 64
- Tollestrup et al. (2012) Tollestrup E. V., Pazder J., Barrick G., Martioli E., Schiavon R., Anthony A., Halman M., Veillet C., 2012, in McLean I. S., Ramsay S. K., Takami H., eds, Society of Photo-Optical Instrumentation Engineers (SPIE) Conference Series Vol. 8446, Ground-based and Airborne Instrumentation for Astronomy IV. p. 84462A, doi:10.1117/12.926626
- Turcotte (2002) Turcotte S., 2002, ApJ, 573, L129
- Turcotte & Charbonneau (1993) Turcotte S., Charbonneau P., 1993, ApJ, 413, 376
- Turner et al. (2020) Turner J. D., et al., 2020, ApJ, 888, L13
- Wade et al. (2001) Wade G. A., Bagnulo S., Kochukhov O., Land street J. D., Piskunov N., Stift M. J., 2001, A&A, 374, 265
- Wyttenbach et al. (2020) Wyttenbach A., et al., 2020, A&A, 638, A87
- Yan & Henning (2018) Yan F., Henning T., 2018, Nature Astronomy, 2, 714