The cavity of 3CR 196.1: H emission spatially associated with an X-ray cavity
Abstract
We present a multifrequency analysis of the radio galaxy 3CR 196.1 (), associated with the brightest galaxy of the cool core cluster CIZAJ0815.4-0303. This nearby radio galaxy shows a hybrid radio morphology and an X-ray cavity, all signatures of a turbulent past activity, potentially due to merger events and AGN outbursts. We present results of the comparison between Chandra and VLT/MUSE data for the inner region of the galaxy cluster, on a scale of tens of kpc. We discovered H + [N II] emission spatially associated with the X-ray cavity (at 10 kpc from the galaxy nucleus) instead of with its rim. This result differs from previous discoveries of ionized gas surrounding X-ray cavities in other radio galaxies harbored in galaxy clusters and could represent the first reported case of ionized gas filling an X-ray cavity, either due to different AGN outbursts or to the cooling of warm ( K) AGN outflows. We also found that the H, [N II] and [S II] emission lines show an additional redward component, at 1000 km s-1 from rest frame, with no detection in H or [O III]. We believe the most likely explanation for this redward component is the presence of a background gas cloud since there appears to be a discrete difference in velocities between this component and the rest frame.
1 Introduction
The extragalactic fraction of the Third Cambridge Catalog of radio sources and its revised versions (3C, 3CR, 3CRR, Edge et al. 1959; Bennett 1962; Spinrad et al. 1985; Laing et al. 1983) constitute one of the most valuable samples of powerful radio-loud active galactic nuclei (AGN) to explore feedback processes occurring between radio galaxies and their environments (see, e.g., McNamara & Nulsen 2007, 2012, Fabian 2012 and Kraft et al. 2012).
One of the main pieces of evidence of radio mode feedback occurring in AGN in galaxy clusters and groups is the presence of X-ray cavities, first reported by Böhringer et al. (1996) and Churazov et al. (2000), due to the interaction of jets with the intracluster medium (ICM; see reviews by McNamara & Nulsen 2007, Fabian 2012 and Gitti et al. 2012, and works by Bîrzan et al. 2004, Cavagnolo et al. 2010, and McNamara & Nulsen 2012). Some of the most remarkable examples of cavities include those of Perseus (see Fabian et al. 2003, 2006 and Graham et al. 2008), M87 (see e.g., Forman et al. 2005, 2017), Hydra A (Nulsen et al. 2005a), Hercules A (Nulsen et al. 2005b), MS0735.6+7421 (McNamara et al. 2005, 2009), NGC 5813 (Randall et al. 2011, 2015), A2052 (Blanton et al. 2011), A2597 (Tremblay et al. 2012), and NGC 4636 (Jones et al. 2002).
Although it is common to find H emission either surrounding X-ray cavities (see e.g., Blanton et al. 2011, Tremblay et al. 2015, Balmaverde et al. 2018), or spatially associated with radio emission (known as the “alignment effect”; see e.g., Fosbury 1986, Hansen et al. 1987, Baum et al. 1988, McCarthy 1988, Baum et al. 1990, Tremblay et al. 2009 and Baldi et al. 2019), the effect of radio jets on extended emission-line regions (EELR, regions of line-emitting gas on scales of tens of kpc, see e.g., Baum et al. 1988) is not yet fully understood.
A recent analysis of radio, optical, and X-ray emission in 3CR 196.1 showed it is a promising source to investigate how radio jets affect EELRs, thanks to the discovery of an X-ray cavity at 10 kpc from the nucleus toward the southwest (see Ricci et al. 2018). Moreover, recent observations from the Multi-Unit Spectroscopic Explorer (MUSE; Bacon et al. 2010) at the Very Large Telescope (VLT) obtained as part of the MUse RAdio Loud Emission line Snapshot (MURALES) survey (Balmaverde et al. 2021) revealed that the H + [N II] emission extends beyond the radio emission and appears, in projection, spatially associated with the X-ray cavity.
To test where such optical emission stands with respect to the X-rays, we compared the optical, X-ray, and radio emission of 3CR 196.1 up to a few tens of kpc, taking advantage of new VLT/MUSE observations. This emission had not been detected in previous HST data originally published in Tremblay et al. (2009), due to HST’s lower sensitivity compared to MUSE. This spatial association of ionized gas with an X-ray cavity, instead of with its borders has been rarely reported in the literature (see e.g., A1668, Pasini et al. 2021). We focus on the comparison of X-ray and optical observations, previously investigated only separately by Ricci et al. (2018) and Balmaverde et al. (2021), respectively.
This manuscript is organized as follows. A brief description of 3CR 196.1 is given in § 2. Astrometric registration of all images is reported in § 3, together with details about data reduction procedures for optical and X-ray data sets. Results and their discussion are presented in § 4 and § 5, respectively, while § 6 is devoted to our conclusions. Further details on the astrometric registration and the ionized gas kinematics can be found in Appendices A and B.
We adopted cgs units for numerical results and assumed a flat cosmology with km s-1 Mpc-1, and (Bennett et al., 2014), unless otherwise stated. At the source redshift (i.e., ) the physical scale is 3.299 kpc/arcsec. Standard astronomical orientation (north upwards and east to the left) is adopted throughout the paper.
2 The strange case of 3CR 196.1
3CR 196.1 is the radio galaxy associated with the brightest cluster galaxy of the galaxy cluster CIZA J0815.4-0303 (Kocevski et al. 2007). From an optical perspective, this radio galaxy is classified as a low-excitation radio galaxy (Buttiglione et al. 2010), while at radio frequencies it presents a hymor radio structure (see Gopal-Krishna & Wiita 2000), with a classical edge-darkened morphology, typical of FR Is, toward the southwest and a radio lobe, typical of FR IIs on the opposite side (Fanaroff & Riley 1974).
Near-infrared (Madrid et al. 2006) and optical continuum observations (Baum et al. 1988; de Koff et al. 1996) revealed that the host galaxy of 3CR 196.1 shows an elliptical morphology elongated from northeast to southwest, in the same direction as the radio jet. Optical images also revealed the presence of periodic shells possibly due to past merger events (Zirbel 1996), in agreement with centroid shifts measured using optical isophotes of its host galaxy (de Koff et al. 1996). Additionally, using HST emission line images, Baldi et al. (2019) measured a lower limit for the total ionized gas mass for 3CR 196.1 of 3.5105 M⊙, using the nuclear electron density. The analysis of newly obtained MUSE data focused on the [O III] properties by Speranza et al. (2021) revealed a broad blue [O III] component with a maximum velocity of -640 km s-1, extending toward the northeast, in the same direction as the radio jet.
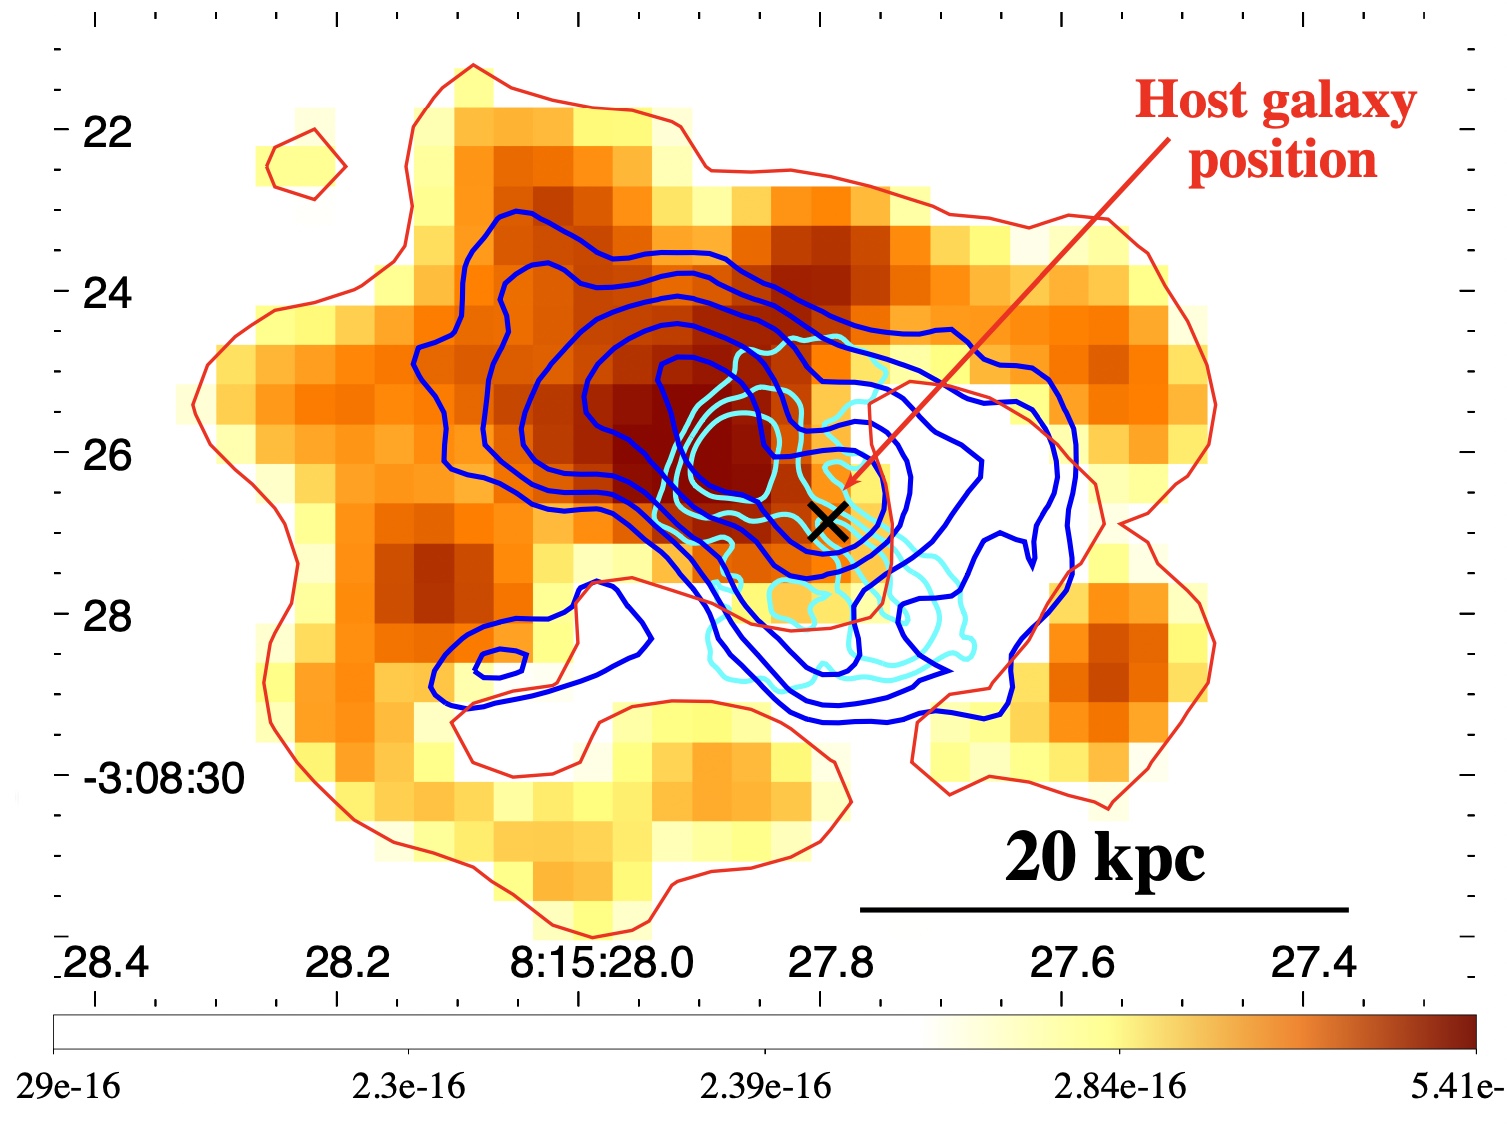
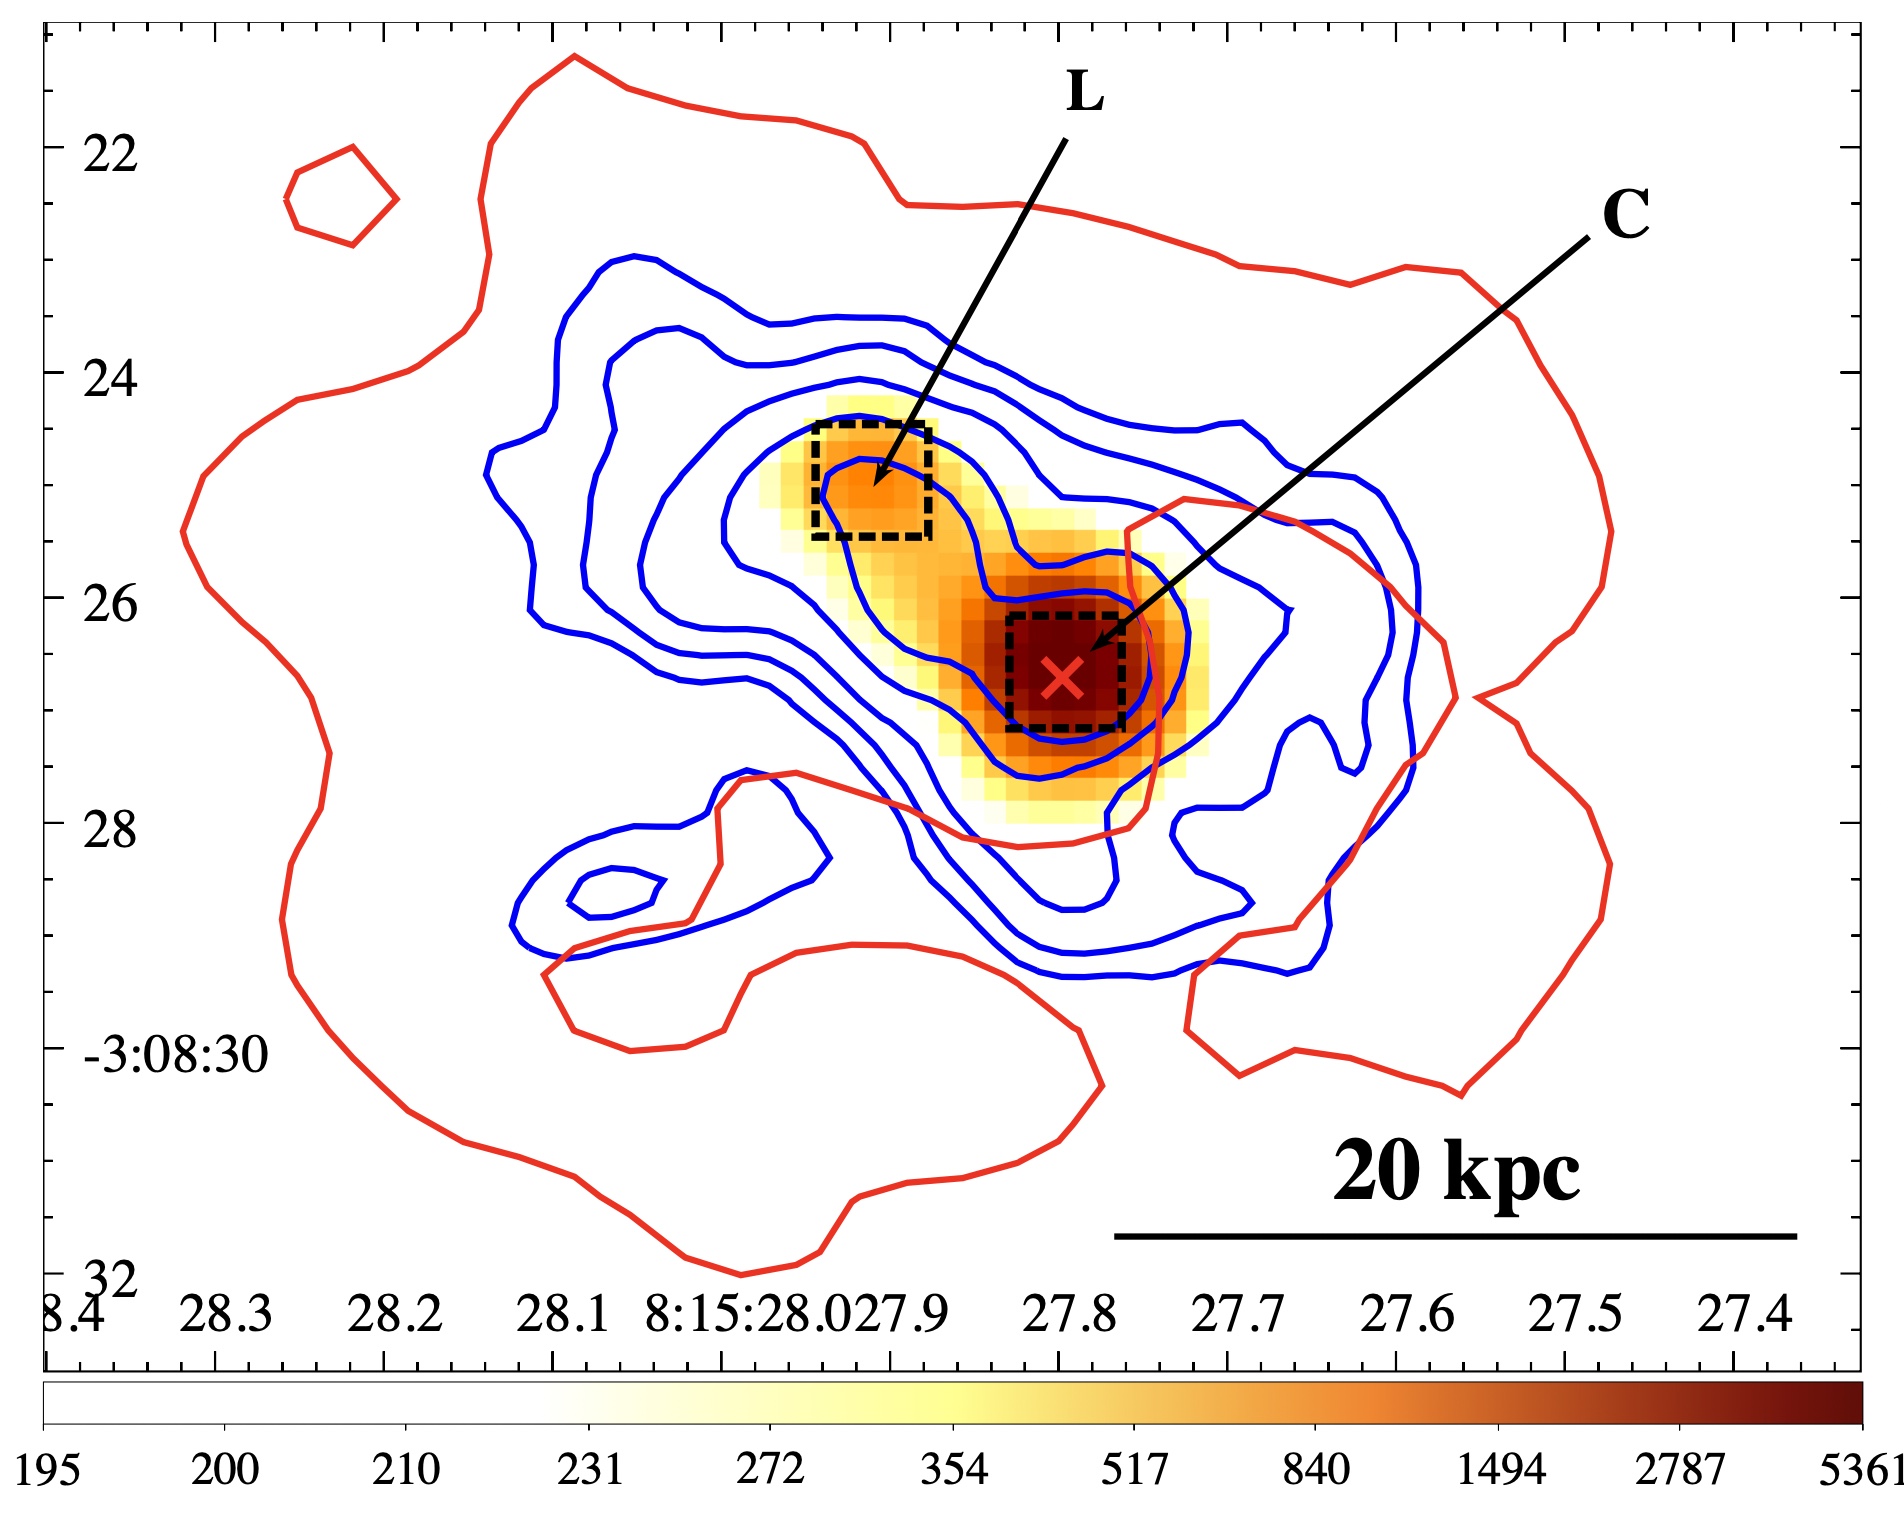
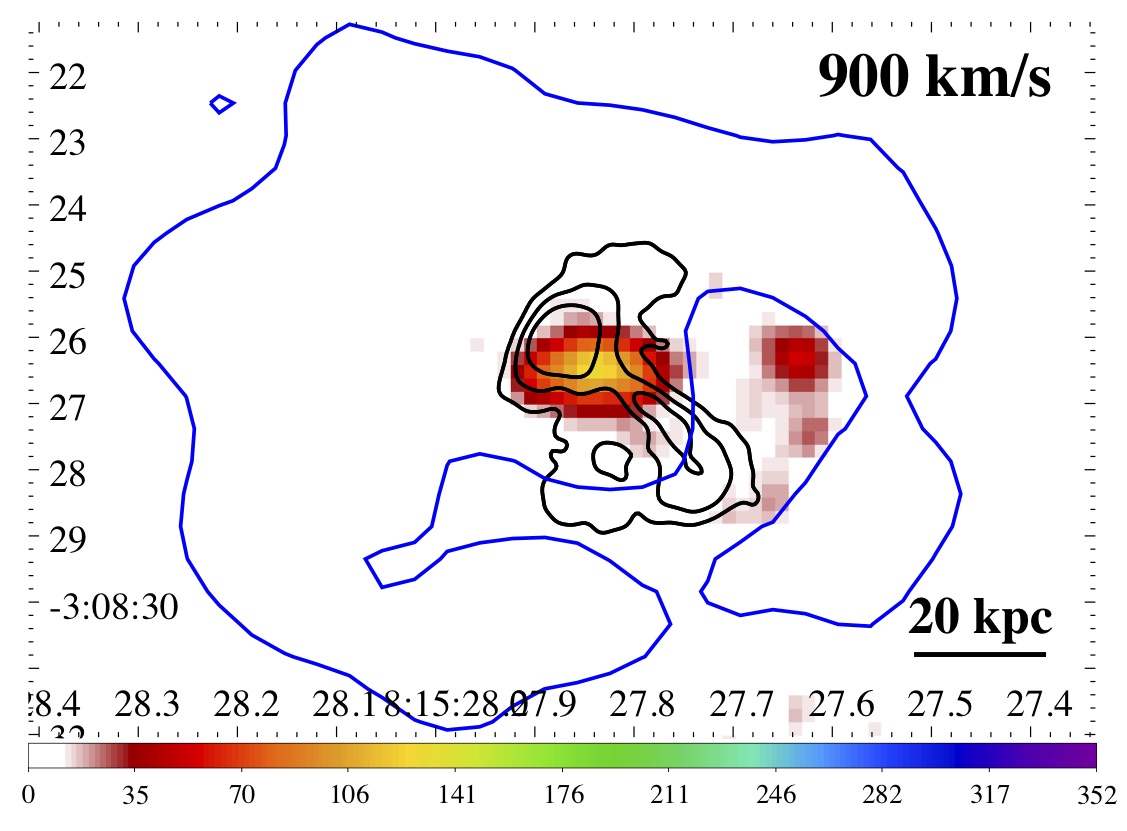
Ricci et al. (2018) confirmed the presence of an X-ray surface brightness depression, previously suggested by Massaro et al. (2012), by carrying out a multiwavelength analysis of archival radio, optical, and X-ray observations. This surface brightness depression indicates the presence of a “butterfly-shaped” cavity at 10 kpc from the nucleus (see left panel of Fig. 1). The temperature of the galaxy cluster (4.2 keV) drops to 2.8 keV in the inner 30 kpc, suggesting that 3CR 196.1 is the brightest cluster galaxy of a cool core cluster.
At scales of tens of kpc, the H + [N II] emission observed with the Hubble Space Telescope is spatially aligned with the radio jet and lies in the base of the X-ray cavity. Lastly, Ricci et al. concluded that 3CR 196.1 could be an example where cold gas is being uplifted by radio lobes and that it could have undergone several AGN outbursts at multiple epochs. They also suggested its galaxy cluster may have experienced a merger episode, revealed by the spiral pattern seen in the X-ray observation, characteristic of gas sloshing (see, e.g., Markevitch & Vikhlinin 2007).
3 Data analysis procedures
X-ray data employed for this work are 8 ks archival Chandra observations (ObsID 12729). The MUSE dataset was obtained from the MURALES survey (ID 0102.B-0048(A); two 10 minute exposures). Details on these observations as well as on the Chandra and MUSE data reduction and analyses can be found in Ricci et al. (2018) and Balmaverde et al. (2021), respectively.
3.1 Astrometric registration
Astrometric registration was carried out by comparing 8.4 GHz Very Large Array (VLA111https://science.nrao.edu/facilities/vla/archive/index), Pan-STARRS222https://catalogs.mast.stsci.edu/panstarrs/ -band, MUSE, and Chandra images. An image showing the sources used for the registration can be found in Appendix A.
We decided against registering the Chandra image since the nucleus of 3CR 196.1 is not detected in the Chandra image and the typical shift applied to Chandra images is 0.7″ (Massaro et al. 2011), which corresponds to a shift of less than 2 pixels in our X-ray images and, thus, it is sufficiently accurate for our comparison. Additionally, no registration was performed on the radio since the radio core is not detected in the available radio maps and their positional uncertainty is (adopting a conservative VLA uncertainty of 10% of the beam size333https://science.nrao.edu/facilities/vla/docs/manuals/oss/performance/positional-accuracy). Thus, the final astrometric registration of MUSE data relied on the Pan-STARRS -band image since all sources in the MUSE data were also detected in Pan-STARRS. A detailed description of the strategy adopted to register the data can be found in Appendix A.
.
3.2 Chandra data analysis
We performed the X-ray data reduction following the standard procedures of the Chandra Interactive Analysis of Observations (CIAO; Fruscione et al. 2006) v4.11 threads444http://cxc.harvard.edu/ciao/threads/, adopting the Chandra Calibration Database v4.8.4.1 (for an in-depth analysis of the X-ray observation see Ricci et al. 2018).
X-ray flux maps were created by taking into account the exposure time and the effective area. X-ray maps presented in this work were restricted to 0.7 - 2 keV to highlight the soft diffuse X-ray emission by using monochromatic exposure maps set to the nominal energies of 1.2 keV. The flux map was converted from units of counts s-1 cm-2 to cgs units by multiplying each event by the nominal energy of the band, assuming that every event in the same band has the same energy (see Massaro et al. 2015).
3.3 MUSE data analysis
Regarding the MUSE data analysis, we obtained the fully reduced data cube from the ESO archive555http://archive.eso.org/scienceportal/home. We measured the redshift by using the Penalized Pixel-Fitting code (Cappellari 2017) to fit the stellar continuum and absorption features in a 2″ radius circular region centered on the host position. Following this procedure, we measured a value for the redshift of , which we adopted throughout our analysis.
3.3.1 Large scale ionized gas
We subtracted the continuum spaxel by spaxel from the archival MUSE reduced data in two different ranges, blue range, from 5370 to 6170 , and red range, from 7170 to 8680 , by fitting the continuum in each range using a power law. We fitted the H and [O III] lines in the continuum subtracted blue range and the [O I], H, [N II] and [S II] lines in the continuum subtracted red range. In general, we fitted each line with a single Gaussian component, fixing the wavelength separation between lines as well as the line ratio of [N II] and [O III] components, to their theoretical value of 1/3 (adopting CASE B, see Osterbrock & Ferland 2006).
3.3.2 Central region
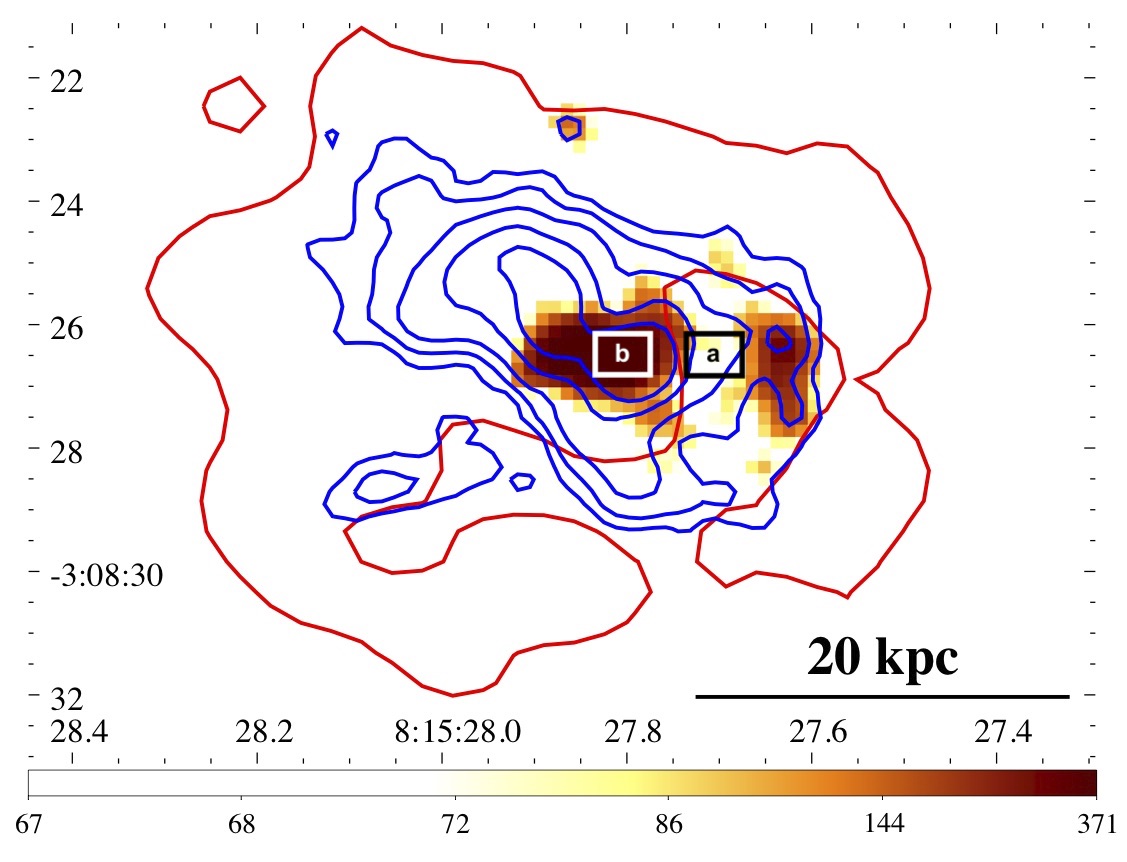
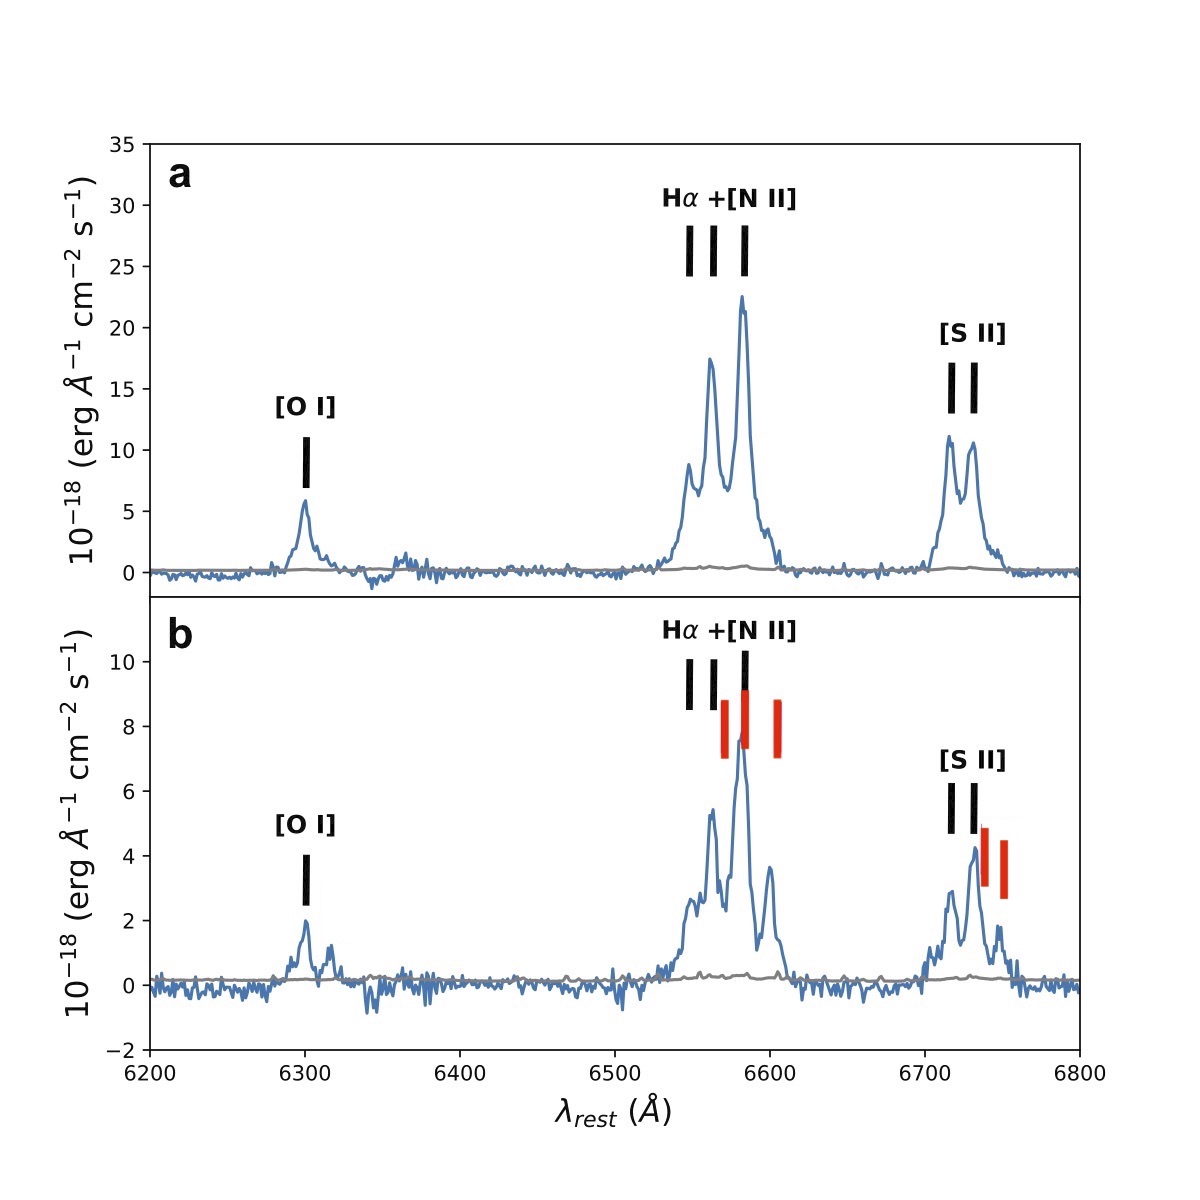
Although a single Gaussian was adequate to fit the spectral components in most spaxels, we found that the spectra in the central area and the X-ray cavity region have additional components in H, [N II] and [S II]. The position of the redward [N II] emission is shown in the right panel of Fig. 1.
To illustrate these redward components, we chose two regions in the central area of 3CR 196.1, regions a and b, shown in the right panel of Fig. 1. Both these regions were chosen to be close to the central region so the signal-to-noise was the highest and with sizes large enough to match the seeing (i.e., 1″), but not so large that the kinematics of the ionized gas would compromise the identification of the different spectral components. Additionally, region a was chosen to contain only a single spectral feature for each emission line, while region b was chosen to illustrate a region with both “rest-frame” and redward components.
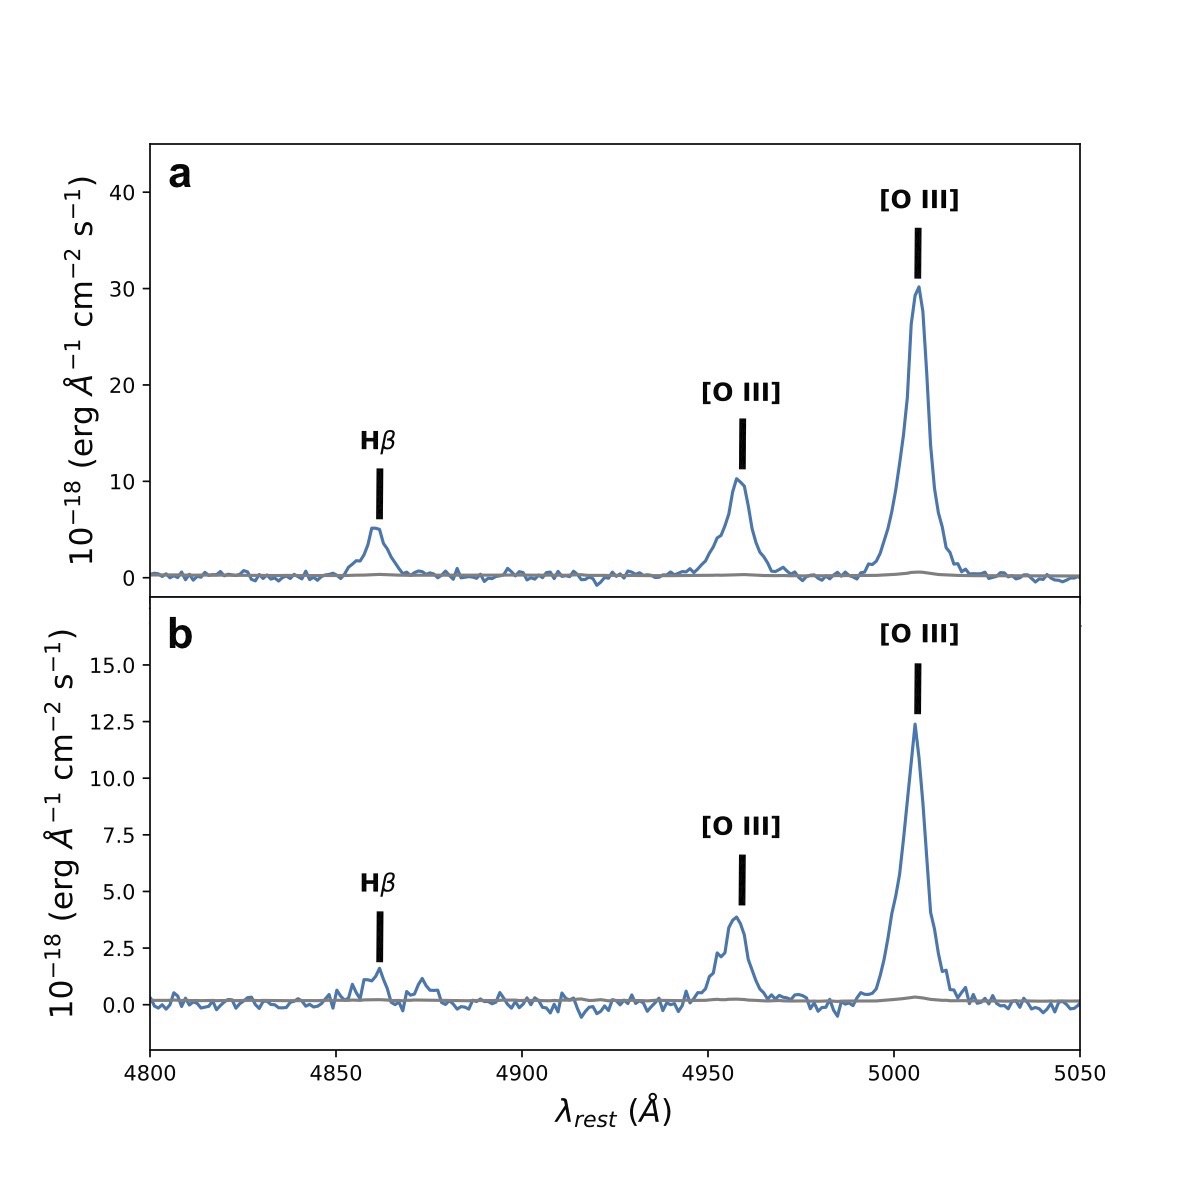
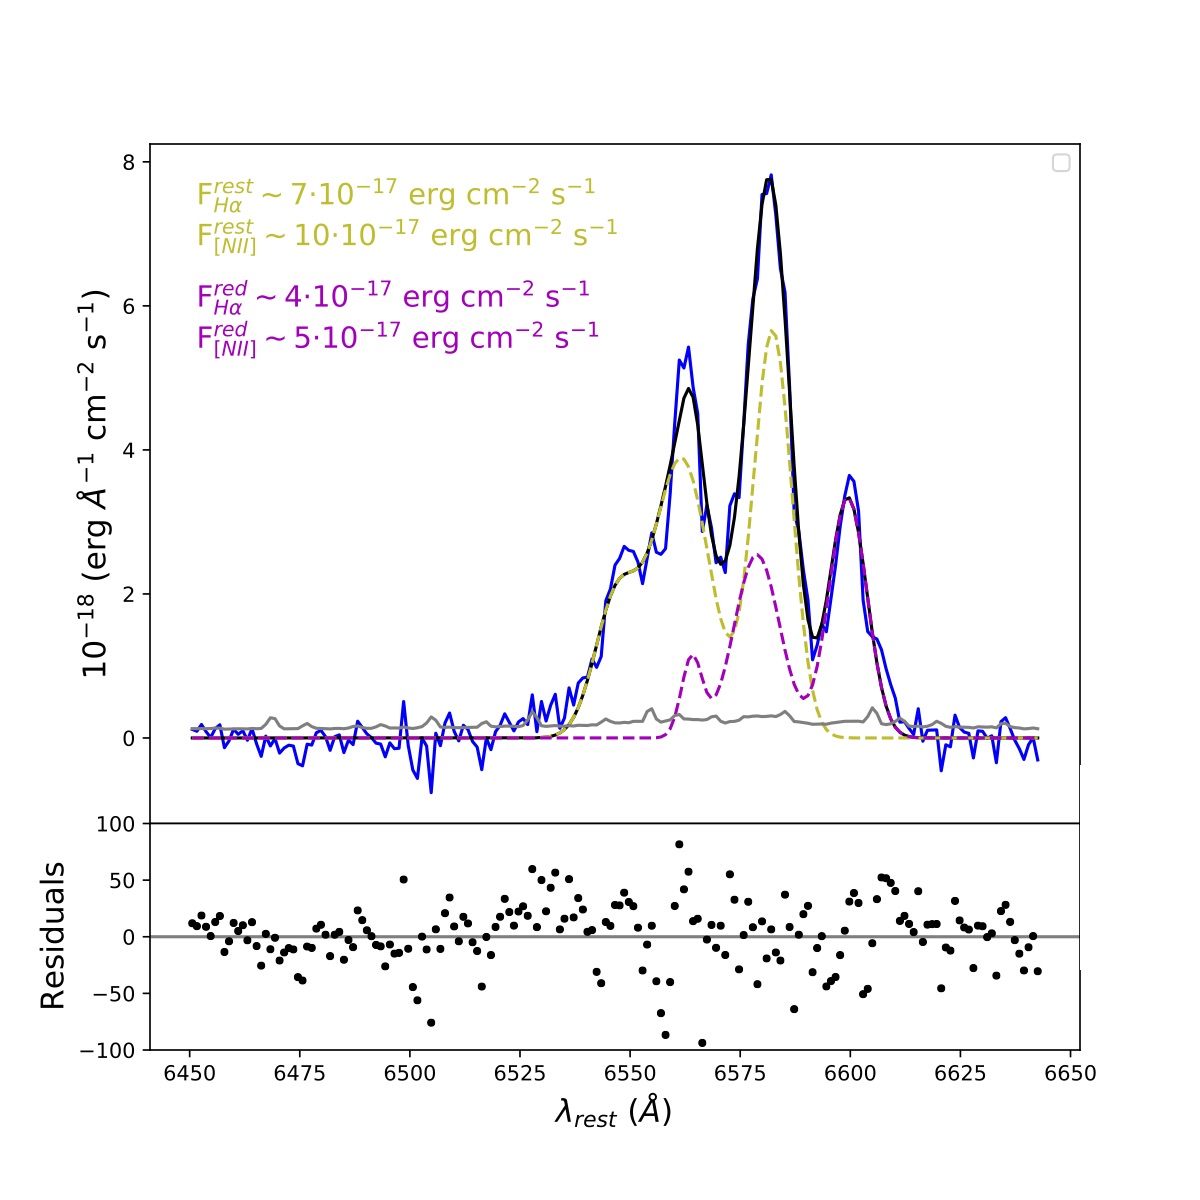
A comparison of the spectra extracted from regions a and b is shown in Fig. 2, where the rest-frame wavelengths of lines are marked in black and those of the redward components are marked in red. Although there appear to be possible additional spectral features corresponding to the H and [O I] lines, these components are not detected (with a significance below 2). The spectral position of the reward components in region b in Fig. 2 corresponds to 21 (i.e., 1000 km s-1) from rest-frame and was derived on the basis of the spectral fit performed on the spectrum extracted from region b. This fit, shown in Fig. 3, was performed using two H + [N II] triplets, one at rest-frame and one redshifted by 21 , and shows how the spectrum from region b cannot be reproduced without introducing an additional redward component.
These redshifted spectral features are spectrally blended with emission at the systemic redshift, i.e., the redward and “rest-frame” components have an offset consistent with the separation between the H and the [N II] lines (see Fig. 2). This offset, together with the fact that this redward component overlaps, in projection, with the AGN emission as well as with the low signal-to-noise of the [N II] line, introduces a degeneracy in the intensities of the H, [N II] and [S II] lines that we cannot break without knowing a priori the ionization status of the source and the density of the gas. Thus, the limited spectral (50 km s-1) and spatial (1″) resolutions of MUSE cubes prevent us from breaking the degeneracy, and from providing a thorough analysis of the kinematics and ionization state of the gas.
4 Results
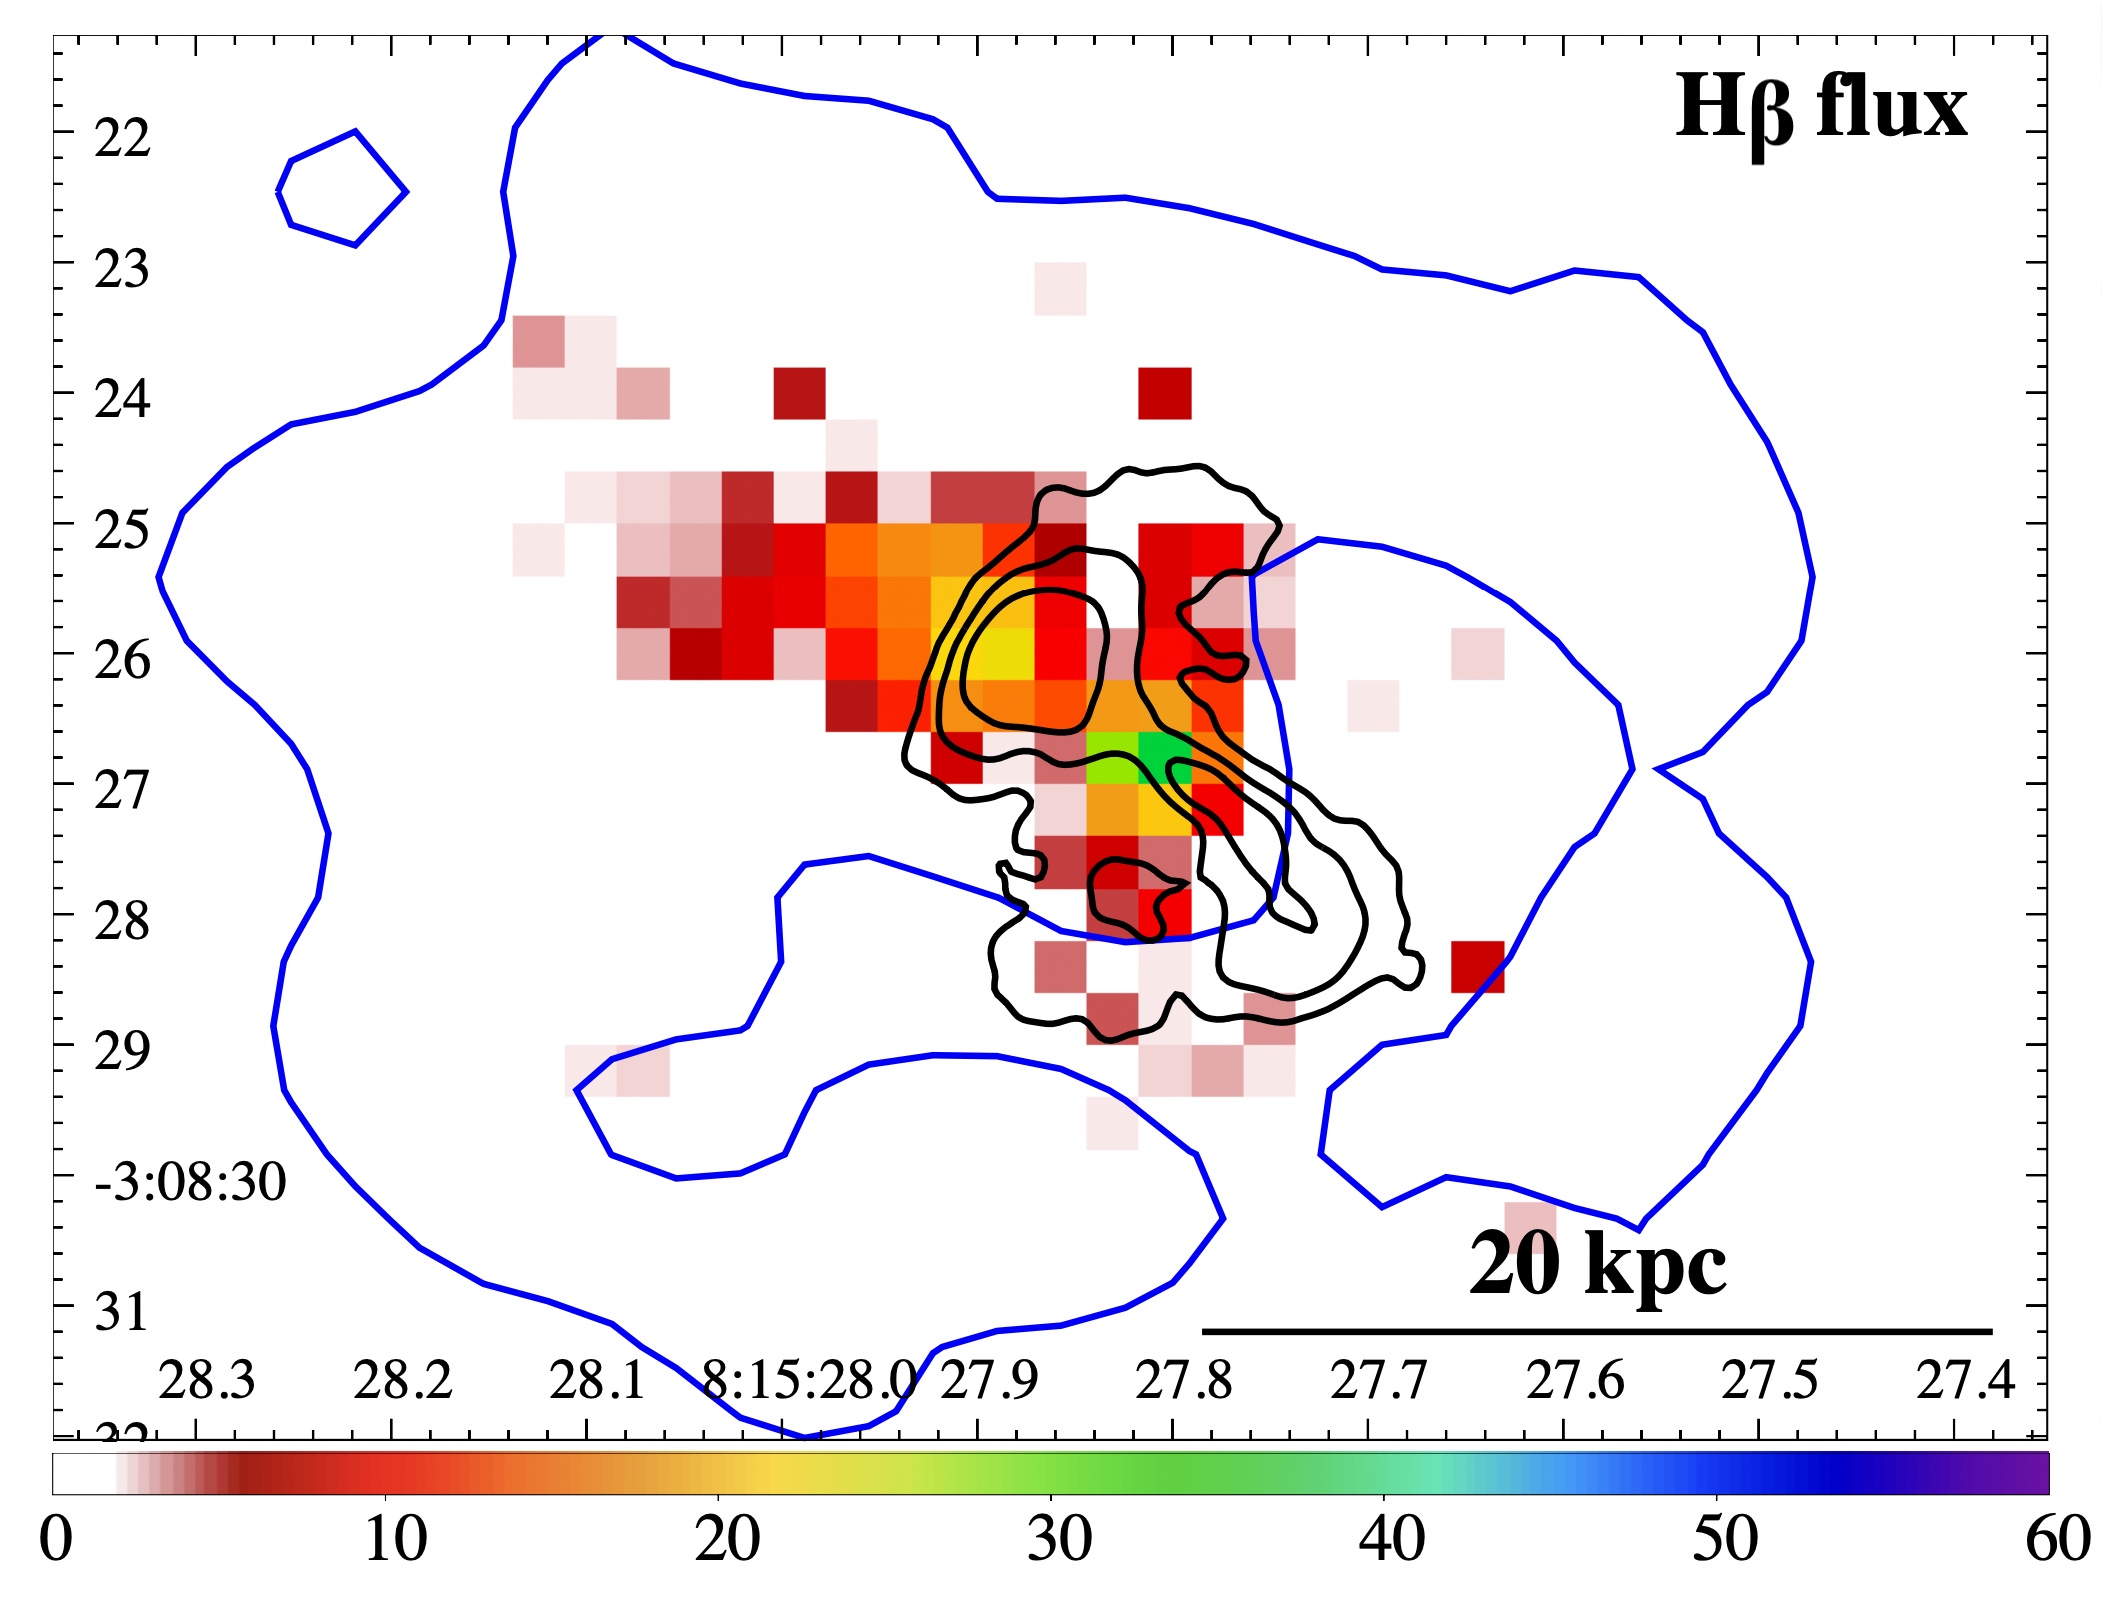
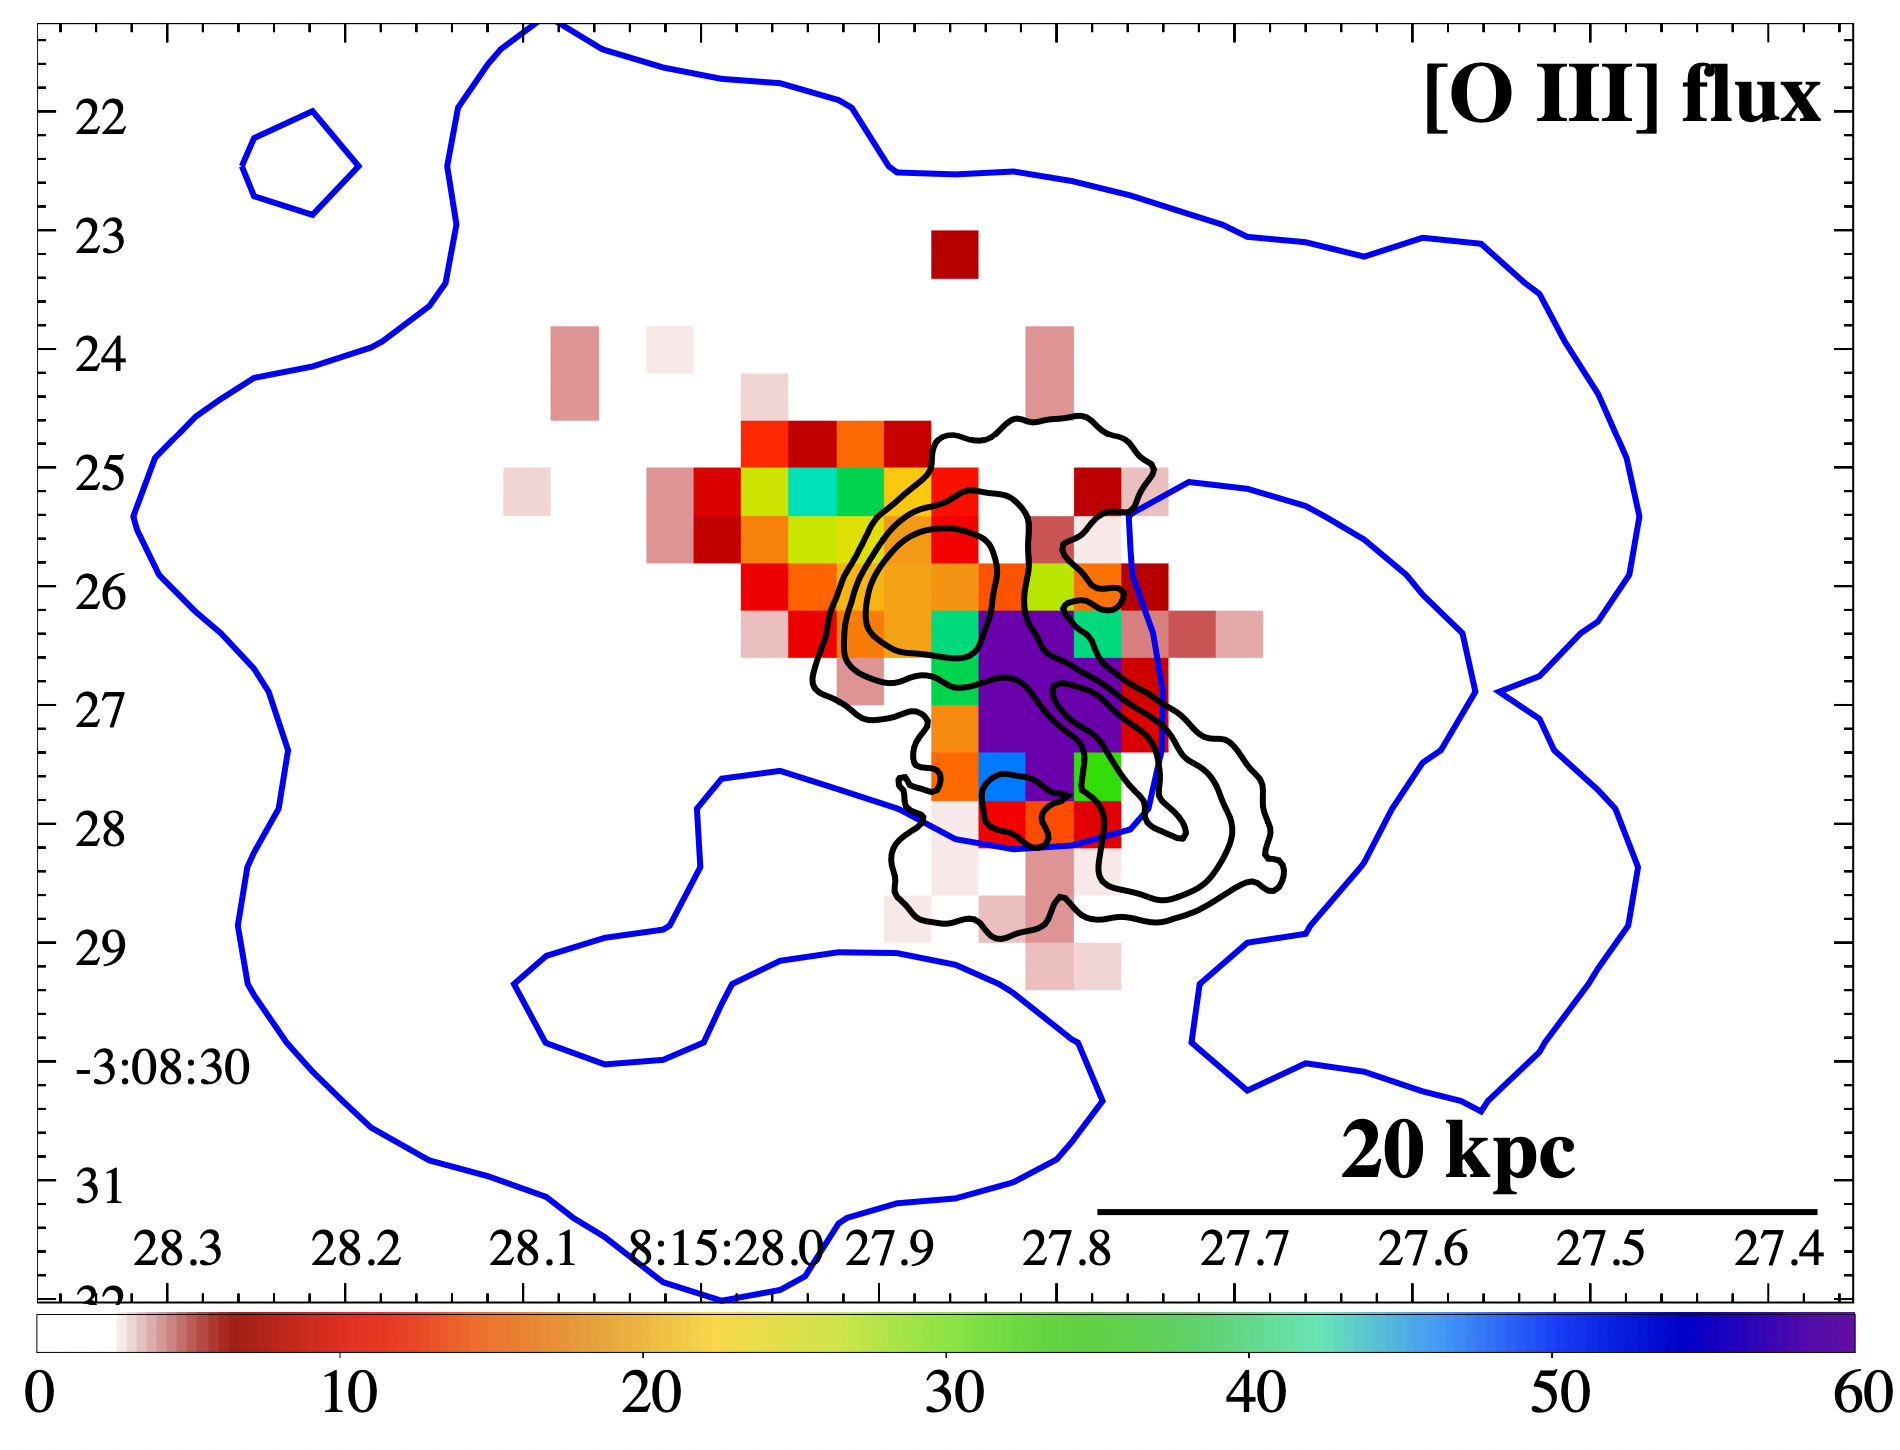
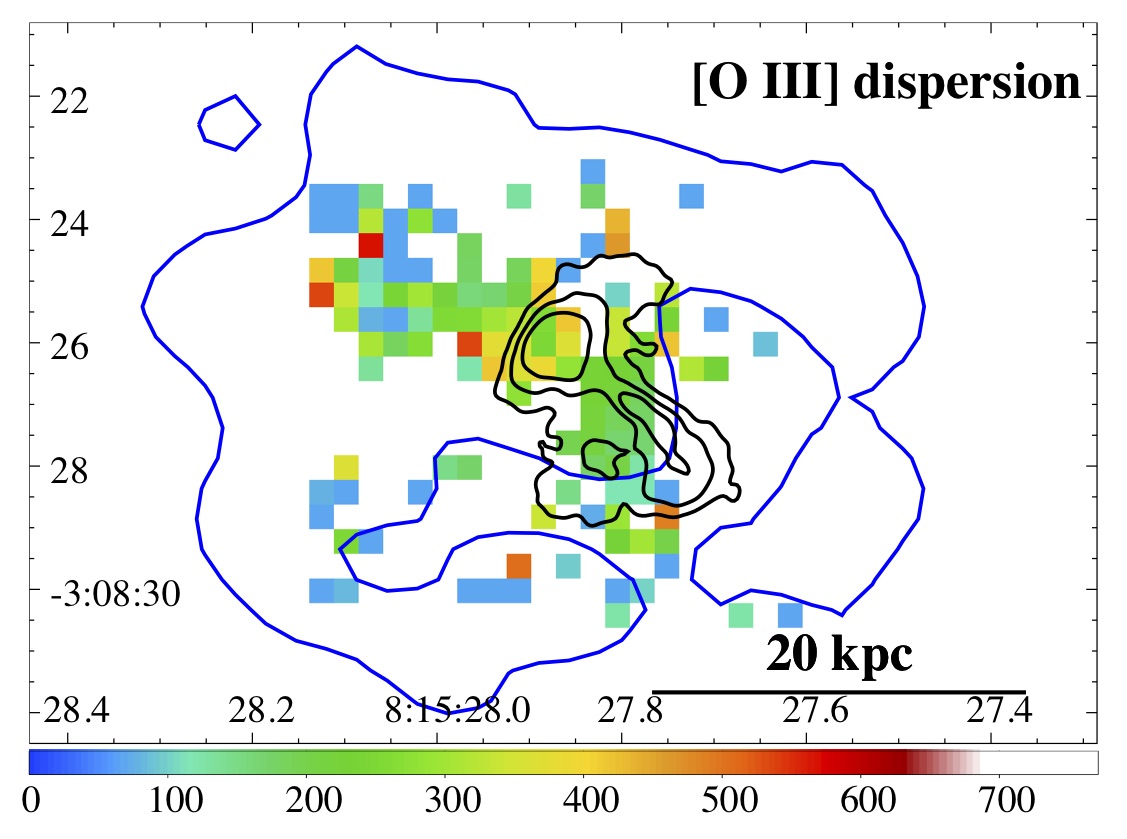
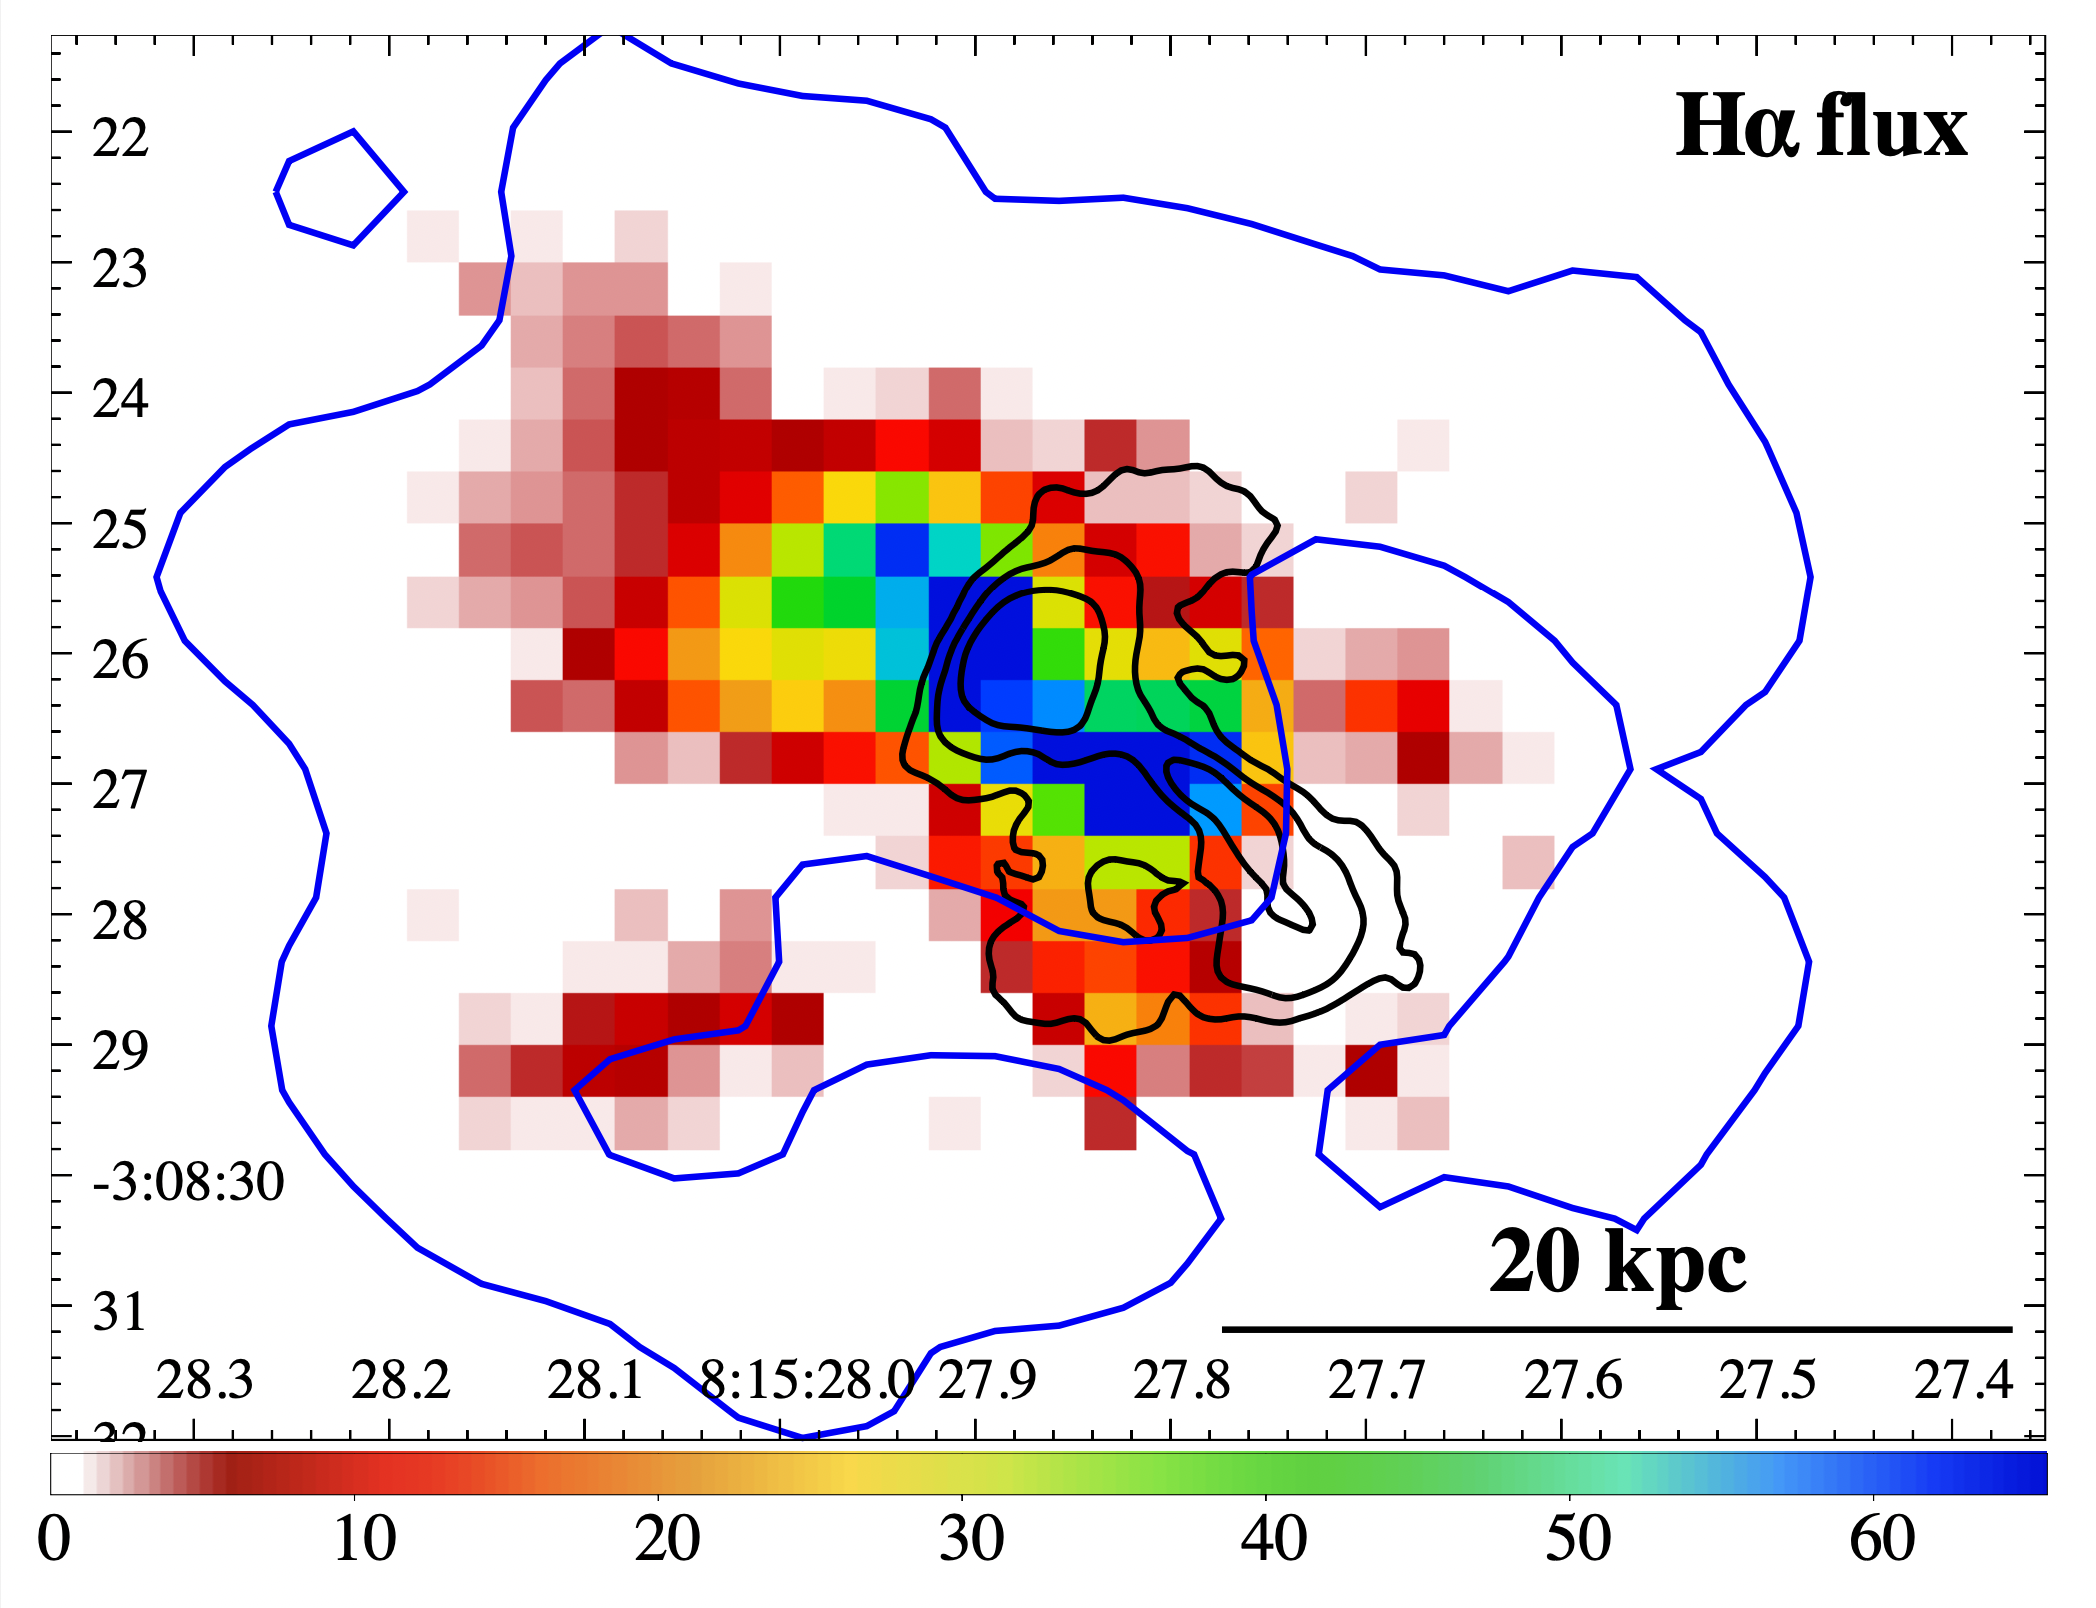
We detected H+[N II] emission spatially associated with the X-ray cavity (see left panel of Fig. 1) and, at the same time, did not detect H or [O III] emission in the X-ray cavity region (see left panel of Fig. 4). A comparison between X-ray and H+[N II], [O III], and [S II] is shown in the left panel of Fig. 1 and the left and right panels of Fig. 4, respectively. Additionally, flux maps, velocity, and velocity dispersion maps for all emission lines in the MUSE observed range are shown in Fig. 8, Appendix B.
The morphology of the H+[N II] hints at differences in the density of the environment. In particular, the northeastern component (region L in the left panel of Fig. 4) being co-spatial with the northeastern radio lobe and with the highest X-ray surface brightness peak indicates a denser environment toward the northeast than toward the southwest, where the X-ray cavity is located.
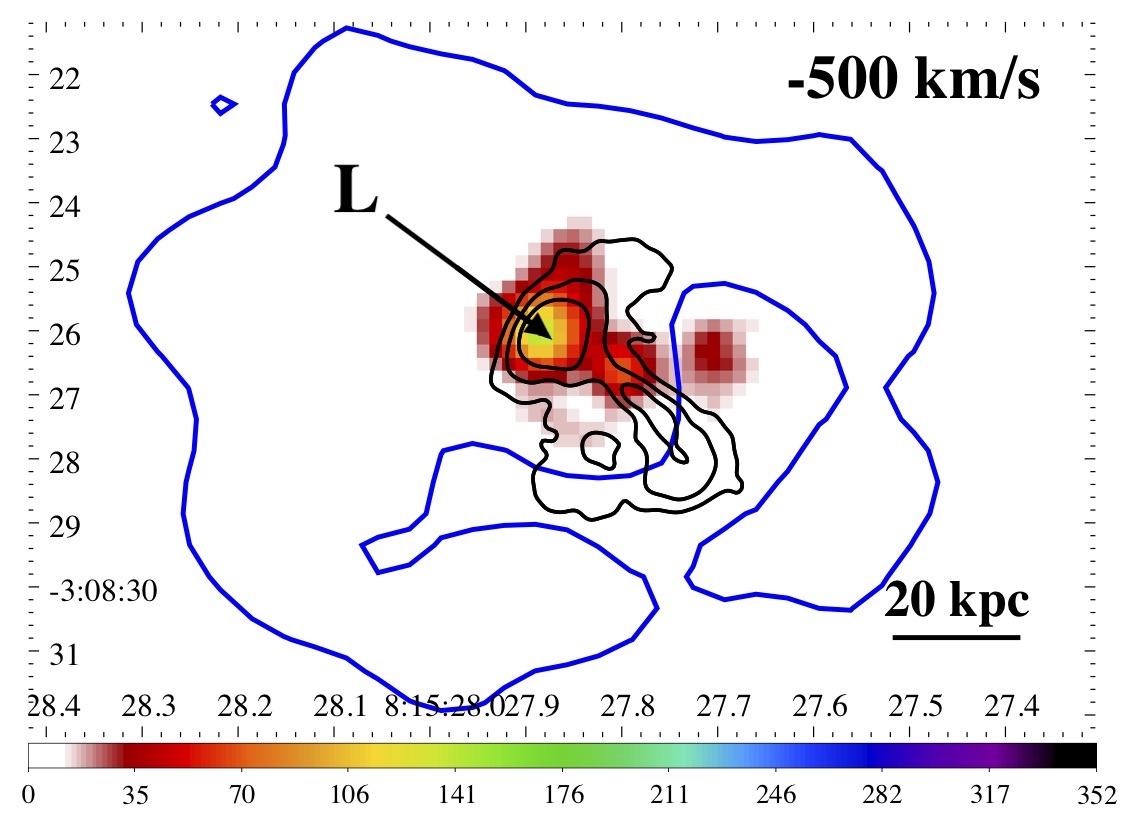
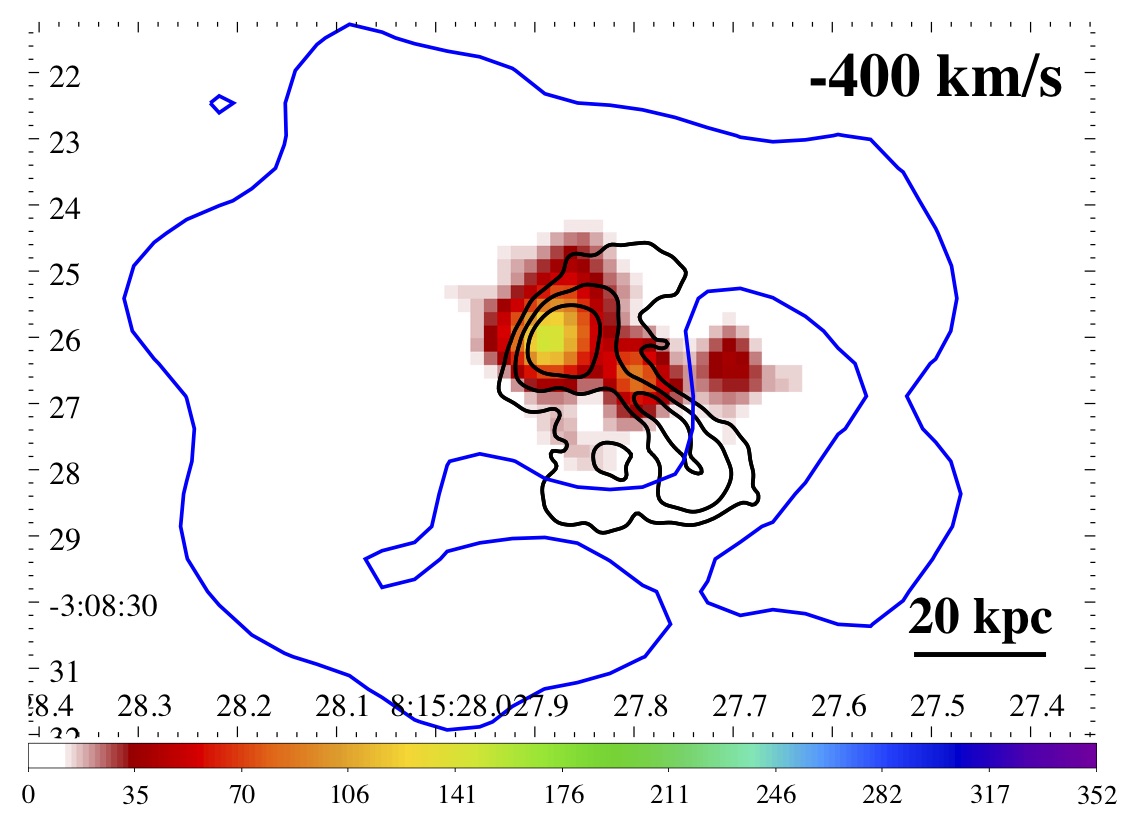
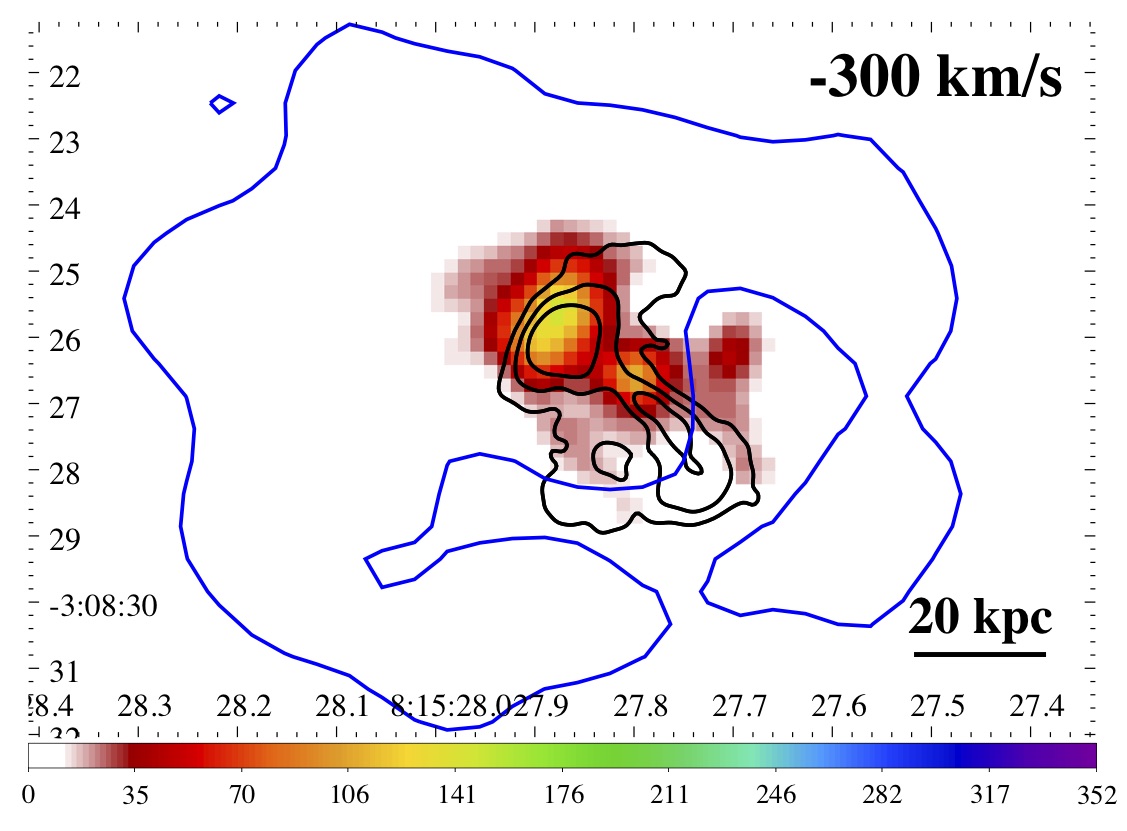
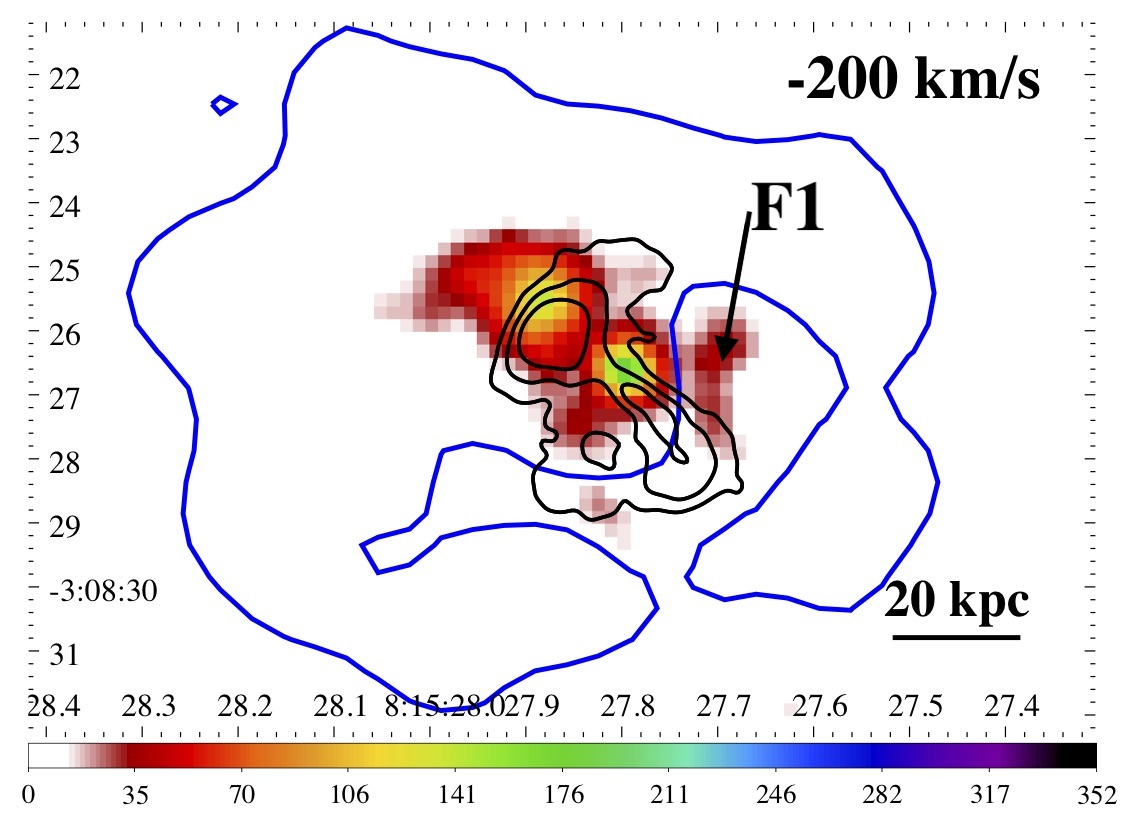
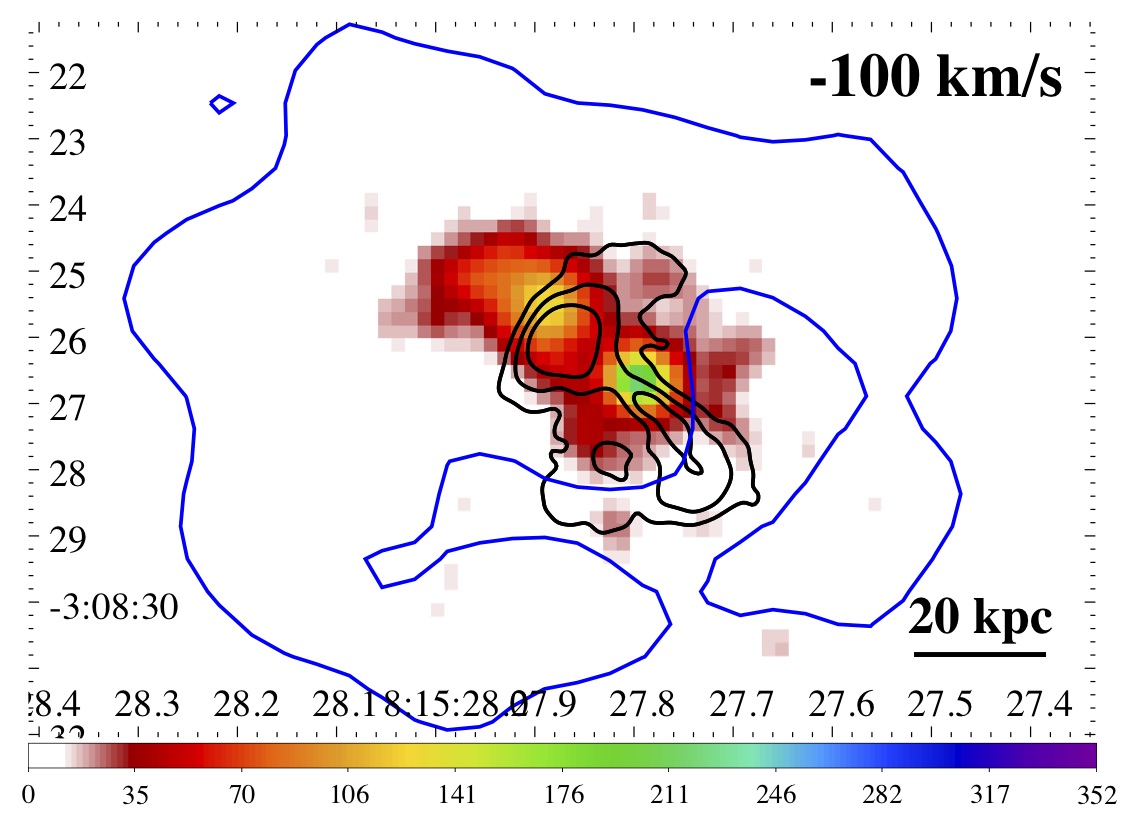
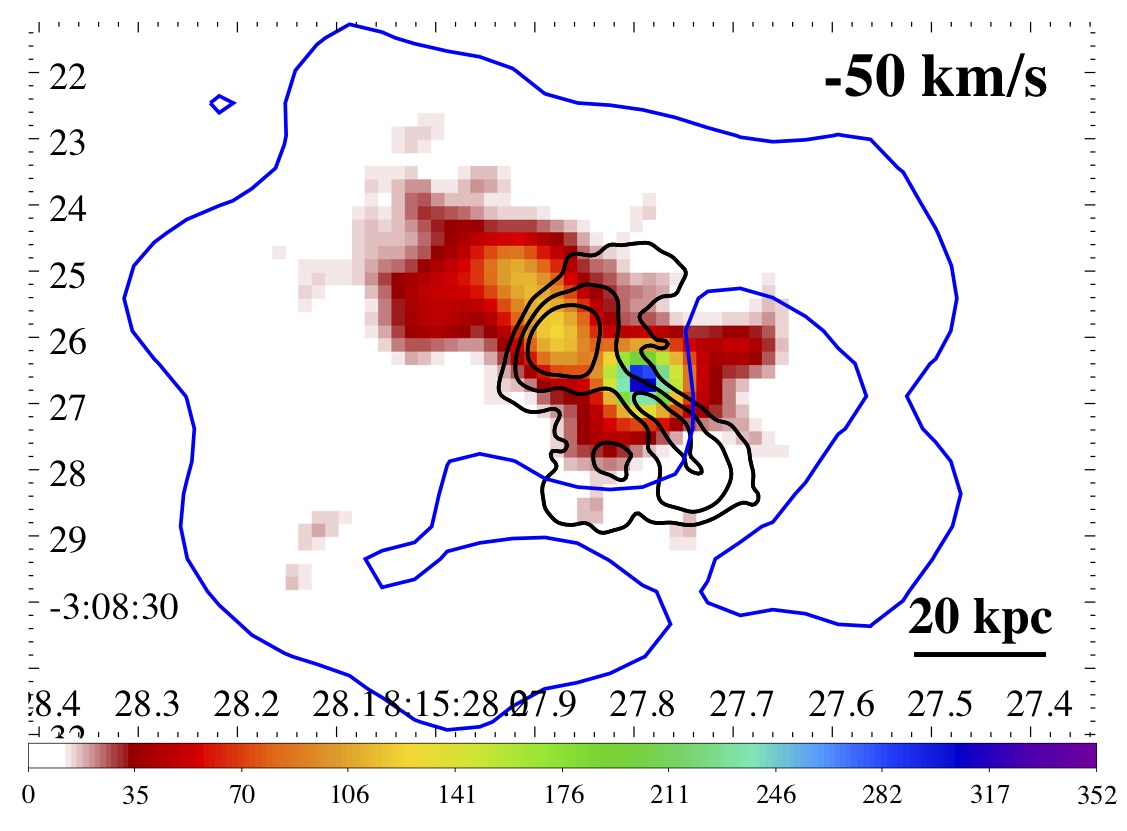
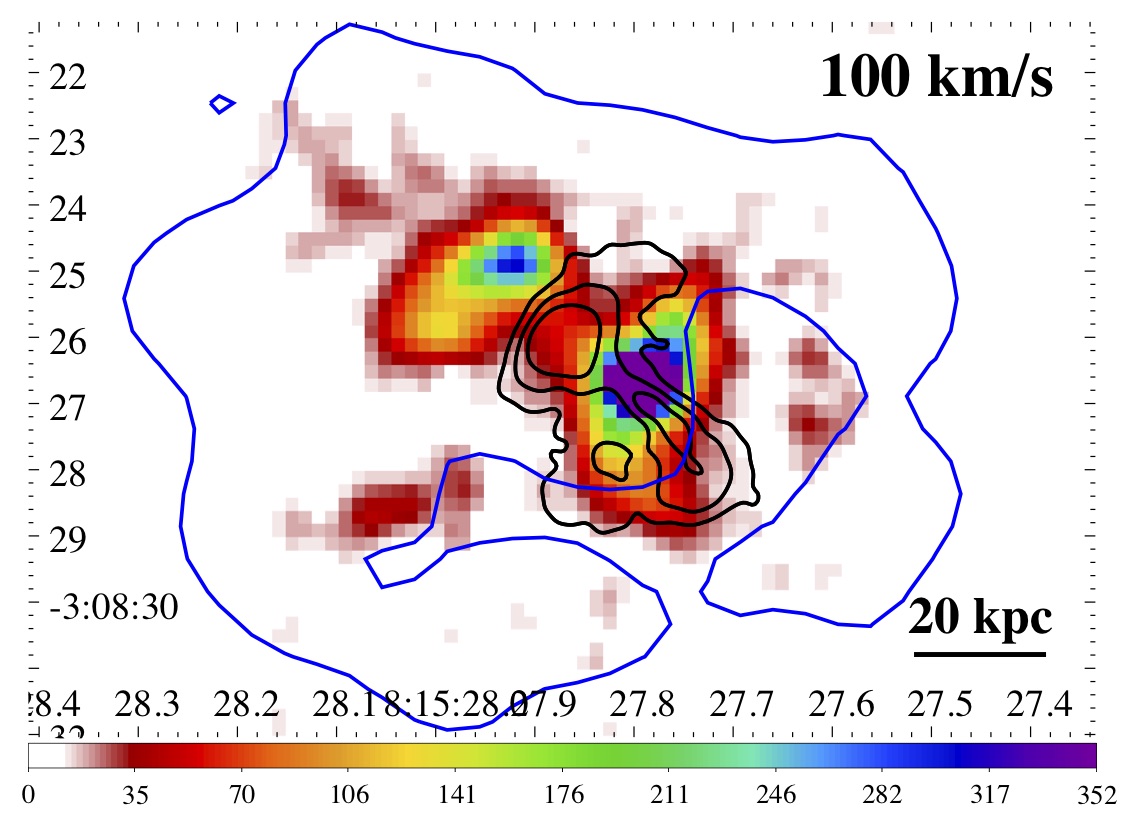
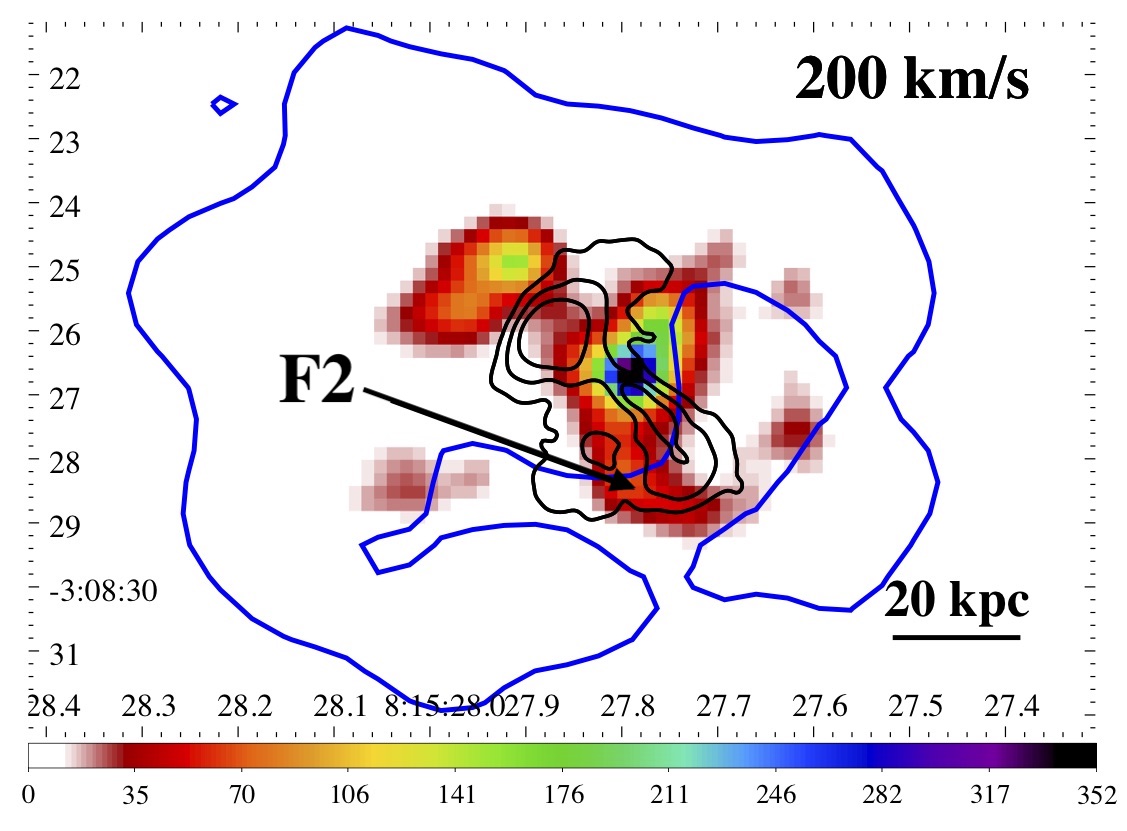
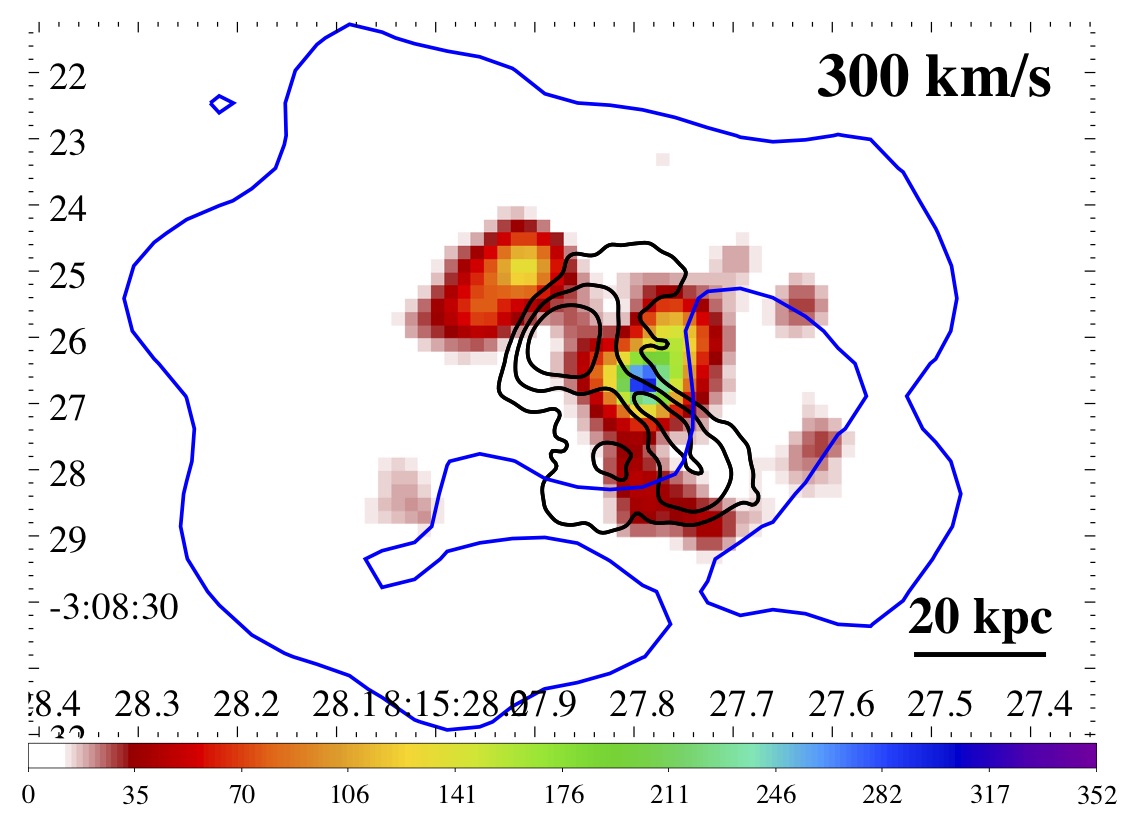
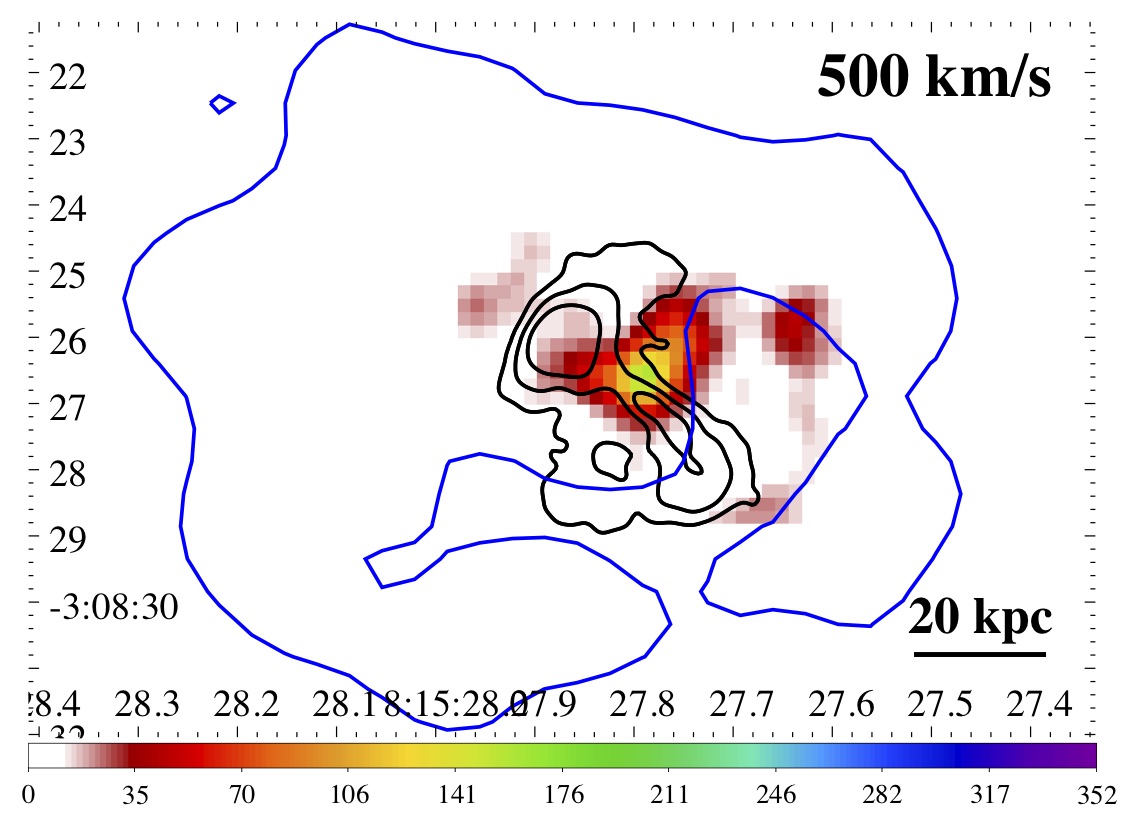
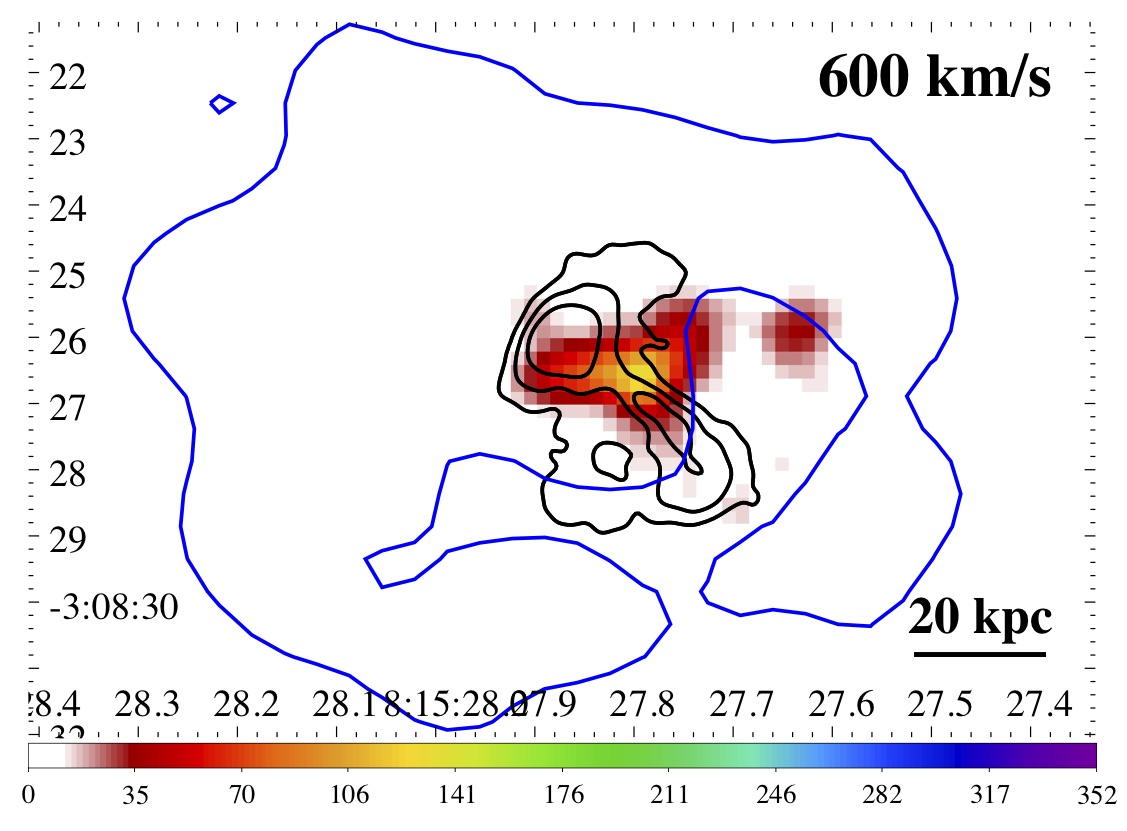
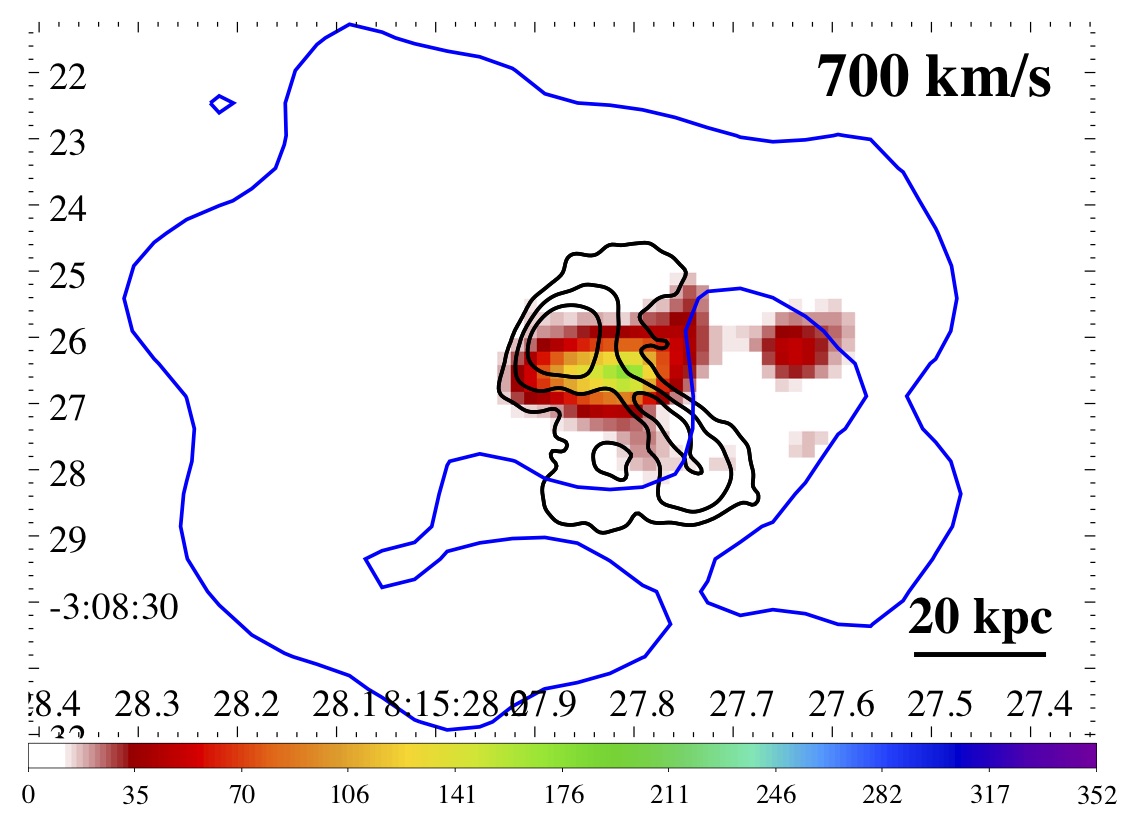
We decided to give an overview of the gas kinematics via velocity channel maps, as shown in Fig. 6 since the blending of the spectral components (see Fig. 3) and the low signal-to-noise in the cavity region prevent us from drawing strong quantitative conclusions from the study of the kinematics of each component. This approach is commonly used for isolated lines. Thus, to avoid contamination due to emission lines being part of a triplet, we considered different reference lines for blue and red-shifted emission. We considered as blue-shifted, emission blueward of the [N II] rest frame line and, as red-shifted, emission redward of the [N II] rest frame. Therefore, the central wavelength range including the emission of the H+[N II], dominated by spectral blending, is not shown in the channel maps. Channel maps are shown in increments of 100 km s-1, which correspond to two resolution elements, with the exception of the central channels that are shown in increments of 50 km s-1.
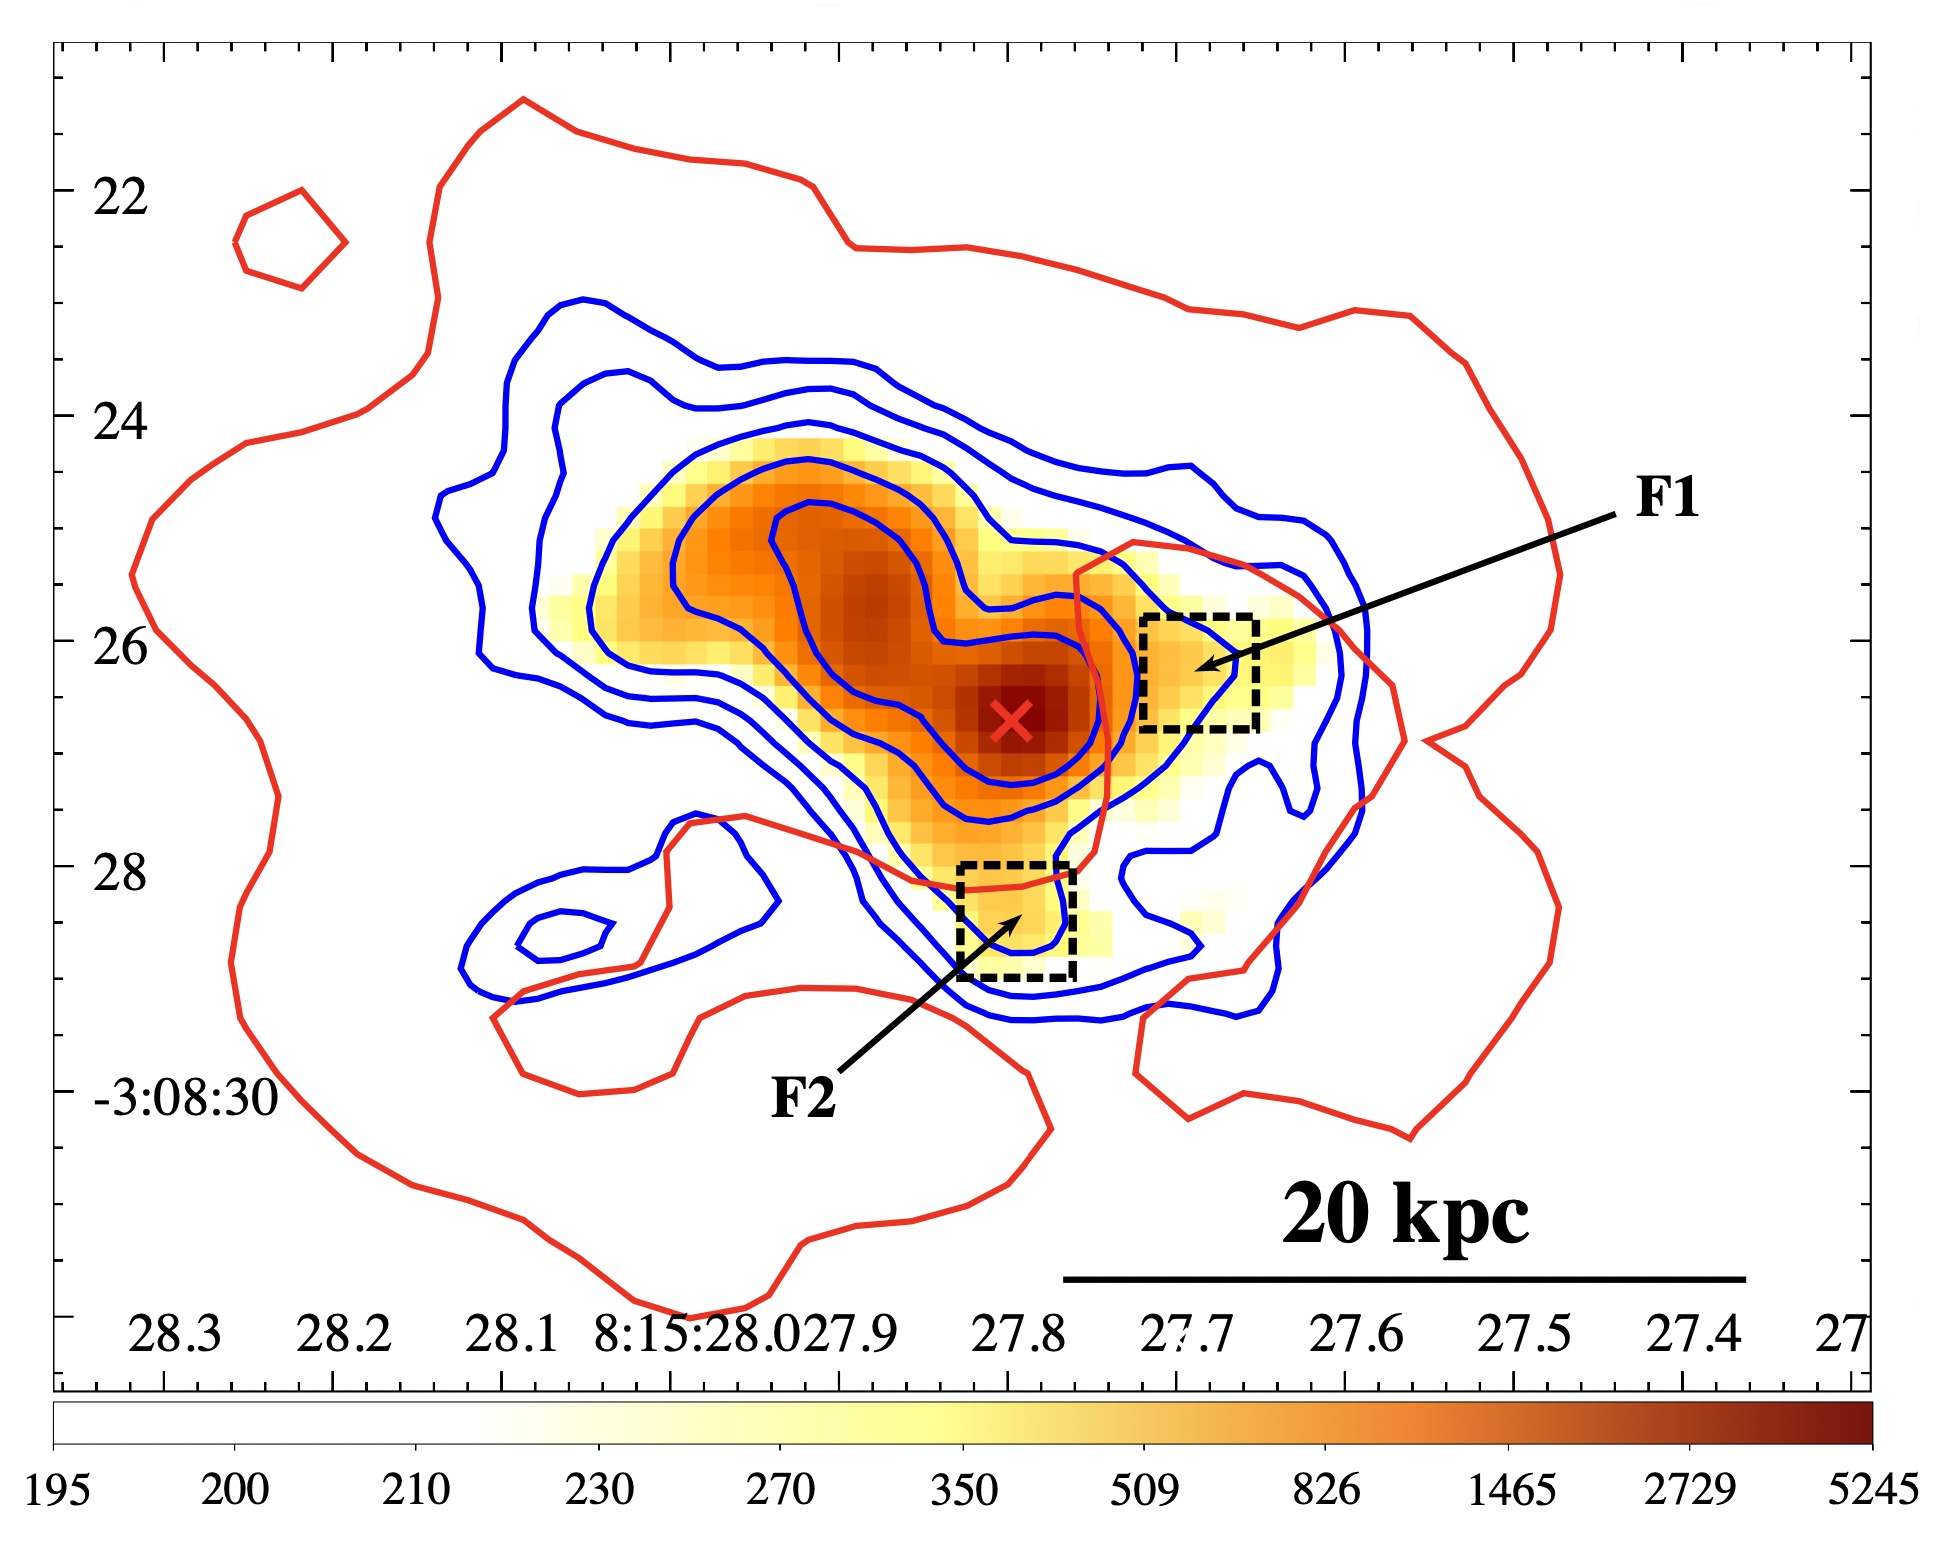
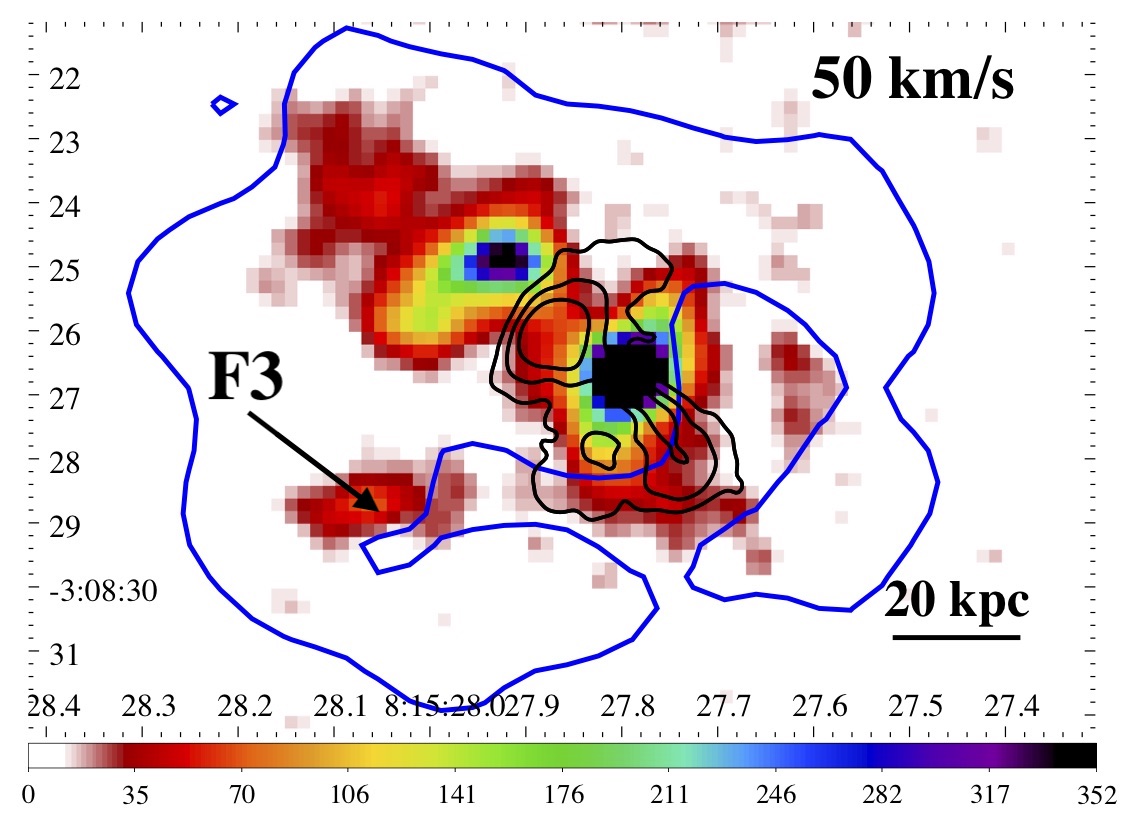
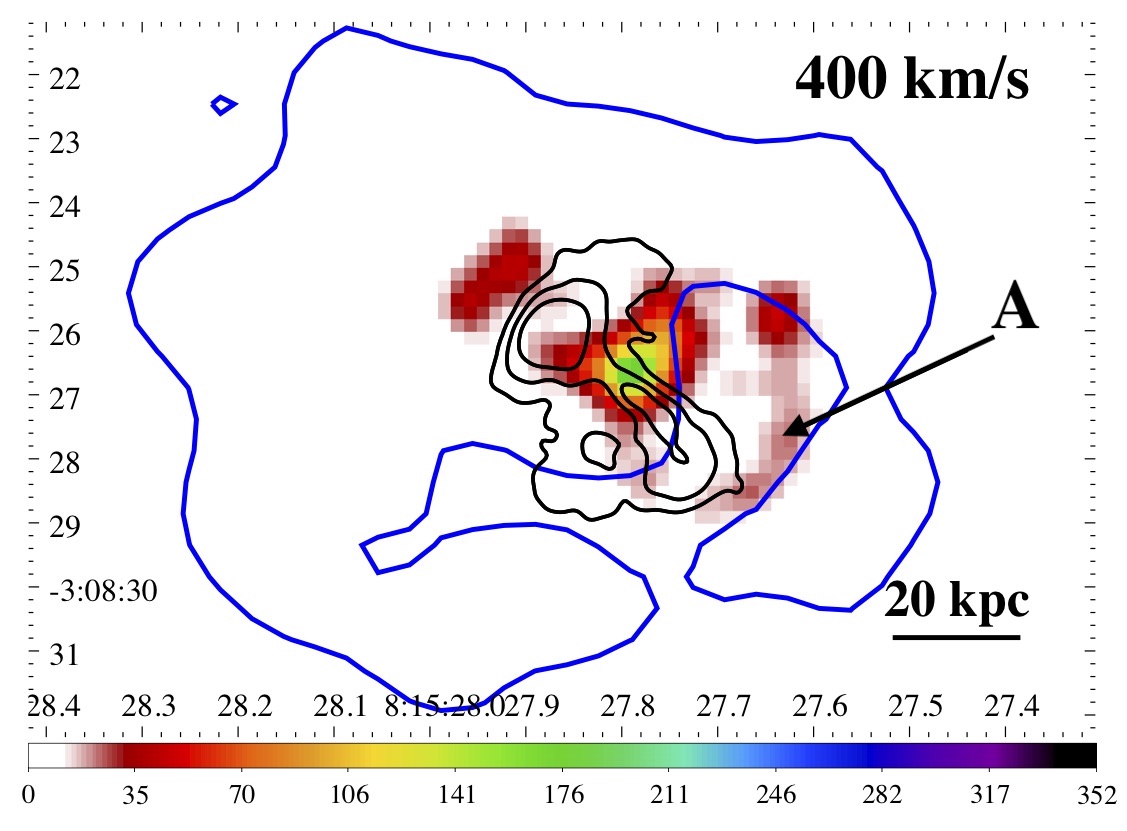
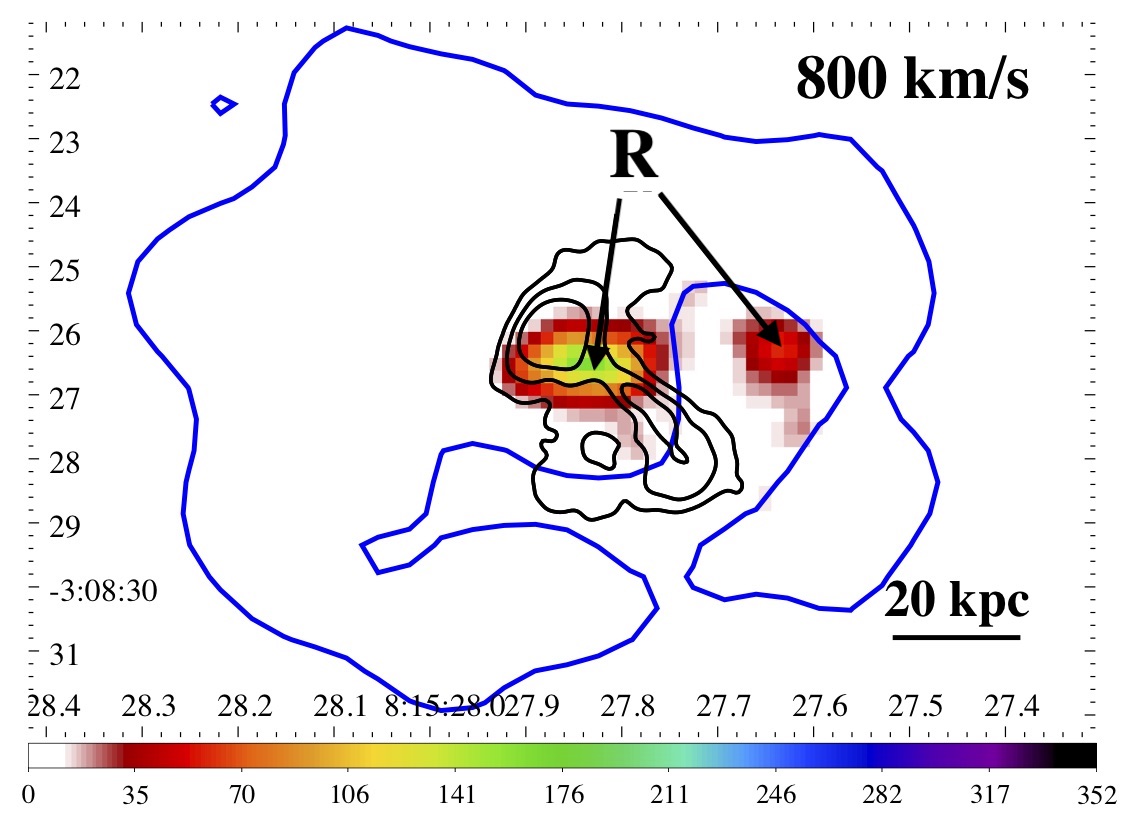
Velocity channel maps show that the blue-shifted emission is co-spatial with the north-eastern radio lobe (region L). Additionally, there seems to be a filament of blue-shifted emission on the outer edge of the southern radio lobe (F1). The red-shifted emission, up to 300 km s-1, shows some extended emission that appears to follow the north-eastern radio jet and a filament that seems to wrap around the southern lobe (F2). There also appears to be some emission connecting filaments F1 and F2, which is most visible at 400 km s-1 (A). This arched feature is apparently tracing the inner edge of the X-ray cavity. Lastly, at the reddest velocities (500 km s-1), the only emission that is detected corresponds to the redward [N II] shown in the right panel of Fig. 1 and in the spectrum of region b in Fig. 2 (region R).
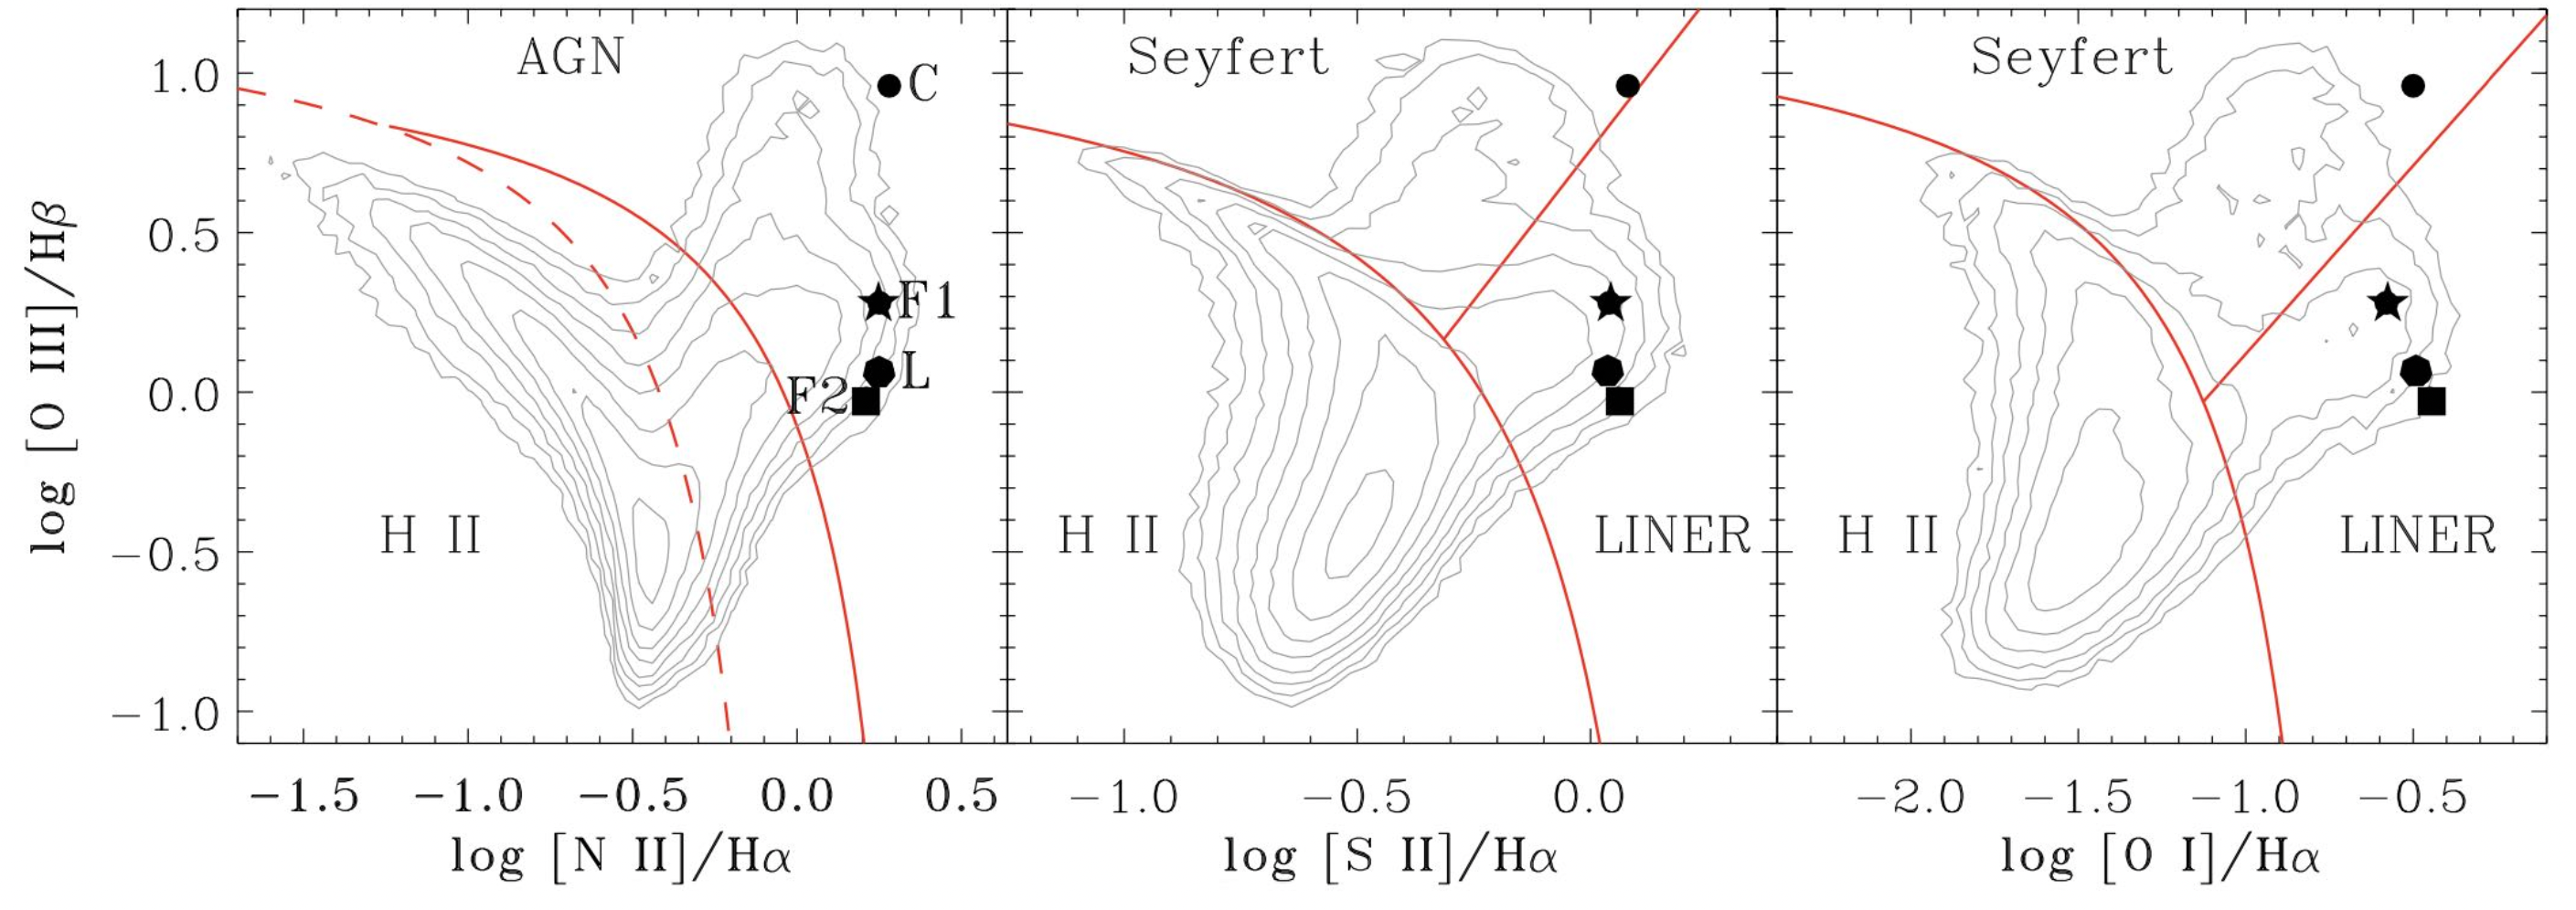
All extended ionized gas features, i.e., lobe and red and blue-shifted filaments (regions L, F1, and F2, marked in Fig. 4) present LINER-like ionization states, as shown in the BPT diagram in Fig. 5 (see, e.g., Baldwin et al. 1981 and Kewley et al. 2006). The only region shown in Fig. 5 with a Seyfert-like ionization state is the region corresponding to the optical host position. The position in the BPT diagram of the extra redward component shown in Fig. 1, right panel, could not be established since the spectral and spatial blending does not allow us to obtain estimates of the line ratios in this region with the current signal-to-noise ratio of our MUSE data. All extraction regions used for the BPT diagram were selected on the basis of specific morphology/kinematics of the source and are shown in Fig. 4. Additionally, all regions have a size of 1 arcsec2, to match the seeing of the observation.
5 Discussion
Multiphase gas halos, surrounding AGN hosted in BCGs harbored in cool core galaxy clusters, represent one of the keys to understanding AGN feedback mechanisms. Currently, the main hypothesis for the origin of ionized gas in these halos is the cooling and condensation of the hot, X-ray emitting plasma, often in the shape of i) filaments (see e.g., Fabian et al. 2008, 2011; Fabian 2012, Gaspari et al. 2017, 2018, Qiu et al. 2020, 2021, Jimenez-Gallardo et al. 2021), ii) rotating disks (see e.g., Wilman et al. 2005 Hamer et al. 2014), or iii) plumes (see e.g., Hamer et al. 2012, 2016, Pasini et al. 2019). One of the most remarkable examples of ionized gas filaments in a cool core cluster can be found in NGC 1275 in the center of the Perseus galaxy cluster (Lynds 1970, Conselice et al. 2001 and Fabian et al. 2008), where ionized gas filaments are spatially associated with an X-ray excess (Fabian et al. 2011). The same situation occurs for other BCGs of cool core clusters, where a tight connection between X-ray and optical filamentary emission was found, such as the cases of A1795 (Crawford et al. 2005), A1644 (McDonald et al. 2010), A2597 (Tremblay et al. 201), and MKW 3s (Jimenez-Gallardo et al. 2021).
Ionized gas filaments have also been found surrounding X-ray cavities, i.e., co-spatial with the rims of X-ray cavities (see e.g., works on A2052 by Blanton et al. 2011 and Balmaverde et al. 2018, as well as works by Lim et al. 2008, Tremblay et al. 2015 and Olivares et al. 2019). However, ionized gas spatially associated, and thus, potentially filling an X-ray cavity, is a rare occurrence with no clear explanation. In this work, we present the potential first detection of ionized gas spatially associated with an X-ray cavity, using H + [N II] emission as a tracer. Although the scenario where this ionized gas is actually overlaid to the X-ray cavity cannot be conclusively excluded, it appears unlikely. If that was the case, we would expect to see ionized gas spatially associated with the outer borders of the X-ray cavity, where its column density would be the highest, instead of with the X-ray cavity.
5.1 The north-eastern plume
Similar to other cool core galaxy clusters such as A1991, A3444, Ophiuchus (Hamer et al. 2012), A111, A133, A2415 (Hamer et al. 2016), and A2495 (Pasini et al. 2019), the peak of the X-ray emission surrounding 3CR 196.1 does not correspond to the position of the BCG, presenting an offset of 2″ (i.e., 6.5 kpc; see left panel of Fig. 2). Such offsets have been interpreted as caused by sloshing of the ICM due to events such as minor mergers. Typically, in those cases, the ionized gas forms plumes either following the X-ray peak or connecting the X-ray peak and the BCG. However, in the case of 3CR 196.1, we argue that the X-ray peak seen in the ICM is most likely caused by the interaction of the north-eastern radio jet with the ICM, as seen in 3CR 171 and 3CR 305 (Hardcastle et al. 2010, 2012), due to the alignment between the north-eastern radio lobe and the X-ray peak, as well as to the “hammer-head” shape of the north-eastern radio lobe and the ionized gas plume extending in the direction opposite to the position of the BCG (see Fig. 4). Thus, the ionized gas corresponding to region L could originate from the cooling of the jet-heated ICM. This origin is compatible with the ionized gas presenting a LINER-like ionization state, as shown in Fig. 5 since LINER-like emission in extranuclear regions is often associated with large-scale outflows and shocks or with radio jet-shocked regions (see Kewley et al. 2006 and references therein).
5.2 Ionized gas filaments around 3CR 196.1
One of the most likely mechanisms responsible for the formation of ionized gas filaments in cool core galaxy clusters is chaotic cold accretion (CCA, see Gaspari et al. 2012, 2013, 2015, 2017, 2018), i.e., the condensation of the hot plasma in the ICM and its precipitation onto the black hole. ICM cooling due to non-linear thermal instabilities was first introduced by Pizzolato & Soker (2005) as “cold feedback”. More recently, Gaspari et al. (2018) adopted the ratio of the cooling time and the eddy turnover time, , as a tool to assess the multiphase state of a system, with marking the extent of the condensation region. We applied this criterion to 3CR 196.1, where we assumed 500 Myr, as obtained by Ricci et al. (2018) for the inner region (i.e., 10″ or 30 kpc radius), since currently available X-ray observations did not allow us to carry out a more detailed spectral analysis. We obtained the eddy turnover time, as a function of the distance to the galaxy cluster core, as (see Gaspari et al. 2018), where 10 kpc is the injection scale, traced by the diameter of the X-ray cavity, and 212 km s-1 is the velocity dispersion at the injection scale. Thus, significant precipitation is expected to occur within a region of 9 - 48 kpc radius, where . Since the blue and red filaments at the edges of the southern radio lobe (F1 and F2 in the right panel of Fig. 4) extend up to 10 kpc (where 1.7) and the small ionized gas filament, F3, extends up to 15 kpc (where 1.3) to the south-east (see Fig. 6), the origin of ionized gas filaments surrounding 3CR 196.1 is compatible with a condensation rain. Moreover, the velocity and velocity dispersion along filament F2, 200 km s-1 and 100 km s-1, respectively, are consistent with those literature observations compared with CCA simulations by Gaspari et al. (2018). Therefore, 3CR 196.1 presents possible signs of black hole feeding.
Alternatively, as proposed e.g. in simulations by Qiu et al. (2020, 2021), ionized gas filaments in 3CR 196.1 could be due to AGN outflows uplifting warm ( K) gas from the central 2 kpc of the galaxy cluster, which then experiences radiative cooling. The energy needed to inflate adiabatically an ionized gas bubble with a radius 5 kpc, i.e., the size of the arched structure A in Fig. 6, and velocity 400 km s-1, in an ambient medium with density cm-3, as obtained by Ricci et al. (2018) for the inner 30 kpc of 3CR 196.1, can be obtained following the approach described by Nesvadba et al. (2006):
| (1) |
where is the radius of the bubble in units of 10 kpc, and is the velocity in units of 1000 km s-1. Thus, the minimum energy needed to inflate such a bubble, 2.4 erg s-1, is an order of magnitude below the jet power obtained by Ricci et al. (2018), 1.9 erg s-1, and, therefore, the ionized gas spatially associated with the X-ray cavity is consistent with a bubble being inflated by the radio jet.
The electron density in filaments F1 and F2 can be estimated using the [S II] duplet ratio as described in Sanders et al. (2016). We selected two regions of the size of the PSF (1.0″) over the filaments to compute the electron density. Thus, the electron density within the cavity is ecm-3. This density is comparable with that of the filaments found surrounding an X-ray cavity in A2052 by Balmaverde et al. (2018), which were interpreted as being caused by an expanding bubble, as well as with other filaments in cool core galaxy clusters (see e.g., McDonald et al. 2012, Jimenez-Gallardo et al. 2021). Additionally, extended ionized gas features, corresponding to filaments F1 and F2, could be interpreted as being caused by the interaction of the southern radio jet with its surrounding medium, since the filaments present LINER-like ionization states, as shown in Fig. 5.
Lastly, similarly to the expanding bubble in A2052, filaments F1 and F2 in 3CR 196.1 are blue and redshifted, respectively, and a potential region with split lines that could be due to the overlap of the emission of both filaments, a typical sign of an expanding bubble (Balmaverde et al. 2018), is also found to be co-spatial with the X-ray cavity (region R in Fig. 6). If that is the case, the expansion velocity of the bubble, which can only be estimated indirectly through X-ray observations, could be measured as the maximum velocity observed at the arched structure, A, i.e., 400 - 500 km s-1. Nevertheless, due to the low signal-to-noise ratio in the cavity region of current MUSE observations, the kinematics of the ionized gas filaments cannot be firmly derived and, thus, this scenario cannot be confirmed.
5.3 The central region of 3CR 196.1
During this analysis, we discovered that, in the central and X-ray cavity regions, all spectral features, except for the H and [O III] and [O I] lines, have an additional component at 1000 km s-1 to the red of rest-frame (see right panel of Fig. 1 and Figs. 2 and 3). This additional redward component could be due to a background gas cloud since there does not appear to be a continuous range of velocities from rest-frame to the redward component that would indicate the presence of an outflow. This emission could also be due to filaments of ionized gas being accreted onto the black hole through CCA, similarly to filament F3. Despite that, the spatial resolution (1″) of the current observations together with the blending of lines in the H + [N II] complex due to the limited spectral resolution (50 km s-1) prevent an in-depth analysis on the kinematics and ionization state of the gas in the central and X-ray cavity regions with current signal-to-noise.
6 Summary and conclusions
We carried out a comparison of optical VLT/MUSE and X-ray Chandra observations of 3CR 196.1, the central radio galaxy associated with the cool core galaxy cluster CIZA J0815.4-0303, which exhibits a “butterfly-shaped” X-ray cavity at 10 kpc toward the southwest of the nucleus. Through this analysis, we detected the presence of ionized gas spatially associated with an X-ray cavity.
The main possible explanations for detecting H + [N II] emission spatially associated with an X-ray cavity instead of with its rim include:
-
1.
The ionized gas is actually concentrated in filaments that wrap around the X-ray cavity, such as the ones shown in Fig. 6. However, due to projection effects, as well as to the presence of an additional redward component in the cavity region (see right panel of Fig. 1 and Fig. 2), the ionized gas appears to be co-spatial with the X-ray cavity. We tend to disfavor this scenario since it implies that we would be seeing the gas where it has the lowest column density along the line of sight, instead of at the edges, where its column density would be the highest.
-
2.
The ionized gas is actually filling the X-ray cavity. In that case, there could be two possible explanations: (i) the gas has undergone multiple ionization events due to different AGN outbursts, or (ii) the ionized gas is forming filaments originating from the cooling of warm ( K) AGN outflows. Scenario (i) is compatible with an AGN outburst occurring after the one responsible for the X-ray cavity, since typical cycling times between quiescence and activity in radio galaxies are 107-108 yr (see Shabala et al. 2008 and references therein) and the estimated age of the X-ray cavity is 12 Myr (Ricci et al. 2018). On the other hand, scenario (ii) is compatible with simulations by Qiu et al. (2020), which show that warm ( K) gas present in the central 2 kpc of galaxy clusters (due to radiative feedback) could be lifted by AGN outflows and radiatively cooled, originating ionized gas filaments. Additional simulations in Qiu et al. (2021) showed that these filaments could be shaped as rings perpendicular to the direction of the outflow, which would explain the arched feature (A in Fig. 6), that appears to connect filaments F1 and F2 (surrounding the southwestern radio lobe in Fig. 4, right panel) and that seems to trace the inner edge of the X-ray cavity.
To distinguish between these scenarios, additional observations would allow us to characterize, in more detail, the temperature and density profiles of the central ICM emission. To characterize the ionized gas, we would also need deeper and higher spatial resolution MUSE observations, with, e.g., the adaptive optic-assisted MUSE narrow-field-mode. Alternatively, the new ERIS instrument at the VLT, or the NIRSPEC IFU on the James Webb Space Telescope, could help us understand the origin of the additional redward component found in the spectra, as well as to derive the kinematics of the ionized gas spatially associated with the X-ray cavity. Such observations would allow us to measure the expansion velocity in the case in which the ionized gas is tracing an expanding bubble.
References
- Bacon et al. (2010) Bacon, R., Accardo, M., Adjali, L., et al. 2010, in Society of Photo-Optical Instrumentation Engineers (SPIE) Conference Series, Vol. 7735, Proc. SPIE, 773508
- Baldi et al. (2019) Baldi, R. D., Rodríguez Zaurín, J., Chiaberge, M., et al. 2019, ApJ, 870, 53
- Baldwin et al. (1981) Baldwin, J. A., Phillips, M. M. & Terlevich, R. 1981, PASP, 93, 5
- Balmaverde et al. (2018) Balmaverde, B., Capetti, A., Marconi, A., et al. 2018, A&A, 612, A19
- Balmaverde et al. (2019) Balmaverde, B., Capetti, A., Marconi, A., et al. 2019, A&A, 632, A124
- Balmaverde et al. (2021) Balmaverde, B., Capetti, A., Marconi, A., et al. 2021, A&A, 645, A12
- Baum et al. (1988) Baum, S. A., Heckman, T. M., Bridle, A., et al. 1988, ApJS, 68, 643
- Baum et al. (1990) Baum, S. A., Heckman, T. & van Breugel, W. 1990, ApJS, 74, 389
- Bennett (1962) Bennett, A. S. 1962, MNRAS, 125, 75
- Bennett et al. (2014) Bennett, C. L., Larson, D., Weiland, J. L. & Hinshaw, G. 2014, ApJ, 794, 135
- Bîrzan et al. (2004) Bîrzan, L., Rafferty, D. A., McNamara, B. R., et al. 2004, ApJ, 607, 800
- Blanton et al. (2011) Blanton, E. L., Randall, S. W., Clarke, T. E., et al. 2011, ApJ, 737, 99
- Böhringer et al. (1996) Böhringer, H., Neumann, D. M., Schindler, S., et al. 1996, ApJ, 467, 168
- Buttiglione et al. (2010) Buttiglione, S., Capetti, A., Celotti, A., et al. 2010, A&A, 509, A6
- Capetti & Baldi (2011) Capetti, A. & Baldi, R. D. 2011, A&A, 529, A126
- Cappellari (2017) Cappellari, M. 2017, MNRAS, 466, 798
- Cavagnolo et al. (2010) Cavagnolo, K. W., McNamara, B. R., Nulsen, P. E. J., et al. 2010, ApJ, 720, 1066
- Churazov et al. (2000) Churazov, E., Forman, W., Jones, C., et al. 2000, A&A, 356, 788
- Conselice et al. (2001) Conselice, C. J., Gallagher, J. S., III & Wyse, R. F. G. 2001, AJ, 122, 2281
- Crawford et al. (2005) Crawford, C. S., Sanders, J. S. & Fabian, A. C. 2005, MNRAS, 361, 17
- de Koff et al. (1996) de Koff, S., Baum, S. A., Sparks, W. B., et al. 1996, ApJS, 107, 621
- Edge et al. (1959) Edge, D. O., Shakeshaft, J. R., McAdam, W. B., et al. 1959, MmRAS, 69, 37
- Fabian et al. (2003) Fabian, A. C., Sanders, J. S., Allen, S. W., et al. 2003, MNRAS, 344, L43
- Fabian et al. (2006) Fabian, A. C., Sanders, J. S., Taylor, G. B., et al. 2006, MNRAS, 366, 417
- Fabian et al. (2008) Fabian, A. C., Johnstone, R. M., Sanders, J. S., et al. 2008, Nature, 454, 968
- Fabian et al. (2011) Fabian, A. C., Sanders, J. S., Williams, R. J. R., et al. 2011, MNRAS, 417, 172
- Fabian (2012) Fabian, A. C. 2012, ARA&A, 50, 455
- Fanaroff & Riley (1974) Fanaroff, B. L. & Riley, J. M. 1974, MNRAS, 167, 31P
- Forman et al. (2005) Forman, W., Jones, C., Churazov, E., et al. 2005, ApJ, 665, 1057
- Forman et al. (2017) Forman, W., Churazov, E., Jones, C., et al. 2017, ApJ, 844, 122
- Fruscione et al. (2006) Fruscione, A., McDowell, J. C., Allen, G. E., et al. 2006, Society of Photo-Optical Instrumentation Engineers (SPIE) Conference Series, 6270, 62701V
- Fosbury (1986) Fosbury, R. A. E. 1986, in Astrophysics and Space Science Library Vol. 121, Structure and Evolution of Active Galactic Nuclei, ed. G. Giuricin, M. Mezzetti, M. Ramella, & F. Mardirossian (Dordrecht: Reidel), 297
- Gaspari et al. (2012) Gaspari, M., Ruszkowski, M. &Sharma, P. 2012, ApJ, 746, 94
- Gaspari et al. (2013) Gaspari, M., Ruszkowski, M. & Oh, S. Peng 2013, MNRAS, 432, 3401
- Gaspari et al. (2015) Gaspari, M., Brighenti, F. & Temi, P. 2015, A&A, 579, A62
- Gaspari et al. (2017) Gaspari, M., Temi, P. & Brighenti, F. 2017, MNRAS, 466, 677
- Gaspari et al. (2018) Gaspari, M., McDonald, M., Hamer, S. L., et al. 2018, ApJ, 854, 167
- Gitti et al. (2012) Gitti, M., Brighenti, F. & McNamara, B. R. 2012, AdAst, 2012, 950641
- Gopal-Krishna & Wiita (2000) Gopal-Krishna & Wiita, P. J. 2000, A&A, 363, 507
- Graham et al. (2008) Graham, J., Fabian, A. C. & Sanders, J. S. 2008, MNRAS, 386, 278
- Hamer et al. (2012) Hamer, S. L., Edge, A. C., Swinbank, A. M., et al. 2012, MNRAS, 421, 3409
- Hamer et al. (2014) Hamer, S. L., Edge, A. C., Swinbank, A. M., et al. 2014, MNRAS, 437, 862
- Hamer et al. (2016) Hamer, S. L., Edge, A. C., Swinbank, A. M., et al. 2016, MNRAS, 460, 1758
- Hansen et al. (1987) Hansen, L., Norgaard-Nielsen, H. U. & Jorgensen, H. E. 1987, A&AS, 71, 465
- Hardcastle et al. (2010) Hardcastle, M. J., Massaro, F. & Harris, D. E., 2010, MNRAS, 401, 2697
- Hardcastle et al. (2012) Hardcastle, M. J., Massaro, F. & Harris, D. E., 2012, MNRAS, 424, 1774
- Jimenez-Gallardo et al. (2021) Jimenez-Gallardo, A., Massaro, F., Balmaverde, B., et al. 2021, ApJ, 912, L25
- Jones et al. (2002) Jones, C., Forman, W.,Vikhlinin, A., et al. 2002, ApJ, 567, L115
- Kauffmann et al. (2003) Kauffmann, G., Heckman, T. M., Tremonti, C., et al. 2003, MNRAS, 346, 1055
- Kewley et al. (2001) Kewley, L. J., Heisler, C. A., Dopita, M. A, et al. 2001, ApJS, 132, 37
- Kewley et al. (2006) Kewley, L. J., Groves, B., Kauffmann, G., et al. 2006, MNRAS, 372, 961
- Kocevski et al. (2007) Kocevski, D. D., Ebeling, H., Mullis, C. R., et al. 2007, ApJ, 662, 224
- Kraft et al. (2012) Kraft, R. P., Birkinshaw, M., Nulsen, P. E. J., et al. 2012, ApJ, 749, 19
- Laing et al. (1983) Laing, R. A., Riley, J. M. & Longair, M. S. 1983, MNRAS, 204, 151
- Lim et al. (2008) Lim, J., Ao, YiPing & Dinh-V-Trung 2008, ApJ, 672, 252
- Lynds (1970) Lynds, R. 1970, ApJ, 159, L151
- Madrid et al. (2006) Madrid, J. P., Chiaberge, M., Floyd, D., et al. 2006, ApJS, 164, 307
- Markevitch & Vikhlinin (2007) Markevitch, M. & Vikhlinin, A. 2007, Phys. Rep., 443, 1
- Massaro et al. (2011) Massaro, F., Harris, D. E. & Cheung, C. C. 2011, ApJS, 197, 24
- Massaro et al. (2012) Massaro, F., Tremblay, G. R., Harris, D. E., et al. 2012, ApJS, 203, 31
- Massaro et al. (2015) Massaro, F., Harris, D. E., Liuzzo, E., et al. 2015, ApJS, 220, 5
- McCarthy (1988) McCarthy, P. J. 1988, PhD thesis, AA (California Univ., Berkeley)
- McDonald et al. (2010) McDonald M., Veilleux, S., Rupke, D. S. N., et al. 2010, ApJ, 721, 1262
- McDonald et al. (2012) McDonald M., Veilleux, S., Rupke, D. S. N., et al. 2012, ApJ, 746, 153
- McNamara et al. (2005) McNamara, B. R., Nulsen, P. E. J., Wise, M. W., et al. 2005, Nature, 433, 7021
- McNamara & Nulsen (2007) McNamara, B. R. & Nulsen, P. E. J. 2007, ARA&A, 45, 117
- McNamara et al. (2009) McNamara, B. R., Kazemzadeh, F., Rafferty, D. A., et al. 2009, ApJ, 698, 594
- McNamara & Nulsen (2012) McNamara B. R. & Nulsen, P. E. J. 2012, New Journal of Physics, 14, 5
- Nesvadba et al. (2006) Nesvadba, N. P. H., Lehnert, M. D., Eisenhauer, F., et al. 2006, ApJ, 650, 693
- Nulsen et al. (2005a) Nulsen, P. E. J., McNamara, B. R., Wise, M. W., et al. 2005a, ApJ, 628, 629
- Nulsen et al. (2005b) Nulsen, P. E. J., Hambrick, D. C., McNamara, B. R., et al. 2005b, ApJ, 625, L9
- Olivares et al. (2019) Olivares, V., Salome, P., Combes, F., et al. 2019, A&A, 631, A22
- Osterbrock & Ferland (2006) Osterbrock, D. E. & Ferland, G. J. 2006, Astrophysics of gaseous nebulae and active galactic nuclei (2nd ed.; Sausalito, CA: Science Books)
- Pasini et al. (2019) Pasini, T., Gitti, M., Brighenti, F., et al. 2019, ApJ, 885, 111
- Pasini et al. (2021) Pasini, T., Gitti, M., Brighenti, F., et al. 2021, ApJ, 911, 66
- Pizzolato & Soker (2005) Pizzolato, F. & Soker, N. 2005, ApJ, 632, 821
- Prieto et al. (2016) Prieto, J. L., Krühler, T., Anderson, J. P., et al. 2016, ApJ, 830, L32
- Qiu et al. (2020) Qiu, Y., Bogdanović, T., Li, Y., et al. 2020, Nature Astronomy, 4, 900
- Qiu et al. (2021) Qiu, Y., Hu, H., Inayoshi, K., et al. 2021, ApJ, 917, L7
- Randall et al. (2011) Randall, S. W., Forman, W. R., Giacintucci, S., et al. 2011, ApJ, 726, 86
- Randall et al. (2015) Randall, S. W., Nulsen, P. E. J., Jones, C., et al. 2015, ApJ, 805, 112
- Ricci et al. (2018) Ricci, F., Lovisari, L., Kraft, R. P., et al. 2018, ApJ, 867, 35
- Sanders et al. (2016) Sanders, Ryan L., Shapley, A. E., Kriek, M., et al. 2016, ApJ, 825, L23
- Shabala et al. (2008) Shabala, S. S., Ash, S., Alexander, P., et al. 2008, MNRAS, 388, 625
- Speranza et al. (2021) Speranza, G., Balmaverde, B., Capetti, A., et al. 2021, A&A, 653, A150
- Spinrad et al. (1985) Spinrad, H., Djorgovski, S., Marr, J. & Aguilar, L. 1985, PASP, 97, 932
- Tremblay et al. (2009) Tremblay, G. R., Chiaberge, M., Sparks, W. B., et al. 2009, ApJS, 183, 278
- Tremblay et al. (2012) Tremblay, G. R., O’Dea, C. P., Baum, S. A., et al. 2012, MNRAS, 424, 1026
- Tremblay et al. (2015) Tremblay, G. R., O’Dea, C. P., Baum, S. A., et al. 2015, MNRAS, 451, 3768
- Tremblay et al. (201) Tremblay, G. R., Oonk, J. B. R., Combes, F., et al. 2016, Nature, 534, 218
- Tucker et al. (2021) Tucker, M. A., Shappee, B. J., Hinkle, J. T., et al. 2021, MNRAS, 506, 6014
- Wilman et al. (2005) Wilman, R. J., Edge, A. C. & Johnstone, R. M. 2005, MNRAS, 359, 755
- Zirbel (1996) Zirbel, E. L. 1996, ApJ, 473, 713
Appendix A Atrometric registration
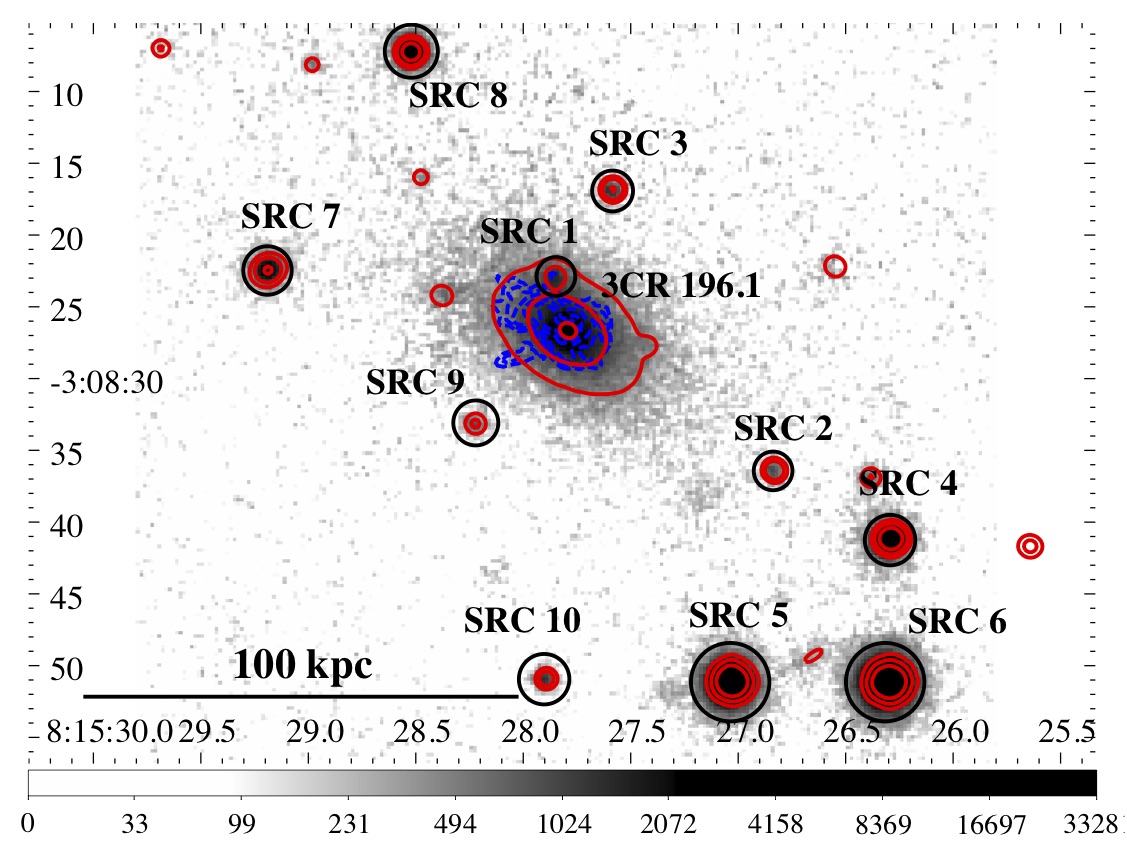
All details related to the strategy adopted to carry out the astrometric registration of MUSE images are reported in the following. We measured the centroids of the optical counterpart of 3CR 196.1 and sources SRC1 to SRC4, in Fig. 7, in the Pan-STARRS and MUSE white light collapsed images and applied the average of the shifts to the MUSE data cube. The final shift was 3.1″ (corresponding to 10 kpc, which is expected since it is a known issue that MUSE astrometry can be off by several arcseconds, as reported by Prieto et al. 2016, Balmaverde et al. 2019, 2021, and Tucker et al. 2021). We then verified that the registration adopted was appropriate for sources SRC5 to SRC8, in Fig. 7, by measuring the difference between their centroids in the Pan-STARRS and MUSE white light collapsed images after the shift. The adopted shift yielded an rms of 0.18″. The final alignment between Pan-STARRS and MUSE data for 3CR 196.1 and the rest of the field sources is shown in Fig. 7, for the MUSE white light image (red contours) and the H+[N II] emission (blue contours).
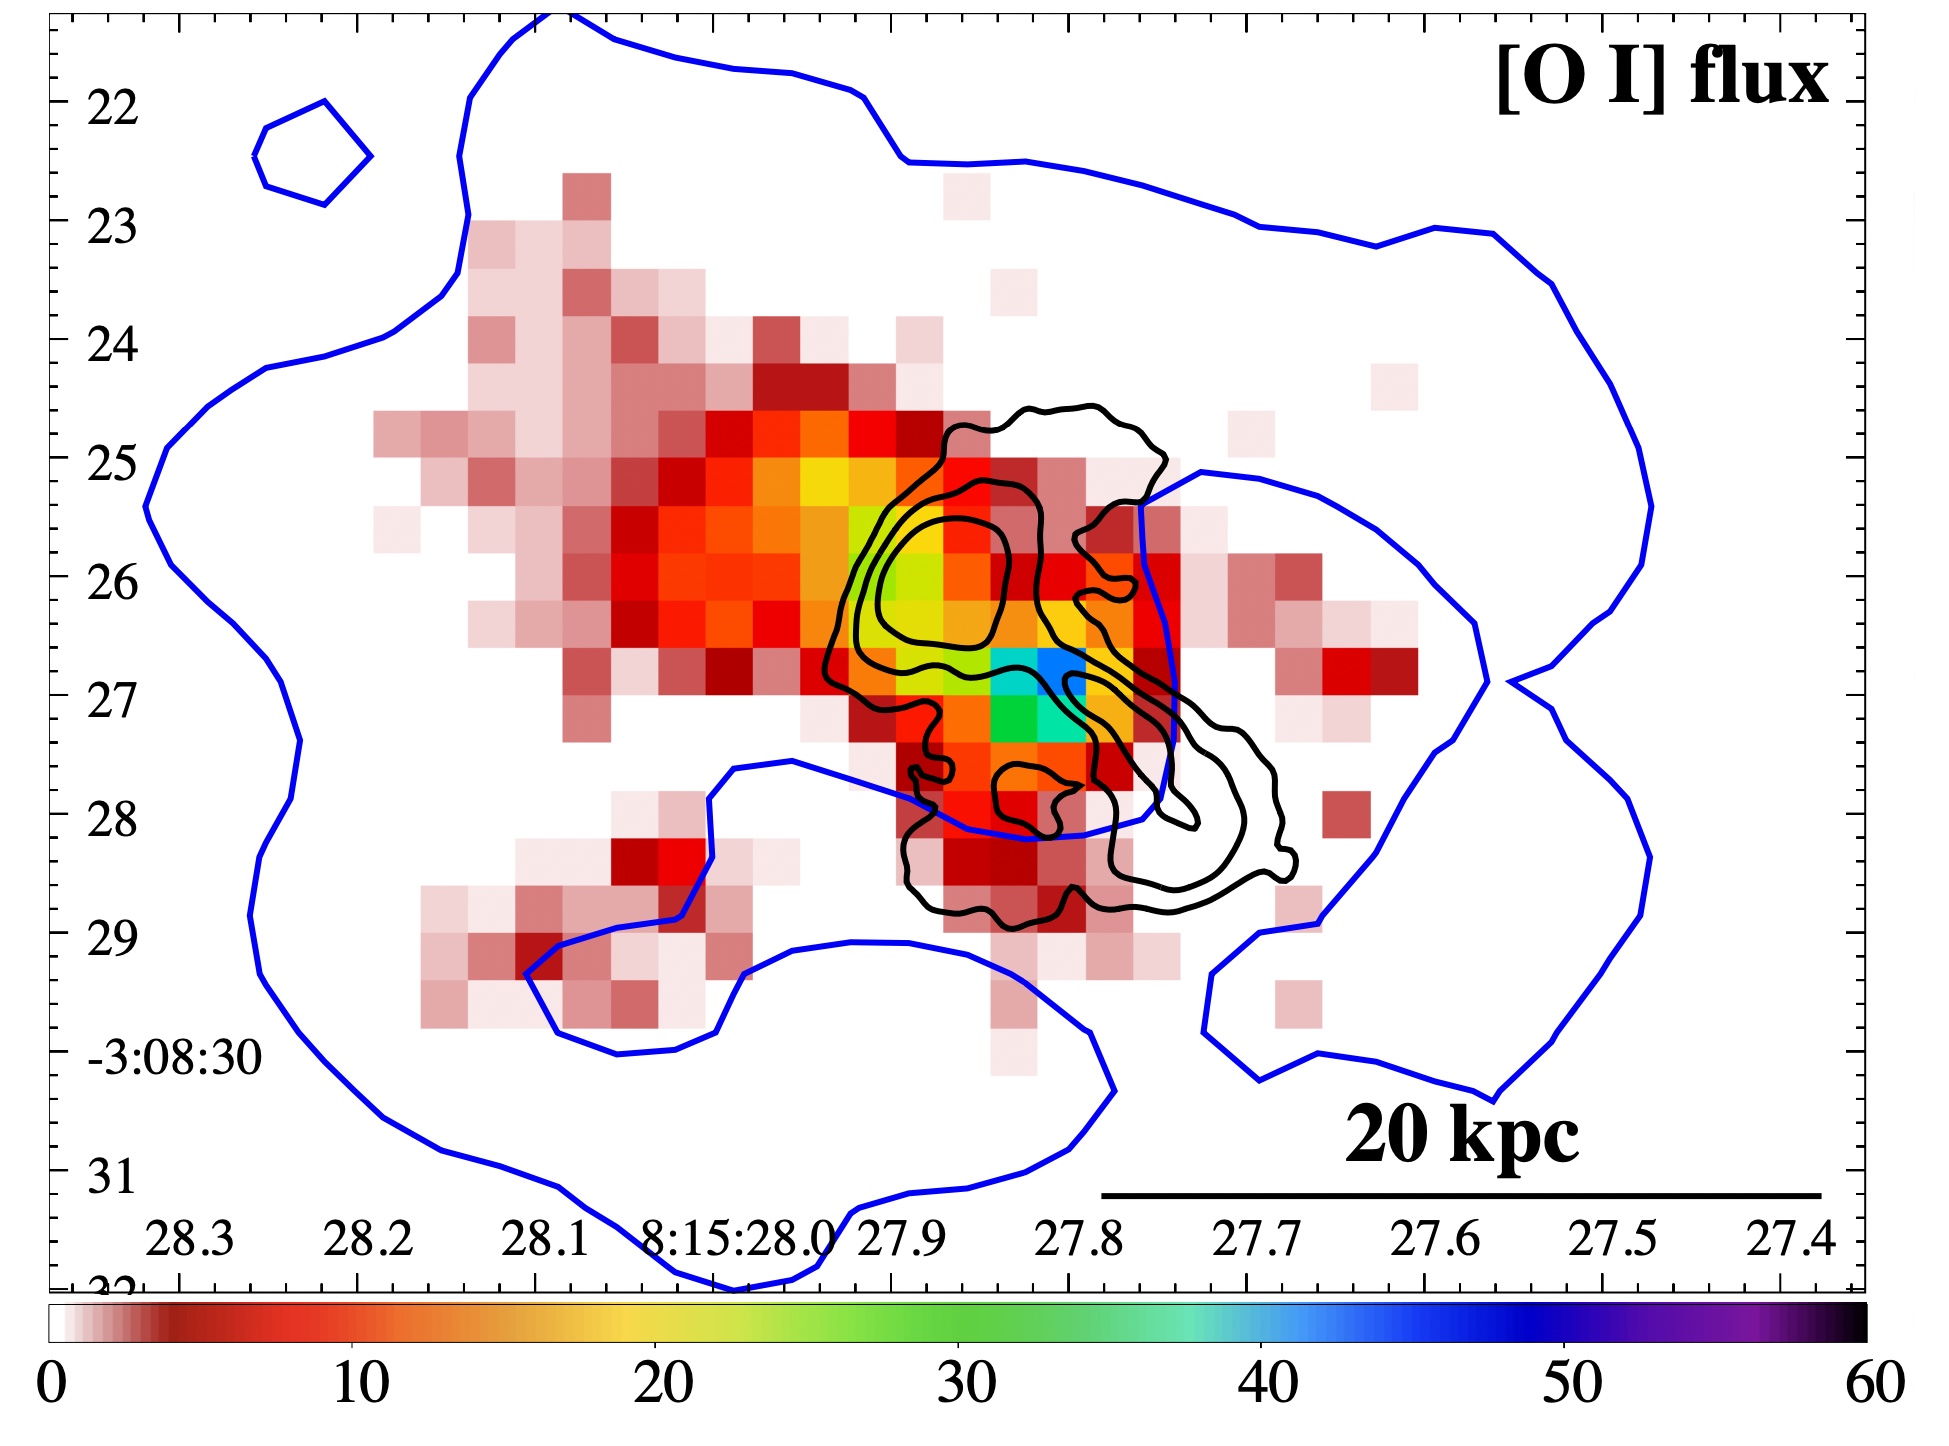
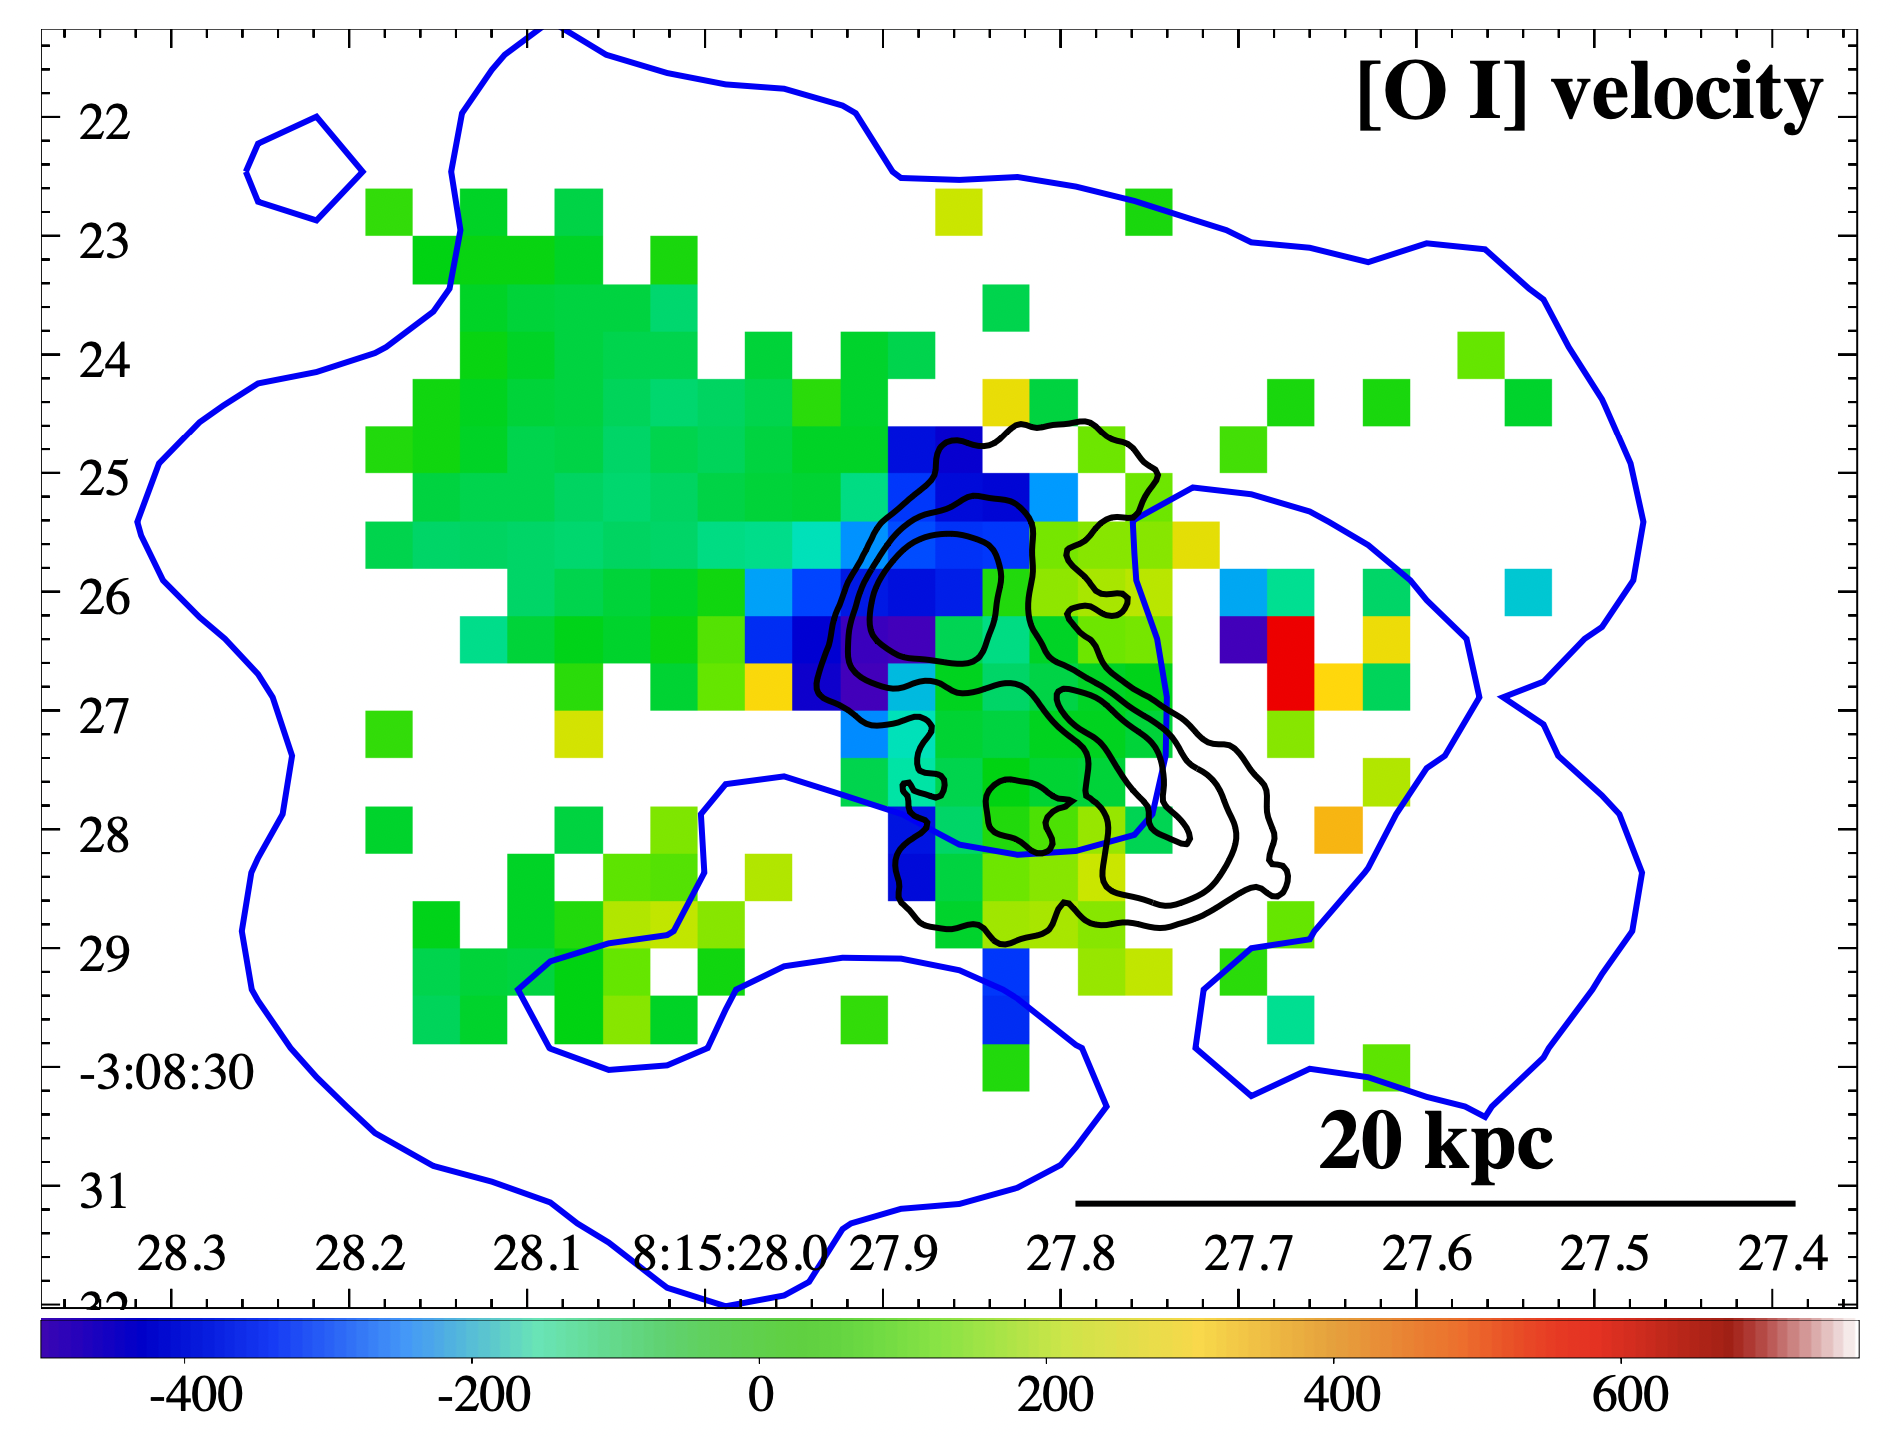
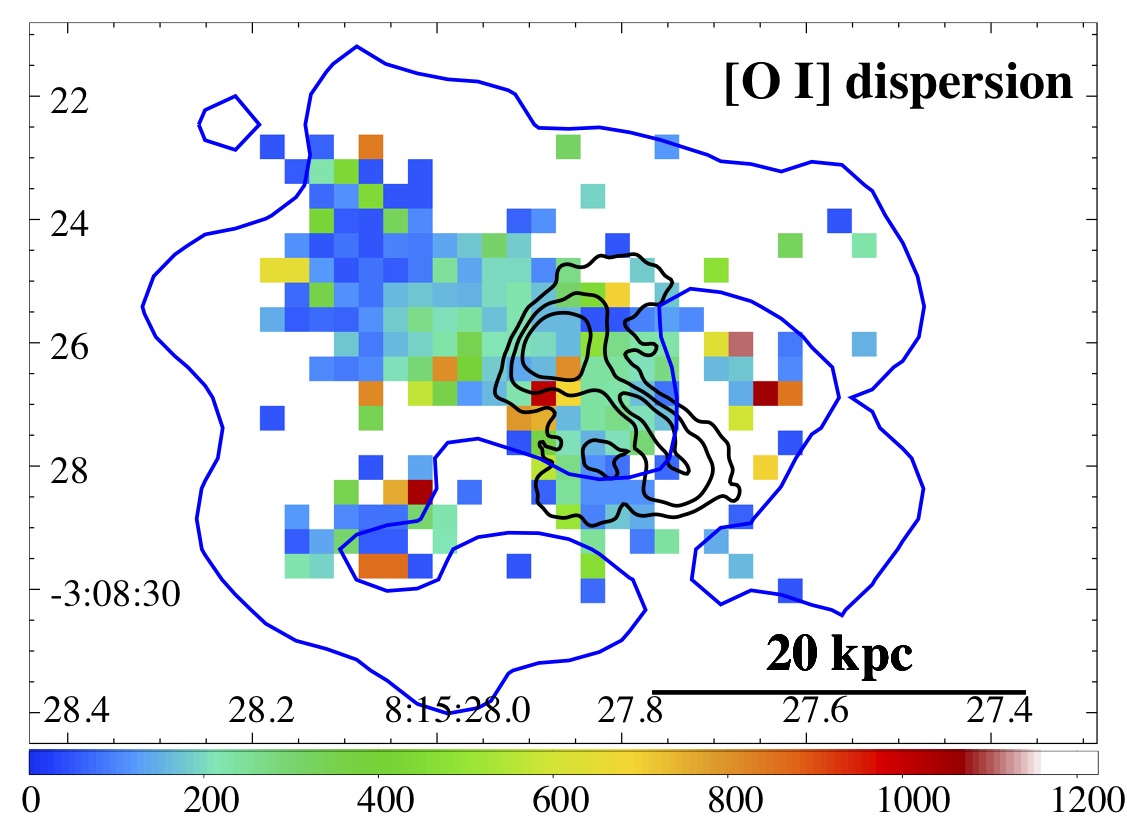
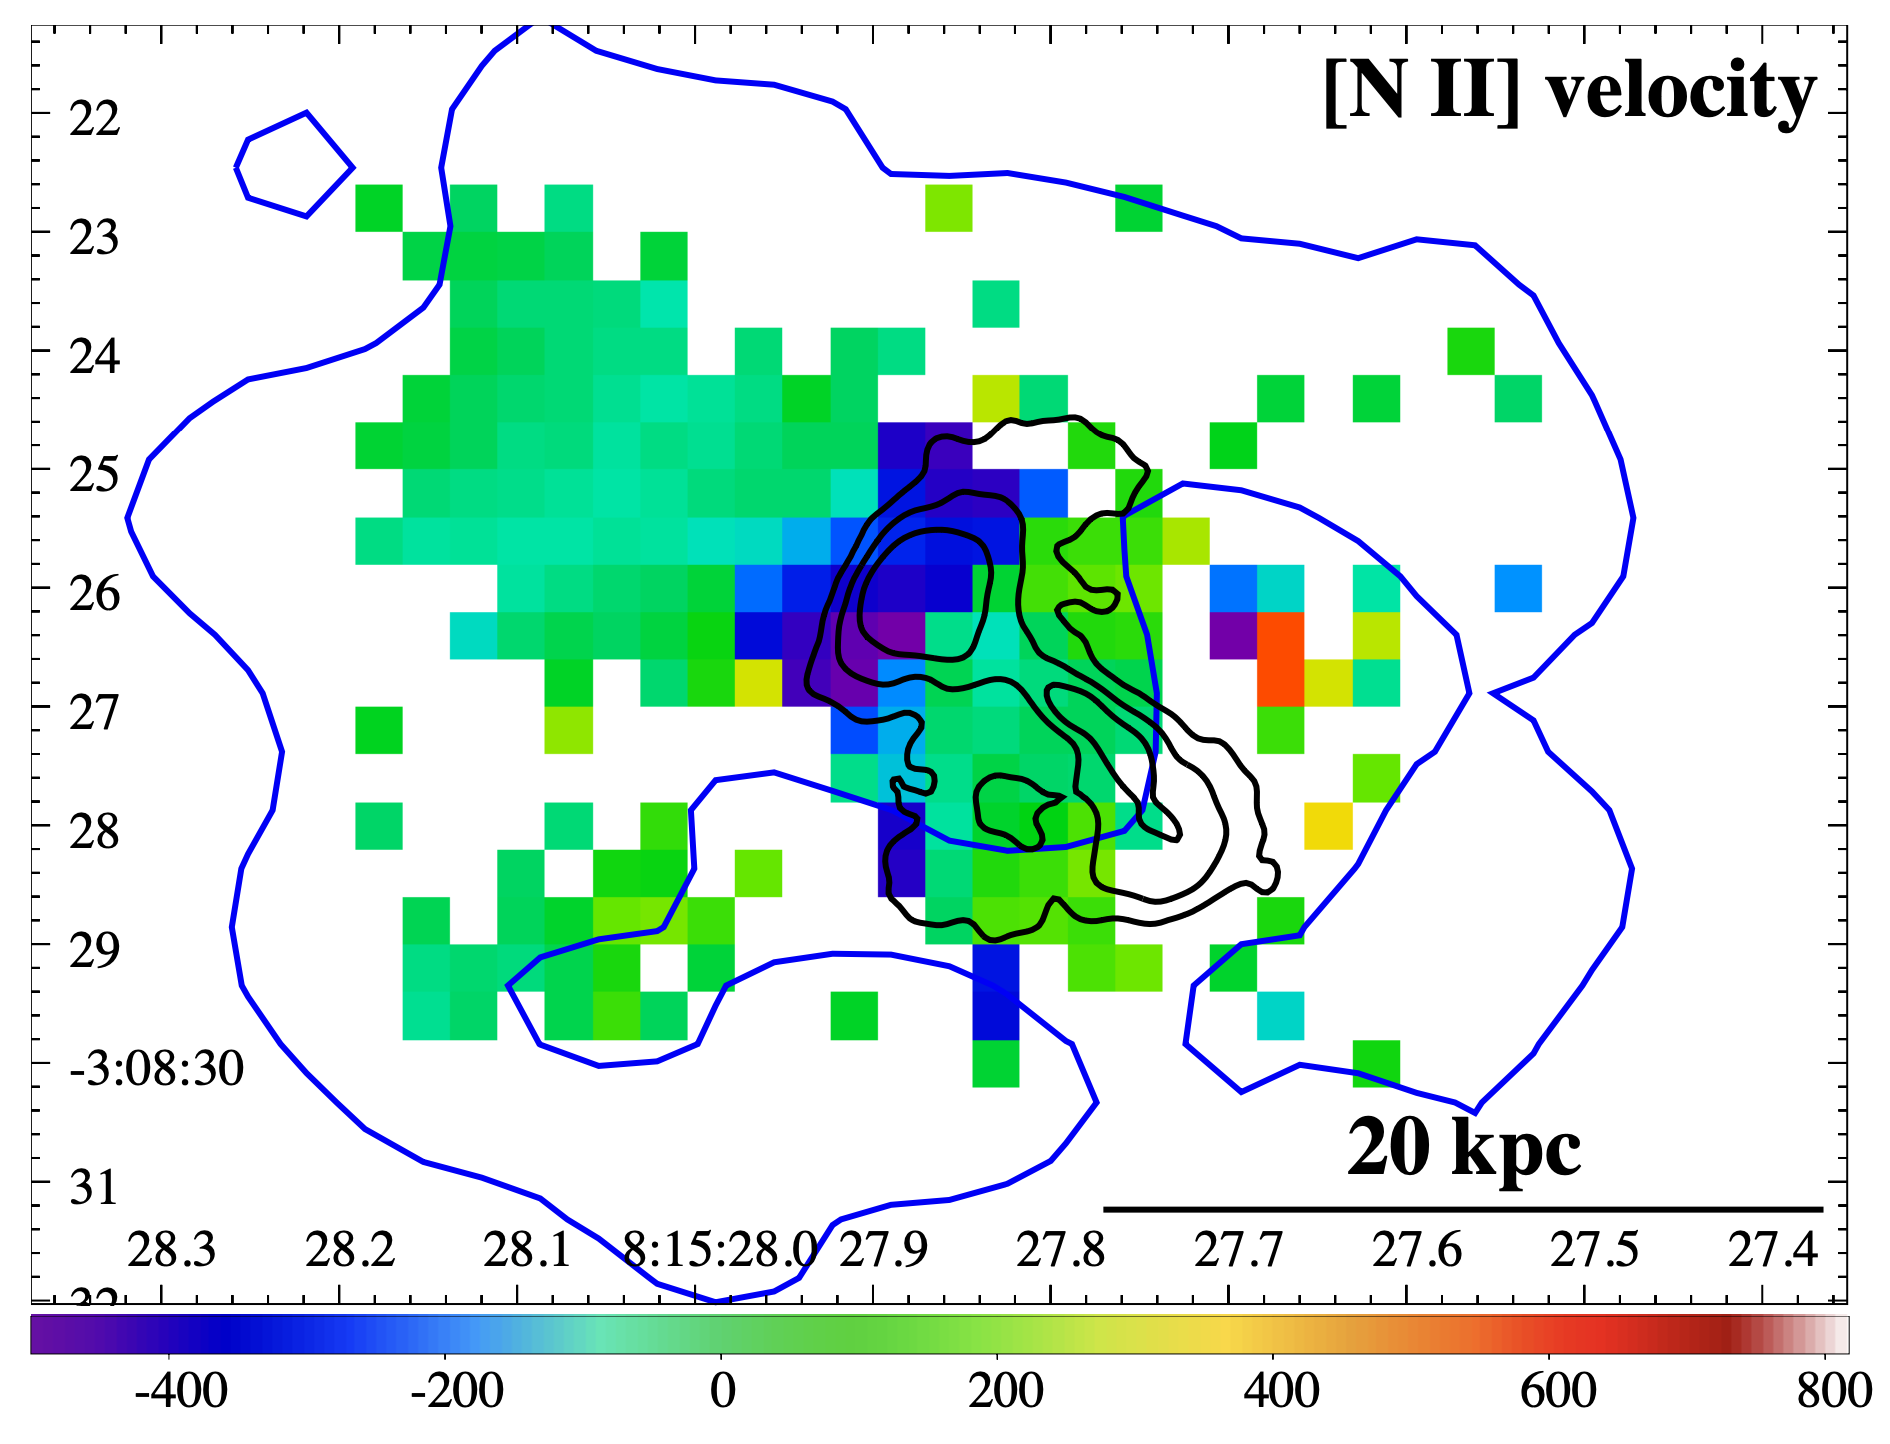
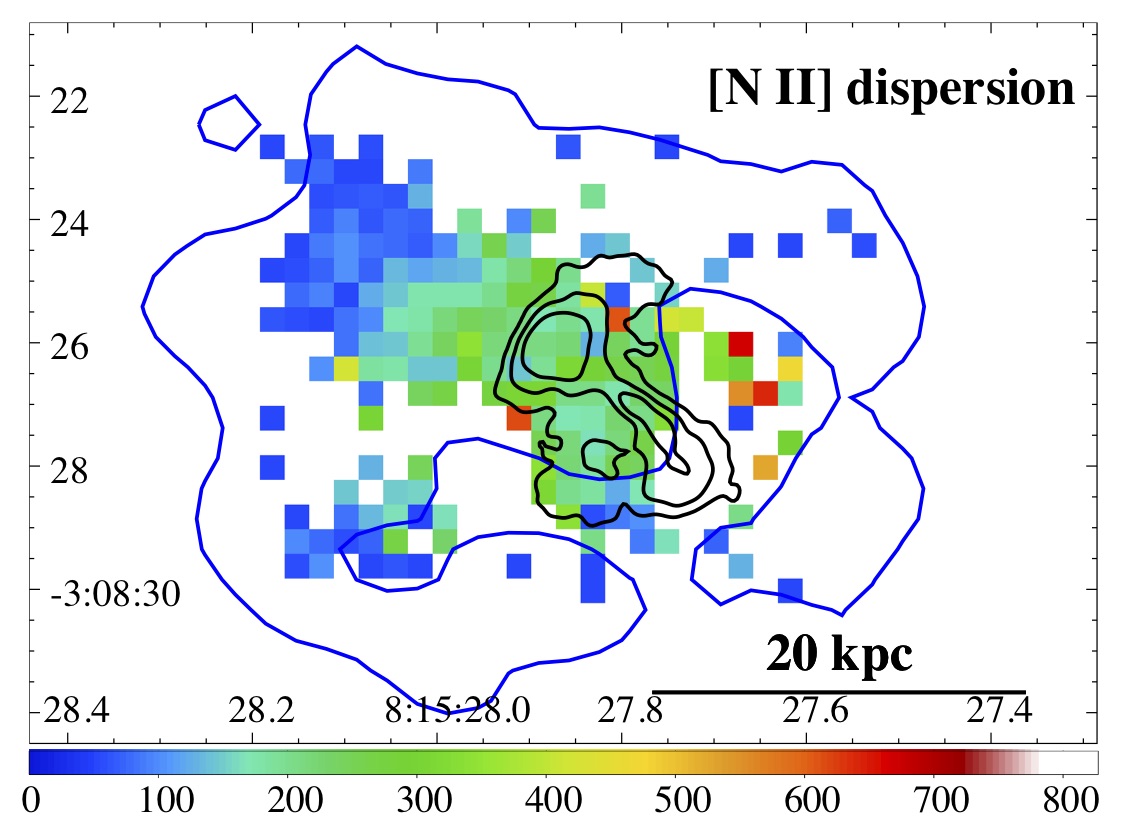
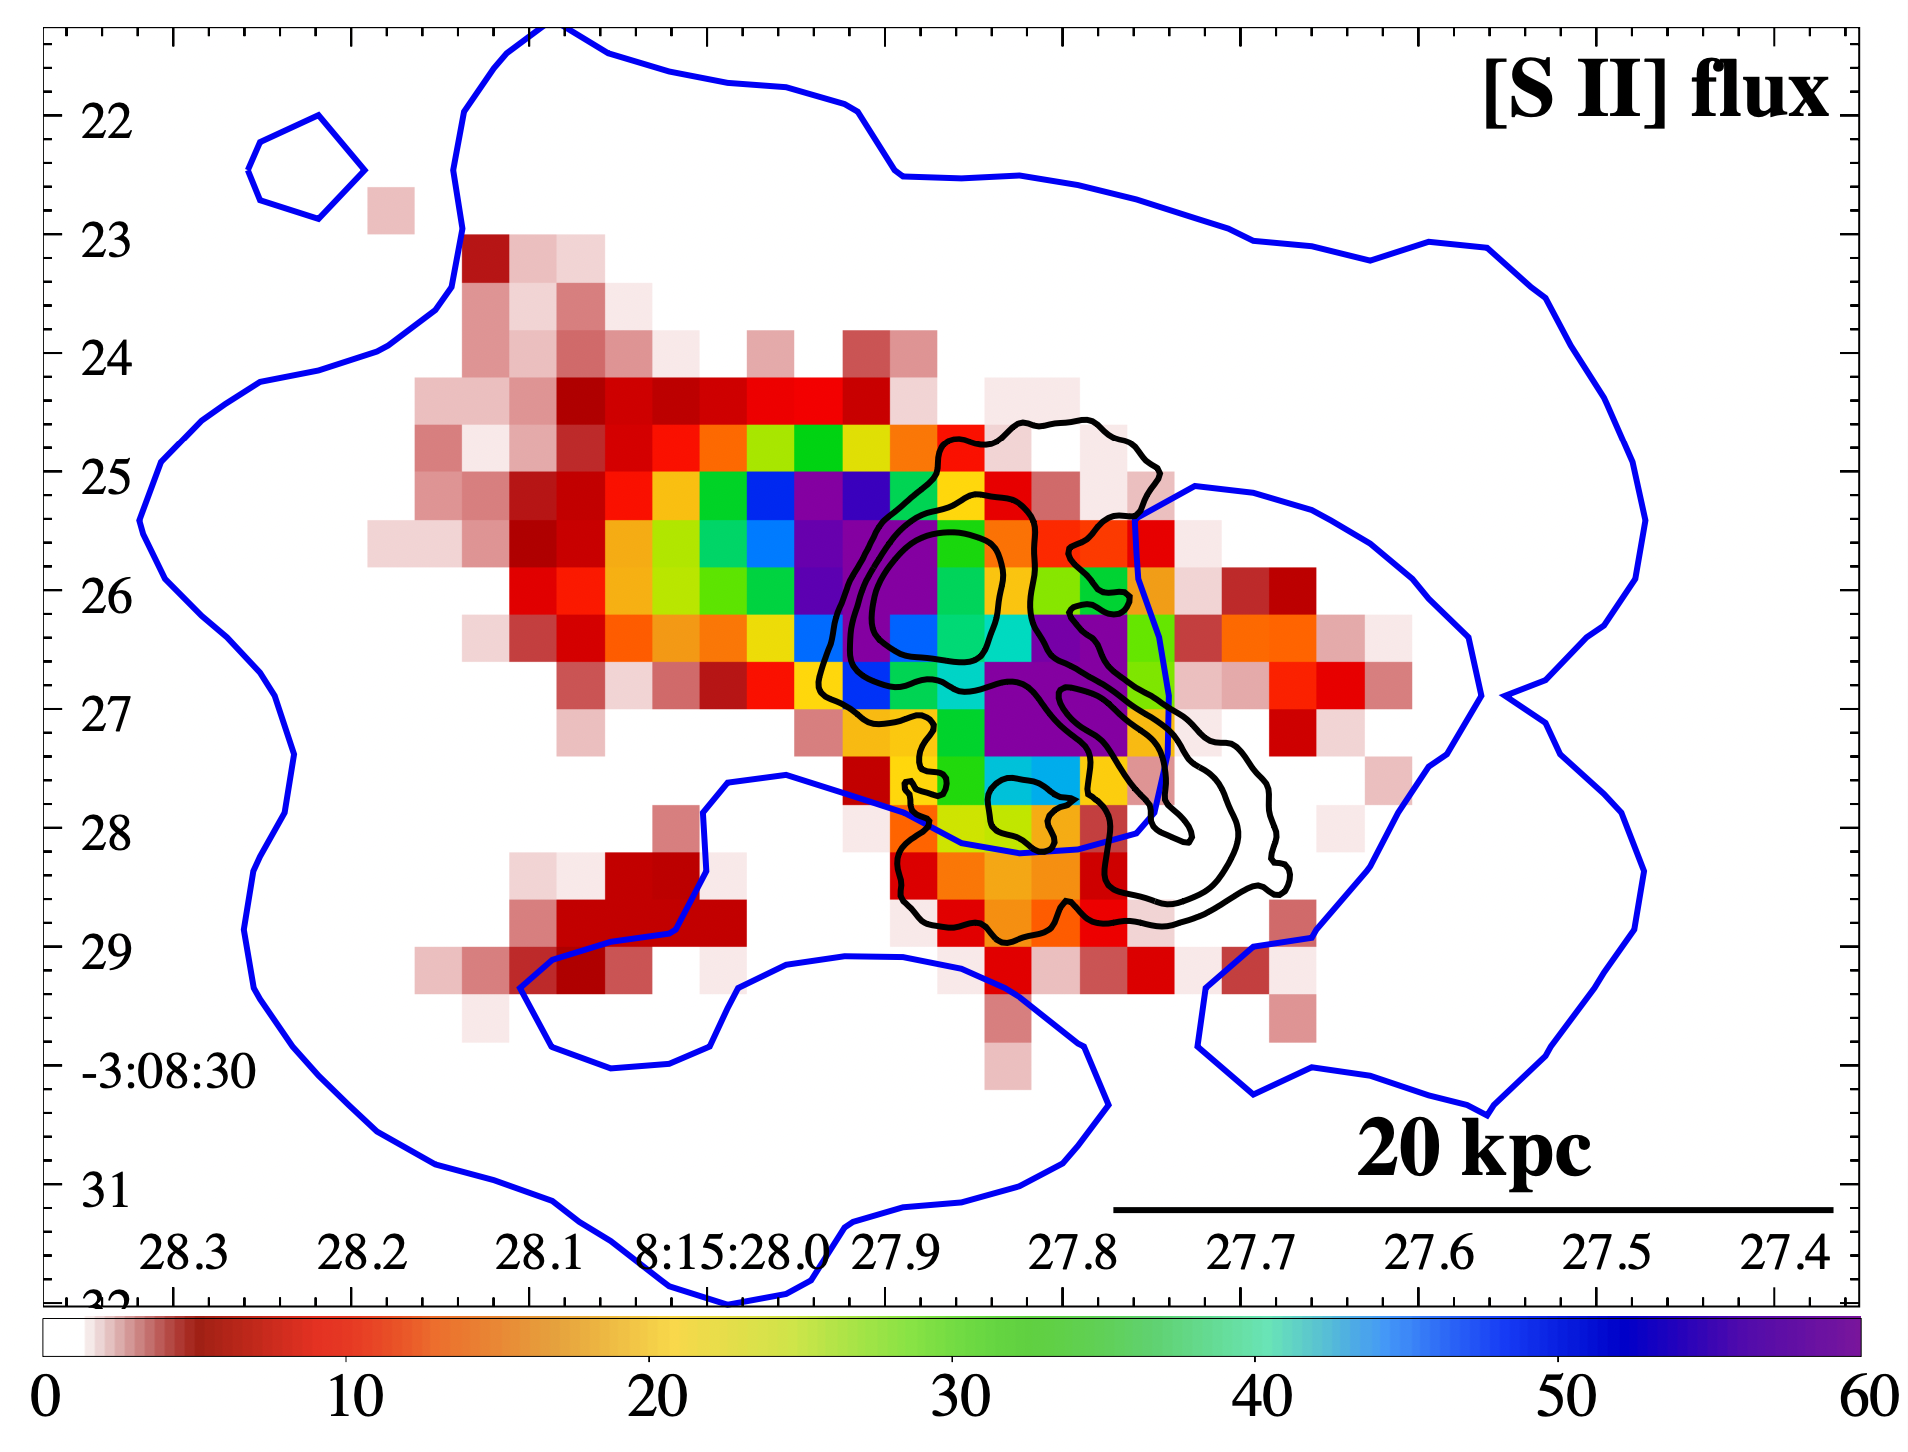
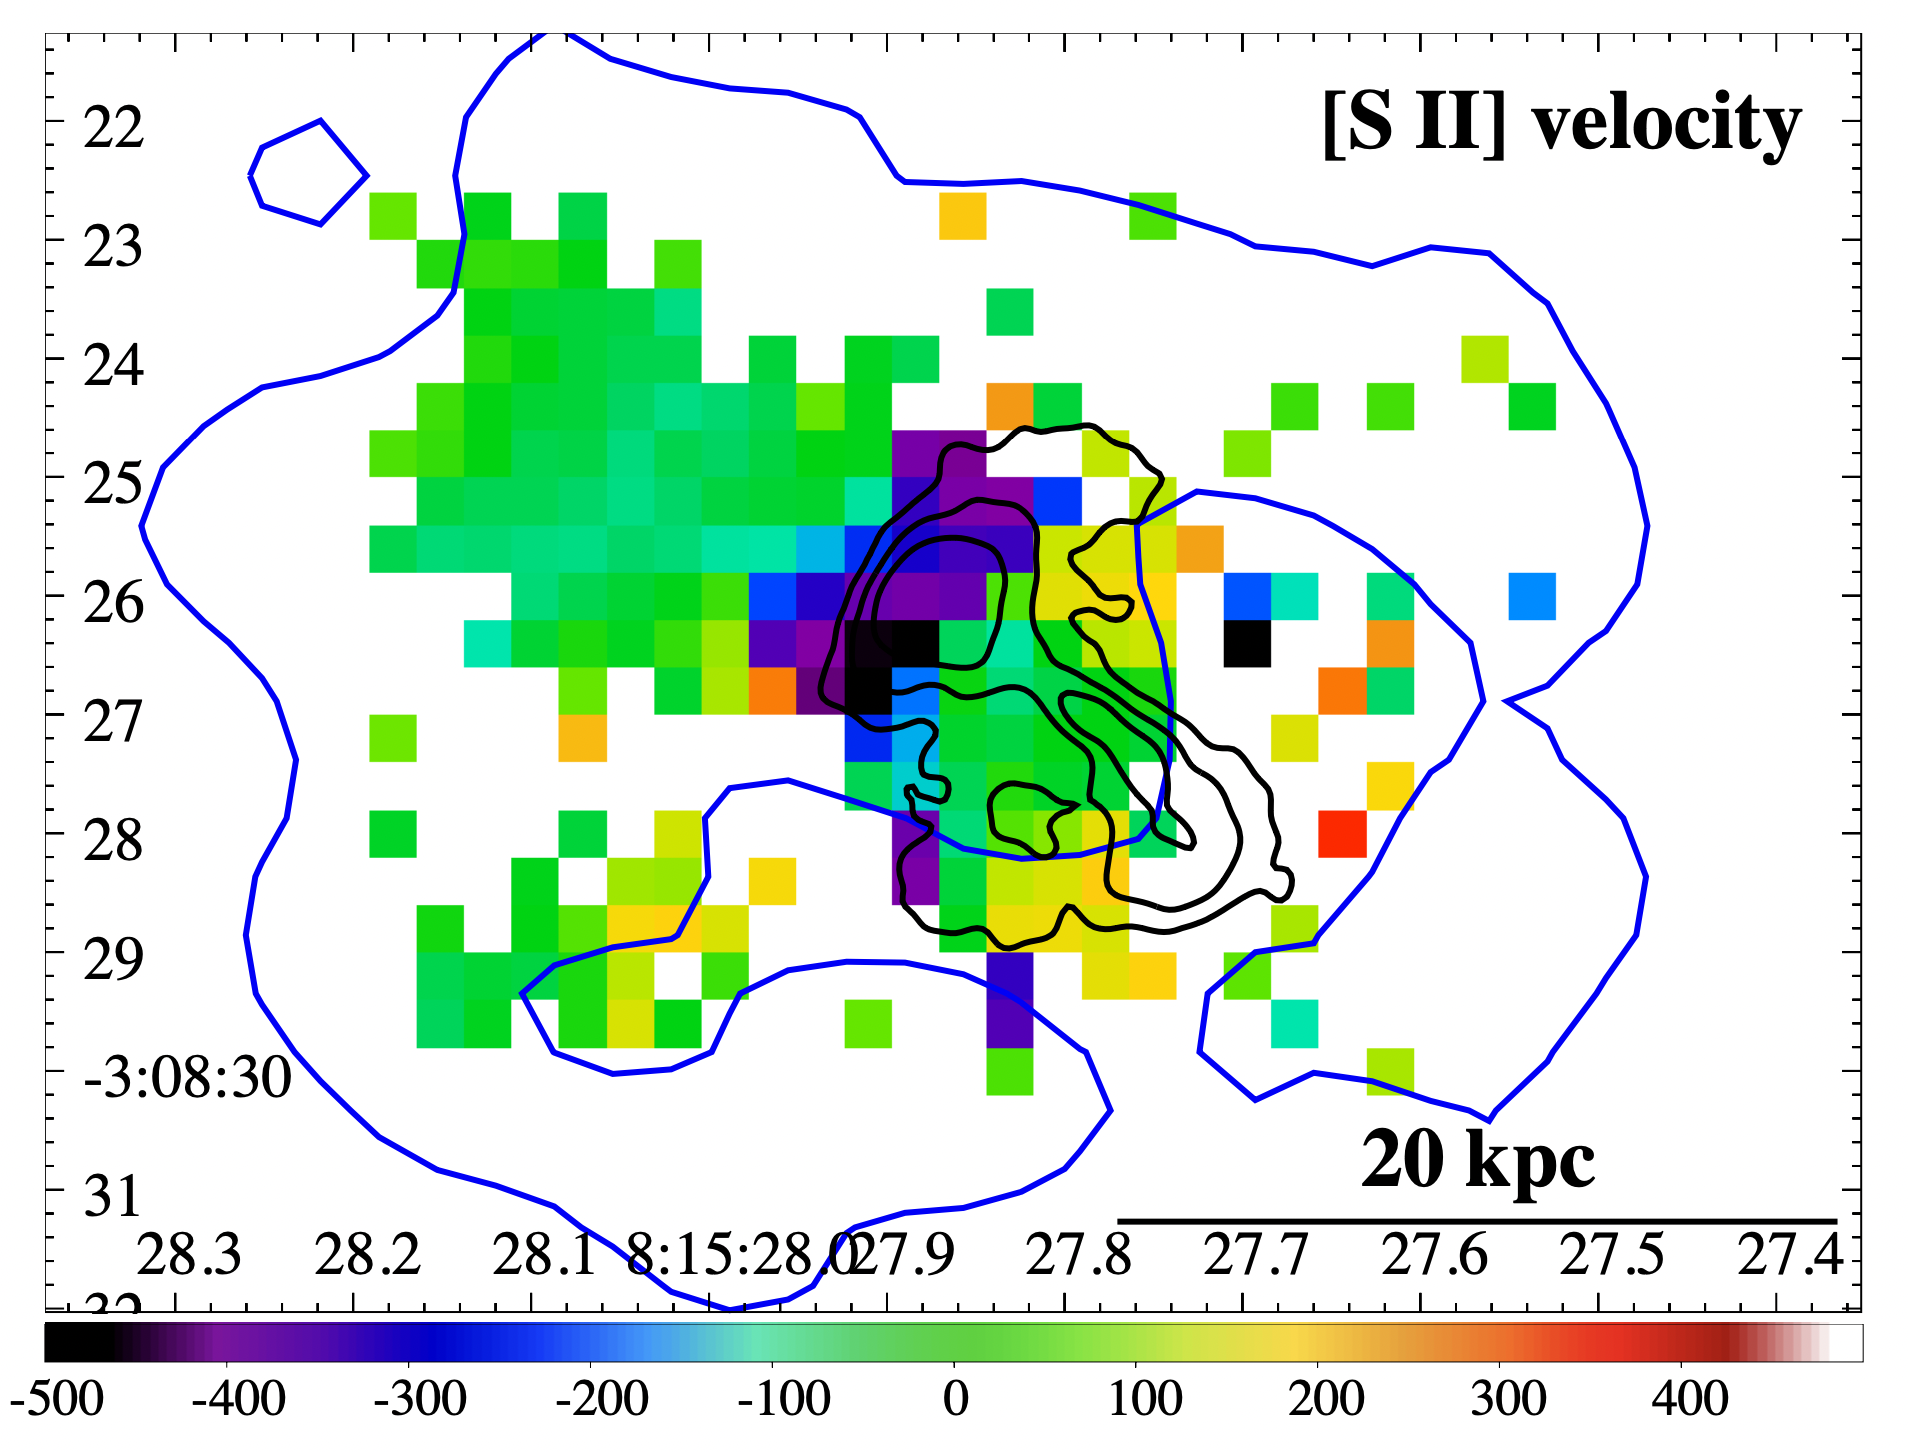
Appendix B Ionized gas kinematics
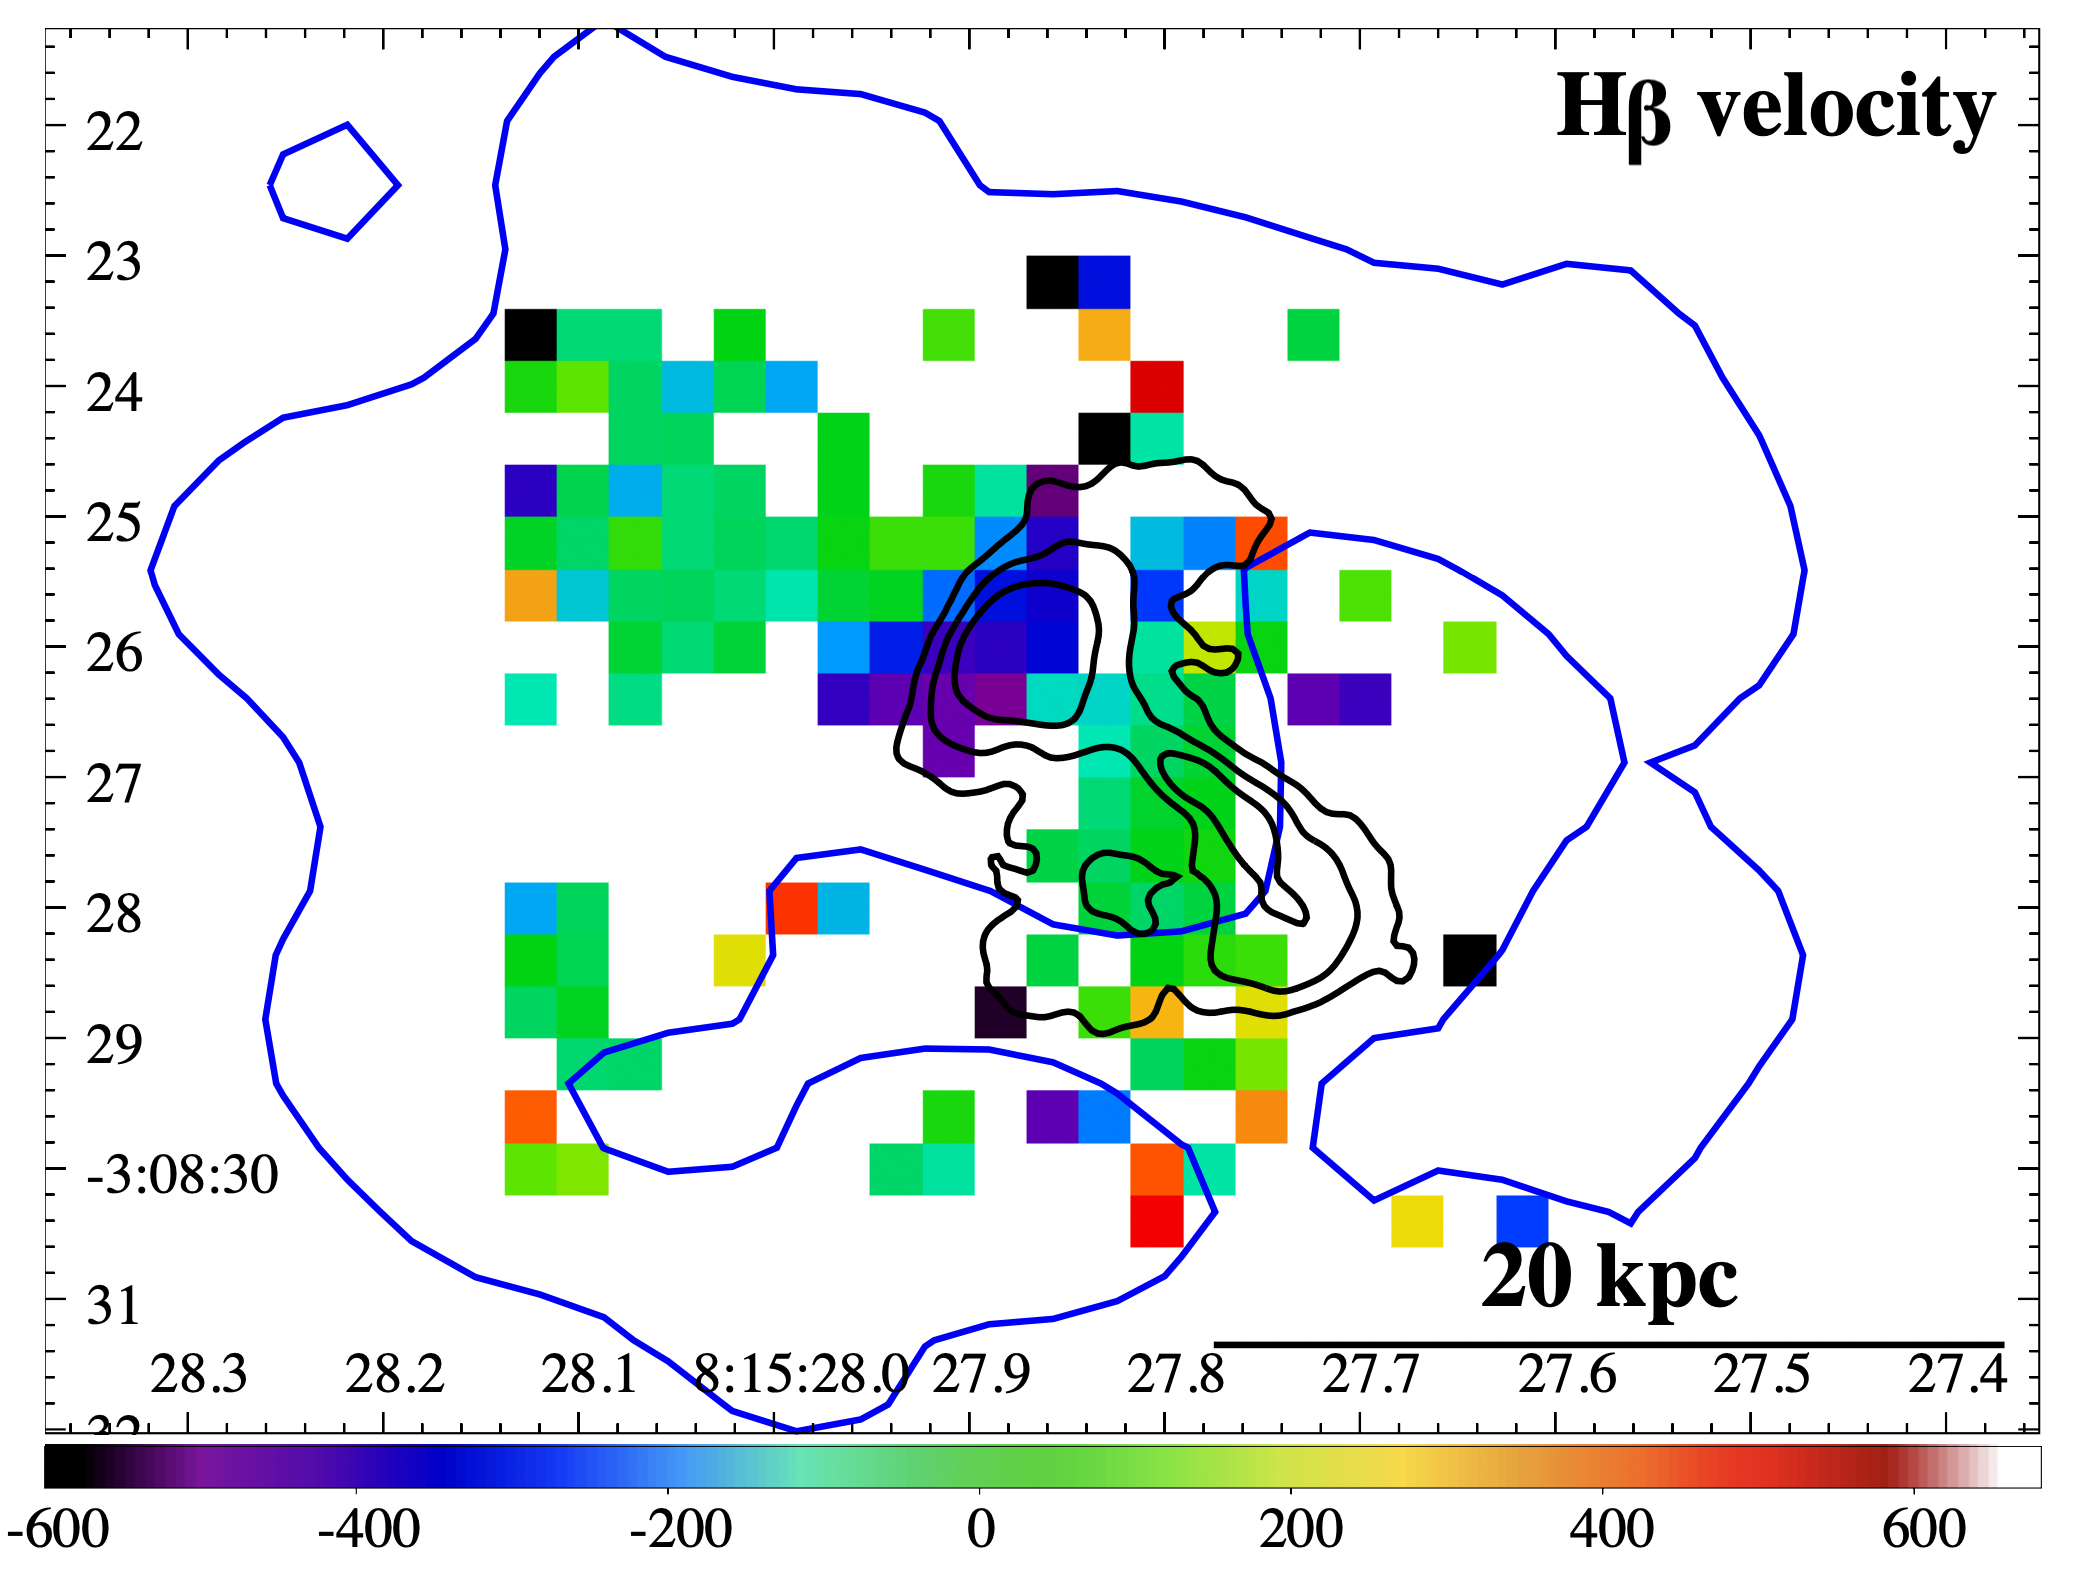
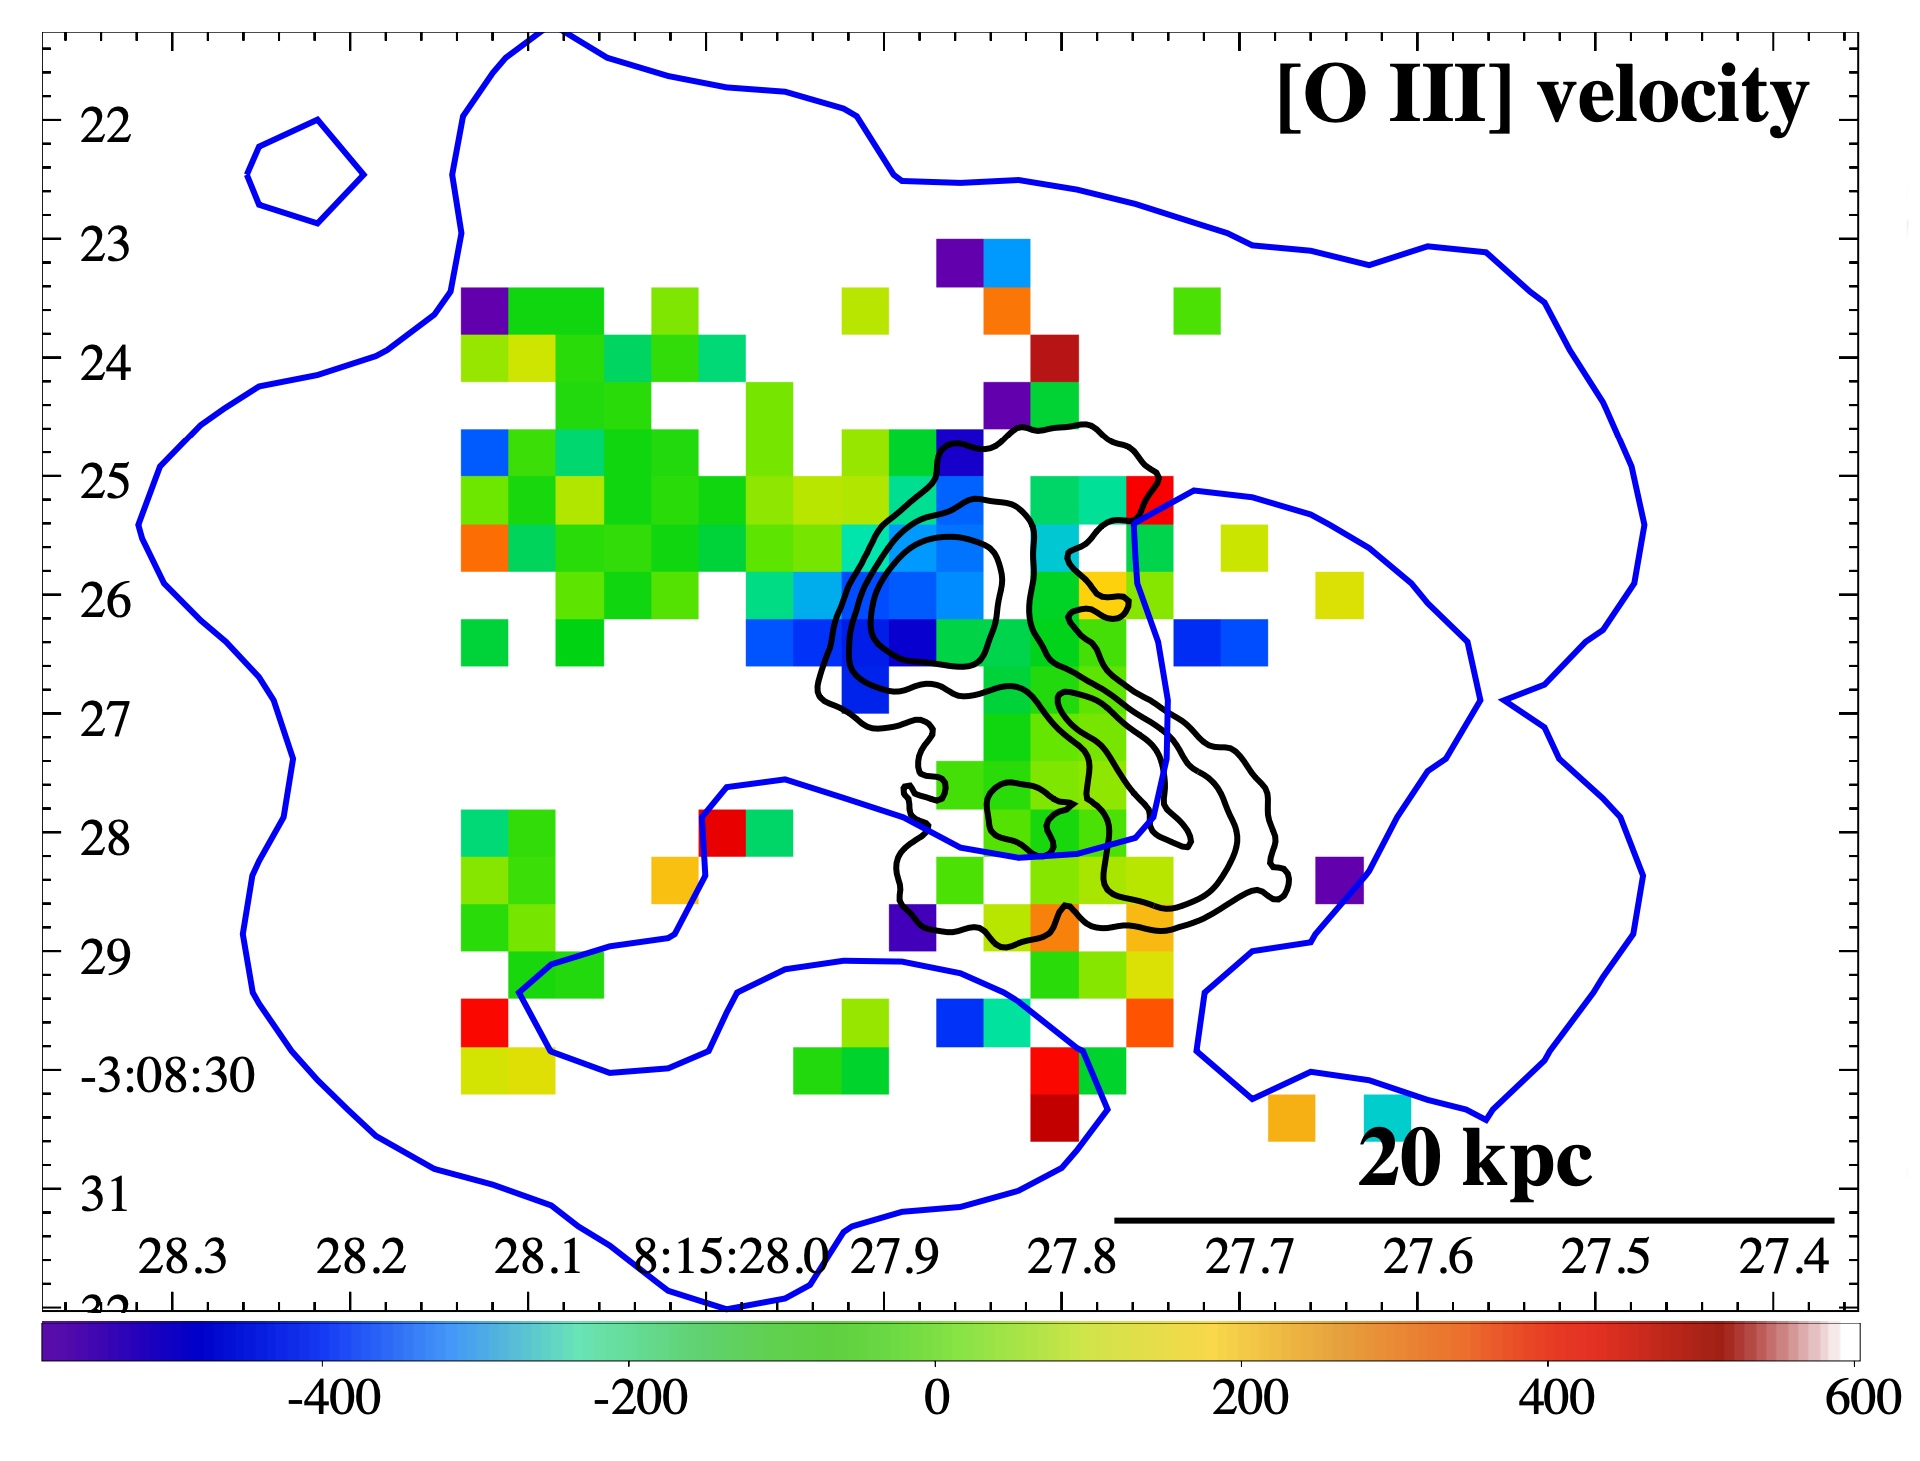
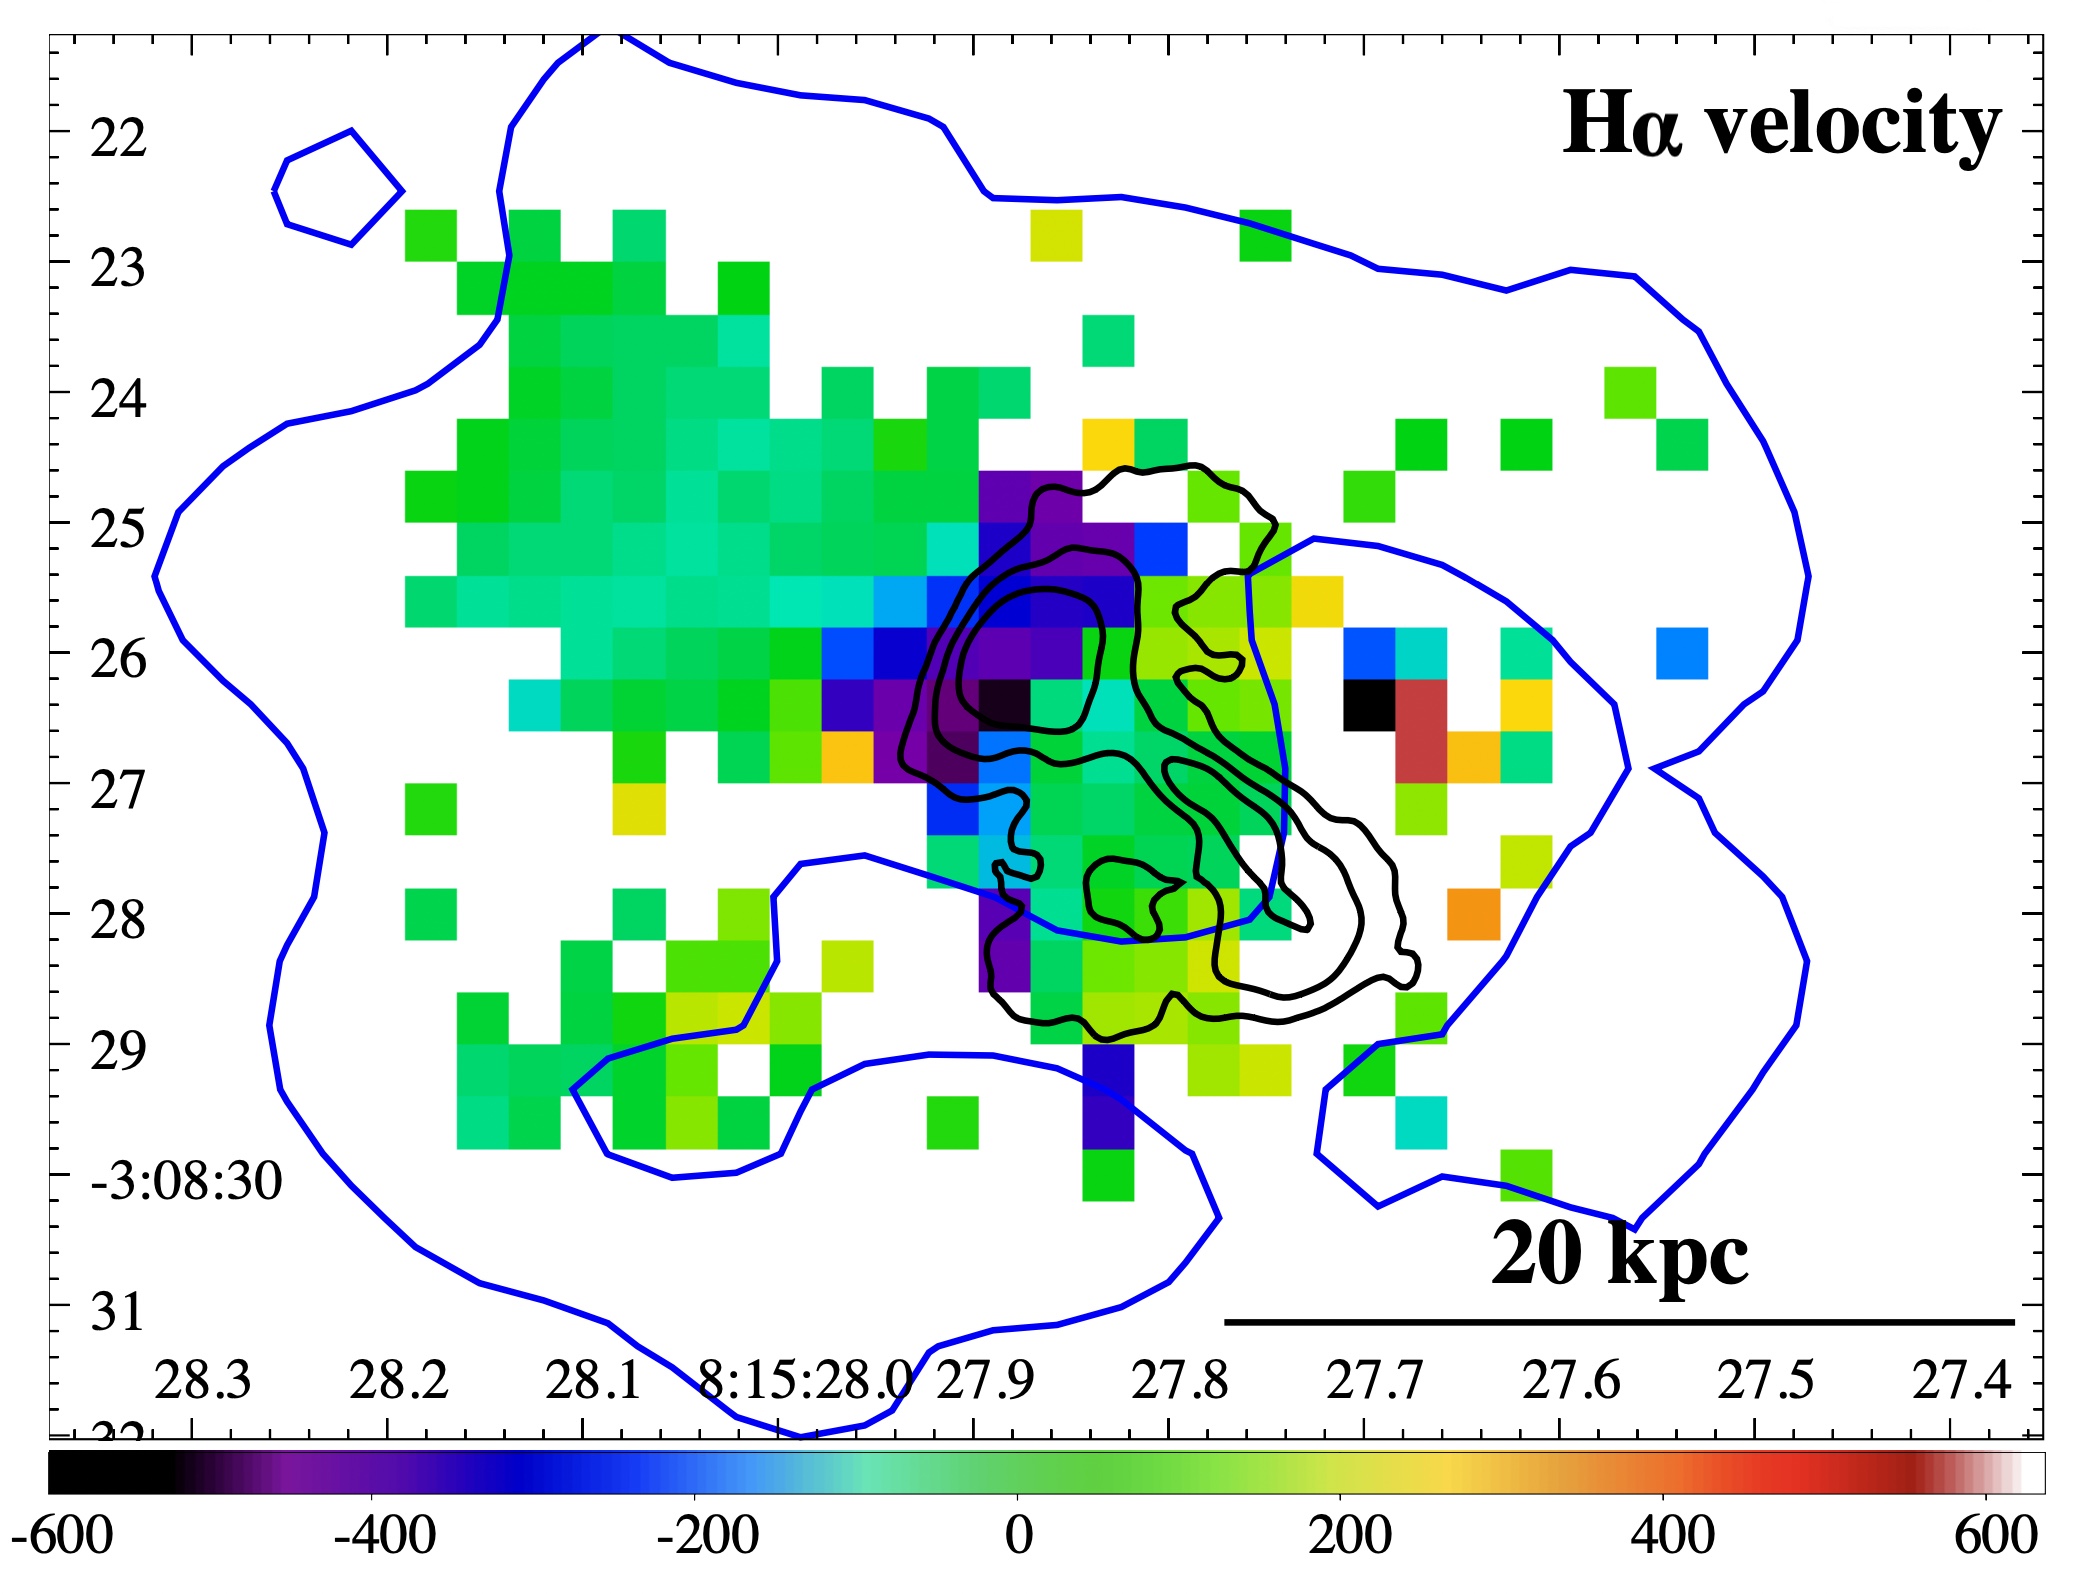
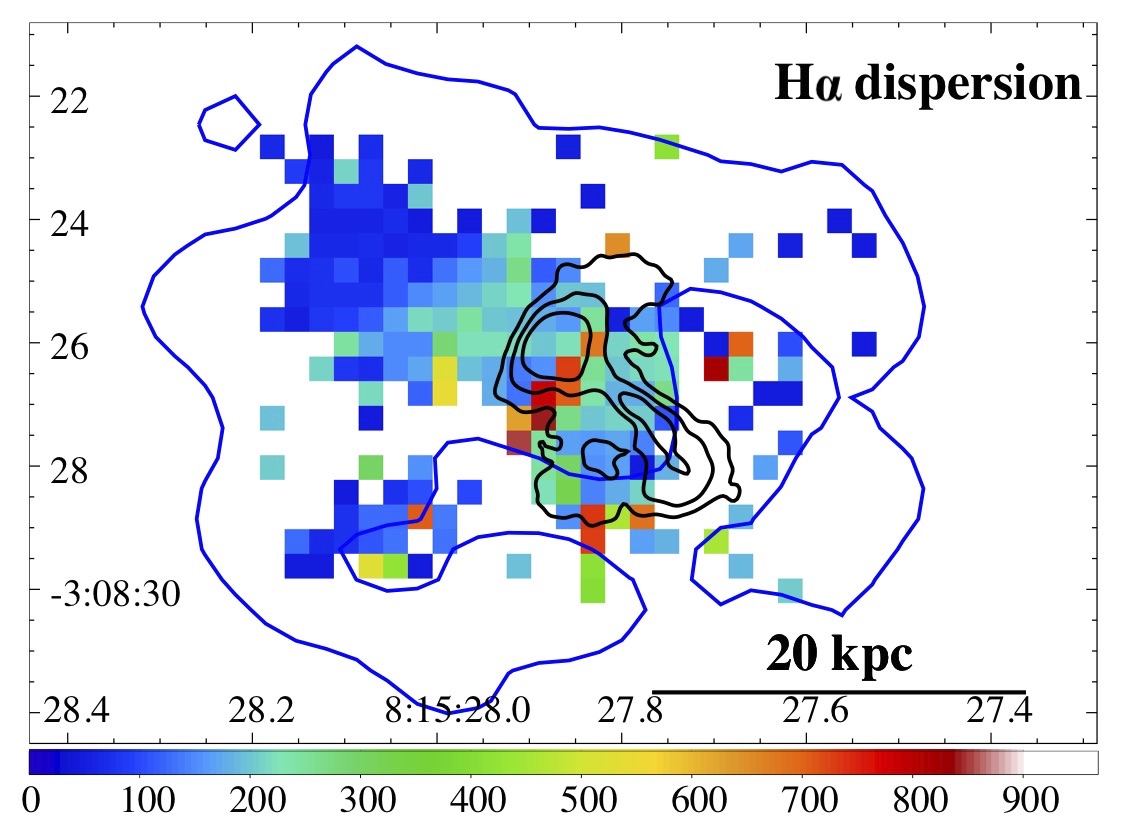
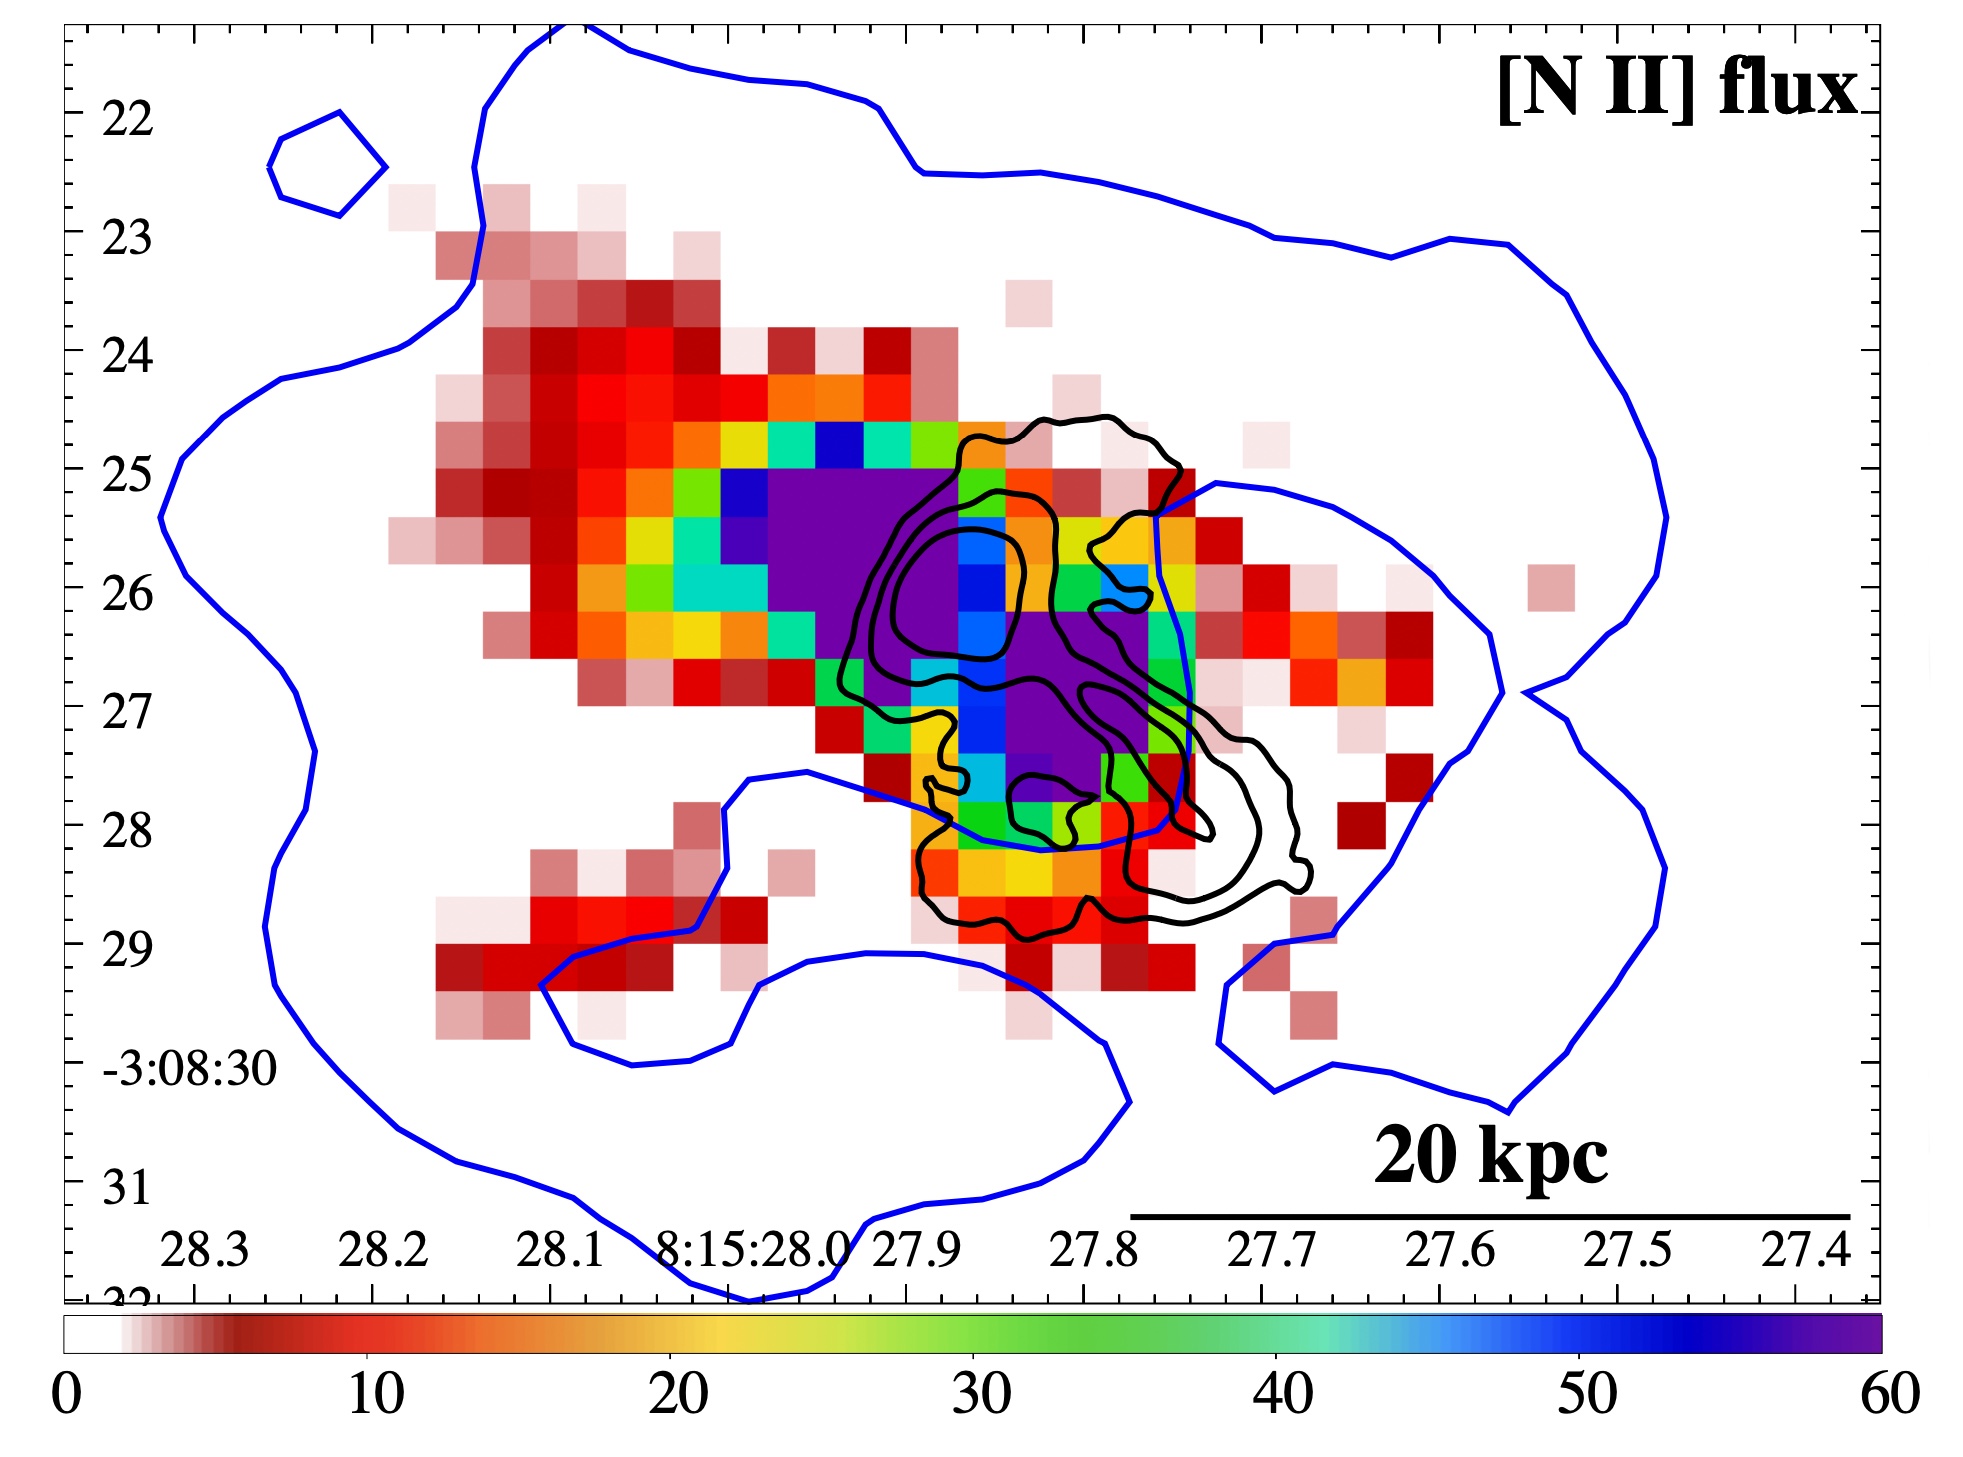
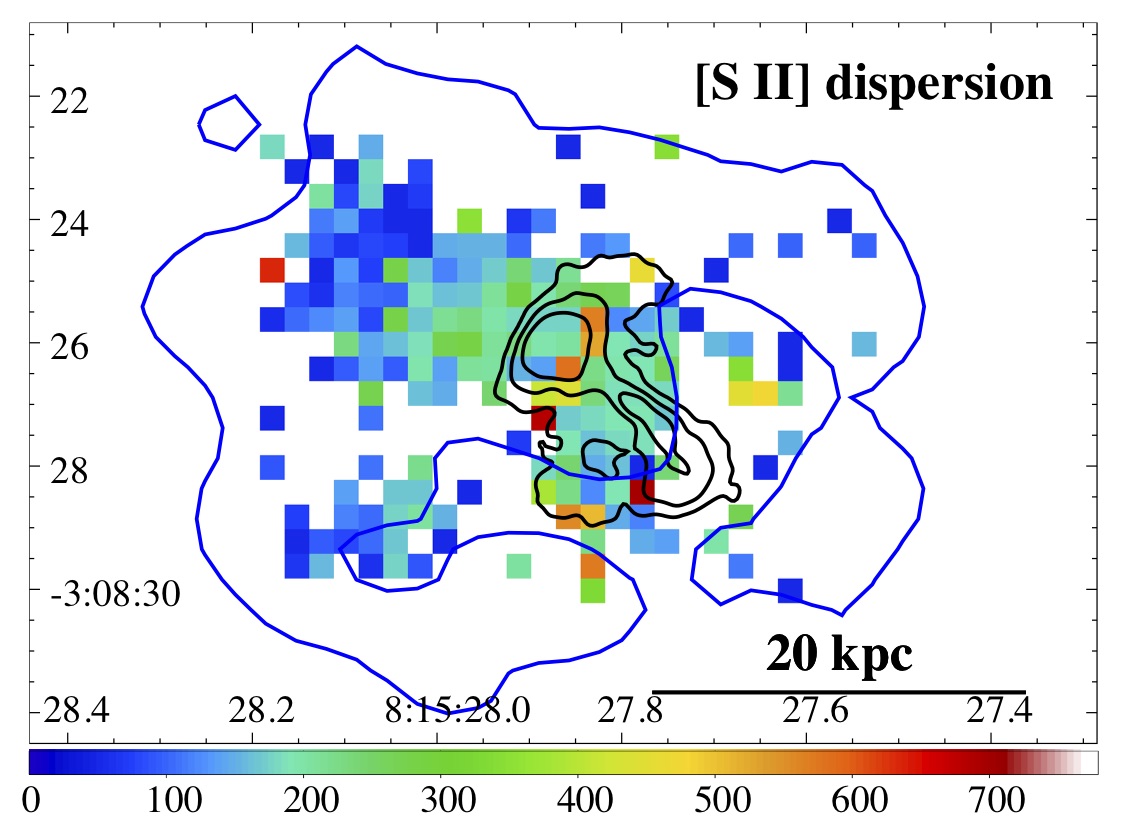
Here we report flux, velocity, and velocity dispersion maps for the H, [O III], [O I], H, [N II], and [S II] emission lines (see Fig. 8), obtained following the fitting procedure described in § 3.3, with Chandra and 8.4 GHz contours overlaid in blue and black, respectively. All maps were spatially binned by a factor of 2, resulting in a pixel size of 0.4 arcsec/pixel, to spatially Nyquist-sample the observation, as the image quality of MUSE data is of the order of 1″. Additionally this binning allows us to better match the resolution of Chandra and to increase the signal-to-noise ratio.
All emission features show similar morphologies and kinematics. The largest blueshift (-400 km s-1) can be seen at the termination of the northeastern radio lobe, pointing to the cooling of jet-heated ICM as the origin of ionized gas in the north-east direction. Lastly, the velocity dispersion of all lines is higher (200 - 300 km s-1) in the central 10 kpc of 3CR 196.1.