Defects and persistent luminescence in Eu-doped SrAl2O4
Abstract
We investigate native point defects and rare-earth (co)dopants in SrAl2O4 using hybrid density-functional defect calculations. Europium (Eu) and dysprosium (Dy) are found to be mixed valence and energetically most favorable at the Sr lattice sites. However, unlike Eu where both Eu2+ and Eu3+ can be realized in synthesis, Dy is stable predominantly as Dy3+, and the divalent Dy2+ may only be photogenerated under irradiation. On the basis of an analysis of Eu-related band–defect (including charge-transfer) and interconfigurational – optical transitions, we assign the characteristic broad blue (445 nm) and green (520 nm) emission bands in Eu2+-doped SrAl2O4 to the transition in Eu2+ incorporated at the Sr1 and Sr2 sites, respectively. Strontium interstitials (not oxygen vacancies, in contrast to what is commonly believed) and DySr can act as efficient electron traps for room-temperature persistent luminescence. This work calls for a re-assessment of certain assumptions regarding specific carrier trapping centers made in all mechanisms previously proposed for the persistent luminescence in Eu- and (Eu,Dy)-doped SrAl2O4. It also serves as a methodological template for the understanding and design of rare-earth doped phosphors.
pacs:
I Introduction
Persistent luminescence, previously often referred to as phosphorescence or long-lasting phosphorescence, is an intriguing phenomenon in which a material re-emits light over long periods of time after the excitation has stopped [1, 2]. Persistent luminescent materials (or persistent phosphors) have numerous applications and potential applications in safety signage and toys, road markings, solid-state lighting (flicker reduction), bio-imaging, nighttime solar energy, and photocatalysis [3]. Scientific research on persistent luminescence really took off since the discovery of (Eu,Dy)-doped SrAl2O4 by Murayam, Takeuchi, Aoki, and Matsuzawa of Nemoto & Co., Ltd. (Japan) in 1993; the material was found to produce extremely bright green and long-lasting (over many hours) luminescence in the dark [4, 5]. Three decades after the seminal work of the Nemoto researchers, although there has been great progress in understanding the phenomenon and in discovering new persistent phosphors–as it has already been documented in many excellent review articles and book chapters published in the last several years [1, 2, 3, 6, 7, 8], details of the underlying mechanism for the persistent luminescence observed in rare-earth (RE) doped SrAl2O4 and similar materials are still under debate, and the search for new or improved persistent phosphors, in general, remains largely trial and error.
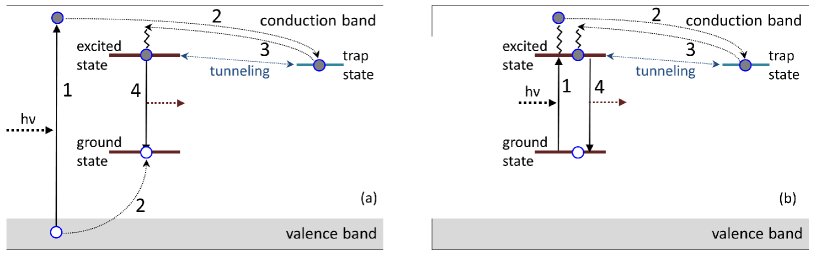
The optical properties of Eu-doped SrAl2O4 are characterized by a broad green emission band peaking at 520 nm at room temperature [9, 10, 11]. At lower temperatures, another peak occurs in the emission spectrum at 450 nm (blue) [12]. In addition, a broader excitation band peaking at 276 nm or 250 nm and sharp Eu3+ – transitions in the excitation and emission spectra have also been reported [13, 14, 15]. Co-doping the material with Dy does not change the emission spectrum, but strongly enhances the afterglow time and intensity [5]. There are currently about a dozen different mechanisms proposed in the literature to explain the persistent luminescence observed in Eu- and (Eu,Dy)-doped SrAl2O4 [5, 16, 17, 18, 19, 20, 21, 22, 23]. All these mechanisms involve defect levels induced by the RE (co)dopants and/or native point defects. Oxygen vacancies, in particular, have been invoked in many mechanisms as electron trapping centers responsible for the delayed emission. Figure 1 shows a currently generally accepted mechanism involving electron trapping and detrapping processes (a mechanism involving hole trapping and detrapping is similar) [2]. In the context of Eu2+-doped SrAl2O4, the emission center is expected to be Eu2+ with the ground and excited states being and , respectively, and the trapping center can be native defects and/or RE co-dopants or other impurities.
Due to the lack of a detailed understanding of defect physics in SrAl2O4, all the proposed mechanisms [5, 16, 17, 18, 19, 20, 21, 22, 23] are highly speculative about specific emission centers and charge carrier trapping centers. This has been a major obstacle toward rational design of persistent phosphors with improved performance. Here, we present an investigation of native defects and RE (co)dopants in monoclinic SrAl2O4 using first-principles defect calculations. The hybrid density-functional theory (DFT)/Hartree-Fock method [24] employed here has been shown to be successful in the study of defects in semiconductors and insulators in general [25] and RE-doped materials in particular [26, 27, 28]. On the basis of our results, we identify dominant native defects, discuss the stable valence states of the RE (co)dopants, and determine all energy levels induced by the defects. Eu-related optical transitions, including band–defect and interconfigurational Eu2+ – absorption and emission processes, are investigated to identify sources of the broad absorption and emission bands observed in experiments, including the characteristic blue and green emissions.
II Methodology
We model defects (i.e., native point defects and impurities) in SrAl2O4 using a supercell approach in which a defect is included in a periodically repeated finite volume of the host material. The formation energy of a defect X in effective charge state (with respect to the host lattice) is defined as [29, 25]
| (1) | |||||
where and are the total energies of the defect-containing and perfect bulk supercells, respectively; is the number of atoms of species that have been added () or removed () to form the defect; is the atomic chemical potential, representing the energy of the reservoir with which atoms are being exchanged, and referenced to the total energy per atom of in its elemental phase at 0 K. is the chemical potential of electrons, i.e., the Fermi level, representing the energy of the electron reservoir, referenced to the valence-band maximum (VBM) in the bulk (). Finally, is the correction term to align the electrostatic potentials of the bulk and defect supercells and to account for finite-size effects on the total energies of charged defects [30, 31].
Under thermodynamic equilibrium, the concentration of a defect is directly related to its formation energy [29]:
| (2) |
where is the number of high-symmetry sites in the lattice (per unit volume) on which the defect can be incorporated, is the number of equivalent configurations (per site), and is the Boltzmann constant. At a given temperature, a defect with a lower formation energy occurs with a higher concentration. Note, however, that when a material is prepared under non-equilibrium conditions excess defects can be frozen-in and the equilibrium concentration is only the lower bound.
While the Fermi level in Eq. (1) can be treated as a variable, it is not a free parameter. The actual Fermi-level position of the material can be determined by solving the charge-neutrality equation [29]:
| (3) |
where and are the concentration and charge, respectively, of defect Xi; and are free electron and hole concentrations, respectively; and the summation is over all possible defects present in the material.
The thermodynamic transition level between charge states and of a defect, , is defined as the Fermi-level position at which the formation energy of the defect in charge state is equal to that in state [25], i.e.,
| (4) |
where is the formation energy of the defect X in charge state when the Fermi level is at the VBM (). This level [also referred to as the level], corresponding to a defect energy level (or, simply, defect level), would be observed in experiments where the defect in the final charge state fully relaxes to its equilibrium configuration after the transition.
Defect-to-band and band-to-defect optical transitions, including those of the charge-transfer type [32], can be characterized using the optical transition level that is defined similarly to but with the total energy of the final state calculated using the lattice configuration of the initial state [25]. For the – transitions in neutral Eu defects, we calculate the energies based on a constrained occupancy approach and SCF analysis (SCF: self-consistent field), similar to that used in previous studies of RE-doped phosphors [33, 34]. In this approach, we create the excited state Eu in SrAl2O4 by manually emptying the highest Eu state and filling the next state lying higher in energy.
The total-energy electronic structure calculations are based on DFT with the Heyd-Scuseria-Ernzerhof (HSE) functional [24], the projector augmented wave (PAW) method [35], and a plane-wave basis set, as implemented in the Vienna Ab Initio Simulation Package (vasp) [36]. Along with the CPU version, the GPU port of vasp (version 6.2.1) is also used. The Hartree-Fock mixing parameter is set to 0.33 and the screening length to the default value of 10 Å to match the experimental band gap. We use the PAW potentials in the vasp database which treat Sr , Al , O , Eu , and Dy explicitly as valence electrons and the rest as core. Defects are modelled using monoclinic 213 (168-atom) supercells and integrations over the Brillouin zone are performed using the point, except in the constrained occupancy calculations (using vasp 5.3.3) where 113 (84-atom) supercells and a -centered 221 -point mesh are used. In the defect calculations, the lattice parameters are fixed to the calculated bulk values but all the internal coordinates are relaxed. In all the calculations, the plane-wave basis-set cutoff is set to 500 eV and spin polarization is included; structural relaxations are performed with the HSE functional and the force threshold is chosen to be 0.02 eV/Å. Spin-orbit interaction is not included as it has negligible effects on the defect transition levels [28].
The chemical potentials of Sr, Al, and O vary over a range determined by requiring that the host compound SrAl2O4 is stable against competing Sr–Al–O phases; see Sec. III.1. Experimentally relevant or representative sets of , , and are adopted to present defect formation energies. The chemical potential of Dy is obtained by assuming equilibrium with Dy2O3; that of Eu by assuming equilibrium with Eu2O3 (under oxidizing conditions) or EuO (under reducing conditions). It should be noted that the transition levels and are independent of the choice of the atomic chemical potentials.
III Results and Discussion
III.1 Bulk properties
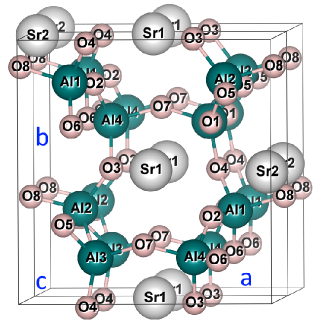
SrAl2O4 crystallizes in the monoclinic space group [37]; see Fig. 9 in Appendix A. Its crystal structure has two inequivalent Sr lattice sites, four inequivalent Al sites, and eight inequivalent O sites. The Sr sites, Sr1 and Sr2, are in channels along the -axis formed by the Al–O framework (hereafter referred to as the Sr1 and Sr2 channels). The calculated lattice parameters are Å, Å, Å, and , in excellent agreement with the experimental values [37]. The calculated band gap is 6.51 eV, an indirect gap with the valence-band maximum (VBM) at the point in the Brillouin zone and the conduction-band minimum (CBM) at the point. For comparison, the reported experimental band gap is 6.5–6.6 eV [5, 38, 39]. The VBM consists primarily of the O states, whereas the CBM consists of a mixture of the Sr, Al, and O states. The total static dielectric constant is calculated to be 9.36 (taken as the average of the , , and components) with the electronic contribution based on the real part of the dielectric function for obtained within HSE and the ionic contribution calculated using density-functional perturbation theory [40] within the generalized-gradient approximation [41].
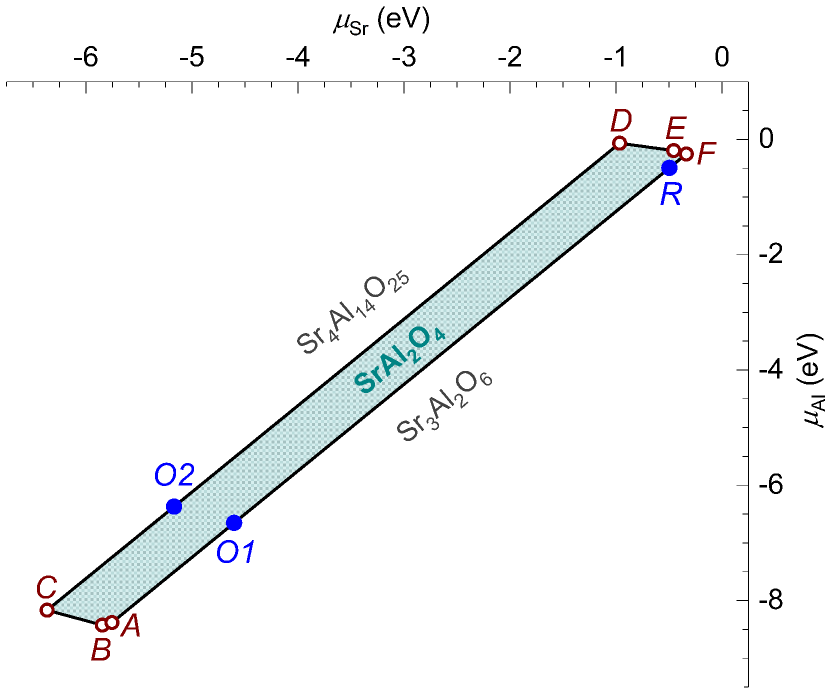
Figure 2 shows the phase stability of SrAl2O4. The formation enthalpies (calculated at 0 K) of different Sr–Al–O phases are listed in Table 1 in Appendix A. The initial structures of these phases are taken from the Materials Project database [42]. The stability region of SrAl2O4 is delineated mainly by Sr3Al2O6 and Sr4Al14O25, which is consistent with the experimental phase diagram [43, 44].
In the presentation of defect formation energies in the next sections, we make use of the following points in the phase diagram: (i) , where the host compound is in equilibrium with Sr3Al2O6 and air (the oxygen partial pressure atm) at 750∘C, (ii) , where the host is in equilibrium with Sr4Al14O25 and air at 750∘C, and (iii) , where the host is in equilibrium with Sr3Al2O6 and Ar/H2 5% ( atm) at 1400∘C. Points and (with eV) represent oxidizing environments, whereas point ( eV) represents a highly reducing environment. Here, is calculated as half of the Gibbs free energy of O2 gas at the given and values [45]. These conditions are chosen to reflect the conditions under which undoped and Eu-doped SrAl2O4 samples are often prepared. Beauger [16] reported the presence of Sr3Al2O6 as an impurity phase, indicating that their synthesis environment corresponds to a point very close to the line in Fig. 2.
III.2 Native point defects
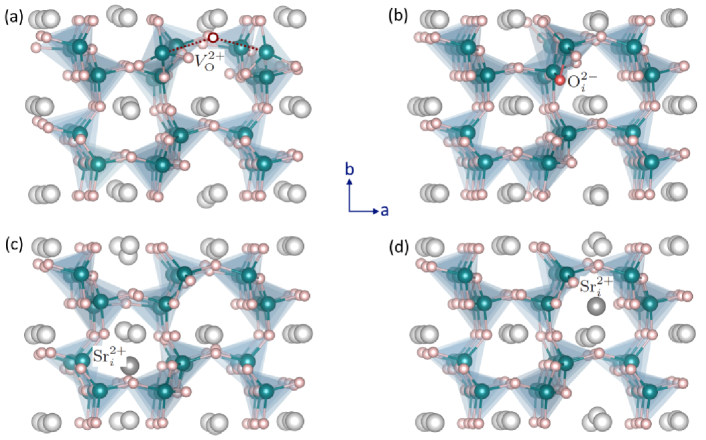
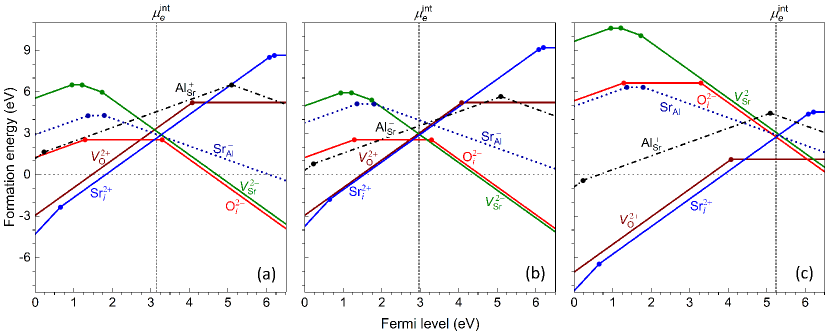
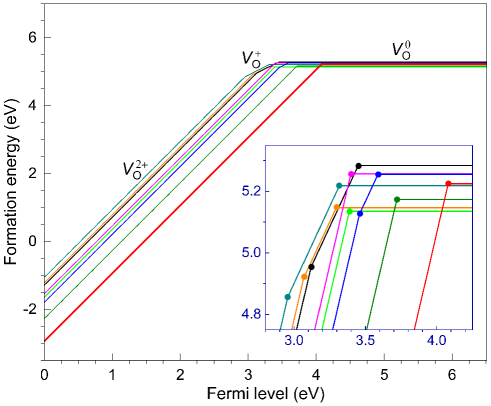
Figure 3 shows the formation energy of native defects in SrAl2O4. The defects introduce one or more energy levels in the host’s band gap region (marked by large dots in the figure; explicit numerical values are listed in Table 2). Under the experimentally relevant conditions (see Sec. III.1), the dominant defects (i.e., those with the lowest formation energy) are Sr and O vacancies and interstitials. In the absence of impurities, intentionally doped or unintentionally present, the Fermi level is “pinned” at the position (“int” for intrinsic), determined predominantly by the lowest-energy charged defects, where the charge neutrality condition (3) is maintained. From one point in the phase diagram (Fig. 2) to another, the defect landscape in SrAl2O4 changes, leading to a change in the value; e.g., moves toward the CBM in going from oxidizing (points and ) to reducing (point ) synthesis conditions. We find that varies from 2.28 eV (under the conditions at point ) to 5.36 eV (point ). The Fermi level of SrAl2O4, even in the presence of intentional and/or unintentional impurities, cannot be close to the VBM (under all synthesis conditions) but can, in principle, be high up at the CBM (under reducing synthesis conditions only). This is because the formation energy of certain native defects, specifically Sr interstitials and O vacancies, is negative in the region near the VBM (up to eV at point and higher at other points in the phase diagram), whereas the native defects can all have a positive formation energy under the reducing conditions (e.g., those at points – and ).
The removal of an O2- results in a positively charged O vacancy (, spin ). Other charge states, () and (), are also stable. The energetics and electronic behavior of are different at the inequivalent O lattice sites due to the slightly different local lattice environments. At certain O sites (e.g., at the O8 site as shown in Fig. 3), is energetically less favorable than and in the entire range of the Fermi-level values. Notably, the energy levels introduced by the vacancy at the O1 to O8 sites are all about 2.43–3.55 eV below the CBM; see Fig. 10. The lowest-energy configuration occurs at the O8 site, see Fig. 4(a), indicating that the Al–O8 bonds are weakest. The highest-energy occurs at the O1 site. Under reducing conditions (e.g., at point ), occurs in the form of with a high concentration (highest among all native defects).
Our results for the oxygen vacancies are thus in sharp contrast to those of Finley et al. [47] where the defect energy levels introduced by were found to scatter all over the upper half of the host band gap region. Given the similarity in the bonding environments of the inequivalent O sites (e.g., every single O atom is bonded to two Al atoms), the almost random distribution of the defect levels reported in Ref. [47] cannot be justified.
The addition of an oxygen, which results in an oxygen interstitial (Oi), introduces energy levels near the midgap region; see also Table 2. In the O () configuration, the added O2- is shared between two AlO4 units; Fig. 4(b) [and Fig. 11(a)]. O (; not visible in Fig. 3 due to its very small stability range) is a complex of O and an electron hole localized at an O site (hereafter referred to as , ). The structure of O [; Fig. 11(b)] can be described as having the interstitial oxygen bonded to one of the O atoms in an AlO4 unit (the O–O distance is 1.48 Å), resulting in a distorted AlO5. O () is a complex of O and .
The removal of a Sr2+ ion from the host lattice results in a negatively charged Sr vacancy (, ). Other stable charge states of are (), (), and (), which can be regarded as complexes consisting of and one, two, and three defects, respectively. at the Sr1 site is slightly lower in energy than that at the Sr2 site, e.g., by 0.08 eV in the case of . The defect levels associated with are in the lower half of the band gap region; see also Table 2.
There are two possible sites for Sr interstitials (Sri): one, Sri1, locating in the Sr1 channel (along the -axis) but off the Sr1 chain and between two Al atoms (along the -axis), see Fig. 4(c), and the other, Sri2, in the Sr2 channel but off the Sr2 chain and between two Al atoms (along the -axis), see Fig. 4(d) [and Fig. 11(c)]. Sri1 and Sri2 are approximately at the interstitial sites and , respectively, mentioned in Bierwagen et al. [14]. Sri2 is lower in energy than Sri1 (e.g., by 0.19 eV in the case of Sr, ). The defect introduces three defect levels: one above the VBM and two just below the CBM. The other charge states are Sr (; a complex of Sr and ), Sr (), and Sr (). At , Sr is energetically most stable among the stable charge states of Sri and one of the lowest-energy native defects.
Antisite defects, AlSr and SrAl, are also considered. We find that they are higher in energy than the Sr and O vacancies and interstitials. AlSr is lower in energy at the Sr2 site than at the Sr1 site, e.g., 0.55 eV lower in the case of Al (); Al () is a complex of Al and . SrAl is energetically most favorable at the Al2 site; Sr () and Sr () are defect complexes of Sr and one and two , respectively. Finally, the creation of Al vacancies () involves breaking four strongly covalent Al–O bonds, a high energy process. Such defects, as well as Al interstitials (Ali), have high formation energies and are thus not included here.
III.3 Rare-earth (co)dopants
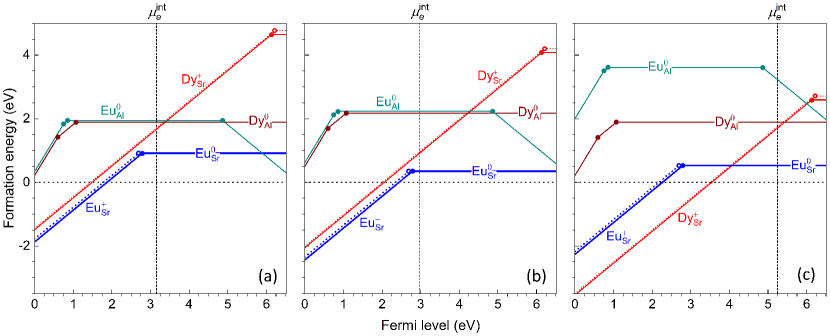
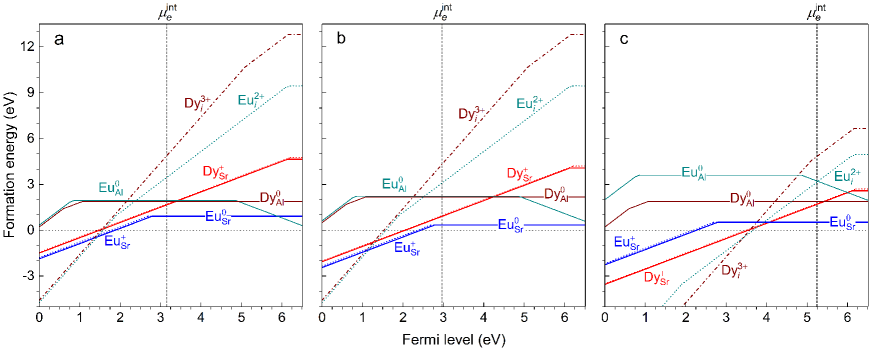
Figure 5 shows the formation energy of substitutional Eu and Dy impurities at the Sr and Al sites. Results for the REs at the interstitial sites are included in Fig. 12. Table 2 lists explicit numerical values of the energy levels and stable RE ions. We find that, at and near the Fermi level determined by the native defects (), RESr is lower in energy than REAl and REi, indicating that Eu and Dy are incorporated into SrAl2O4 at the Sr sites.
EuSr is stable as Eu (i.e., Eu2+, with a magnetic moment of 7; spin ) and/or Eu (i.e., Eu3+, with a magnetic moment of 6; ). The Eu configurations at the Sr1 and Sr2 sites are almost degenerate in energy, whereas Eu at the Sr2 site is 0.09 eV lower in energy than at the Sr1 site. The level of EuSr is 2.69 eV above the VBM when incorporated at the Sr1 site or 2.79 eV when incorporated at the Sr2 site; below (above) this level, Eu3+ (Eu2+) is energetically more favorable. The Eu2+/Eu3+ ratio thus depends on the actual position of the Fermi level which, in turn, depends on the synthesis conditions. The ratio is high under reducing conditions (e.g., at point ) and decreases as one changes from reducing to oxidizing conditions. Note that, under actual synthesis conditions and as Eu-doped SrAl2O4 is typically prepared using Eu3+ as dopant, an equilibrium assumption may not hold true, and the trivalent ion may be frozen in [14]. In other words, Eu3+ may be present even in samples prepared under less oxidizing conditions.
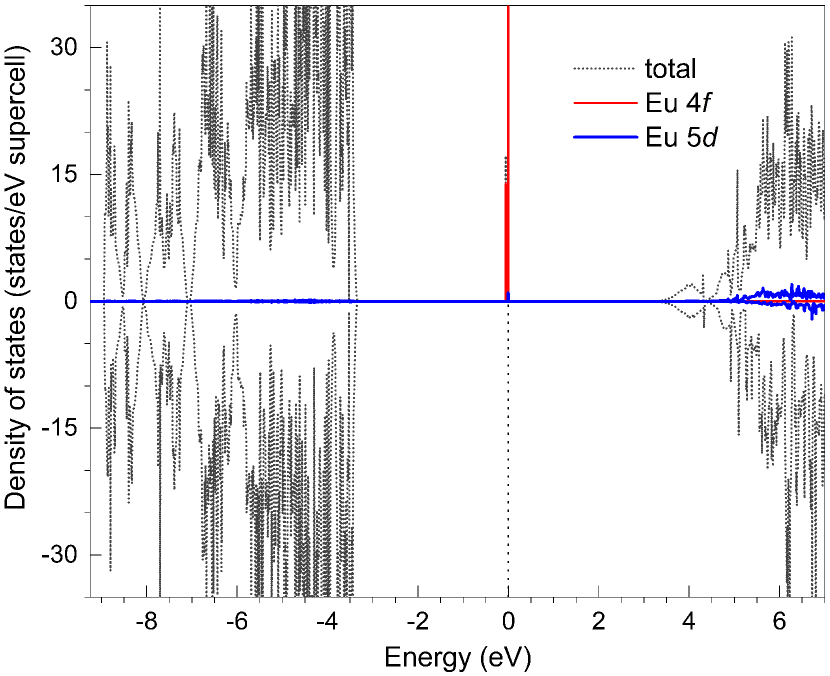
The mixed valence of Eu in SrAl2O4 can be understood based on the calculated electronic structure of Eu, reported in Fig. 6. The HSE calculations of the electronic density of states are carried out using a smaller, supercell and a -centered -point mesh. Eu has seven occupied spin-up states in the host band gap (and seven spin-down unoccupied states deep in the conduction band). Given the electronic structure, when one electron is removed from this neutral defect configuration, the electron is removed from the highest occupied state (which is the highest Eu state). This results in the divalent Eu2+ () being oxidized to the trivalent Eu3+ (), i.e., Eu to Eu. Figure 13(a) shows the localized Eu electron associated with Eu.
At and near , EuAl is stable as Eu (i.e., Eu3+) under the oxidizing conditions ( and ), and as Eu (i.e., Eu2+) and/or Eu under the reducing condition (). Other electronically stable charge states are Eu (a complex of Eu and ) and Eu (a complex of Eu and two ). These positively charged states, however, cannot be obtained during synthesis due to the negative formation energies of EuSr and the native defects in the region above the VBM. We find that, at and near , Eui is electronically stable as Eu (i.e., Eu2+) and has a much higher formation energy than EuSr and EuAl.
The mixed valence of Eu is well discussed in the experimental literature [16, 19, 48, 14]. The fact that both Eu3+ and Eu2+ can be realized in as-prepared SrAl2O4 is consistent with the above results showing the level of EuSr is located near midgap and the stability ranges of Eu and Eu are accessible during synthesis. Wang et al. [49] found Eu2+ to be distributed almost equally at the two Sr sites, consistent with the fact that the energies of Eu at the Sr1 and Sr2 sites are almost equal. Note that other valence states of Eu (e.g., Eu+, as proposed by Matsuzawa et al. [5]) cannot be stabilized electronically.
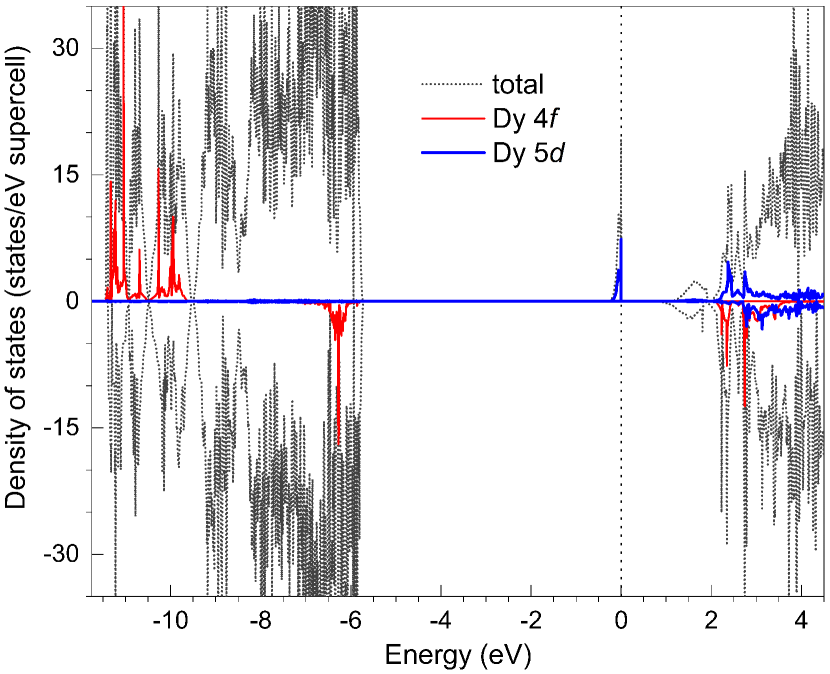
DySr is energetically favorable as Dy (i.e., Dy3+; ) in almost the entire range of the Fermi-level values and as Dy (i.e., Dy2+; ) in a small range below the CBM. The level is located at 6.21 eV (6.13 eV) above the VBM, i.e., 0.30 eV (0.38 eV) from the CBM, at the Sr1 (Sr2) site. The defect is slightly lower in energy at the Sr2 site than at the Sr1 site; the difference is 0.12 eV for Dy or 0.05 eV for Dy. We find that the electronic configuration of Dy3+ is , whereas that of Dy2+ is . Figure 7 shows the electronic structure of Dy. The nine (seven spin-up and two spin-down) occupied Dy states are in the valence band, the occupied Dy state is in the upper half of the host band gap, and the five spin-down unoccupied Dy states are in the conduction band. When one electron is removed from Dy, it is removed from the Dy state, which leads to the formation of Dy. Figure 13(c) shows the localized Dy electron associated with the Dy configuration.
DyAl is stable as Dy (i.e., Dy3+), except near the VBM where it is stable as Dy (i.e., Dy4+ with the electronic configuration ) or Dy (a complex of Dy and ). However, given the negative formation energy of DySr and the native defects in the region above the VBM, these positive charge states are inaccessible during synthesis. Dyi is stable as Dy; see Fig. 12. At and near , DyAl and Dyi are all higher energy than DySr, indicating that Dy is incorporated at the Sr sites.
The results for the Dy-related defects thus confirm the stabilization of Dy, consistent with the fact that Dy is present as Dy3+ in as-prepared Dy-doped samples. Interestingly, Dy (i.e., Dy2+) is also found to be structurally and electronically stable. Dy, however, has a very small stability range that is close to the CBM, and in that range DySr becomes much less favorable energetically than Dy (i.e., Dy3+), indicating that the divalent Dy2+ is almost impossible to obtain during synthesis. It can be photogenerated under irradiation nonetheless. Experimentally, Joos et al. [50] reported evidence of the Dy3+/2+ valence change in (Eu, Dy)-doped Sr4Al14O25 under laser excitation. A similar process for Dy could be observed in SrAl2O4. Note that Dorenbos [20] estimated the “ground state of Dy2+” to be at 0.9 eV below the CBM, based on a semiempirical model. Such a level is much lower than our calculated level of DySr. Our results also show that Dy4+ is not stable electronically at the Sr site; the tetravalent ion is stable at the Al site but energetically unfavorable, as discussed above.
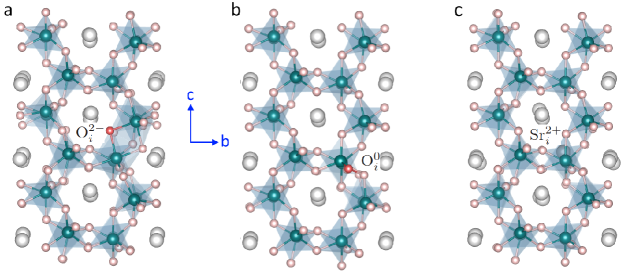
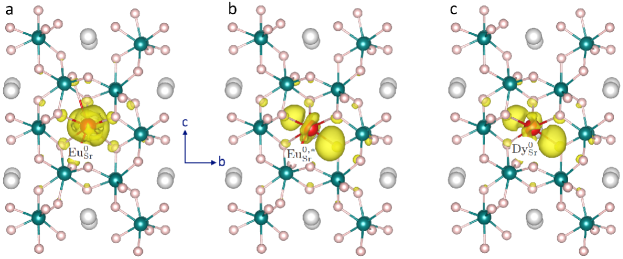
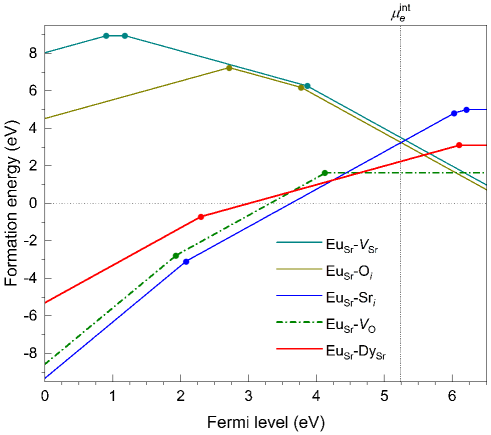
Finally, we consider possible association between EuSr and DySr or a native defect. Figure 14 shows the formation energy of EuSr-DySr, EuSr-, EuSr-Oi, EuSr-, and EuSr-Sri; see also Table 3 for details on the stable charge states of the complexes. Focusing on the Fermi-level range near the CBM, which is relevant to the physics under investigation, we find that the electronic behavior of the complexes is determined predominantly by the non-Eu constituent. Specifically, (EuSr-DySr)+ is a defect complex consisting of Eu and Dy and (EuSr-DySr)0 is a complex of Eu and Dy; (EuSr-)0 is a complex of Eu and ; (EuSr-Oi)2- is a complex of Eu and O; (EuSr-)2- is a complex of Eu and ; (EuSr-Sri)2+ is a complex of Eu and Sr, (EuSr-Sri)+ is a complex of Eu and Sr, and (EuSr-Sri)0 is a complex of Eu and Sr. Note that we determine the charge state of a defect configuration by examining the calculated total and local magnetic moments, electron occupation, and local lattice environment. The level of EuSr-DySr is 6.11 eV above the VBM, almost the same as that of the isolated DySr; the and levels of EuSr-Sri are 6.04 eV and 6.21 eV above the VBM, almost the same as those of the isolated Sri.
Most notably, we find that the binding energy of the Eu-related complexes is very small or even negative, see Table 3, indicating that they are not stable under thermodynamic equilibrium, which is also consistent with the above analysis of the electronic behavior. In other words, EuSr is unlikely to stay close and form a defect complex with DySr or any of the dominant native defects in SrAl2O4, and even if it does, e.g., when the constituent defects get trapped next to each other, the electronic behavior of the complex in the relevant range of Fermi-level values is not that different from the isolated constituents. Our results for EuSr-DySr are thus consistent with experimental observations that, in (Eu2+,RE3+)-doped SrAl2O4, the RE3+ co-dopant only enhances the afterglow time and intensity and does not change the position or the shape of the emission band [5, 51].
III.4 Eu-related optical transitions
Let us now examine possible band–defect and interconfigurational – optical transitions involving the EuSr defect (The intraconfigurational Eu – optical transitions are not explicitly considered in this work).
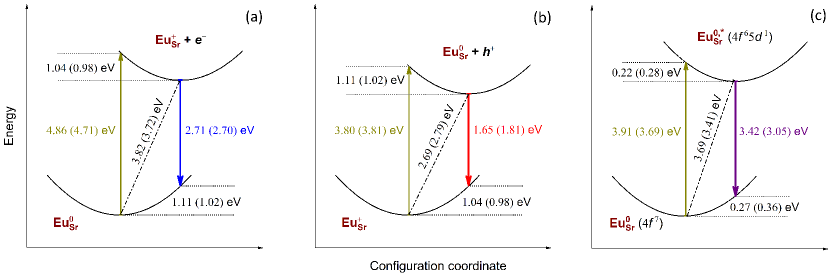
Figure 8(a) illustrates the optical absorption (defect-to-band) and emission (band-to-defect) processes involving the level of EuSr exchanging electrons with the CBM. Under illumination, for example, the Eu configuration (e.g., present in as-prepared Eu-doped SrAl2O4 samples) can absorb a photon and become ionized to Eu with the removed electron being excited into the conduction band. The peak absorption energy () related to the optical transition level (the formation energy difference between Eu and the Eu configuration in the lattice geometry of Eu) is 4.86 eV (4.71 eV), with a relaxation energy (i.e., the Franck-Condon shift, ) of 1.04 eV (0.98 eV), when Eu is incorporated at the Sr1 (Sr2) lattice site. With such a large relaxation energy, the emission is expected to be broad. In the reverse process, Eu can capture an electron from the CBM, e.g., previously excited from Eu (or from the valence band) to the conduction band. If the recombination is radiative, a photon will be emitted. The peak emission energy () related to the optical transition level (the formation energy difference between Eu and the Eu configuration in the lattice geometry of Eu) is 2.71 eV (2.70 eV), with a relaxation energy () of 1.11 eV (1.02 eV), at the Sr1 (Sr2) site. The thermal energy (; also referred to as the zero-phonon line or ZPL) associated with the Eu Eu + transitions is 3.38 eV (3.25 eV) at the Sr1 (Sr2) site, measured from the CBM. The ZPL marks the initial onset of the absorption band.
Note, however, that the band-to-defect emission process Eu + Eu may not occur at all due to another, competing process in which the recombination is nonradiatively: Eu + Eu, where Eu is Eu2+ in its excited state . In this case, Eu will relax to its ground state Eu and release a photon through the allowed – transition (discussed below).
In addition to exchanging electrons with the CBM, the level of EuSr can also exchange holes with the VBM. Figure 8(b) illustrates the absorption and emission Eu Eu + processes. In the literature, these processes are often regarded as involving an O2- to Eu3+ charge transfer (CT) and referred to as CT processes [19, 13]. The hole () state at the VBM consists primarily of the O states, as discussed earlier. Our calculations show a different set of the absorption, emission, relaxation, and thermal energies as indicated in Fig. 8(b). Similar to the earlier case, the band-to-defect emission Eu + Eu may not be observed. This is because the energy from the recombination of the electron localized at Eu and the free hole can quickly be absorbed into the -electron core of Eu3+ which then excites the ion and leads to intra- luminescence, as previously discussed in the case of RE-doped GaN [52].
Experimentally, Botterman et al. [15] reported a broad excitation band peaking at 276 nm (4.49 eV); Zollfrank et al. [13] and Bierwagen et al. [14] reported a similar value, at 250 nm (4.96 eV). This band has often been assigned to an O2- to Eu3+ charge transfer [13], which corresponds to the Eu Eu + process [ 3.80 or 3.81 eV; Fig. 8(b)] in our work. On the basis of our results, however, that excitation band should instead be assigned to the Eu Eu + process [ 4.86 or 4.71 eV; Fig. 8(a)]. Note that there have been no reports of broad CT emission bands; and only sharp – transitions are observed in the emission spectrum of Eu3+ in SrAl2O4 [15, 14]. This appears to be consistent with our discussion regarding alternative emission processes.
Figure 8(c) illustrates similar processes, but now involving the electric-dipole allowed – transitions in the neutral defect configuration Eu and with the energies obtained from constrained occupancy HSE calculations. In the absorption process, Eu () absorbs a photon and becomes Eu () with an electron being excited to a higher lying level which is the lowest Eu state (that is now pushed down from the conduction band due to the occupation of the excited electron). The peak absorption energy related to the , i.e., the total-energy difference between Eu () and the excited configuration Eu () in the lattice geometry of the former, is 3.91 eV (3.69 eV), with a relaxation energy = 0.22 eV (0.28 eV), when Eu is incorporated at the Sr1 (Sr2) site. The ZPL, 3.69 eV (3.41 eV) at the Sr1 (Sr2) site, is the total-energy difference between the ground state [Fig. 13(a)] and the excited state [Fig. 13(b)]. In the reverse process, the excited electron recombines radiatively with the hole that has been left behind and emits a photon. The peak emission energy related to the process, i.e., the total-energy difference between the excited Eu () and the ground state Eu () in the lattice geometry of the former, is 3.42 eV (3.05 eV), with a relaxation energy = 0.27 eV (0.36 eV), when Eu is at the Sr1 (Sr2) site. The Stokes shift, , is calculated to be 0.49 (0.64) eV at the Sr1 (Sr2) site.
Although there are differences between our calculated energies for the processes (summarized in Table 4) and those obtained in experiments, the emissions at the Sr1 and Sr2 lattice sites can be identified with the two broad emission bands peaking at 445 nm (2.79 eV, blue) and 520 nm (2.38 eV, green) and the Stokes shifts of roughly 3000 cm-1 (0.37 eV) and 4000 cm-1 (0.50 eV), respectively, observed in Eu2+-doped SrAl2O4 [12, 15, 53]. We find that the difference between the two emission energies is 0.37 eV, just like in experiments (which is larger than that for the band–defect optical transitions discussed earlier, thus indicating the – transitions are more sensitive to the local lattice environments). The calculated peak emission energy and Stokes shift are higher than the reported experimental values by 0.63 eV (0.67 eV) and 0.12 eV (0.14 eV) at the Sr1 (Sr2) site, respectively, which is an almost constant shift among the two lattice sites. The discrepancies with experiments may be ascribed to the electron–hole interaction that is not included in the constrained occupancy approach we employ to describe the excited state of Eu2+.
Note that, using constrained occupancy DFT calculations, Jia et al. [34] reported much lower values for the emission energies. For example, they obtained 2.316 (2.547) eV at the Sr1 (Sr2) site and assigned the experimentally observed green and blue luminescence bands to the Sr1 and Sr2 sites, respectively, which is different from our assignment and that of Ning et al .[54] based on multiconfigurational and constrained occupancy calculations. Our attempts to reproduce the results of Jia et al. [34] using a similar computational setup are not successful. Specifically, in our calculations based on DFT [55] with = 7.5 eV applied on the Eu states, a 112 (56-atom) supercell, and a 333 -point mesh, we find the emission energy is 3.52 (3.38) eV at the Sr1 (Sr2) site, which shows the same trend as in our HSE-based calculations discussed earlier; see also Table 4.
III.5 Carrier traps for persistent luminescence
Let us now identify charge carrier traps that can play a role in the persistent luminescence of Eu2+-doped SrAl2O4. Among the native point defects, we find that Sri can act as a trapping center for electrons. Being stable as Sr in as-prepared SrAl2O4, the defect can capture up to two electrons. The thermodynamic transition levels and of Sri, at 0.44 eV and 0.30 eV below the CBM, respectively, are sufficient close to the CBM, and the positively charged carrier-capturing configurations, i.e., Sr and Sr, are electrostatically attractive to electrons from the conduction band.
Note that, in general, the carrier capture cross section increases by orders of magnitude in going from Coulomb repulsive defect centers to neutral centers to attractive centers [56]. Also note that the error bar in our calculations of the transitions levels, and , is about 0.1 eV. A discrepancy of about 0.2 eV should be expected in a comparison between the calculated and the experimental values when the energy levels are measured from the CBM; here, the additional 0.1 eV is to take into account a possible difference between the calculated and the actual band gaps and/or measurement uncertainties.
The presence of the Sri-related trapping centers can explain why the emission observed in Eu2+-doped SrAl2O4 is persistent (albeit with a short afterglow time) even without Dy3+ co-doping [11, 5, 57, 58]. Notably, our results indicate that oxygen vacancies cannot act as efficient electron traps for room-temperature persistent luminescence (even when they occur with a high concentration, e.g., in samples prepared under reducing conditions) as their defect levels are too deep in the host band gap.
Finally, with the level located at 0.30 (0.38) eV below the CBM at the Sr1 (Sr2) site as reported earlier, DySr can be an efficient electron trap. The electron-capturing configuration, Dy, is positively charged. Note that, unlike Sri where the defect state associated with Sr and Sr (i.e., Sr after capturing one and two electrons, respectively) is derived largely from the host states at the CBM and delocalized over several lattice sites, that associated with Dy (i.e., Dy after capturing an electron) is highly localized Dy states. This indicates that the DySr-related traps are much more stable than the Sri-related ones, which is consistent with the fact that the performance of the afterglow in Eu2+-doped SrAl2O4 is significantly improved by Dy co-doping [51, 59, 58]. First-principles calculations of photoionization and carrier capture rates [60, 61] can provide a more quantitative understanding. Also note that the presence of the (Sri and DySr related) electron traps is consistent with the fact that the Eu2+ emission was observed to be quenched via the conduction band [62].
IV Conclusions
We have carried out a comprehensive study of native point defects and rare-earth (co)dopants in SrAl2O4. The major conclusions can be summarized as follows:
1. Eu is mixed valence of Eu2+ and Eu3+ and energetically most favorable at the Sr sites. The Eu2+/Eu3+ ratio can be tuned by tuning the synthesis conditions. Similarly, both Dy2+ and Dy3+ can be stabilized and are energetically most favorable at the Sr sites. Dy2+ is, however, always energetically much less favorable than Dy3+ and thus would not be realized in synthesis, although it can be photogenerated under irradiation.
2. Band–defect and interconfigurational – optical transitions involving the EuSr defect are investigated using first-principles defect calculations and a constrained occupancy approach, and alternative processes are discussed. On the basis of our results, we assign the broad blue (445 nm) and green (520 nm) emission bands observed in Eu2+-doped SrAl2O4 to the Eu2+ transition at the Sr1 and Sr2 sites, respectively.
3. Strontium interstitials are found to be efficient electron traps for room-temperature persistent luminescence. When the material is co-doped with Dy, the co-dopant provides an even more stable electron trapping center due to the stabilization of Dy2+ which can explain the significantly improved performance of the afterglow in (Eu,Dy)-doped samples. Oxygen vacancies cannot be efficient electron traps, in contrast to what is commonly believed, due to their very deep defect levels.
Our work thus calls for a re-assessment of certain assumptions regarding specific defects previously made in all the mechanisms proposed for the persistent luminescence observed in Eu- and (Eu,Dy)-doped SrAl2O4. It also shows a need to go beyond a constrained occupancy approach in order to obtain more quantitative results for the interconfigurational – optical transitions.
Acknowledgements.
The author gratefully acknowledges Stéphane Jobic (Nantes Université, CNRS) for helpful discussion. This work used resources of the Center for Computationally Assisted Science and Technology (CCAST) at North Dakota State University, which were made possible in part by NSF MRI Award No. 2019077.Appendix A Supporting figures and tables
| SrAl2O4 | Sr3Al2O6 | Sr4Al14O25 | SrO2 | SrAl2 | SrAl4 | Eu2O3 | EuO | Dy2O3 |
|---|---|---|---|---|---|---|---|---|
| Defect | Lattice site | Stable RE ions | Defect energy levels |
|---|---|---|---|
| O8 site | |||
| Oi | , a | ||
| Sr1 site | , , | ||
| Sr2 site | , , | ||
| Sri | Sr1 channel | , , | |
| Sr2 channel | , , | ||
| AlSr | Sr2 site | , b | |
| SrAl | Al2 site | , | |
| EuSr | Sr1 site | Eu3+, Eu2+ | |
| Sr2 site | Eu3+, Eu2+ | ||
| EuAl | Al2 site | Eu3+, Eu2+ | , , |
| DySr | Sr1 site | Dy3+, Dy2+ | |
| Sr2 site | Dy3+, Dy2+ | ||
| DyAl | Al2 site | Dy4+, Dy3+ | , |
aThe and levels are very close to the level, at 3.28 and 3.30 eV, respectively.
bThe and levels are very close to the level, at 5.10 and 5.09 eV, respectively.
| Complex | Constituents | (eV) | Complex | Constituents | (eV) |
|---|---|---|---|---|---|
| (EuSr-DySr)2+ | Eu + Dy | 0.41 | (EuSr-Sri)3+ | Eu + Sr | 0.69 |
| (EuSr-DySr)+ | Eu + Dy | 0.02 | (EuSr-Sri)2+ | Eu + Sr | 0.01 |
| (EuSr-DySr)0 | Eu + Dy | 0.01 | (EuSr-Sri)+ | Eu + Sr | 0.05 |
| (EuSr-)3+ | Eu + | 0.73 | (EuSr-Sri)0 | Eu + Sr | 0.05 |
| (EuSr-)2+ | Eu + | 0.07 | (EuSr-)+ | Eu + | 0.31 |
| (EuSr-)0 | Eu + | 0.01 | (EuSr-)0 | Eu + | 0.61 |
| (EuSr-Oi)+ | Eu + O | 0.06 | (EuSr-)- | Eu + | 1.15 |
| (EuSr-Oi)- | Eu + O | 1.09 | (EuSr-)2- | Eu + | 0.07 |
| (EuSr-Oi)2- | Eu + O | 0.00 |
| Lattice site | ||||||||||||
| HSE: Eu Eu | HSE: Eu () Eu () | |||||||||||
| Sr1 | 4.86 | 1.04 | 2.71 | 1.11 | 2.15 | 3.82 | 3.91 | 0.22 | 3.42 | 0.27 | 0.49 | 3.69 |
| Sr2 | 4.71 | 0.98 | 2.70 | 1.02 | 2.00 | 3.72 | 3.69 | 0.28 | 3.05 | 0.36 | 0.64 | 3.41 |
| HSE: Eu Eu | DFT:a Eu () Eu () | |||||||||||
| Sr1 | 3.80 | 1.11 | 1.65 | 1.04 | 2.15 | 2.69 | 4.23 | 0.32 | 3.52 | 0.39 | 0.61 | 3.91 |
| Sr2 | 3.81 | 1.02 | 1.81 | 0.98 | 2.00 | 2.79 | 4.00 | 0.29 | 3.38 | 0.33 | 0.72 | 3.71 |
aDFT+ calculations with a computational setup similar to that in Jia et al., Phys. Rev. B 96, 125132 (2017); see text.
References
- Smet et al. [2015] P. F. Smet, K. Van den Eeckhout, O. Q. De Clercq, and D. Poelman, Persistent phosphors, in Handbook on the Physics and Chemistry of Rare Earths, Handbook on the Physics and Chemistry of Rare Earths, Vol. 48, edited by J.-C. Bünzli and V. K. Pecharsky (Elsevier, 2015) pp. 1–108.
- Xu and Tanabe [2019] J. Xu and S. Tanabe, Persistent luminescence instead of phosphorescence: History, mechanism, and perspective, J. Lumin. 205, 581 (2019).
- Poelman et al. [2020] D. Poelman, D. Van der Heggen, J. Du, E. Cosaert, and P. F. Smet, Persistent phosphors for the future: Fit for the right application, J. Appl. Phys. 128, 240903 (2020).
- Murayam et al. [1994] Y. Murayam, N. Takeuchi, Y. Aoki, and T. Matsuzawa, Phosphorescent phosphor (1994), EP0622440.
- Matsuzawa et al. [1996] T. Matsuzawa, Y. Aoki, N. Takeuchi, and Y. Murayama, A New Long Phosphorescent Phosphor with High Brightness, SrAl2O4:Eu2+,Dy3+, J. Electrochem. Soc. 143, 2670 (1996).
- Rojas-Hernandez et al. [2018] R. E. Rojas-Hernandez, F. Rubio-Marcos, M. Ángel Rodriguez, and J. F. Fernandez, Long lasting phosphors: SrAl2O4:Eu,Dy as the most studied material, Renew. Sustain. Energy Rev. 81, 2759 (2018).
- Vitola et al. [2019] V. Vitola, D. Millers, I. Bite, K. Smits, and A. Spustaka, Recent progress in understanding the persistent luminescence in SrAl2O4:Eu,Dy, Mater. Sci. Tech. 35, 1661 (2019).
- Hagemann and Afshani [2021] H. H.-R. Hagemann and J. Afshani, Synthesis, luminescence and persistent luminescence of europium-doped strontium aluminates, in Handbook on the Physics and Chemistry of Rare Earths, Handbook on the Physics and Chemistry of Rare Earths, Vol. 60, edited by J.-C. G. Bünzli and V. K. Pecharsky (Elsevier, 2021) pp. 163–225.
- Palilla et al. [1968] F. C. Palilla, A. K. Levine, and M. R. Tomkus, Fluorescent Properties of Alkaline Earth Aluminates of the Type Al2O4 Activated by Divalent Europium, J. Electrochem. Soc. 115, 642 (1968).
- Blasse and Bril [1968] G. Blasse and A. Bril, Flourescence of Eu2+-activated alkaline-earth aluminates, Philips Res. Rep. 23, 201 (1968).
- Abbruscato [1971] V. Abbruscato, Optical and Eelectrical Properties of SrAl2O4:Eu2+, J. Electrochem. Soc. 118, 930 (1971).
- Poort et al. [1995] S. H. M. Poort, W. P. Blokpoel, and G. Blasse, Luminescence of Eu2+ in barium and strontium aluminate and gallate, Chem. Mater. 7, 1547 (1995).
- Zollfrank et al. [2013] C. Zollfrank, S. Gruber, M. Batentschuk, A. Osvet, F. Goetz-Neunhoeffer, S. Dittrich, J. Grabow, H.-D. Kurland, and F. Müller, Synthesis of Eu-doped SrAl2O4 nanophosphors by CO2 laser vaporization, Acta Mater. 61, 7133 (2013).
- Bierwagen et al. [2021] J. Bierwagen, T. Delgado, J. Afshani, S. Yoon, N. Gartmann, B. Walfort, and H. Hagemann, Observation of multiple sites for trivalent europium ions in SrAl2O4, J. Lumin. 239, 118348 (2021).
- Botterman et al. [2014] J. Botterman, J. J. Joos, and P. F. Smet, Trapping and detrapping in SrAl2O4:Eu,Dy persistent phosphors: Influence of excitation wavelength and temperature, Phys. Rev. B 90, 085147 (2014).
- Beauger [1999] C. Beauger, Élaboration, caractérisation et modélisation des phénomènes de luminescence du monoaluminate de strontium dopé à l’europium et au dysprosium SrAl2O4: Eu, Dy, Ph.D. thesis, Ecole Nationale Supérieure des Mines de Saint-Etienne (1999).
- Aitasalo et al. [2003] T. Aitasalo, P. Dereń, J. Hölsä, H. Jungner, J.-C. Krupa, M. Lastusaari, J. Legendziewicz, J. Niittykoski, and W. Strȩk, Persistent luminescence phenomena in materials doped with rare earth ions, J. Solid State Chem. 171, 114 (2003).
- Aitasalo et al. [2004] T. Aitasalo, J. Hölsä, H. Jungner, J.-C. Krupa, M. Lastusaari, J. Legendziewicz, and J. Niittykoski, Effect of temperature on the luminescence processes of SrAl2O4:Eu2+, Radiat. Meas. 38, 727 (2004).
- Clabau et al. [2005] F. Clabau, X. Rocquefelte, S. Jobic, P. Deniard, M.-H. Whangbo, A. Garcia, and T. Le Mercier, Mechanism of Phosphorescence Appropriate for the Long-Lasting Phosphors Eu2+-Doped SrAl2O4 with Codopants Dy3+ and B3+, Chem. Mater. 17, 3904 (2005).
- Dorenbos [2005] P. Dorenbos, Mechanism of Persistent Luminescence in Eu2+ and Dy3+ Codoped Aluminate and Silicate Compounds, J. Electrochem. Soc. 152, H107 (2005).
- Liepina et al. [2017] V. Liepina, D. Millers, and K. Smits, Tunneling luminescence in long lasting afterglow of SrAl2O4:Eu,Dy, J. Lumin. 185, 151 (2017).
- Zeng et al. [2018] P. Zeng, X. Wei, M. Yin, and Y. Chen, Investigation of the long afterglow mechanism in SrAl2O4:Eu2+/Dy3+ by optically stimulated luminescence and thermoluminescence, J. Lumin. 199, 400 (2018).
- Gnidakouong and Yun [2019] J. R. N. Gnidakouong and G. J. Yun, Dislocation density level induced divergence between stress-free afterglow and mechanoluminescence in SrAl2O4: Eu2+, Dy3+, Ceram. Int. 45, 1794 (2019).
- Heyd et al. [2003] J. Heyd, G. E. Scuseria, and M. Ernzerhof, Hybrid functionals based on a screened Coulomb potential, J. Chem. Phys. 118, 8207 (2003).
- Freysoldt et al. [2014] C. Freysoldt, B. Grabowski, T. Hickel, J. Neugebauer, G. Kresse, A. Janotti, and C. G. Van de Walle, First-principles calculations for point defects in solids, Rev. Mod. Phys. 86, 253 (2014).
- Hoang [2015] K. Hoang, Hybrid density functional study of optically active Er3+ centers in GaN, Phys. Status Solidi RRL 9, 722 (2015).
- Hoang [2016] K. Hoang, First-principles identification of defect levels in Er-doped GaN, Phys. Status Solidi RRL 10, 915 (2016).
- Hoang [2021] K. Hoang, Tuning the valence and concentration of europium and luminescence centers in GaN through co-doping and defect association, Phys. Rev. Materials 5, 034601 (2021).
- Van de Walle and Neugebauer [2004] C. G. Van de Walle and J. Neugebauer, First-principles calculations for defects and impurities: Applications to III-nitrides, J. Appl. Phys. 95, 3851 (2004).
- Freysoldt et al. [2009] C. Freysoldt, J. Neugebauer, and C. G. Van de Walle, Fully Ab Initio Finite-Size Corrections for Charged-Defect Supercell Calculations, Phys. Rev. Lett. 102, 016402 (2009).
- Freysoldt et al. [2011] C. Freysoldt, J. Neugebauer, and C. G. Van de Walle, Electrostatic interactions between charged defects in supercells, phys. status solidi (b) 248, 1067 (2011).
- Blasse and Grabmaier [1994] G. Blasse and B. C. Grabmaier, Luminescent Materials (Springer-Verlag, Berlin, 1994).
- Canning et al. [2011] A. Canning, A. Chaudhry, R. Boutchko, and N. Grønbech-Jensen, First-principles study of luminescence in Ce-doped inorganic scintillators, Phys. Rev. B 83, 125115 (2011).
- Jia et al. [2017] Y. Jia, A. Miglio, S. Poncé, M. Mikami, and X. Gonze, First-principles study of the luminescence of Eu2+-doped phosphors, Phys. Rev. B 96, 125132 (2017).
- Blöchl [1994] P. E. Blöchl, Projector augmented-wave method, Phys. Rev. B 50, 17953 (1994).
- Kresse and Furthmüller [1996] G. Kresse and J. Furthmüller, Efficient iterative schemes for ab initio total-energy calculations using a plane-wave basis set, Phys. Rev. B 54, 11169 (1996).
- Schulze and Buschbaum [1981] A. R. Schulze and M. Buschbaum, Zur Verbindungsbildung von eO:O3. IV. Zur Struktur von monoklinem SrAl2O4, Z. Anorg. Allg. Chem. 475, 205 (1981).
- Holsa et al. [2009] J. Holsa, T. Laamanen, M. Lastusaari, J. Niittykoski, and P. Novak, Electronic structure of the SrAl2O4:Eu2+ persistent luminescence material, J. Rare Earths 27, 550 (2009).
- Dutczak et al. [2015] D. Dutczak, T. Jüstel, C. Ronda, and A. Meijerink, Eu2+ luminescence in strontium aluminates, Phys. Chem. Chem. Phys. 17, 15236 (2015).
- Gajdoš et al. [2006] M. Gajdoš, K. Hummer, G. Kresse, J. Furthmüller, and F. Bechstedt, Linear optical properties in the projector-augmented wave methodology, Phys. Rev. B 73, 045112 (2006).
- Perdew et al. [1996] J. P. Perdew, K. Burke, and M. Ernzerhof, Generalized gradient approximation made simple, Phys. Rev. Lett. 77, 3865 (1996).
- Jain et al. [2013] A. Jain, S. P. Ong, G. Hautier, W. Chen, W. D. Richards, S. Dacek, S. Cholia, D. Gunter, D. Skinner, G. Ceder, and K. A. Persson, Commentary: The materials project: A materials genome approach to accelerating materials innovation, APL Materials 1, 011002 (2013).
- Massazza [1959] F. Massazza, The system SrO–Al2O3, Chim. Ind. (Milan) 41, 108 (1959).
- Capron and Douy [2002] M. Capron and A. Douy, Strontium Dialuminate SrAl4O7: Synthesis and Stability, J. Am. Ceram. Soc. 85, 3036 (2002).
- Stull and Prophet [1971] D. R. Stull and H. Prophet, JANAF Thermochemical Tables, 2nd ed. (U.S. National Bureau of Standards, Washington, D.C., 1971).
- Momma and Izumi [2011] K. Momma and F. Izumi, VESTA 3 for three-dimensional visualization of crystal, volumetric and morphology data, J. Appl. Cryst. 44, 1272 (2011).
- Finley et al. [2018] E. Finley, A. Mansouri Tehrani, and J. Brgoch, Intrinsic Defects Drive Persistent Luminescence in Monoclinic SrAl2O4:Eu2+, J. Phys. Chem. C 122, 16309 (2018).
- Kaur Behrh et al. [2015] G. Kaur Behrh, H. Serier-Brault, S. Jobic, and R. Gautier, A Chemical Route Towards Single-Phase Materials with Controllable Photoluminescence, Angew. Chem. Intl. Ed. 54, 11501 (2015).
- Wang et al. [2002] D. Wang, Q. Yin, Y. Li, and M. Wang, Concentration quenching of Eu2+ in SrOAl2O3:Eu2+ phosphor, J. Lumin. 97, 1 (2002).
- Joos et al. [2020] J. J. Joos, K. Korthout, L. Amidani, P. Glatzel, D. Poelman, and P. F. Smet, Identification of Dy3+/Dy2+ as Electron Trap in Persistent Phosphors, Phys. Rev. Lett. 125, 033001 (2020).
- Katsumata et al. [2006] T. Katsumata, S. Toyomane, R. Sakai, S. Komuro, and T. Morikawa, Trap Levels in Eu-Doped SrAl2O4 Phosphor Crystals Co-Doped with Rare-Earth Elements, J. Am. Ceram. Soc. 89, 932 (2006).
- Hoang [2022] K. Hoang, Rare-earth defects in GaN: A systematic investigation of the lanthanide series, Phys. Rev. Materials 6, 044601 (2022).
- Bierwagen et al. [2016] J. Bierwagen, S. Yoon, N. Gartmann, B. Walfort, and H. Hagemann, Thermal and concentration dependent energy transfer of Eu2+ in SrAl2O4, Opt. Mater. Express 6, 793 (2016).
- Ning et al. [2018] L. Ning, X. Huang, Y. Huang, and P. A. Tanner, Origin of the green persistent luminescence of Eu-doped SrAl2O4 from a multiconfigurational ab initio study of transitions, J. Mater. Chem. C 6, 6637 (2018).
- Anisimov et al. [1991] V. I. Anisimov, J. Zaanen, and O. K. Andersen, Hubbard-corrected density-functional theory, Phys. Rev. B 44, 943 (1991).
- Mayer and Lau [1990] J. W. Mayer and S. S. Lau, Electronic Materials Science: For Integrated Circuits in Si and GaAs (MacMillan Publishing, New York, 1990) p. 161.
- Lu et al. [2007] X. Lu, W. Shu, Q. Yu, Q. Fang, and X. Xiong, Roles of doping ions in persistent luminescence of SrAl2O4: Eu2+,RE3+ phosphors, Glass Phys. Chem. 33, 62 (2007).
- Bierwagen et al. [2020] J. Bierwagen, T. Delgado, G. Jiranek, S. Yoon, N. Gartmann, B. Walfort, M. Pollnau, and H. Hagemann, Probing traps in the persistent phosphor SrAl2O4:Eu2+,Dy3+,B3+ - A wavelength, temperature and sample dependent thermoluminescence investigation, J. Lumin. 222, 117113 (2020).
- Nakazawa et al. [2006] E. Nakazawa, Y. Murazaki, and S. Saito, Mechanism of the persistent phosphorescence in Sr4Al14O25:Eu and SrAl2O4:Eu codoped with rare earth ions, J. Appl. Phys. 100, 113113 (2006).
- Razinkovas et al. [2021] L. Razinkovas, M. Maciaszek, F. Reinhard, M. W. Doherty, and A. Alkauskas, Photoionization of negatively charged NV centers in diamond: Theory and ab initio calculations, Phys. Rev. B 104, 235301 (2021).
- Dreyer et al. [2020] C. E. Dreyer, A. Alkauskas, J. L. Lyons, and C. G. Van de Walle, Radiative capture rates at deep defects from electronic structure calculations, Phys. Rev. B 102, 085305 (2020).
- Ueda et al. [2012] J. Ueda, T. Nakanishi, Y. Katayama, and S. Tanabe, Optical and optoelectronic analysis of persistent luminescence in Eu2+-Dy3+ codoped SrAl2O4 ceramic phosphor, phys. stat. solidi c 9, 2322 (2012).