Molecular simulation of bulk and confined (1,1,1,3,3-pentafluorobutane)
Abstract
Here we present a computational study of the thermodynamic and structural properties of bulk and confined (1,1,1,3,3-pentafuorobutane) with different lengths of the carbon backbone. The DREIDING force field model has been used in the method of molecular dynamics. In order to study the effect of confinement we have placed (1,1,1,3,3-pentauorobutane) molecules between two graphene walls. In order to study the influence of pore loading on system behavior we have simulated systems of the same size, but with a different number of (1,1,1,3,3-pentauorobutane) molecules, from 200 to 2000. The equations of state at K in a wide range of densities for all considered systems had a single peculiarity that is attributed to gas-liquid transition. From the two-dimensional radial distribution functions, density profile and angular distribution we have observed the systems split into layers with amorphization rather than crystallization in them.
pacs:
61.20.Gy, 61.20.Ne, 64.60.KwI Introduction
Liquids are involved in numerous natural and technological processes. It makes the understanding of their behavior of great interest. At the same time, many technologically important liquids have a rather complex molecular structure. Moreover, they can form homologous series, where the -th term is made by adding of a monomer to the -th one. The most obvious example is the set of hydrocarbons: , , , etc. It is well known that the properties of hydrocarbons are strongly dependent on the chain length.
Hydrocarbons are the simplest organic compounds, which are used as a fuel and raw materials for the chemical industry. It makes them the most studied homologous seria. The properties of hydrocarbons are well documented in numerous handbooks and databases (see, for instance, hydrocarb ).
A more complex case is related to investigation of confined, rather than bulk liquids rice . In this case the properties of the system are determined not only by the liquid itself, but also by the shape of the confined media and interaction between the liquid and confining walls. However, there are some effects which are common for any kind of confinement. In particular, confinement leads to modulation of the average density of the system, i.e. while the local density of a bulk liquid is uniform, in the case of confinement the interplay of dense and dilute regions appears inside the pore rice . Confinement also changes the melting point of a substance. The melting temperature of confined liquid can be either above, or below that of bulk liquid. Moreover, the melting temperature depends on the width of the pore and it can demonstrate non-monotonous behavior depending on the size of the pore vish . Confinement may also induce formation of crystalline structures which are not possible in a bulk state, as it was shown in molecular simulation of water in nanotubes and silicon in a slit pore w-nano ; rinp . One can conclude that the behavior of confined liquids involves numerous different phenomena, which make it an endless topic of research. However, even in the case of hydrocarbons in confined space there is still lack of data. Moreover, most data are obtained for small hydrocarbons, like methane ch4 , butane to octane butane , pentane pisarev , etc.
Another class of molecules which can form chains of different length is fluorocarbons of the type . The simplest molecule of this type is (1,1,1,3,3-pentafluorobutane) (PFB) . PFB is used as a refrigerant liquid and as a foaming liquid. However, the polymer of the composition (PVDF) is a widely used fluoropolymer. Although there are plenty of works on fluoropolymers handbook , there are still a lot of open questions. Moreover, introduction of fluorine makes the set of homologous substances of fluoro-hydrocarbons richer than that of hydrocarbons.
In Ref. pfb-4 the density of saturated vapor and liquid of PFB and its thermal conductivity are measured in the temperature interval from to K. The critical point is estimated from the obtained data. The boiling curve of PFB in a wider range of temperatures is reported in Ref. pfb-2 , while in Ref. pfb-1 the thermophysical properties of a mixture of PFB with Perfluoropolyether were studied. However, there is still lack of experimental data on PFB, which is to a certain degree compensated by computational works.
In Ref. pvdf-ff-0 a force field (FF) for PVDF was constructed. The authors used quantum chemical calculations of small molecules like PFB in order to fit the force field. The obtained parameters were used for molecular dynamics calculations of thermodynamic properties of small oligomers of PVDF.
In Ref. pvdf-ff the FF for PVDF was improved. The authors managed to accurately reproduce the equation of state and the boiling curve of PFB in good agreement with experimental data.
There are also a lot of computational works on the properties of PVDF with different FFs for the case of long molecules (to name a few, see ). However, one can see that all works deal either with small molecules like PFB (see Ref. pvdf-ff-0 for other small molecules), or very long molecules (for instance, 100 monomers of ). To the best of our knowledge there are no works which discuss changes of the properties of systems with the composition in connection with the length of the carbon backbone.
The goal of the present work is to perform a computational study of bulk and confined PFB within the framework of a computationally cheap FF. We consider this work as the first step in a sequence of works on investigation of the properties of systems of the composition with different lengths of the carbon backbone.
II System and Methods
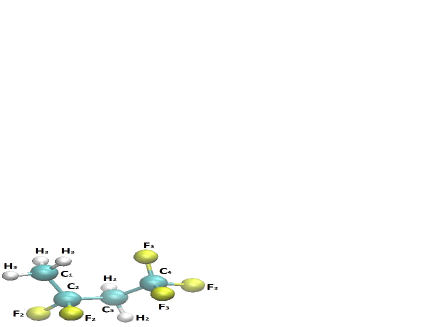
In the present paper we investigate the properties of bulk and confined PFB by means of molecular dynamics simulation. The DREIDING force field dreiding is used as an interaction model. The details of the interaction are given in the Supplementary Materials. Figure 1 shows a molecule of PFB. Each carbon atom in the molecule is treated as a separate type ( to ). Fluorines (hydrogen) atoms in the () and () groups have different charges. As a result, 8 atom types are used to describe the interaction.
In the case of simulation of bulk PFB a system of 1000 molecules in a cubic box with periodic boundary conditions is used. The system is simulated for steps with a time step of fs for equilibration and more steps for calculation of the properties of the system. The bonds involving hydrogen atoms are constrained by the SHAKE algorithm shake .
In order to characterize the thermodynamic properties of the system we calculate the equation of state and compare it with literature data. The structure of the system is monitored via partial radial distribution functions.
To study the effect of confinement we place PFB molecules between two graphene walls (the distance between the walls is ). Each wall consists of carbon atoms and has the sizes and . The box was periodic in the x and y directions, but not z. The interaction parameters between the PFB molecules and the walls are given in the Supplementary materials.
For to see the influence of pore loading on the behavior of the system we simulated systems of the same size, but with a different number of PFB molecules. The smallest system consisted of 200 PFB molecules, while the largest one consisted of 2000 molecules. Following Ref. pisarev we performed the Voronoi construction for the particles of PFB and used the sum of the volumes of each particle to calculate the density of the liquid.
In an effort to evaluate the influence of the walls on the structure of the system we calculated the density profile of all species. A density profile is defined as a number of particles of a particular type inside the slab between and . We also studied the angular distribution of the molecules within these slabs. We define angle as the angle between the vector connecting the and atoms and the z axis.
We observe that the system splits into layers. In order to characterize these layers, we calculate the two-dimensional radial distribution functions (2d rdf, ) for the centers of mass of the molecules within the layers.
All simulations are performed at K.
All simulations were performed using the LAMMPS simulation package lammps .
III Results and Discussion
III.1 Bulk PFB
We start the discussion from the behavior of bulk PFB in a wide range of pressures. Figure 2 shows a comparison of our data with the experimental results and the results from simulations of other authors. One can see that compared with the experimental data our results underestimate the density of PFB at given pressure. Moreover, only the model of Ref. pvdf-ff gives the equation of state in reasonable agreement with experiment, all other computational models either underestimate, or overestimate the density at fixed pressure. Although our results are not in very good agreement with the experimental results, we believe that our simulations give reasonable qualitative results. Moreover, this model is computationally cheap and allows rapid calculations which is important for calculations of systems of longer fluorocarbons. Based on this we believe that our model can serve as an opening gambit for simulation of fluorocarbons of different chain lengths in bulk and confinement.
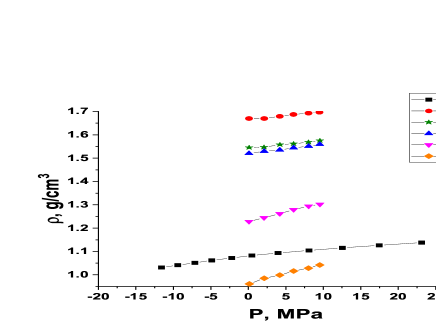
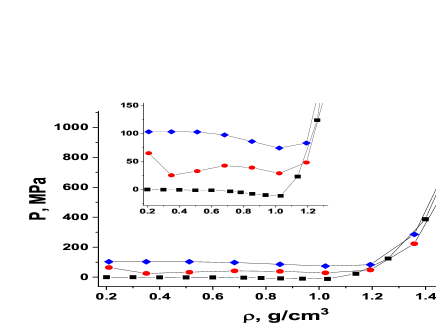
Figure 3 shows the isotherm of PFB at K in a wide range of densities. One can see that at the density below the pressure is negative which corresponds to the appearance of gas - liquid transition in the molecular simulation. The calculation of the boiling curve of PFB is beyond the scope of the present paper. We just note that the density of liquid at coexistence with gas is between the and .

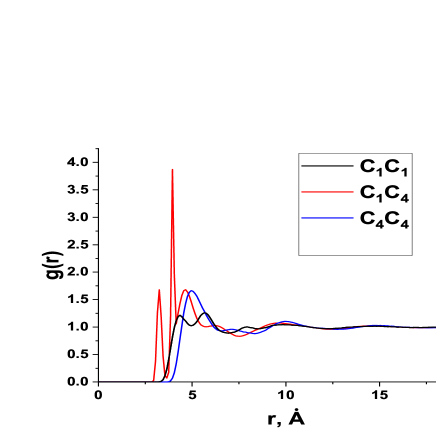
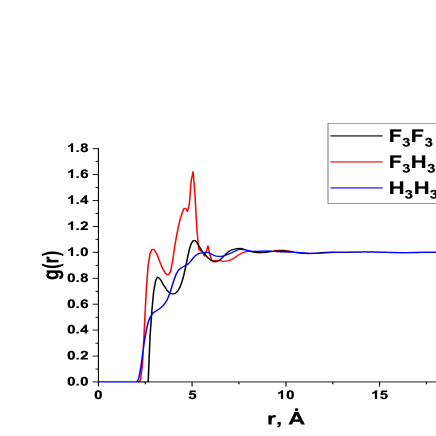
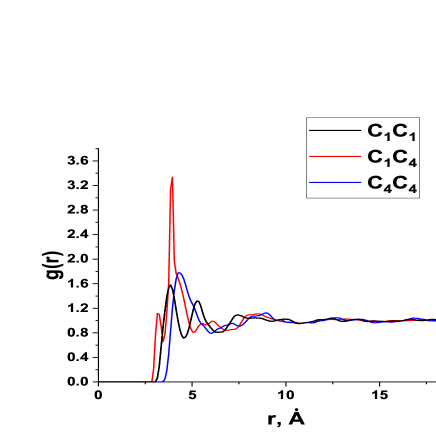
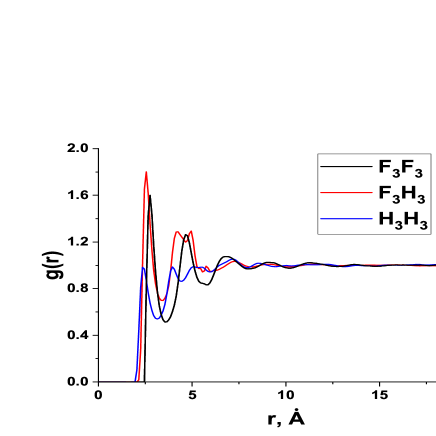
We discuss the structure of the liquid at two densities: and . The structure is characterized by several partial RDFs: , , , which belong to the carbon chain of the molecules and , , which show the distribution of terminal fluorides and hydrogen atoms in the and groups.
Figure 4 shows the RDFs for density . One can see that the correlation between and of different molecules is rather weak. However, the correlation between and is much stronger, which means that the molecules tend to orient by the groups to the ones (Fig. 4 (a)). The same conclusion can be made from the correlations between the fluorine and hydrogen atoms (Fig. 4 (b)).
The density dependence on pressure starts to rapidly increase after density . This might signal that the liquid is close to the freezing line. However, even at density we do not observe any signatures of crystallinity which can be seen from the partial RDFs given in Fig. 5 (a) and (b).
III.2 Confined PFB
In this section we discuss the influence of confinement on the thermodynamic and structural properties of PFB. Figure 6 shows a comparison of the equation of state of bulk and confined PFB. As usual, two components of the stress tensor are considered in a slit pore: which is parallel to the walls of the pore and which is perpendicular to the walls. One can see that both and demonstrate a van der Waals loop which means the presence of gas-liquid transition in the confined fluid. At the same time, this transition looks more smeared in comparison with the bulk case. Apparently, the presence of phase transition principally changes the structure of the system, which we are going to study at the moment.
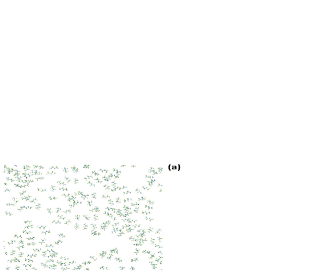
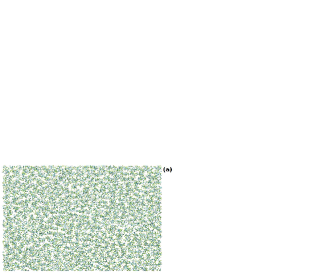
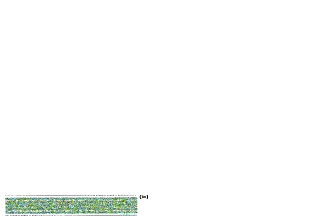
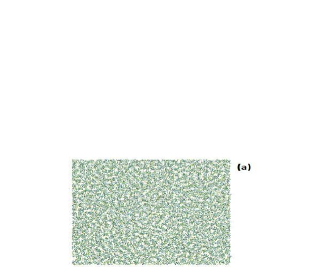
Figures 7 (a) and (b) show a top and a side view of the system of 200 PFB molecules in the graphene pore. From the top view we see that the molecules are not condensed: we observe some cavities in the system, which is characteristic of a gas-liquid two phase region. The side view shows that the molecules strongly stick to two walls. No exchange of molecules from the top wall to the bottom one or vice versa is observed.
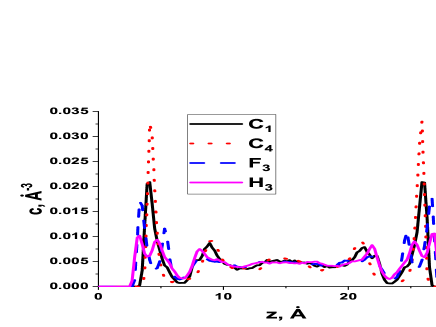
Figure 7 (c) shows the number density (concentration) distribution along the z-axis for several types of atoms: (the carbon atom in the group), (the carbon atom in the group), (the fluorine atom in the group) and (the hydrogen atom in the group). The atoms approach a bit closer to the walls than the ones.

In order to evaluate the orientation of the molecules next to the graphene walls in more detail we calculate the distribution of angle introduced in the ”System and Methods” section. The results are shown in Fig. 7 (d). One can see that next to the walls is close to 90 degrees, which means that the molecules lie almost parallel to the walls. This result is consistent with the fact that the location of the main peak of and coincide. At the same time, as the molecules deviate from the wall the angle deviates from a right angle in such a way that the group appears to be further from the wall than the one. This corresponds to an obtuse angle for the upper wall and to an acute angle for the lower one. For the reasons of symmetry, the curves for the upper and lower walls are symmetric with respect to the line of 90 degrees.
When the number of molecules is increased, they adsorb on the walls up to the moment when all available space on the walls is occupied (see Fig. 1 in the Supplementary materials for the system of 400 PFB molecules in the pore). After that the molecules go into the free space between the walls. Figure 8 (a) shows a top view of the system of 600 molecules of PFB in the pore. One can see that no free space on the walls is available to be occupied by the molecules. From Fig. 8 (b) one can see that only a few molecules are pushed into the middle of the pore. This is confirmed by the local density distribution of the species shown in Fig. 8 (c).
Figure 8 (d) shows the angle distribution of the system of 600 molecules of PFB in the pore. One can see that next to the wall the distribution behaves as in the case of 200 molecules: they lie flat on the walls. As the molecules go further from the walls they pass a maximum (minimum) at 160 (20) degrees and starting from the distance of 10 from the walls the orientation fluctuates around a right angle.
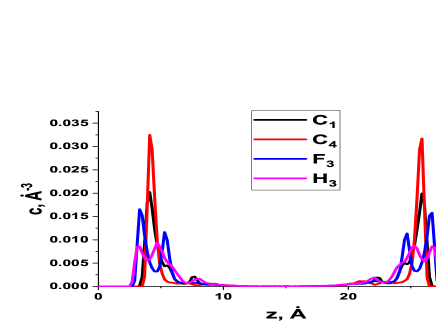

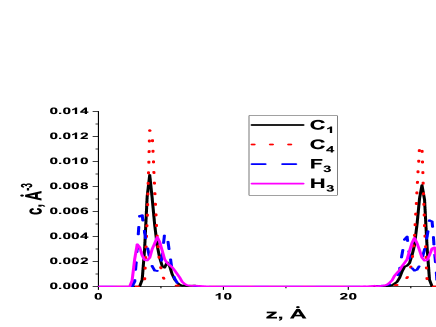
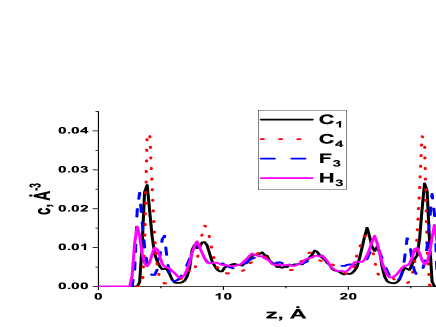
We proceed with investigation of the system with density (). Figures 9 (a) and (b) show the top and side views of this system, respectively. From these pictures one can see that some parts of the system are condensed, while some others are dilute. This corresponds to the gas - liquid two-phase region, which has been previously shown on the EoS of the system (see Fig. 6). Note that the bulk system is also in the two-phase region at this density. Figure 9 (c) demonstrates the density distribution along the z axis. Comparing with the previous densities we observe that the density distribution of and demonstrates two peaks (at 4.1 and 9.1 ) from each wall and three peaks (at 4.1, 7.7 and 9.1 ) from each wall, respectively, which means that the system becomes more ordered.
The distribution of angle demonstrates a modulated structure in the whole volume of the pore. The orientation of the molecules within the layers next to the walls does not change compared with the cases of smaller densities. The molecules of the second layer demonstrate an orientation of 110 (the upper wall) or 70 (the lower wall) degrees to the walls.
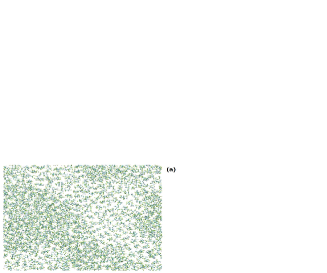
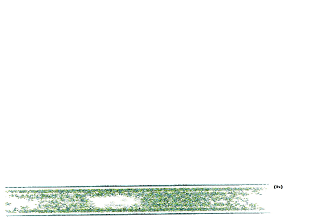
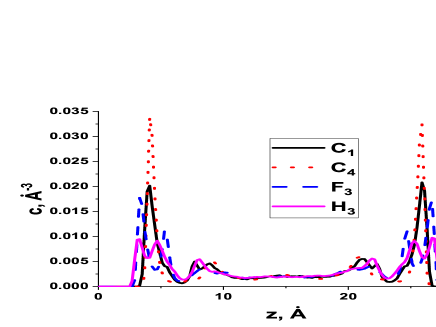

Figure 10 shows the same data for the system with density (). As compared with the previous case the first minimum of the density of the and species falls almost to a zero value (see Fig. 10 (c)), i.e. the first layer appears to be almost isolated from the other ones, which can be seen in the snapshots of the system (Fig. 10 (a) and (b)). The distribution of angle becomes even more modulated (Fig. 10 (d)).

Finally, we show the results for density (). The results are shown in Fig. 11 (a) - (d). The most interesting result is that the density profile of the and species is modulated in the whole volume of the pore, i.e. there is not any ”bulk” region of the system which is not affected by the walls. Therefore, one can claim that this region corresponds to strong confinement. Strong modulation is also observed in the angle distribution (panel (d)).

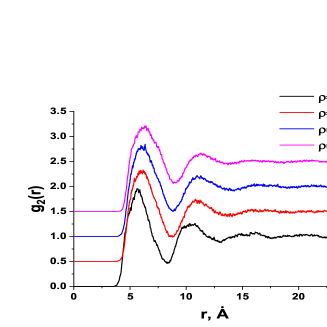
Although the density of the system increases and the system exhibits strongly modulated density profiles, we do not observe formation of a crystal in the system. Even in the layers next to the walls there is no crystalline order. In order to prove it we consider the 2d RDFs of the centers of mass of the molecules in the layers next to the walls. The results are shown in Fig. 12. One can see that the first peak is almost independent of the density. At the same time the second peak of the RDF becomes slightly higher and wider with density and the third peak appears at .
The most well studied confined liquid is definitely water rice ; phob1 ; phob2 . It was shown that in the case of hydrophobic confinement water crystallized, while in the case of hydrophilic one it experienced glass transition phil1 ; phil2 ; phil3 . In the present case of PFB in a graphene pore the walls appear to be philic to the liquid. As a result, we also observe amorphization of the system rather than crystallization.
The work was carried out using the computing resources of the federal collective usage center ”Complex for simulation and data processing for mega-science facilities” at NRC ”Kurchatov Institute”, http://ckp.nrcki.ru, and supercomputers at the Joint Supercomputer Center of the Russian Academy of Sciences (JSCC RAS). The article was supported by the Ministry of Science and Higher Education of the Russian Federation (agreement no. 075-02-2022-872).
References
- (1) J. G. Speight, Handbook of Industrial Hydrocarbon Processes, Gulf Professional Publishing, Oxford, UK
- (2) G. Ali Mansoori, S. A. Rice, Confined fluids: Structure, Properties and Phase Behavior, Advances in Chemical Physics, 156, 197-294 (2015)
- (3) A. Vishnyakov and A. V. Neimark, Specifics of freezing of Lennard-Jones fluid confined to molecularly thin layers, J. Chem. Phys. 118, 7585 (2003).
- (4) D. Takaiwa, I. Hatano, K. Koga, and H. Tanaka, Phase diagram of water in carbon nanotubes, PNAS 105 (1), 39-43 (2008)
- (5) I.A. Shchukin, Yu.D. Fomin, Crystal structure of a system with three-body interactions in strong confinement, Results in Physics 34, 105239 (2022).
- (6) H. Yang, K. Jayaatmaja, M. Dejam, S. P. Tan, and H. Adidharma, Phase Transition and Criticality of Methane Confined in Nanopores, Langmuir 38 (6), 2046-2054 (2022).
- (7) S. K. Singh, A. Sinha, G. Deo, and J. K. Singh, Vapor-Liquid Phase Coexistence, Critical Properties, and Surface Tension of Confined Alkanes, J. Phys. Chem. C 2009, 113, 7170–7180
- (8) V. V.Pisarev, A. G.Kalinichev, J. Molecular Liquids 366, 120290 (2022)
- (9) Handbook of Fluoropolymer Science and Technology, Edited by Dr. D. W. Smith Jr., Dr. S. T. Iacono, Dr. S. S. Iyres, John Wiley and Sons, Inc., Hoboken, New Jersey
- (10) I. M. Marrucho, N. S. Oliveira, and R. Dohrn, Vapor-Phase Thermal Conductivity, Vapor Pressure, and Liquid Density of R365mfc, J. Chem. Eng. Data 47, 554-558 (2002)
- (11) A. P. Froba, K. Krzeminski, and A. Leipertz, Thermophysical Properties of (R365mfc), International Journal of Thermophysics, 25, 987 (2004)
- (12) A. P. Froba, H. Kremer, A. Leipertz, F. Flohr, and C. Meurer, Thermophysical Properties of a Refrigerant Mixture of R365mfc and GaldenR HT 55 (Perfluoropolyether), International Journal of Thermophysics 28, 449 (2007)
- (13) O. G. Byutner and G. D. Smith, Quantum Chemistry Based Force Field for Simulations of , Macromolecules 2000, 33, 4264-4270.
- (14) St. L. Mayo, B. D. Olafson, and W. A. Goddard, DREIDING: a generic force field for molecular simulations, J. Phys. Chem. 1990, 94, 26, 8897–8909
- (15) J.-P. Ryckaert, G. Ciccotti, H. J. C. Berendsen, Numerical integration of the cartesian equations of motion of a system with constraints: molecular dynamics of n-alkanes, Journal of Computational Physics 23, 327-341 (1977).
- (16) V. Lachet, J.-M. Teuler, and B. Rousseau, Classical Force Field for Hydrofluorocarbon Molecular Simulations, Application to the Study of Gas Solubility in Poly(vinylidene fluoride), J. Phys. Chem. A 119, 140-151 (2015).
- (17) K. Chelakara Satyanarayana, K. Bolton, Molecular dynamics simulations of - to -poly(vinylidene fluoride) phase change by stretching and poling, Polymer 53, 2927 - 2934 (2012).
- (18) V. S. Bystrov, Molecular modeling and molecular dynamics simulation of the polarization switching phenomena in the ferroelectric polymers PVDF at the nanoscale, Physica B: Condensed Matter 432, 21 - 25 (2014).
- (19) F. Zeng, Ch. Peng, Y. Liu, and J. Qu, Reactive Molecular Dynamics Simulations on the Disintegration of PVDF, FP-POSS, and Their Composite during Atomic Oxygen Impact, J. Phys. Chem. A 119, 30, 8359–8368 (2015)
- (20) S. Plimpton, J. Comp. Phys. 117 (1995) 1–19.
- (21) A. A. Hariharan, J. Harris, Structure and Thermodynamics of the Liquid-Vapor Interface of Fluorocarbons and Semifluorinated Alkane Diblocks: A Molecular Dynamics Study, J. Chem. Phys. 101, 4156 - 4165 (1994).
- (22) S. Shin, N. Collazo, S. Rice, A Molecular Dynamics Study of the Packing Structures in Monolayers of Partially Fluorinated Amphiphiles. J. Chem. Phys. 96, 1352-1366 (1992).
- (23) G. Algara-Siller, O. Lehtinen, F. C. Wand, R. R. Nair, U. Kaiser, H. A. Wu, A. K. Geim and I. V. Grigorieva, Square ice in graphene nanocapilarities, Nature 519, 443-445 (2015)
- (24) K. Koga, G. T. Gao, H. Tanaka and X. C. Zeng, Formation of ordered ice nanotubes inside carbon nanotubes, Nature 412, 802–805 (2001)
- (25) F. G. Alabarse, J. Haines, O. Cambon, C. Levelut, D. Bourgogne, A. Haidoux, D. Granier, and B. Coasne, Freezing of Water Confined at the Nanoscale, Phys. Rev. Lett. 109, 035701 (2012)
- (26) A. Striolo, P. K. Naicker, A. A. Chialvo, P. T. Cummings and K. E. Gubbins, Simulated Water Adsorption Isotherms in Hydrophilic and Hydrophobic Cylindrical Nanopores, Adsorption 11, 397–401 (2005).
- (27) Yu. D. Fomin, V. N. Ryzhov and E. N. Tsiok, The behaviour of water and sodium chloride solution confined into asbestos nanotube, Molecular Physics 116, 2279-2288 (2016).