The MeerKAT Galaxy Clusters Legacy Survey: star formation in massive clusters at
Abstract
We investigate dust-unbiased star formation rates (SFR) as a function of the environment in 20 massive clusters () between using radio luminosities () from the recently released MeerKAT Galaxy Cluster Legacy Survey catalogue. We use optical data from the Dark Energy Camera Legacy Survey to estimate photo-s and assign cluster membership. We observe a steady decline in the fraction () of star-forming galaxies from to the cluster centres in our full cluster sample, but notice a significant difference in gradients between clusters hosting large-scale extended radio emission in the form of haloes and relics (associated with ongoing merger activity) and non-radio-halo/relic hosting clusters. For star-forming galaxies within , the in clusters hosting radio haloes and relics () is higher than in non-radio-halo/relic hosting clusters (). We observe a difference between the total SFR normalised by cluster mass for non-radio-halo/relic hosting clusters ( M⊙yr-1/M⊙) and for clusters with radio haloes and relics ( M⊙yr-1/M⊙). There is a decline in the mass normalised total SFR of clusters for galaxies with SFR above the luminous infrared galaxies (LIRGs) SFR limit at our redshift slice, corresponding to 2 Gyr in look-back time. This is consistent with the rapid decline in SF activity with decreasing redshift amongst cluster LIRGs seen by previous studies using infrared-derived SFR.
keywords:
galaxies: clusters: general – galaxies: star formation – galaxies: evolution1 Introduction
Probing star formation (SF) activity of galaxies in different cosmic environments paves an important path to understanding the dynamics behind galaxy evolution. Various studies have shown that SF decreases steadily with redshift from (e.g., Lilly et al., 1996; Karim et al., 2011; Sobral et al., 2014) and this has been shown to be the case in all environments (Koyama et al., 2013). Results from Peng et al. (2010) show that the suppression of SF activity in galaxies can be imposed by the galaxy environment (cluster/density-dependent) and can also be a result of internal processes (galaxy stellar mass-dependent), with both suppression effects acting on the galaxies independently. Some studies argue that the environment-induced suppression is secondary to the internal/stellar mass-induced suppression (e.g., Hahn et al., 2015). Darvish et al. (2016) suggests that the environmental suppression is only relevant at whereas the stellar mass suppression dominates at .
The internal or galaxy stellar mass regulation of SF results in a strong linear correlation between star formation rates (SFR) and stellar mass within galaxies called the star formation main sequence (MS, see Brinchmann et al., 2004; Elbaz et al., 2011; Speagle et al., 2014; Schreiber et al., 2015; Katsianis et al., 2016). The MS has been shown to be visible out to (Speagle et al., 2014) with an intrinsic scatter of dex that is constant throughout cosmic time.
In the local Universe, SF activity in galaxies has been shown to be strongly dependent on the galaxy environment through comparative studies of galaxies in high-density (groups/clusters) environments and galaxies in the field (e.g., Balogh et al., 1998; Lewis et al., 2002; Haines et al., 2015). These studies conclude that the fraction of star-forming galaxies in cluster environments is lower compared to low-density/field environments. Galaxy clusters are populated by two broad classes of galaxies: red-and-dead elliptical galaxies with little to no SF activity, mostly residing in cluster cores, and blue spiral galaxies with ongoing SF activity, mostly found in the cluster outskirts (e.g., Baldry et al., 2004; Taylor et al., 2015; Haines et al., 2017). This leads to the relation between the fraction of star-forming galaxies and the clustercentric radius noted by various studies (e.g., Lewis et al., 2002; Gómez et al., 2003; Haines et al., 2015). A number of physical processes have been proposed and observed to occur within clusters leading to the suppression of SF activity among cluster galaxies. Some of these processes may be driven by galaxy to galaxy interaction (harassment or tidal interactions, Farouki & Shapiro, 1981; Moore et al., 1996). In other cases, the galaxies may be sensitive to the large-scale cluster environment (ram pressure stripping, Gunn & Gott, 1972) or be quenched by "burning up" as they enter the cluster environment (Larson et al., 1980; Balogh et al., 2000).
Several cluster studies have observed a rapid decline in SF activity with redshift when examining the total SFR per unit cluster mass (). These studies found to be redshift dependent with a relation of , with for clusters out to redshifts (see, e.g., Kodama et al., 2004; Bai et al., 2009; Popesso et al., 2012; Webb et al., 2013; Alberts et al., 2014). The is derived from the sum of SFR for individual galaxies identified as cluster members normalised by the cluster mass. This quantity allows for comparison of SF activity between clusters of different masses.
SFR for normal galaxies (galaxies that do not host an active galactic nucleus) can be estimated from various tracers at different wavelengths across the spectrum (see, e.g., reviews by Kennicutt, 1998; Kennicutt & Evans, 2012; Madau & Dickinson, 2014). Rest-frame ultraviolet (UV) emission directly traces newly formed stars but suffers a great deal of attenuation from dust, thus requiring corrections for reliable star formation estimates (Bell, 2003). When the UV emission from the newly formed stars interacts with the dust, it heats the dust which then re-emits at infrared wavelengths, paving a way to trace SFR via obscured UV light (Kennicutt, 1998). Emission line tracers (H, [Oii], Ly), observed at optical/near-infrared wavelengths are also used for SFR measurements. Just like UV emission, emission line tracers face the challenge of dust attenuation and thus require corrections to get reliable SFR estimates. Another way of tracing SFR is through the radio continuum emission from star-forming galaxies. Radio emission is made up of thermal free-free (bremsstrahlung) radiation and non-thermal synchrotron radiation. The thermal free-free emission is a direct tracer of SFR due to ionized hydrogen from massive stars in young stellar populations. At frequencies GHz, thermal free-free radiation contributes weakly to the radio continuum flux and non-thermal radiation accounts for of the signal (Condon, 1992). Due to the tight correlation between radio emission and far-infrared (FIR) emission at 1.4 GHz (e.g., Helou et al., 1985; Condon et al., 1991; Yun et al., 2001), the radio continuum emission has a standard model for SFR estimation at this frequency. Being free from dust interactions, radio emission emerges as an advantageous tracer for estimating SFR in normal galaxies compared to other SFR tracers (see Kennicutt & Evans (2012) for a comprehensive review).
Several studies have investigated the environmental effects on the population and SFR of galaxies residing in high-density environments like galaxy groups and clusters. Recently, efforts have been made toward understanding the influence of cluster morphology on the overall SF activity of galaxies in clusters by comparing dynamically relaxed clusters to clusters hosting giant radio haloes and relics (regarded as evidence of past or ongoing merger activity). Merger/unrelaxed clusters have been observed to have enhanced SF activity at low redshifts in individual cluster studies (e.g., Owen et al., 2005; Ma et al., 2010; Ebeling & Kalita, 2019) as well as in statistical studies of multiple clusters (e.g., Cohen et al., 2014; Cohen et al., 2015; Stroe et al., 2017; Yoon & Im, 2020; Stroe & Sobral, 2021). Radio haloes are large-scale extended radio emission spanning over 500 kpc in linear size. The origin of radio haloes has been strongly linked with the reacceleration of relativistic particles by cluster mergers (e.g., Brunetti et al., 2009; Cassano et al., 2013; Lindner et al., 2014; Kale et al., 2015). Radio relics are extended synchrotron radio emission residing in the periphery of galaxy clusters. They are elongated Mpc-scale sources linked with shock fronts induced in the intra-cluster medium (ICM) during cluster mergers (e.g., Ogrean et al., 2013; van Weeren et al., 2016, 2019).
Various processes have been suggested to occur from cluster mergers that lead to the enhanced SF activity that is observed in merger clusters. Bekki et al. (2010) used numerical simulations to show that compressed cold gas from the rising external pressure of ICM during mergers could explain the SF activity enhancement in merger clusters. Stroe et al. (2017) suggests that the observed enhanced SF activity in merger clusters may be caused by shock waves in the ICM resulting from merging clusters or galaxy groups as well as the accretion of filaments.
In this paper, we present a statistical study of SF activity in multiple clusters using radio observations from the MeerKAT Galaxy Cluster Legacy Survey (MGCLS DR1; Knowles et al., 2022). MGCLS is a project of -band observations (900-1670 MHz) by the MeerKAT telescope (Jonas & MeerKAT Team, 2016) of 115 galaxy clusters between and declination. Our MGCLS radio data is crossmatched with DECaLS photometry to obtain a homogeneous set of radio-optical data with photo-s. With the MeerKAT field of view of deg2, we were able to probe to twice the of our clusters in our analysis. Extended radio emission is detected in 15 out of 20 clusters in our sample, 5 of which are new detections, and marked as candidates for radio haloes, relics and a mini-halo depending on their morphology (see Knowles et al., 2022). Fourteen clusters in our sample host extended emission in the form of either a radio-halo, a relic or a phoenix (a subclass of a relic, van Weeren et al., 2019). With this article, we aim to investigate SF activity in cluster environments and its relationship with the dynamical state of the cluster. We compare our results to previous studies of multiple clusters carried out using FIR as a tracer for SFR.
The structure of this paper is as follows. In Section 2 we describe the radio data, photometric data, cluster masses as well as the AGN identification and membership selection process. In Section 3 we discuss our SFR estimates, fraction of star-forming galaxies, SFR and cluster mass relation as well as the mass normalised total SFR relation with redshift. We discuss our results in Section 4. We end the paper by summarising our conclusions and laying out some future work in Section 5.
We assume a cosmology with = 70 km s-1 Mpc-1, and . denotes the mass enclosed within a sphere of radius in which the mean enclosed overdensity is equal to 200 times the critical density of the Universe at the cluster redshift. The Chabrier (2003) initial mass function (IMF) is used for SFR calculations.
2 Data
2.1 Cluster sample
The selection of the 20 clusters from the parent MGCLS sample was guided by the availability of cluster photometric data in the Dark Energy Camera Legacy Survey (DECaLS DR8; Dey et al., 2019) as well as the availability of cluster masses () from the Atacama Cosmology Telescope (ACT DR5; Hilton et al., 2021). The ACT DR5 catalogue has a homogeneous selection of clusters with consistently derived mass estimates which consists of 4195 optically confirmed Sunyaev-Zel’dovich (SZ) galaxy clusters with redshift measurements. The ACT DR5 catalogue provides a set of mass estimates that have been re-scaled according to a richness-based weak-lensing mass calibration through a technique described in Hilton et al. (2018). The DECaLS photometric data is complete for WISE (3.4 µm) W1 band apparent magnitude (mag) . This corresponds to an absolute mag limit , K-corrected to our sample median redshift (). We are sensitive down to a limit of +1.5, using (18.2) of the IR-selected cluster sample luminosity function best-fit from the Spitzer Infrared Array Camera (IRAC) -band (Mancone et al., 2010). is scaled down by 0.08 mag to correct for the colour difference between W1 (3.4 µm) and Spitzer IRAC channel one (3.6 µm). The IR luminosity function is a good tracer of the stellar mass function since the 3.6 µm photometry probes the peak of the stellar light.
The MGCLS catalogue is made up of a heterogeneous sample of 115 clusters with no general selection criteria guided by cluster mass or redshift. MGCLS comprises two subsamples grouped as “radio-selected” and “X-ray-selected” with each subsample contributing 41 and 74 clusters respectively. The MGCLS radio-selected subsample was picked to be biased towards high-mass clusters with extended radio emission. The X-ray-selected subsample was guided by the Meta-Catalogue of X-ray-detected Clusters (MCXC; Piffaretti et al., 2011), which is a heterogeneous compilation of X-ray-selected clusters with no direct prior biases towards or against clusters with extended radio emission.
Of the total 115 MGCLS clusters, 66 had optical counterparts with complete coverage in DECaLS and 38 of the 66 clusters have cluster masses from the ACT catalogue. The MGCLS field data is classified by image data quality ranging from 0 to 3. The data quality from 0 to 1 is classified as good to moderate dynamic range whereas 2 to 3 is classified as poor dynamic range with ripples and source artefacts on the data. For this study, we only work with fields that are flagged 0 and 1 to ensure that our data has the least amount of contamination.
Figure 1 shows the mass distribution of our final cluster sample with redshifts for 20 clusters which have reliable photo-s estimates and ACT SZ-derived cluster masses, all falling in the redshift range . The cluster sample selection was limited to clusters with due to the large scatter observed in photo-s estimates at , making them unreliable (see Figure 2). The cluster sample properties are listed in Table 1. Our final sample has 10 clusters from the radio-selected subsample, 9 of which are hosts of extended emission in the form of a radio halo and/or relic and 1 cluster with no extended emission. The other 10 clusters in our final sample are from the X-ray-selected subsample with 5 hosting extended emission in the form of a radio halo and/or relic, 1 hosting extended emission in the form of a mini-halo and 4 with no extended emission.
Fourteen clusters in our sample host large-scale extended emission (haloes and relics) linked to on-going merger activity. The presence of large-scale extended emission has been linked to the dynamical state of mergers or unrelaxed clusters by (e.g., Cassano et al., 2010, from their study of haloes using radio data and X-ray observations). The 6 clusters with no large-scale extended emission are assumed to be relatively dynamically relaxed or undergoing minor mergers and likely to be less disturbed in contrast to the 14 clusters hosting haloes and relics. We conducted a visual inspection on the dynamical state of 4 of the 6 non-halo/relic-hosting clusters in our sample using archival X-ray imaging from Chandra and XMM Newton surveys. The X-ray images indicate that the clusters are likely to be dynamically relaxed. Lovisari et al. (2017) classified the dynamical state of some of the clusters that overlap with our sample as either ‘disturbed’, ‘relaxed’, or ‘mixed’, using criteria based on seven parameters. Clusters J0449.9-4440 and J0525.8-4715 are classified as relaxed systems while J0510.2-4519 (hosting a mini-halo) is noted as a mixed system by the Lovisari et al. (2017) classification criteria. They point out that the mixed systems classification may be subjective and that a cluster falling under this category depends on the parameters chosen to optimise completeness and purity. Given the high masses of clusters in our sample, the clusters without large-scale extended emission are likely relaxed systems or have only minor mergers and can be considered to be less disturbed environments for star-forming galaxies.

| (1) | (2) | (3) | (4) | (5) | (6) | (7) | (8) | (9) | (10) |
| Cluster | RA | DEC | z | RMS | State | ||||
| (J b-1) | (1014 M⊙) | (Mpc) | M⊙yr-1 | ||||||
| Abell 209 | 22.970833 | -13.609444 | 0.206 | 3.6 | 2.0 | halo | |||
| Abell 2744 | 3.578333 | -30.383333 | 0.307 | 2.9 | 2.3 | halo, relic | |||
| Abell 2813 | 10.851667 | -20.621389 | 0.292 | 3.4 | 2.1 | halo‡ | |||
| Abell 2895 | 19.546250 | -26.973056 | 0.228 | 3.0 | 2.0 | phoenix‡ | |||
| Abell 521 | 73.537917 | -10.238611 | 0.248 | 3.4 | 1.9 | halo, relic | |||
| Abell S1063 | 342.181250 | -44.528889 | 0.348 | 2.6 | 2.6 | halo | |||
| Abell S295 | 41.399167 | -53.038056 | 0.300 | 2.3 | 2.2 | halo | |||
| J0051.1-4833 | 12.796667 | -48.559722 | 0.187 | 2.6 | 1.5 | relaxed | |||
| J0217.2-5244 | 34.302500 | -52.746944 | 0.343 | 2.8 | 1.4 | relic‡ | |||
| J0225.9-4154 | 36.477500 | -41.909722 | 0.220 | 2.7 | 1.5 | halo | |||
| J0232.2-4420 | 38.070000 | -44.347500 | 0.284 | 2.6 | 2.3 | halo | |||
| J0336.3-4037 | 54.077917 | -40.622222 | 0.172 | 3.5 | 2.0 | relaxed | |||
| J0449.9-4440 | 72.480000 | -44.678056 | 0.150 | 2.6 | 1.7 | relaxed | |||
| J0510.2-4519 | 77.557500 | -45.321111 | 0.200 | 3.0 | 1.8 | relaxed, mini-halo‡ | |||
| J0516.6-5430 | 79.158333 | -54.514167 | 0.295 | 3.1 | 1.8 | halo,relic | |||
| J0525.8-4715 | 81.465000 | -47.250556 | 0.191 | 3.0 | 1.9 | relaxed | |||
| J2023.4-5535 | 305.850000 | -55.591700 | 0.232 | 2.7 | 2.1 | halo, relic | |||
| MACS J0257.6-2209 | 44.422083 | -22.153889 | 0.322 | 3.2 | 2.0 | relic‡ | |||
| RXC J0528.9-3927 | 82.234583 | -39.462778 | 0.284 | 2.6 | 2.1 | halo | |||
| RXC J0543.4-4430 | 85.851667 | -44.505278 | 0.164 | 3.6 | 1.5 | relaxed |
2.2 MeerKAT data
The MGCLS DR1 (Knowles et al., 2022) is a publicly released catalogue of 115 galaxy clusters observed by the MeerKAT telescope in the -band throughout 900 – 1670 MHz. Each cluster is observed at full polarization for 6 – 10 hours. The MGCLS DR1 offers raw MeerKAT continuum visibilities, basic image cubes at resolution as well as enhanced spectral and polarization image cubes at and resolutions. MGCLS image products are sensitive within a range of 3 Jy beam-1 for an beam to 10 Jy beam-1 for a beam. The basic cubes span a deg2 field of view (FoV). The enhanced data products are primary beam corrected within a deg2 FoV. The survey gives good detections up to and has a wide bandwidth that enables spectral and Faraday rotation mapping.
The Python Blob Detection and Source Finder (PyBDSF; Mohan & Rafferty, 2015) software was used to create catalogues for all 115 clusters from the 1.28 GHz images at a threshold of source detection (see Knowles et al., 2022, for more details on source detection). The complete MGCLS DR1 catalogue has a combined total of compact sources from all 115 cluster data sets.
2.3 DECaLS data
The DECaLS data comes from images captured by the Dark Energy Camera (DECam deg2 FoV; Flaugher et al., 2015) located at the 4-m Blanco telescope at the Cerro Tololo Inter-American Observatory. DECam is a highly sensitive camera optimised for a wide-field survey across a broad wavelength range ( nm). DECaLS is part of the three surveys that integrate to make the DESI Legacy Survey, alongside the Beijing-Arizona Sky Survey (BASS; Zou et al., 2017) and the Mayall z-band Legacy Survey (MzLS; Silva et al., 2016). DECaLS provides optical photometry combined with 3.4, 4.6 µm photometry from the Wide-field Infrared Survey Explorer mission (WISE; Wright et al., 2010). The DECaLS photometry data has 5 depth levels of , and in AB magnitudes.
2.4 Photometric redshifts
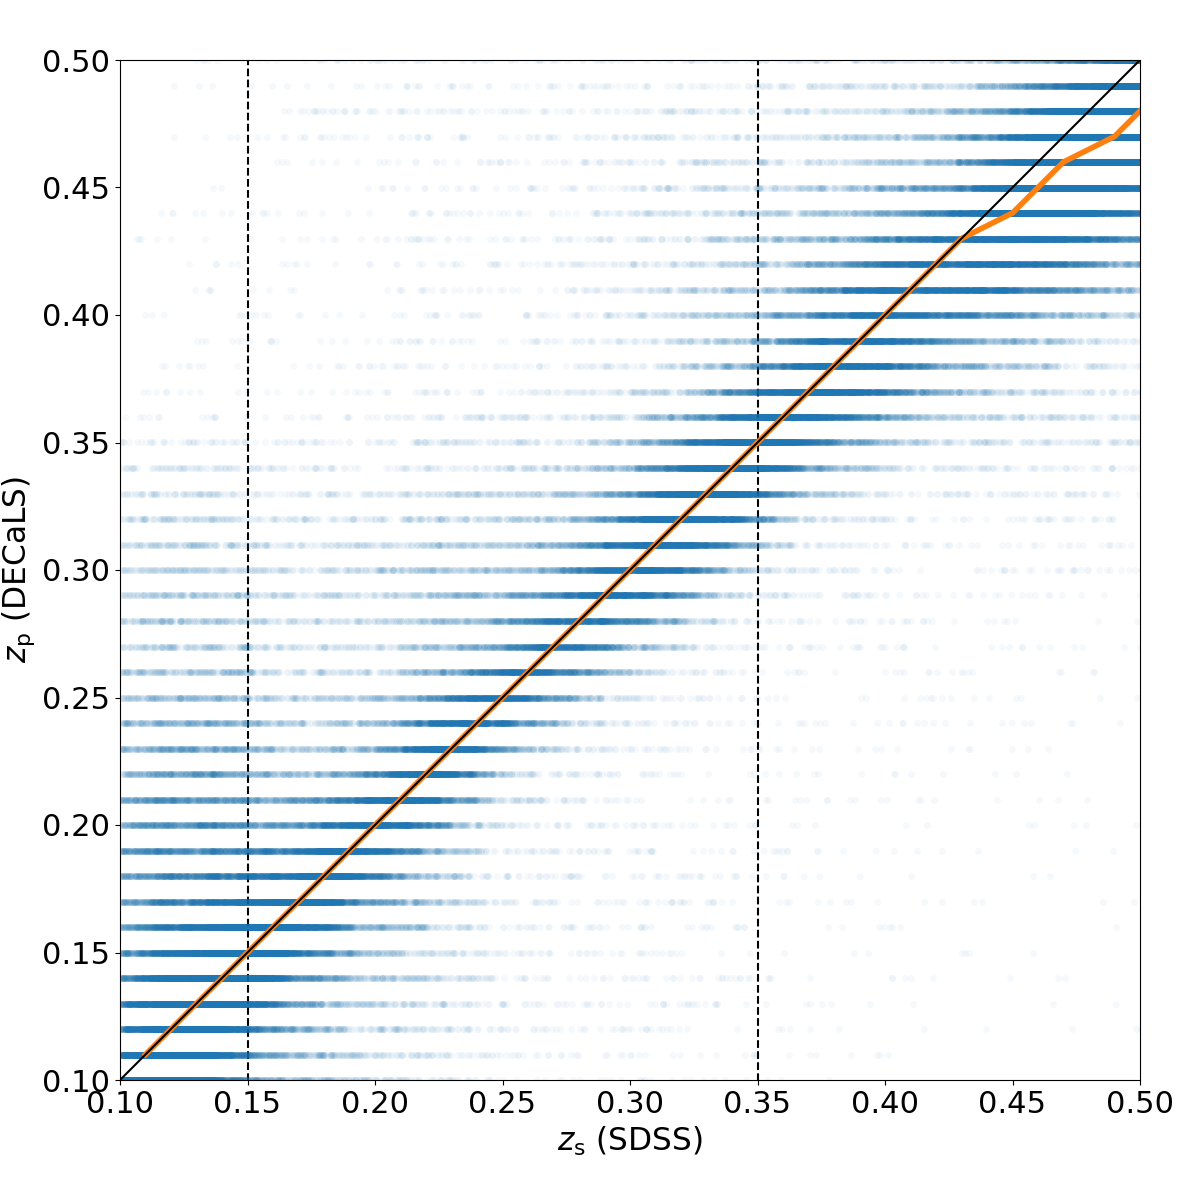
We use the zCluster111https://github.com/ACTCollaboration/zCluster package (see, Hilton et al., 2021; Pillay et al., 2021) to estimate the maximum likelihood galaxy photo-s and their probability distribution, using a template-fitting method. We use a combination of the Coleman et al. (1980) templates and a subset of the spectral templates used in the COSMOS survey (Ilbert et al., 2009; Salvato et al., 2011), representing a range of normal galaxies and AGNs. We test the accuracy of the photo-s using 219,380 galaxies within the DECaLS footprint that have spec-s in SDSS DR16 (Ahumada et al., 2020). We also use this sample to calibrate zero-point offsets to the DECaLS photometry to minimise the bias of the photometric redshift (photo-) residuals (, where is the spectroscopic redshift (spec-), and is the photo-). After this procedure, we find mean , and scatter , as estimated using the biweight scale (e.g., Beers et al., 1990). We find that 93% of the galaxies have , i.e., 7% of the photo-s are expected to be “catastrophic outliers”. Figure 2 shows a comparison of the photometric and spec-s for this test sample.
2.5 Cluster membership selection
The most unequivocal way to select cluster members is by use of reliable spec-s. However, extensive spec- catalogues covering our cluster sample are not available. For this study, we rely solely on photo-s to achieve a homogeneous dataset. In Section 2.4, we discuss the process for deducing the photo- using zCluster and their accuracy.
Instead of relying only on a single best-fitting photometric redshift estimate for each galaxy without considering its uncertainty, our membership process uses the full redshift probability distribution provided by zCluster. We follow a method developed by Pelló et al. (2009) to identify cluster members. This method builds on a technique by Brunner & Lubin (2000), which calculates the probability () of being a member galaxy at a redshift range centred at the cluster redshift (), with a width () that depends on the accuracy of the photo-s (see Section 2.4),
| (1) |
For our case, . This approach works well for this study as we mainly focus on the integrated properties of the cluster galaxy population (i.e., total cluster SFR or fraction of star-forming galaxies), rather than the properties of individual galaxies. We use the three clusters in our sample with available extensive spec-s (A209, A2744, AS1063) in the literature to calibrate cluster membership selection for the rest of the sample. We classify galaxies with spec-s as members that satisfy the condition , where is the cluster velocity dispersion. The Abell 209 spec-s were obtained from the Cluster Lensing And Supernova survey with Hubble (CLASH-VLT; Annunziatella et al., 2016) and the Arizona Cluster Redshift Survey (ACReS; described in Haines et al., 2015). The spec-s for Abell 2744 are from the Multi Unit Spectroscopic Explorer (MUSE; Mahler et al., 2018) and Anglo-Australian Telescope (AAT; Owers et al., 2011) catalogues. The Abell S1063 spec-s were obtained from the CLASH-VLT catalogue (Mercurio et al., 2021).
From the stacked catalogue of all the three clusters with spec-s, we get from the redshift residuals, . The spectroscopic completeness level and the field contamination using and . The and values were chosen to maximise and minimise while selecting galaxies that are likely to be members using redshift probability distribution functions. The spectroscopic completeness level describes the number of confirmed spec- members correctly identified as members by the photo-s selection criteria. The field contamination shows the percentage level of spec-s that are non-members/field galaxies but selected by the photo-s membership criteria.
The from the stacked catalogue is higher than the one estimated with the SDSS spec-s mentioned in section 2.4. We adopt the larger value as a more conservative estimate of the cluster member photometric redshift accuracy. Table 2 shows the and percentage levels reached for each cluster. We use the same selection parameters to identify members using only photo-s for all our 20 clusters, assuming a and for our full sample. We further attempt to mitigate the field contamination in two ways: (1) we check the effect of using a higher on our results, and (2) we use as a weight for each galaxy when investigating integrated cluster properties. We find that increasing the threshold has minimal effect on our overall conclusions while reducing the completeness level in the spectroscopic sample and with little change in the field contamination level.
We obtain a total of 14,419 galaxies out to 2 for the W1 complete DECaLS membership sample for the 20 clusters. This gave us a sample of 3054 cluster member galaxies observed by MeerKAT. The MeerKAT-detected member galaxies sample is complete above a detection limit of SFR = 1.9 Myr-1 in our most distant cluster ().
| (1) | (2) | (3) | (4) | (5) | (6) |
| Cluster | No. of spec-s | (%) | (%) | ||
| Abell 209 | 0.206 | 2377 (753) | 0.10 | 81 | 15 |
| Abell 2744 | 0.307 | 971 (463) | 0.06 | 81 | 13 |
| Abell S1063 | 0.348 | 1626 (751) | 0.08 | 84 | 25 |
2.6 AGN identification
Galaxies hosting active galactic nuclei (AGN) pose a significant challenge when using radio observations to estimate SFR in galaxies. Previous studies (e.g., Sadler et al., 2002; Condon et al., 2002; Mauch & Sadler, 2007) have shown that radio-AGN may contribute up to of the radio luminosities in the local Universe at luminosities just below W Hz-1, and that at luminosities over W Hz-1 AGN dominate the population over star-forming galaxies. It is therefore essential for us to remove AGN-hosting galaxies from our dataset to achieve an unbiased star-forming sample. To identify X-ray AGN, we cross-matched our member galaxies sample with the Chandra serendipitous source catalogue (CSC 2.0; Evans et al., 2019) and the fourth XMM-Newton serendipitous source catalogue (4XMM-DR11; Webb et al., 2020). X-ray sources above the rest-frame (2-10 keV) X-ray luminosity, erg s-1 are expected to be AGN, whereas those below this limit are expected to be powered by star formation. We used the cross-matching radius of for both X-ray catalogues, yielding 65 and 54 sources respectively. There are four clusters in our sample with no coverage or matches within the X-ray catalogues. Of the 119 galaxies with X-ray cross-matches, we remove 94 galaxies that are above the X-ray AGN luminosity cut.
To determine additional AGN, we adopt the ‘R90’ WISE IR-selection criteria by Assef et al. (2018) (see also Stern et al., 2012; Assef et al., 2013) for AGN classification. This uses only the WISE W1 and W2 bands to identify AGN based on their W1-W2 colour, compared to a threshold that depends on the W2 band mag (see equation 4 of Assef et al., 2018, which identifies AGNs with 90% reliability). With this AGN separation method, we removed 28 sources classified as AGN-hosting galaxies from our sample.
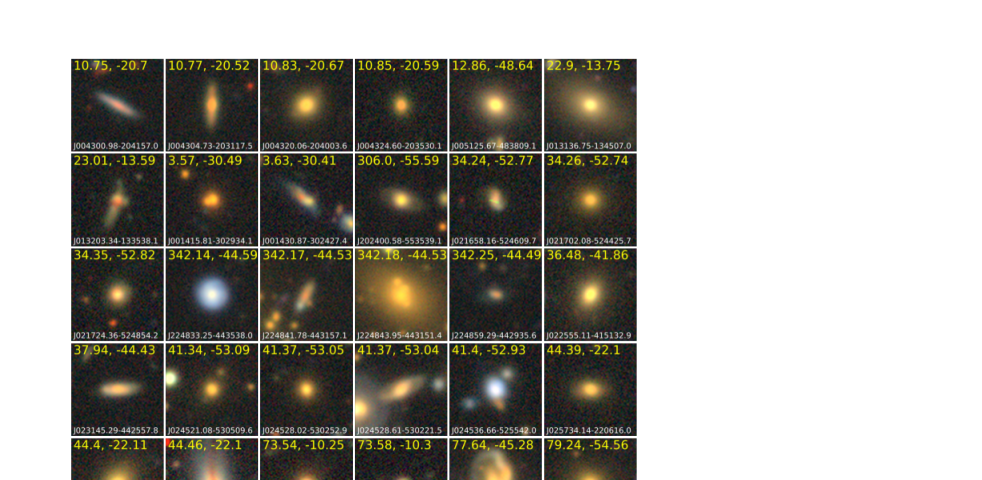
Finally, to reduce contamination from radio-loud AGN, we apply a radio luminosity cut on our sample for galaxies with W Hz-1 (Condon et al., 2002). This cut removes 80 galaxies, some of which may be star-forming, but a relatively small number (<3) of the total sample. Only 30 galaxies with the luminosity above the radio-loud AGN cut are within our total sample . Figure 3 shows Legacy Surveys DR9 images of the 30 radio-loud galaxies within of our cluster sample to visually confirm AGN status. Most of the galaxies show evidence of early-type morphology and are likely to be AGN hosts and not star-forming. A handful of galaxies show disky morphology with observed dust lines visible across their images. We observe three galaxies within the radio-loud sample with ambiguous morphology. These are; MKTCS J024536.66-525542.0 and MKTCS J224833.25-443538.0, which shows the structure that is consistent with quasar morphology and the MKTCS J051033.09-451647.8, which appears to be two galaxies colliding with two noticeable bulges and disturbed spiral arms. It is also worth noting that low luminosity radio-loud AGN may be left out by the radio luminosity cut and we assume that their number does not significantly affect our results.
After removing 203 galaxies identified as AGN hosts, we obtain a total sample of 2851 MeerKAT-detected galaxies out to 2, which we assume to be powered by star formation in the sections that follow. After removing 436 X-ray and WISE AGN from the photometric DECaLS selected members sample, we obtain 13,983 galaxies.
3 Star formation rates
We used the Bell (2003) calibration of the radio–FIR correlation (see also Karim et al., 2011) to convert radio luminosities to SFR scaled down by 1.74 from the Salpeter IMF to the Chabrier IMF:
| (2) |
where is the radio luminosity in W Hz-1 derived from the MGCLS 1.28 GHz total flux density, using a power-law scaling and assuming a non-thermal spectral index of -0.8 (Condon, 1992). Hz-1is taken to be the typical radio luminosity of an -like galaxy. Bell (2003) argues that galaxies with low luminosities could have their non-thermal emission significantly suppressed and therefore need to be separated from the population with higher luminosities.
3.1 Star formation activity as a function of clustercentric distance
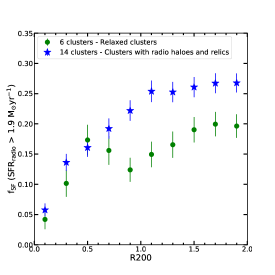
Previous studies have shown that SF activity is suppressed with decreasing distance from the cluster centre (Balogh et al., 1998; Lewis et al., 2002; Haines et al., 2015). We study the population distribution of our radio-derived SFR for the 20 clusters with respect to their clustercentric radius in units of . We define the fraction of star-forming galaxies as , where is the number of galaxies classified as star-forming cluster members and is the total number of cluster members. The left panel of Figure 4 shows the for MeerKAT-detected sources in radial bins compared with results from Haines et al. (2015), obtained from infrared-derived SFR using Spitzer/MIPS 24m observations for 30 clusters at and a detection limit of . The Haines et al. (2015) study calculates SFR using the Kroupa (2002) IMF, which yields results that are nearly identical to the Chabrier (2003) IMF. The fraction of star-forming galaxies from radio observations is generally higher than the of Haines et al. (2015) with the data points having differences ranging between 1-3. The observed higher in our sample could be a result of a bias towards merger-linked clusters. The Haines et al. (2015) cluster sample is comprised of uniformly selected clusters with no significant bias towards either merger or relaxed clusters. They notice that even at large radii, 2, the of clusters () remained well below that of field galaxies (). They conclude that this is not due to cluster galaxies having higher stellar masses than field galaxies, as it is known for to decrease with increasing stellar mass (e.g., Haines et al., 2007). They suggest that being low out to large clustercentric radii may be due to the star-forming galaxies being pre-processed in lower-density environments such as galaxy groups before they enter cluster environments.
The central panel of Figure 4 shows the of the MeerKAT cluster sample split by whether they have radio haloes/relics. Our sample has 14 clusters with extended emission in the form of radio haloes and relics (found in merger clusters) and their trend is shown in blue stars. The trend for the 6 relaxed clusters without radio haloes/relics is shown in green circles. The relaxed clusters have a shallower decline from to the centre in contrast to the steeper decline noticed in the merging clusters. Recent studies (Cohen et al., 2014; Cohen et al., 2015; Yoon & Im, 2020) estimate that the fraction of star-forming galaxies is higher in merger clusters than in relaxed clusters. The median for clusters with merger activity () in our sample is higher than the relaxed clusters () for all star-forming galaxies within . The difference rises to for all star-forming galaxies within 2 between merger clusters () and relaxed clusters (). The errorbars are calculated using bootstrap resampling of the SF galaxies in the clusters.
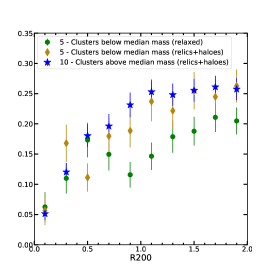
To investigate if our results could have a hidden dependence on cluster mass since all relaxed clusters in our sample have masses below the median mass, we divided our sample into two mass bins split by median mass (). The right panel of Figure 4 shows the trends for 10 clusters below the median mass split by their dynamical state, with 5 relaxed clusters (green circles) and 5 clusters with radio haloes/relics (brown diamonds). The remaining 10 clusters above the median mass host radio haloes/relics are shown in blue stars. The trend of merger-linked clusters below the median mass shows more SF activity than seen in the trend of the relaxed clusters in the same mass bin, roughly consistent with the trend of merger-linked clusters in the higher mass bin. This enhanced SF activity in merger-linked clusters below median mass is also evident in Figure 5 which is discussed in the following section.
We notice similar trends within between clusters that host only haloes and the clusters that host only relics and those with both relics and haloes in our sample.
3.2 SFR – relations
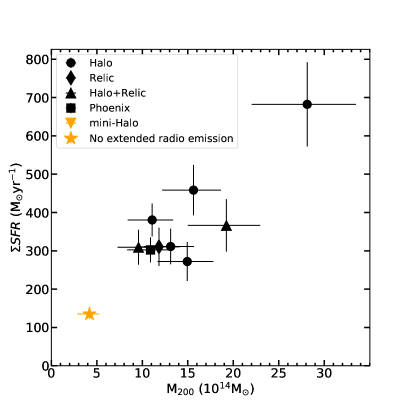
3.2.1 Total star formation rates versus cluster mass
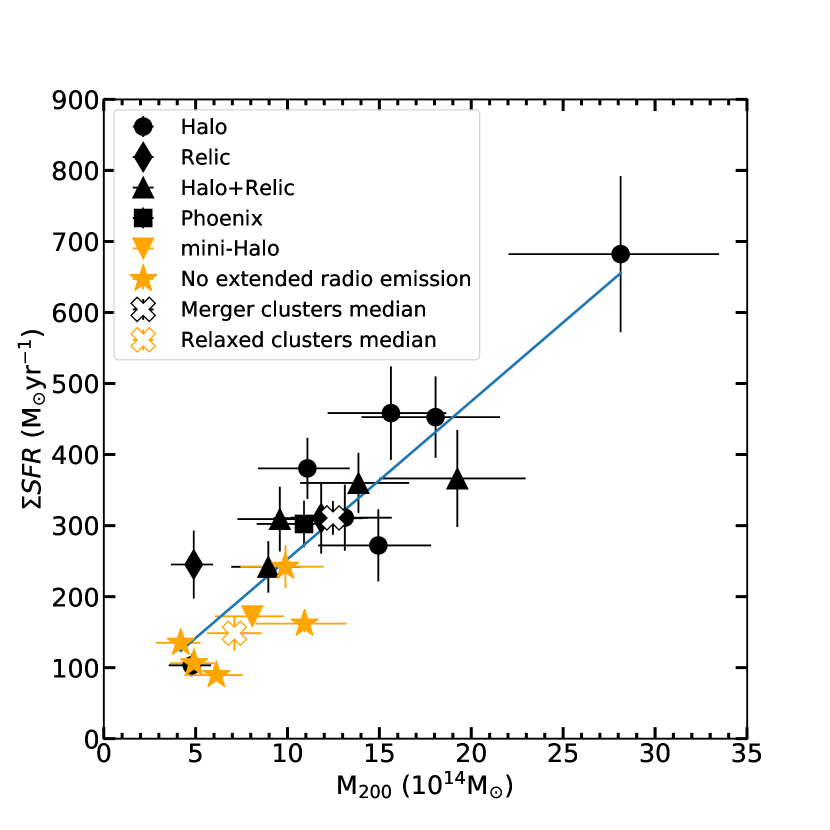
To investigate how our cluster sample SFR relates with cluster mass, we summed the SFR for member galaxies within and plotted them against cluster masses as shown in Figure 5. The clusters that have been identified to have merger-related extended radio emission are plotted in black markers and relaxed clusters are plotted in orange markers. Figure 5 shows that the total SFR correlates not only with cluster mass but is also dependent upon the dynamical state of the cluster. This result is consistent with recent claims that mergers enhance SF activity in clusters at low redshifts (e.g., Cassano et al., 2013; Cohen et al., 2014; Stroe & Sobral, 2021). We observe a marginal difference (within ) between median values for mass normalised total SFR in relaxed clusters ( M⊙yr-1/M⊙) and clusters with merger activity ( M⊙yr-1/M⊙). The errors on the median values were estimated from bootstrap resampling.
3.2.2 Star formation activity per unit cluster mass
A number of recent studies have examined the evolution of SF activity with redshift in clusters by using the total SFR per cluster mass for clusters hosting luminous infrared galaxies (LIRGs) (e.g., Popesso et al., 2012; Haines et al., 2013; Webb et al., 2013). This is done by summing the SFR of individual galaxies that are confirmed to be members within for each cluster and normalising it by , . This approach enables the comparison of SF activity for clusters with different masses. Although methods employed by the various studies to define cluster properties differ from one another, including this one, they all consistently come to the conclusion of a rapid decline in SF activity within clusters with decreasing redshift.
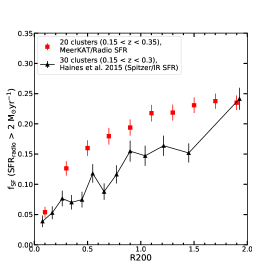
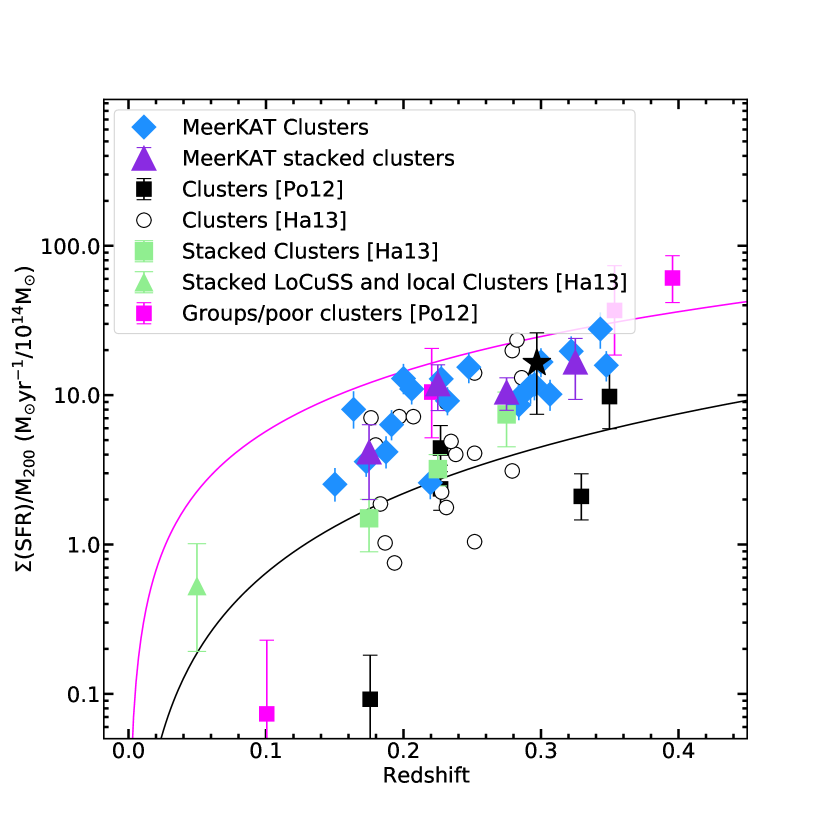
To understand the evolution of SF activity within our sample, we follow the analysis of Popesso et al. (2012), hereafter Po12, which studies the – redshift relation for LIRGs in rich/massive clusters and groups/poor clusters at using infrared luminosities from Herschel/PACS 100m and 160m. Following Po12, we summed up the SFR of all the MeerKAT galaxies with SFR values above the LIRG luminosity limit corresponding to Hz-1 or 10 M⊙yr-1 in SFR for each of the 20 clusters in our sample. All clusters in our sample contain at least one LIRG within . Figure 6 shows a plot of – redshift relation for our sample including results from Po12 scaled down by 1.74 from the Salpeter IMF to Chabrier IMF. Figure 6 includes results from Haines et al. (2013), hereafter Ha13, which also followed the Po12 study of LIRGs at using infrared luminosities from Spitzer/MIPS 24m. It is worth noting that there are differences in cluster mass estimation methods between our study and both the Po12 and the Ha13 studies. The Po12 study uses dynamical mass estimates derived from optical spectroscopy and the Ha13 study relies on X-ray-derived masses. This means that for clusters that are common among the studies, the total SFR within would be estimated out to different radii, due to differences in the mass measurements between the studies. None of the clusters in our sample overlap with the Po12 cluster sample and only one cluster from our sample (Abell 209) appears in the Ha13 study. The value for Abell 209 from Ha13 is M⊙yr-1/M⊙. This is within of our estimated value for the same cluster, () M⊙yr-1/M⊙.
We estimate the overall evolutionary trend by dividing our cluster sample into four redshift bins as indicated by the purple triangles in Figure 6. We observe a decline in the level of SF activity per cluster mass in MeerKAT clusters in contrast to the decline seen by Ha13 in green squares over the redshift slice. Just as observed in Ha13, we also see a decline in the number of cluster LIRGs with redshift bins, reducing from 87 LIRGs in 5 cluster systems at to 10 LIRGs in 5 systems at .
Figure 6 includes the (SFR)/ of the Bullet cluster from Po12 (indicated by the black star), which is known to have an ongoing violent merger. The Bullet cluster has a higher (SFR)/, consistent within errorbars with the clusters in our sample, most of which host extended radio emission linked to merger activity. Even with noted differences in our study and those from other authors, the evolutionary trend for MGCLS clusters also indicate that there is a rapid decline in star formation activity among cluster galaxies at lower redshifts, roughly consistent with observations made by Po12 and Ha13.
4 Discussion
In the previous section, we studied the effect of cluster dynamical state on the SF activity of galaxies in relaxed clusters and clusters with merger-linked extended emission. Our results infer that clusters with merger-linked extended emission have enhanced SF activity compared to relaxed clusters. We estimate a higher SF activity in clusters with radio haloes and/or relics within and out to 2. We note that our dynamical state subsamples are unevenly distributed across the full sample redshift range as shown in Figure 1. The relaxed clusters fall within the lower redshift bin while unrelaxed/merger clusters are all above . The in clusters has been shown to increase with redshift, forming a relation known as the Butcher & Oemler (1978, hereafter BO) effect. The BO effect is the increase in the fraction of blue galaxies in clusters with redshift. Since our study uses to compare SF activity between subsamples, we expect some fraction of the differences in the overall cluster to be due to the BO effect. However, as suggested by this investigation as well as previous studies that have investigated SF activity in clusters, the dynamical state of a cluster plays an influential role in its SF activity. Observing a homogeneous sample (not subject to MGCLS heterogeneous nature) will allow us to confirm this result and rule out whether or not the BO effect affected our results and by how much.
Results from our study are consistent with observations made by previous studies that looked at the effect of cluster dynamical state on SF activity. Cohen et al. (2014) studied 107 clusters at using the Sloan Digital Sky Survey (SDSS) and uses substructure within clusters to identify clusters with multiple substructure components (mergers) from single component clusters (relaxed). They found merger clusters to have more SF activity than relaxed clusters. Yoon & Im (2020) estimates up to more SF activity within in multiple component clusters compared to single component clusters from their study of 105 clusters at using SDSS. The enhanced SF activity in merger clusters has also been observed by Stroe & Sobral (2021) from their study of H emitters in 14 clusters at .
In contrast to the results of these low-redshift studies, Mansheim et al. (2017) observed that SF activity may be suppressed in merger clusters from the study of an individual cluster system at high redshift (). More recently, Maier et al. (2022) observed higher SF activity in clusters with an actively star-forming BCG (indicative of a relaxed cool-core cluster) than in clusters with passive BCGs (indicative of a non-relaxed cool-core cluster) using a study of 18 clusters at from the Local Cluster Substructure Survey (LoCuSS). The Chung et al. (2010) study of the merging Bullet cluster argues that, depending on the cluster, mergers may not be the driver for the enhanced SF activity but could be a result of the infalling galaxy population. Wittman (2019) suggests that claims made by various studies that cluster mergers suppress, enhance or have no effect on SF activity may not be conflicting but can be explained by how much time has passed since the pericenter passage (the age of the merger), the relative velocity at the first pericenter, and the viewing angle.
We observe a linear correlation between and cluster mass (), consistent with results from previous studies (e.g., Goto, 2004; Popesso et al., 2006). This correlation has been described as a richness effect, , where is the number of galaxies in a cluster. The number of galaxies in a cluster scales with cluster mass in that the higher the mass, the higher the number of star-forming galaxies. Figure 5 shows the linear correlation of and . We also observe the contribution of cluster dynamical state to the , something that was not considered by previous studies. The contribution of cluster dynamical state is particularly evident along clusters with mass estimates within of each other but with different relaxation states. This difference is noticeable in clusters within the mass range . There are 8 clusters that fall within this range and we observe that the median for relaxed clusters ( M⊙yr-1) is lower than the one for clusters with radio haloes and/or relics ( M⊙yr-1).
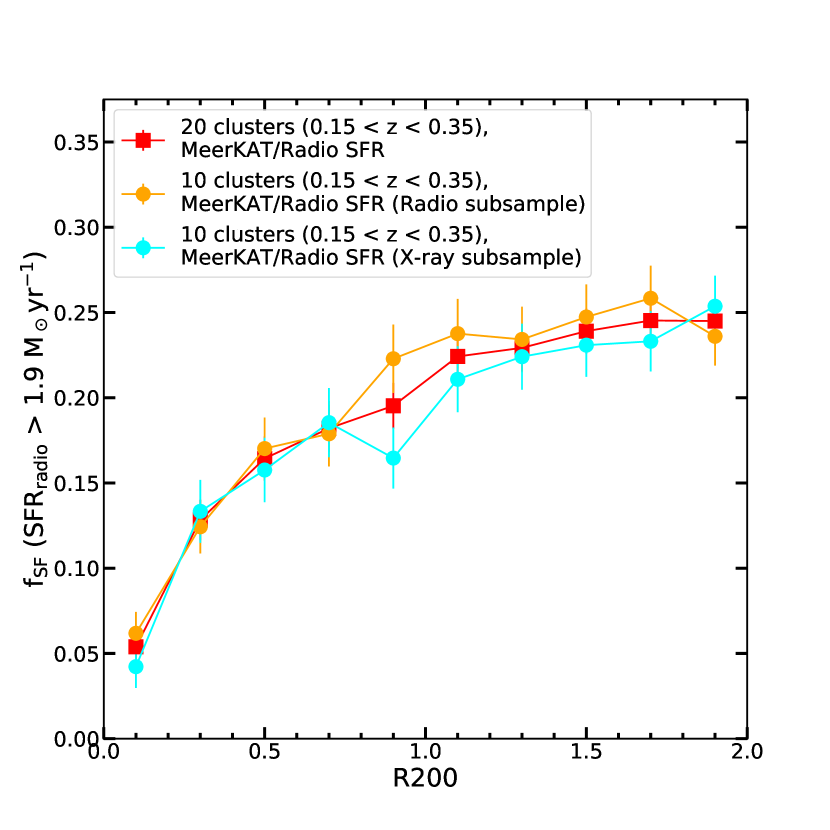
As described in Section 2.1, the MGCLS catalogue is made up of a combination of two subsamples. One from the radio-selected subsample (biased towards extended emission) and the other from the X-ray-selected subsample with no prior biases towards or against clusters with extended emission but selected with no redshift or X-ray luminosity criteria followed. Our cluster sample is biased towards clusters with extended radio emission, albeit equally split between clusters from each MGCLS subsample. To check our results, we look at clusters from the X-ray-selected subsample by splitting clusters in our sample by their MGCLS subsamples and re-plotting Figures 4 and 5.
Figure 7 shows the profiles of our clusters broken down by their subsample. The radio-selected subsample comprises 9 merger-linked extended emission clusters and one relaxed cluster in the redshift range . The X-ray-selected clusters subsample is evenly distributed between 5 merger-linked extended emission clusters and 5 relaxed clusters also in the redshift range of . The radio-selected subsample has an of within 2 while the X-ray-selected subsample is out to the same radius. The errorbars are calculated using bootstrap resampling of the SF galaxies in the clusters. The radio-selected trend is slightly higher than that of the X-ray-selected sample and the values lie within between the subsamples. The observed higher trend of the radio-selected subsample is likely due to the selection bias towards clusters with haloes and/or relics, and therefore to massive mergers.
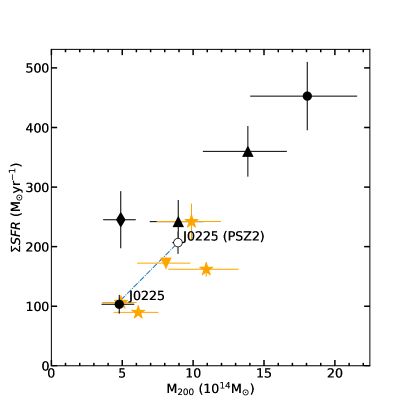
Figure 8 shows the plot of versus for clusters in our sample separated into each respective subsample. The left panel shows the plot of the clusters from the radio-selected subsample and the right panel shows the plot of the clusters from the X-ray-selected subsample. Although clusters from the X-ray-selected sample is limited in quantity, a correlation between and is observed in the right panel of Figure 8. Results from the X-ray-selected clusters are consistent with merger clusters having higher SF activity than relaxed clusters. Due to the limitation of a small cluster sample, future observations of a larger sample will be required to confirm these results.
We observe one halo-hosting cluster, J0225.9-4154 (J0225 hereafter), that has a profile of relaxed clusters at its mass on the X-ray subsample. Dynamical state studies of J0225 reveal that it is an interesting binary cluster system of two merging clusters (A3017 and A3016) connected by an X-ray filament (see Foëx et al., 2017; Parekh et al., 2017; Chon et al., 2019, for detailed reviews of the on-going merger). Dynamical studies show that J0225 is a face-on merger at its early stage with multiple substructures within its virial radius. The dynamical mass estimate () for J0225 according to Foëx et al. (2017) is but after accounting for the substructure in the line of sight they obtain an estimate of . Their estimate is in good agreement with the mass estimate from the Planck Sunyaev-Zeldovich sources catalogue (PSZ2, Planck Collaboration et al., 2016) re-scaled to , . The Foëx et al. (2017) and the PSZ2 mass estimate for J0225 are approximately double the ACT mass estimate () but fall within of each other. The right panel of Figure 8 includes the data point for at the PSZ2 mass estimate for J0225 and shows the difference in between the two mass estimates of the cluster. The from the PSZ2 mass estimate is higher by a factor of 1.6 and has at 1.9 Mpc, higher than from the ACT mass estimate. The extraordinary nature of J0225 raises the need for a multi-wavelength analysis to get a clear picture of its properties.
5 Conclusions
We have studied SF activity in cluster environments at low redshifts () using dust-unbiased radio continuum data from the MGCLS. This provides the first-look at SFR in clusters using radio data from the MeerKAT telescope. The investigation of SF activity in and around clusters is crucial in understanding how galaxies evolve with time in high-density environments and how the dynamical state of a cluster affects SF activity in galaxies. Below is the summary of our main results:
-
1.
We measure a population trend out to a similar limit at with the Haines et al. (2015) study, noting a 1-3 difference between the radio SFR and IR SFR data points which is likely due to the MGCLS selection bias towards merger-linked clusters. Both the radio-derived and IR-derived are lower than the Haines et al. (2015) field galaxies even at 2. This is consistent with the suggestion that in-falling galaxies may be pre-processed in their prior environments such as galaxy groups, before they enter cluster environments, which could explain the lower even at radii over .
-
2.
There is a difference in SF activity between clusters that host extended radio emission (relics and haloes) linked to cluster mergers and clusters that are non-halo/relic hosting, likely to be dynamically relaxed or only minor mergers. We see the differences in the as well as the between merger clusters and relaxed clusters. Merger clusters have a higher fraction of star-forming galaxies and consequently a higher compared to relaxed clusters.
-
3.
We find a rapid decline in the SF evolutionary trend among radio-selected galaxies with SFR corresponding to those of cluster LIRGs in our sample. We observe a decline in from redshift of 0.35 till 0.15, corresponding to 2 Gyr in lookback time. This observation is roughly consistent with IR-derived SFR studies by Popesso et al. (2012) and Haines et al. (2013).
One limitation of this work is that the underlying sample (MGCLS) is heterogeneous and made up of two subsamples, with one biased towards clusters with extended emission and the other probing X-ray clusters with no selection criteria followed. A follow-up study will be conducted in the future using a catalogue of unbiased cluster samples selected only by mass from the MeerKAT Exploration of Relics, Giant Halos, and Extragalactic Radio Sources (MERGHERS program, see Knowles et al., 2021).
Acknowledgements
We are grateful to the referee (Christopher P. Haines) for their invaluable comments and suggestions that improved the clarity of the paper. The authors would like to thank Lawrence Rudnick and Bruce Partridge for useful discussions that helped to improve the quality of this work. The MeerKAT telescope is operated by the South African Radio Astronomy Observatory, is a facility of the National Research Foundation, an agency of the Department of Science and Innovation. The authors acknowledge the contribution of those who designed and built the MeerKAT instrument. The National Radio Astronomy Observatory is a facility of the (US) National Science Foundation, operated under a cooperative agreement by Associated Universities, Inc.
KK acknowledges funding support from the South African Radio Astronomy Observatory (SARAO) through the HCD scholarship. Computations were done on the hippo cluster at the University of KwaZulu Natal.
Data Availability
The MeerKAT 1.28 GHz radio continuum data is accessed from the MeerKAT Galaxy Clusters Legacy Surveys (MGCLS222https://archive-gw-1.kat.ac.za/public/repository/10.48479/data_releases/The_MeerKAT_Galaxy_Cluster_Legacy_Survey_DR1/index.html) data archive. The data generated in this study will be shared on reasonable request to the corresponding author and will be made public through the MGCLS data archive in the future.
References
- Ahumada et al. (2020) Ahumada R., et al., 2020, ApJS, 249, 3
- Alberts et al. (2014) Alberts S., et al., 2014, MNRAS, 437, 437
- Annunziatella et al. (2016) Annunziatella M., et al., 2016, A&A, 585, A160
- Assef et al. (2013) Assef R. J., et al., 2013, The Astrophysical Journal, 772, 26
- Assef et al. (2018) Assef R. J., Stern D., Noirot G., Jun H. D., Cutri R. M., Eisenhardt P. R. M., 2018, The Astrophysical Journal Supplement Series, 234, 23
- Bai et al. (2009) Bai L., Rieke G. H., Rieke M. J., Christlein D., Zabludoff A. I., 2009, The Astrophysical Journal, 693, 1840
- Baldry et al. (2004) Baldry I. K., Glazebrook K., Brinkmann J., Ivezić Ž., Lupton R. H., Nichol R. C., Szalay A. S., 2004, ApJ, 600, 681
- Balogh et al. (1998) Balogh M. L., Schade D., Morris S. L., Yee H. K. C., Carlberg R. G., Ellingson E., 1998, The Astrophysical Journal, 504, L75–L78
- Balogh et al. (2000) Balogh M. L., Navarro J. F., Morris S. L., 2000, ApJ, 540, 113
- Beers et al. (1990) Beers T. C., Flynn K., Gebhardt K., 1990, AJ, 100, 32
- Bekki et al. (2010) Bekki K., Owers M. S., Couch W. J., 2010, ApJ, 718, L27
- Bell (2003) Bell E. F., 2003, The Astrophysical Journal, 586, 794
- Brinchmann et al. (2004) Brinchmann J., Charlot S., White S. D. M., Tremonti C., Kauffmann G., Heckman T., Brinkmann J., 2004, MNRAS, 351, 1151
- Brunetti et al. (2009) Brunetti G., Cassano R., Dolag K., Setti G., 2009, A&A, 507, 661
- Brunner & Lubin (2000) Brunner R. J., Lubin L. M., 2000, The Astronomical Journal, 120, 2851
- Butcher & Oemler (1978) Butcher H., Oemler A. J., 1978, ApJ, 219, 18
- Cassano et al. (2010) Cassano R., Ettori S., Giacintucci S., Brunetti G., Markevitch M., Venturi T., Gitti M., 2010, ApJ, 721, L82
- Cassano et al. (2013) Cassano R., et al., 2013, ApJ, 777, 141
- Chabrier (2003) Chabrier G., 2003, PASP, 115, 763
- Chon et al. (2019) Chon G., Böhringer H., Dasadia S., Kluge M., Sun M., Forman W. R., Jones C., 2019, A&A, 621, A77
- Chung et al. (2010) Chung S. M., Gonzalez A. H., Clowe D., Markevitch M., Zaritsky D., 2010, ApJ, 725, 1536
- Cohen et al. (2014) Cohen S. A., Hickox R. C., Wegner G. A., Einasto M., Vennik J., 2014, ApJ, 783, 136
- Cohen et al. (2015) Cohen S. A., Hickox R. C., Wegner G. A., 2015, ApJ, 806, 85
- Coleman et al. (1980) Coleman G. D., Wu C.-C., Weedman D. W., 1980, ApJS, 43, 393
- Condon (1992) Condon J. J., 1992, ARA&A, 30, 575
- Condon et al. (1991) Condon J. J., Anderson M. L., Helou G., 1991, ApJ, 376, 95
- Condon et al. (2002) Condon J. J., Cotton W. D., Broderick J. J., 2002, AJ, 124, 675
- Darvish et al. (2016) Darvish B., Mobasher B., Sobral D., Rettura A., Scoville N., Faisst A., Capak P., 2016, ApJ, 825, 113
- Dey et al. (2019) Dey A., et al., 2019, AJ, 157, 168
- Ebeling & Kalita (2019) Ebeling H., Kalita B. S., 2019, The Astrophysical Journal, 882, 127
- Elbaz et al. (2011) Elbaz D., et al., 2011, A&A, 533, A119
- Evans et al. (2019) Evans I. N., et al., 2019, in AAS/High Energy Astrophysics Division. p. 114.01
- Farouki & Shapiro (1981) Farouki R., Shapiro S. L., 1981, ApJ, 243, 32
- Flaugher et al. (2015) Flaugher B., et al., 2015, The Astronomical Journal, 150, 150
- Foëx et al. (2017) Foëx G., Chon G., Böhringer H., 2017, A&A, 601, A145
- Gómez et al. (2003) Gómez P. L., et al., 2003, ApJ, 584, 210
- Goto (2004) Goto T., 2004, Monthly Notices of the Royal Astronomical Society: Letters, 356, L6
- Gunn & Gott (1972) Gunn J. E., Gott J. Richard I., 1972, ApJ, 176, 1
- Hahn et al. (2015) Hahn C., et al., 2015, The Astrophysical Journal, 806, 162
- Haines et al. (2007) Haines C. P., Gargiulo A., La Barbera F., Mercurio A., Merluzzi P., Busarello G., 2007, Monthly Notices of the Royal Astronomical Society, 381, 7–32
- Haines et al. (2013) Haines C. P., et al., 2013, The Astrophysical Journal, 775, 126
- Haines et al. (2015) Haines C. P., et al., 2015, The Astrophysical Journal, 806, 101
- Haines et al. (2017) Haines C. P., et al., 2017, Astronomy & Astrophysics, 605, A4
- Helou et al. (1985) Helou G., Soifer B. T., Rowan-Robinson M., 1985, ApJ, 298, L7
- Hilton et al. (2018) Hilton M., et al., 2018, ApJS, 235, 20
- Hilton et al. (2021) Hilton M., et al., 2021, The Astrophysical Journal Supplement Series, 253, 3
- Ilbert et al. (2009) Ilbert O., et al., 2009, ApJ, 690, 1236
- Jonas & MeerKAT Team (2016) Jonas J., MeerKAT Team 2016, in MeerKAT Science: On the Pathway to the SKA. p. 1
- Kale et al. (2015) Kale R., Venturi T., Cassano R., Giacintucci S., Bardelli S., Dallacasa D., Zucca E., 2015, A&A, 581, A23
- Karim et al. (2011) Karim A., et al., 2011, The Astrophysical Journal, 730, 61
- Katsianis et al. (2016) Katsianis A., Tescari E., Wyithe J. S. B., 2016, Publications of the Astronomical Society of Australia, 33
- Kennicutt (1998) Kennicutt Robert C. J., 1998, ApJ, 498, 541
- Kennicutt & Evans (2012) Kennicutt R. C., Evans N. J., 2012, Annual Review of Astronomy and Astrophysics, 50, 531–608
- Knowles et al. (2021) Knowles K., et al., 2021, MNRAS, 504, 1749
- Knowles et al. (2022) Knowles K., et al., 2022, A&A, 657, A56
- Kodama et al. (2004) Kodama T., et al., 2004, MNRAS, 350, 1005
- Koyama et al. (2013) Koyama Y., et al., 2013, Monthly Notices of the Royal Astronomical Society, 434, 423
- Kroupa (2002) Kroupa P., 2002, Science, 295, 82
- Larson et al. (1980) Larson R. B., Tinsley B. M., Caldwell C. N., 1980, ApJ, 237, 692
- Lewis et al. (2002) Lewis I., et al., 2002, Monthly Notices of the Royal Astronomical Society, 334, 673–683
- Lilly et al. (1996) Lilly S. J., Fèvre O. L., Hammer F., Crampton D., 1996, The Astrophysical Journal, 460
- Lindner et al. (2014) Lindner R. R., et al., 2014, The Astrophysical Journal, 786, 49
- Lovisari et al. (2017) Lovisari L., et al., 2017, ApJ, 846, 51
- Ma et al. (2010) Ma C. J., Ebeling H., Marshall P., Schrabback T., 2010, MNRAS, 406, 121
- Madau & Dickinson (2014) Madau P., Dickinson M., 2014, ARA&A, 52, 415
- Mahler et al. (2018) Mahler G., et al., 2018, MNRAS, 473, 663
- Maier et al. (2022) Maier C., Haines C. P., Ziegler B. L., 2022, A&A, 658, A190
- Mancone et al. (2010) Mancone C. L., Gonzalez A. H., Brodwin M., Stanford S. A., Eisenhardt P. R. M., Stern D., Jones C., 2010, ApJ, 720, 284
- Mansheim et al. (2017) Mansheim A. S., et al., 2017, MNRAS, 469, L20
- Mauch & Sadler (2007) Mauch T., Sadler E. M., 2007, MNRAS, 375, 931
- Mercurio et al. (2021) Mercurio A., et al., 2021, A&A, 656, A147
- Mohan & Rafferty (2015) Mohan N., Rafferty D., 2015, PyBDSF: Python Blob Detection and Source Finder (ascl:1502.007)
- Moore et al. (1996) Moore B., Katz N., Lake G., Dressler A., Oemler A., 1996, Nature, 379, 613
- Ogrean et al. (2013) Ogrean G. A., Brüggen M., van Weeren R. J., Röttgering H., Croston J. H., Hoeft M., 2013, MNRAS, 433, 812
- Owen et al. (2005) Owen F. N., Ledlow M. J., Keel W. C., Wang Q. D., Morrison G. E., 2005, AJ, 129, 31
- Owers et al. (2011) Owers M. S., Randall S. W., Nulsen P. E. J., Couch W. J., David L. P., Kempner J. C., 2011, ApJ, 728, 27
- Parekh et al. (2017) Parekh V., Durret F., Padmanabh P., Pandge M. B., 2017, MNRAS, 470, 3742
- Pelló et al. (2009) Pelló R., et al., 2009, A&A, 508, 1173
- Peng et al. (2010) Peng Y.-j., et al., 2010, ApJ, 721, 193
- Piffaretti et al. (2011) Piffaretti R., Arnaud M., Pratt G. W., Pointecouteau E., Melin J. B., 2011, A&A, 534, A109
- Pillay et al. (2021) Pillay D. S., et al., 2021, Galaxies, 9, 97
- Planck Collaboration et al. (2016) Planck Collaboration et al., 2016, A&A, 594, A27
- Popesso et al. (2006) Popesso P., Biviano A., Romaniello M., Böhringer H., 2006, A&A, 461, 411
- Popesso et al. (2012) Popesso P., et al., 2012, A&A, 537, A58
- Sadler et al. (2002) Sadler E. M., et al., 2002, MNRAS, 329, 227
- Salvato et al. (2011) Salvato M., et al., 2011, ApJ, 742, 61
- Schreiber et al. (2015) Schreiber C., et al., 2015, A&A, 575, A74
- Silva et al. (2016) Silva D. R., et al., 2016, in American Astronomical Society Meeting Abstracts #228. p. 317.02
- Sobral et al. (2014) Sobral D., Best P. N., Smail I., Mobasher B., Stott J., Nisbet D., 2014, MNRAS, 437, 3516
- Speagle et al. (2014) Speagle J. S., Steinhardt C. L., Capak P. L., Silverman J. D., 2014, ApJS, 214, 15
- Stern et al. (2012) Stern D., et al., 2012, The Astrophysical Journal, 753, 30
- Stroe & Sobral (2021) Stroe A., Sobral D., 2021, ApJ, 912, 55
- Stroe et al. (2017) Stroe A., Sobral D., Paulino-Afonso A., Alegre L., Calhau J., Santos S., van Weeren R., 2017, MNRAS, 465, 2916
- Taylor et al. (2015) Taylor E. N., et al., 2015, MNRAS, 446, 2144
- Webb et al. (2013) Webb T. M. A., et al., 2013, AJ, 146, 84
- Webb et al. (2020) Webb N. A., et al., 2020, A&A, 641, A136
- Wittman (2019) Wittman D., 2019, ApJ, 881, 121
- Wright et al. (2010) Wright E. L., et al., 2010, AJ, 140, 1868
- Yoon & Im (2020) Yoon Y., Im M., 2020, ApJ, 893, 117
- Yun et al. (2001) Yun M. S., Reddy N. A., Condon J. J., 2001, ApJ, 554, 803
- Zou et al. (2017) Zou H., et al., 2017, Publications of the Astronomical Society of the Pacific, 129, 064101
- van Weeren et al. (2016) van Weeren R. J., et al., 2016, The Astrophysical Journal, 818, 204
- van Weeren et al. (2019) van Weeren R. J., de Gasperin F., Akamatsu H., Brüggen M., Feretti L., Kang H., Stroe A., Zandanel F., 2019, Space Sci. Rev., 215, 16
Appendix A Legacy Surveys images
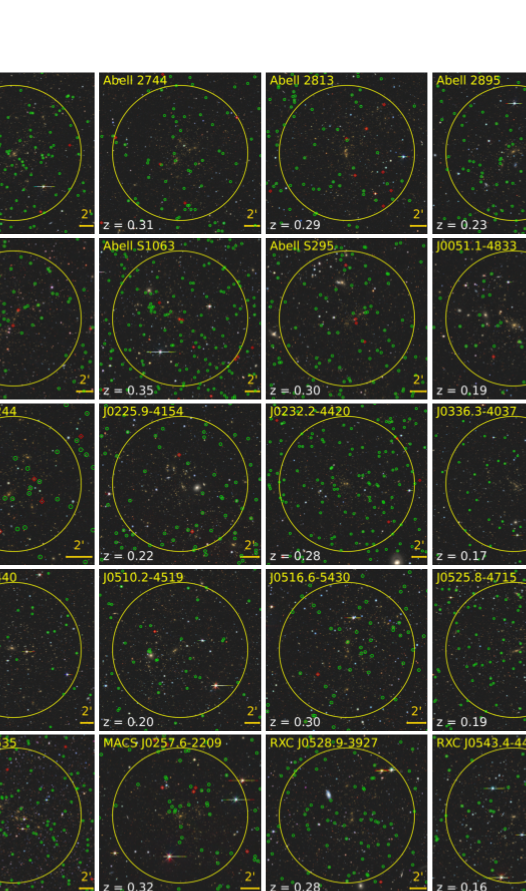
Here we present Legacy Surveys DR9 images for our cluster sample and the identified radio-loud galaxies within . See discussion in Section 2.
Figure 9 shows the Legacy Surveys DR9 images of our cluster sample with the identified MeerKAT-detected cluster members.