\Receivedreception date \Acceptedacception date \Publishedpublication date
galaxies: Seyfert; galaxies: active; galaxies: nuclei; galaxies: individual (NGC 1068); galaxies: kinematics and dynamics; masers
High-sensitivity VLBI Observations of the Water Masers in the Seyfert Galaxy NGC 1068
Abstract
We present observational results of water vapor maser emission with our high-sensitivity 22 GHz VLBI imaging of the Seyfert galaxy NGC 1068. In this galaxy, there are the following four nuclear radio sources; NE, C, S1, and S2. Among them, the S1 component has been identified as the nucleus while the C component has been considered as attributed to the radio jet. In our VLBI observation, we find the following two types of the water maser emission at the S1 component. One is the linearly aligned component that is considered as an edge-on disk with the inner radius of 0.62 pc. The dynamical mass enclosed within the inner radius was estimated to be by assuming the circular Keplerian motion. Note, however, that the best fit rotation curve shows a sub-Keplerian rotation (). The other is the water maser emission distributed around the rotating disk component up to 1.5 pc from the S1 component, suggesting the bipolar outflow from the S1 component. Further, we detected the water maser emission in the C component for the first time with VLBI, and discovered a ring-like distribution of the water maser emission. It is known that a molecular cloud is associated with the C component (both HCN and HCO+ emission lines are detected by ALMA). Therefore, the ring-like maser emission can be explained by the jet collision to the molecular cloud. However, if these ring-like water masing clouds constitute a rotating ring around the C component, it is likely that the C component also has a supermassive black hole with the mass of that could be supplied from a past minor merger of a nucleated satellite galaxy.
1 Introduction
Some active galactic nuclei (AGNs) emit a large amount of radiation as well as jet phenomena, that are considered to be driven by the gas accretion onto the nucleus of galaxies (e.g., Rees 1984). It is now widely accepted that the nucleus of galaxies harbors a SMBH with a mass of millions of the solar mass or more (e.g., Magorrian et al. 1998, Kormendy & Ho 2013, Genzel 2014). The existence of such a SMBH has been proved by observations of the water maser emission exhibiting a compact disk in a Keplerian rotation around a SMBH (e.g., Nakai et al. 1993, Miyoshi et al. 1995, Moran et al. 1995). Therefore, thanks to very high-resolution imaging with VLBI, water maser emission provides a good probe to directly investigate the structure and dynamics of AGNs on a parsec or a sub-parsec scale.
NGC 1068 is one of the archetypical AGN-hosting galaxies. The systemic velocity of the galaxy is about km s-1 (Brinks et al. 1997, Gallimore et al. 2001). This galaxy has a compact nuclear radio jet consisting of four components called as S1, S2, C, and NE. Among them, the S1 component has been identified as a real nucleus that has a SMBH with mass of (Greenhill et al. 1996; Kormendy & Ho 2013). The evidence of the SMBH has been obtained from the compact water maser emitting region at 22 GHz around the S1 component that was identified as a molecular torus surrounding the SMBH at the center of NGC 1068 (Greenhill et al. 1996, Greenhill & Gwinn 1997, Gallimore et al. 1997). Recent ALMA observations also confirmed the presence of the rotating dusty torus at the nucleus (Garcia-Burillo et al. 2016, Gallimore et al. 2016, Imanishi et al. 2016, 2018, Impellizzeri et al. 2019). However, another water maser emitting region has been also found in the radio jet component C with VLA (Gallimore et al. 1996a, 2001). Since the possible masing mechanism in this component is kinematical collisional pumping by the jet from the S1 component (e.g., Gallimore 1996a, Gallimore 1996b), this masing region has been called as the jet maser.
In this paper, we show our new results of the VLBI imaging of the water maser emission at the components S1 and C in NGC 1068 by using high-sensitivity array consisting of VLBA, phased-VLA, and Effelsberg 100-m telescope.
Throughout this paper, we use a distance of NGC 1068, 15.9 Mpc (Kormendy & Ho 2013). The adopted basic parameters of NGC 1068 are summarized in table 1. All the Velocities used here are in the radio definition and with respect to the Local Standard of Rest (LSR).
2 Observations and Data Reduction
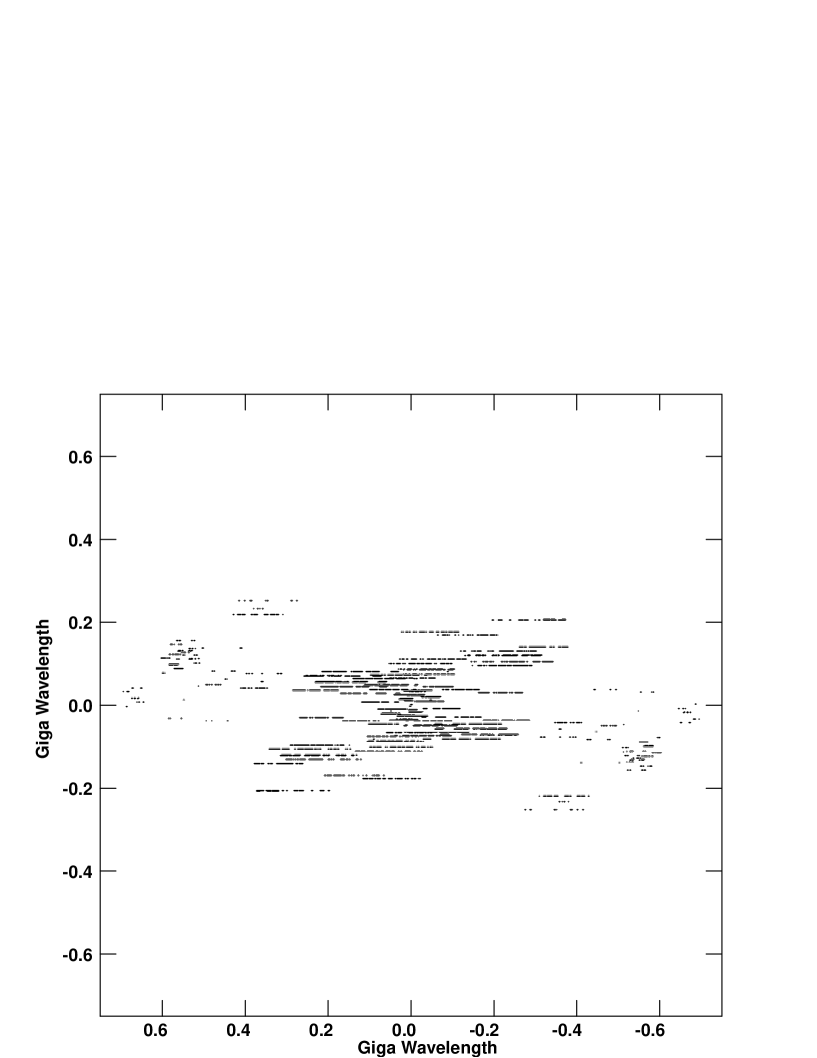
The observations of water masers emission ( transition at 22.23508 GHz) of NGC 1068 reported here were made on 2000 February 23-24 using the Very Long Baseline Array (VLBA), the phased Very Large Array (VLA) of the National Radio Astronomy Observatory (NRAO), and the Effelsberg 100-m telescope at Bonn (PI: Greenhill, L. ). The coverage is shown in figure 1. Eight IFs were recorded, each with a bandwidth of 8 MHz, divided into 512 channels (0.2 km s-1 velocity resolution). The range of the LSR velocities was between km s-1 , covering systemic and high-velocity maser features (Claussen et al. 1984, Claussen & Lo 1986, Nakai et al. 1995, Greenhill et al. 1996, Greenhill & Gwinn 1997).
The data were processed on the VLBA correlator at the NRAO. We used the observation coordinate of (, )J2000 = (2h 42m 40.70905s, 0∘ 0’ 47.945”) as the phase tracking center. The correlated data were downloaded from the data archive system of the NRAO. The data reduction including both calibration and imaging were processed using the Astronomical Image Processing System (AIPS) package. Unfortunately, the data of the Mauna Kea station (MK) were removed from our analysis because of the low data quality due to bad weather conditions. The bandpass response was calibrated by observing 0133+476, and the residual delays and fringe rates were estimated using point-like sources 0237027 and 0234+285. The amplitude calibration was performed on the basis of the amplitude fluctuation of the point-sources 0133+476 and 0528+134 whose flux densities were set to be 1.5 and 1.9 Jy, respectively. The self calibration was applied using the strongest maser spot at = 1174 km s-1 as a reference (IF 2). The obtained water maser spectrum of NGC 1068 is shown in figure 2. The total isotropic luminosity of the maser features was 50 .
The imaging was performed with the CLEAN method. For all the detected maser spots, CLEAN maps were made using an intermediate weighting between natural and uniform weighting. The maser spots were imaged by averaging 10 channels (2 km s-1 ). The synthesized beam was 1.3 mas 1.0 mas and PA= deg. The positions and intensity of the maser spots in each spectral channel were measured by using a POPS pipeline script. Brightness peaks higher than 4 noise level (5 mJy/beam) through continuous two channels at least were identified as maser spots automatically and their parameters as Gaussian brightness components were extracted.
3 Results and Discussion
3.1 The Observed Maser Features
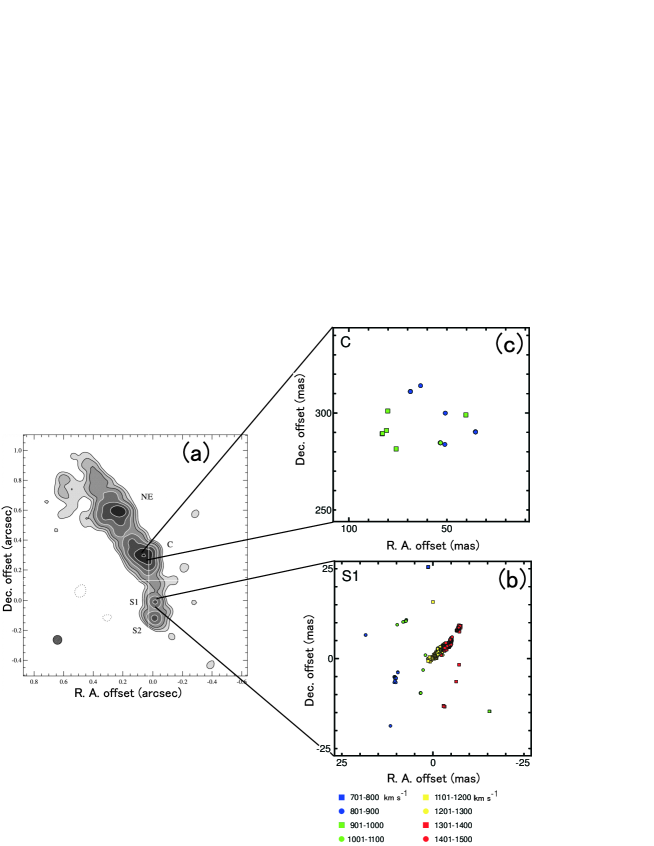
Figure 3(a) shows the distribution of the masers at the components S1 and C, together with the continuum map at 5 GHz obtained with MERLIN (Gallimore et al. 2004), at the coordinate system relative to the position of the maser spot near the systemic velocity of NGC 1068, km s-1 . The typical position errors were estimated from , where is the fitting error of 2-dimensional Gaussian fit and . No significant maser emission stronger than 4- (5 mJy/beam) was detected out of the region of the S1 and C components in figure 3. The position and the velocity of the detected maser spots are shown in table 2 (The full table is available online).
The systemic, red- and blue-shifted maser spots were located at the S1 component, which is thought to be the nucleus of the galaxy (figure 3(b)). It is clear that the maser spots linearly extended from north-west to south-east, indicating the presence of the disk, with a position angle , which differs from the galactic disk of NGC 1068 by (table 1). Other spots off the linear extensions distribute along the jet direction. The maser spots with velocities around 900 km s-1 were also found at the C component, which is thought to be the knot in the jet (figure 3(c)), showing a ring-like distribution pattern.
3.2 The S1 Component
3.2.1 Rotating disk
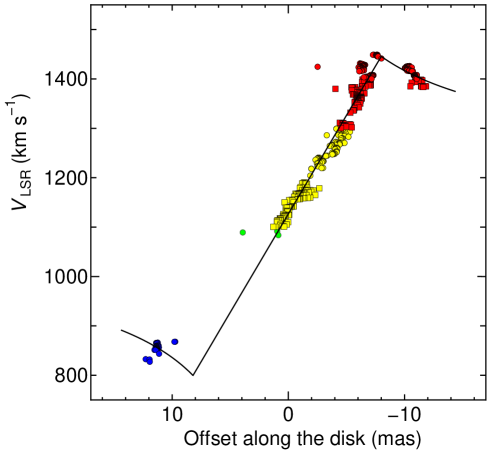
The linear distribution of the maser spots in the S1 component is well described by a thin and edge-on disk, already shown by Greenhill et al (1996) and Greenhill & Gwinn (1997). Figure 4 shows a position-velocity diagram of these maser spots. The impact parameter is measured with respect to the strongest spot at km s-1 . Assuming a circular rotating disk, we fitted the diagram to a linear rotation curve of for , and a Keplerian curve of for , where is the rotation velocity, is the distance from the center, is the inner radius, and is the outer radius of the maser disk. The fitting curve is also shown in figure 4, and we obtained the best fitting parameters of the central mass and disk based on the fitting results (table 3). The mass inside the radius of the rotating disk (=0.62 pc) is estimated to be , which is similar to the previous results (Gallimore et al. 1996a, Greenhill & Gwinn 1997). Greenhill et al. (1996) indicated a sub-Keplerian curve () of the masers in the outer portion of the disk (red-shifted component). In our data, at , actually the best fit rotation curve is . The sub-Keplerian disk strongly indicate the effect of the self-gravity of the torus or circumnuclear stellar mass (Greenhill et al. 1996). Actually Huré (2002) explained the sub-Keplerian rotation curve by the black hole mass of (1.20.1) and the disk mass of (9.41.6) for the distance of 15 Mpc they adopted. Further analysis based on our high sensitive data will be made in our forthcoming paper.
3.2.2 Outflow
In addition to the disk component, many weak maser spots can be found off the maser disk, within 20 mas (1.5 pc) from the central engine, lying close to the axis of the disk rotation (figures 3(b) and 5 (a)). These spots have not been detected in the previous observations. Greenhill et al. (2003) found the maser spots having similar properties at the Circinus Galaxy, and they inferred that they are associated with a wide-angle bipolar outflow. In figure 5(a), most of maser spots at the north side are blue-shifted, indicating the approaching outflow, and those at the south are red-shifted, indicating the counter outflow.
We show the schematic view in figure 5 (b). Most of these maser spots exhibiting blue-shifted are thought to be at the front of the outflow cones of continuum emission, and are amplified by the continuum radiation from the jets. The velocity difference between the bluest maser at the northern outflow and the reddest maser at the southern outflow is almost 600 km s-1 , indicating the apparent outflow speed of 300 km s-1 in the line of sight. This is slightly smaller than the molecular outflow speed of 450 km s-1 suggested from the blue wing in the HCN absorption feature (Impellizzeri et al. 2019).
Gallimore et al. (2016) found that velocity distribution of CO emission in the nucleus of NGC 1068 is consistent with the bipolar outflow with the speed of 400 km s-1 in the direction nearly perpendicular to the maser disk. The position of the blue-shifted peak is displaced 1.2 pc northwest of the red-shifted peak. These properties found with CO observations are in good agreement with those in our VLBI observations. This fact indicated that the extended maser features in the S1 component are likely to exhibit the detailed structure of the wide-angle bipolar outflow on the sub-parsec scale.
3.3 The C Component
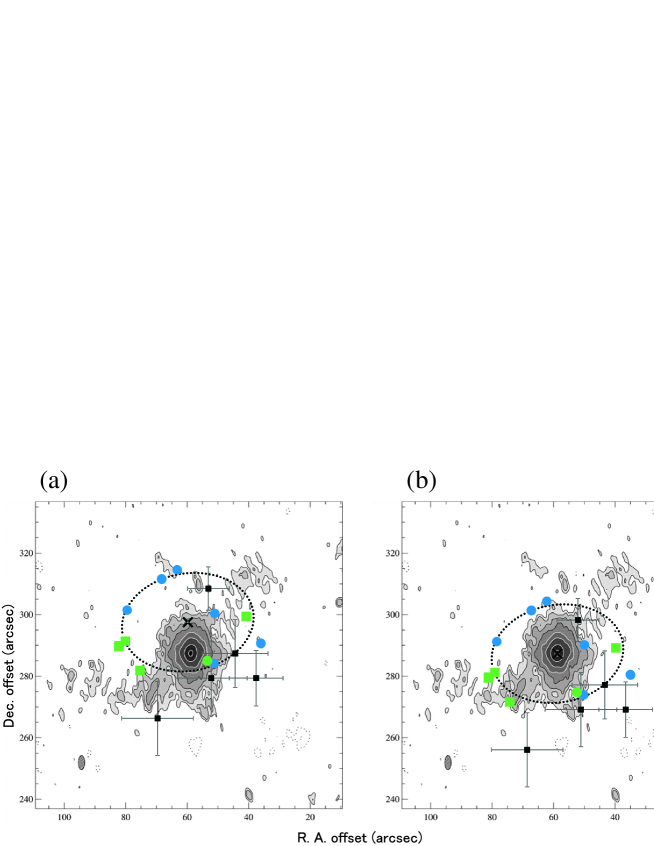
Figure 3(c) shows the ring-like distribution of the maser spots at the C component. Assuming that the maser spots around the C component distribute elliptically, we fitted them by a single ellipse. We summarized the fitted parameters in table 4. Some of the maser spots at the C component has been detected also with the VLA (Gallimore et al. 1996a), and are shown as the filled square in figure 6.
Figure 6 (a) shows an overlay of the maser emission on the continuum map at 5 GHz. The center of the water maser distribution (cross) differs from the peak of the continuum emission by 12 mas (0.92 pc). The relative position between the distributions of the maser and continuum emission, however, may incorrect, because the adopted origins of the coordinate of the two emission at S1 are different (the maser spot at km s-1 in the maser disk and the continuum peak in the ionized disk [Gallimore et al. 1997]). Thus we tried to shift the map of maser emission by 12 mas, so that the maser center coincides with the continuum peak. Figure 6 (b) shows the result, by which the maser spots look to surround the continuum emission.
3.3.1 Kinematics of the masers
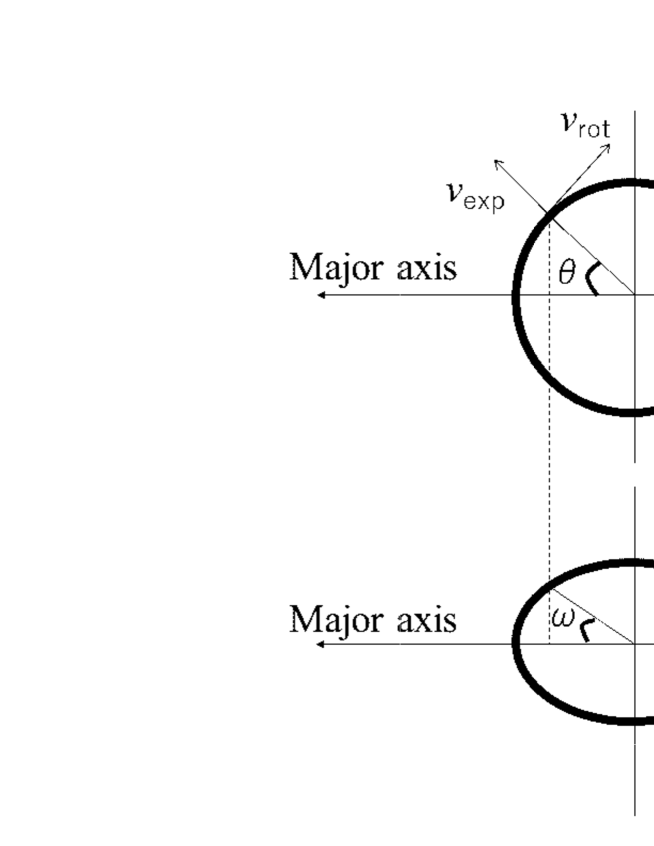
Figure 7 presents a position-velocity diagram cut along the major axis of the fitted ellipse shown in figure 6. We are hard to find some systematic tendency such as rotation and expansion from the very limited data in the position-velocity diagram. Then we introduced a position angle (PA) -velocity diagram along a fitted ellipse, adopting a simple model with a single ring which is rotating and expanding (or contracting) with constant speeds, and , respectively (figure 8). We examined the radial velocity variation with the angle along the ellipse, , which can be written as , where is the PA along a putative ring in the face-on view, and is the viewing angle of the ring. We used estimated from the ellipticity of the fitted ellipse. The observed radial velocity as a function of can be expressed as,
| (1) |
where is the systemic velocity of the ring. Figure 9 shows the best fitting result by using equation (1). The obtained parameters are km s-1 , km s-1 , and km s-1 , as shown by the solid line in figure 9. We also carried out fitting with other cases, considering only expansion or rotation, i.e., or , respectively, and also show the results in figure 9 by the dotted and dashed lines, respectively. While the rotation-only model is clearly not suitable for explaining the observational result, the expansion-only model is almost equivalent with the best fitted result by equation (1). These results are not enough significant, i.e., the obtained reduced lies between 5 8 for the all cases, by adopting the error of the velocity of 2 km s-1 . However, it possibly imply that the expansion motion seems to more dominate the kinematics of the masers at the C component than the rotation motion.
3.3.2 The possible interpretation, jet collision or disk?
Gallimore et al. (1996b, 2001) suggested that the jet masers at the C component indicate the presence of dense and warm molecular gas which lies on the radio jet emanating from the central engine at the S1 component. Gallimore et al. (2004) also discussed the jet-shocked model based on the free-free opacity estimated from the spectrum energy distribution of the C component.
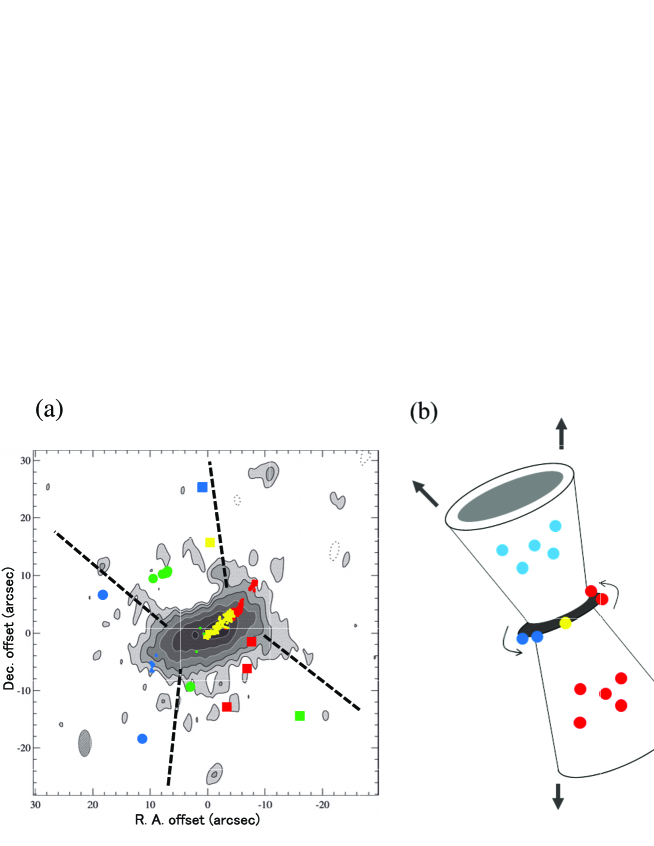
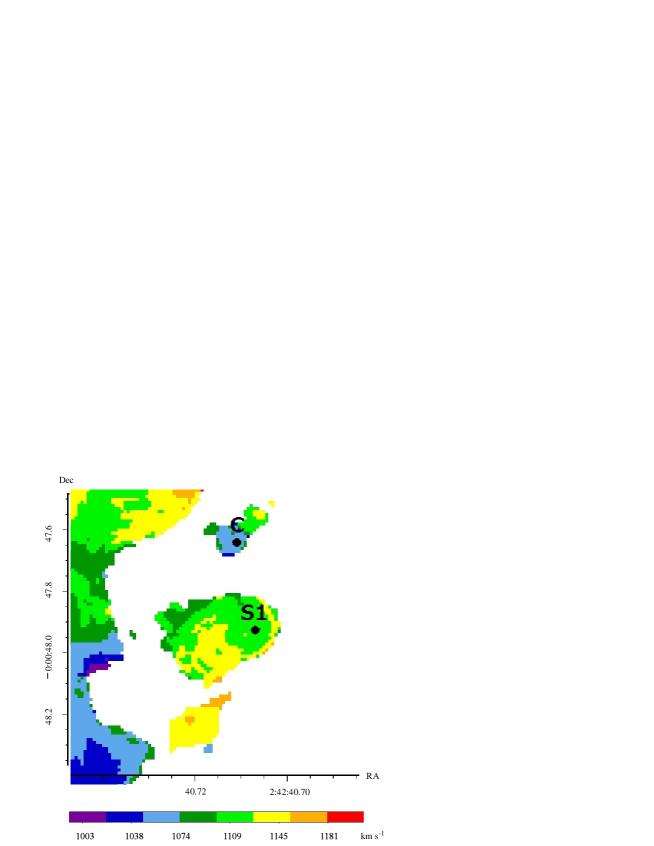
Recent ALMA observations of NGC 1068 showed that high-density molecular gas tracers HCN and HCO+ gases almost coincide to the C component (Imanishi et al. 2016, 2018). Figure 10 shows the positional relationship between the molecular gas and the S1 and C components. The radial velocity of HCN and HCO+ at the C component is 1060 and 1080 km s-1 in the radio definition, respectively. The averaged velocity of the water maser at the C component is km s-1 , showing that velocities of HCN and HCO+ are faster than the maser velocity by km s-1 .
Considering the presence of the molecular cloud on the jet shown by the ALMA observations, we can interpret that the radio jet collides with the molecular cloud, then the shock wave due to the jet collision induced an ionized region in the molecular cloud. At the circumstance of the expanding ionized sphere, the water masers could be excited by the shock collisional pumping. Such a jet collision picture has also been proposed in the jet of the Seyfert NGC 3079, exhibited by the result of the evolution of the knot in the jet (Middelberg et al. 2007).
On the other hand, the ring-like distribution of the maser spots in figure 3 (c) admits of another interpretation, a face-on disk. In this picture, the C component itself would be an AGN, i.e., a SMBH, because a megamaser exists only in an AGN, implying that NGC 1068 has a binary of SMBH. This is not curious because NGC 1068 shows several lines of evidence for a past minor merger event several billion years ago (see Tanaka et al. 2017 and references therein). If the merging satellite galaxy has a SMBH at its center, one may observe a binary of SMBHs in the final phase of the merger (e.g., Begelman et al. 1986).
Such a face-on maser disk is needed to be geometrically thick, because the path length should be long enough to amplify the maser emission effectively. Although generally the disk maser emission is likely to be amplified along the limb of the disk, e.g., NGC 4258 (Miyoshi et al. 1995), a relatively thick disk around the SMBH has been seen in the maser disks such as the Seyfert NGC 3079 (e.g., Yamauchi et al. 2004, Kondratko et al. 2005) and IC 1481 (Mamyoda et al. 2009).
If the C component really has a secondary SMBH of NGC 1068, HCN and HCO+ emission found by ALMA might be the secondary dusty molecular torus. It is interesting that a pair of compact jet-like feature is emanated from the component C toward NW and SE directions in the VLBA 5 GHz image (Gallimore et al. 2004, see also figure 6); each of the compact jet-like feature has a projected length of 30 mas, corresponding to 2.3 pc. The origin of the molecular cloud at the C component is a very important problem to be solved by further multi frequency studies.
If the SMBH hypothesis is correct, the enclosed mass in the ring can be estimated to be by adopting the rotation speed of 45 km s-1 from the ring radius of 2 pc. In order to confirm whether or not the component C really has a SMBH, we need to detect more maser spots at the C component and clarify their motion, and estimate the mass containing in the molecular cloud by using the gas kinematics.
4 Conclusion
We imaged the water maser emission at 22 GHz at the nuclear radio component S1 and the jet component C in the Seyfert galaxy NGC 1068 with the high sensitive VLBI observations. The main results are summarized as follows.
1. At the S1 component, the water maser spots align with a maser disk. The dynamical mass enclosed within a radius of 0.62 pc is estimated t o be . This is consistent with those obtained with the previous VLBA observations (Gallimore et al. 1996a, Greenhill et al. 1996). The best fit rotation curve showed sub-Keplerian, , indicating the self-gravity of the molecular disk needed to be considered.
2. In addition to the maser disk, the distribution of the blue- and red-shifted components of the water maser spots perpendicular to the disk was detected, suggesting the presence of a wide-angle outflow of the water maser extending to 1.5 pc and having the speed of km s-1 .
3. At the C component, the ring-like distribution of the maser spots was detected for the first time. The diameter of the ring is about 22 mas (1.7 pc). These masers might expand or contract with the speed of km s-1 .
4. Since the C component well coincides with the HCN and HCO+ molecular cloud found with ALMA, the ring-like structure can be considered to be caused by the jet collision to the molecular cloud which has been proposed by Gallimore et al. (1996b, 2001).
5. Another possible explanation is the face-on disk at the C component. This might suggest the C component has a SMBH, implying the presence of a binary SMBH in NGC 1068. This idea seems reasonable because NGC 1068 shows several lines of evidence for a past minor merger event (Tanaka et al. 2017).
We would like to thank the anonymous referees, who gave us many useful comments that improved the paper very much. We would like to thank Drs. Hiroshi Imai, Satoko Sawada-Sato, Yoshiaki Hagiwara, and Akihiro Doi for their kind supports to data reduction, imaging, and interpretation of VLBI data. We also grateful to Dr. Masatoshi Imanishi for providing the ALMA image of NGC 1068. We gratefully acknowledge the staff at the NRAO VLBA for their invaluable help both in providing online archive and in data reduction.
References
- [Begelman et al.(1980)] Begelman, M. C., Blandford, R. D., & Rees, M. J. 1980, Nature, 287, 307. doi:10.1038/287307a0
- [Brinks et al.(1997)] Brinks, E., Skillman, E. D., Terlevich, R. J., et al. 1997, Ap&SS, 248, 23
- [Claussen & Lo(1986)] Claussen, M. & Lo, K. Y. 1986, Masers, Molecules, and Mass Outflows in Star Formation Regions, 263
- [Claussen et al.(1984)] Claussen, M. J., Heiligman, G. M., & Lo, K. Y. 1984, Nature, 310, 298. doi:10.1038/310298a0
- [Gallimore et al.(1996a)] Gallimore, J. F., Baum, S. A., O’Dea, C. P., et al. 1996a, ApJ, 462, 740
- [Gallimore et al.(1996b)] Gallimore, J. F., Baum, S. A., & O’Dea, C. P. 1996b, ApJ, 464, 198
- [Gallimore et al.(1997)] Gallimore, J. F., Baum, S. A., & O’Dea, C. P. 1997, Ap&SS, 248, 253
- [Gallimore et al.(2001)] Gallimore, J. F., Henkel, C., Baum, S. A., et al. 2001, ApJ, 556, 694
- [Gallimore et al.(2004)] Gallimore, J. F., Baum, S. A., & O’Dea, C. P. 2004, ApJ, 613, 794
- [Gallimore et al.(2016)] Gallimore, J. F., Elitzur, M., Maiolino, R., et al. 2016, ApJ, 829, L7
- [García-Burillo et al.(2016)] García-Burillo, S., Combes, F., Ramos Almeida, C., et al. 2016, ApJ, 823, L12
- [Genzel(2014)] Genzel, R. 2014, arXiv e-prints, Proceedings of the 26th Solvay Conference on Physics: ”Astrophysics and Cosmology”, R. Blandford and A. Sevrin, eds., World Scientific
- [Greenhill & Gwinn(1997)] Greenhill, L. J. & Gwinn, C. R. 1997, Ap&SS, 248, 261. doi:10.1023/A:1000554317683
- [Greenhill et al.(1996)] Greenhill, L. J., Gwinn, C. R., Antonucci, R., et al. 1996, ApJ, 472, L21
- [Greenhill et al.(2003)] Greenhill, L. J., Booth, R. S., Ellingsen, S. P., et al. 2003, ApJ, 590, 162
- [Huré(2002)] Huré, J.-M. 2002, A&A, 395, L21. doi:10.1051/0004-6361:20021445
- [Imanishi et al.(2016)] Imanishi, M., Nakanishi, K., & Izumi, T. 2016, ApJ, 822, L10
- [Imanishi et al.(2018)] Imanishi, M., Nakanishi, K., Izumi, T., et al. 2018, ApJ, 853, L25
- [Impellizzeri et al.(2019)] Impellizzeri, C. M. V., Gallimore, J. F., Baum, S. A., et al. 2019, ApJ, 884, L28. doi:10.3847/2041-8213/ab3c64
- [Kondratko et al.(2005)] Kondratko, P. T., Greenhill, L. J., & Moran, J. M. 2005, ApJ, 618, 618
- [Kormendy & Ho(2013)] Kormendy, J., & Ho, L. C. 2013, ARA&A, 51, 511
- [Magorrian et al.(1998)] Magorrian, J., Tremaine, S., Richstone, D., et al. 1998, AJ, 115, 2285
- [Mamyoda et al.(2009)] Mamyoda, K., Nakai, N., Yamauchi, A. et al. 2009, PASJ, 61, 1143
- [Middelberg et al.(2007)] Middelberg, E., Agudo, I., Roy, A. L., et al. 2007, MNRAS, 377, 731
- [Miyoshi et al.(1995)] Miyoshi, M., Moran, J., Herrnstein, J. et al. 1995, Nature, 373, 127
- [Moran et al.(1995)] Moran, J., Greenhill, L., Herrnstein, J., et al. 1995, Proceedings of the National Academy of Science, 92, 11427. doi:10.1073/pnas.92.25.11427
- [Nakai et al.(1995)] Nakai, N., Inoue, M., Miyazawa, K., et al. 1995, PASJ, 47, 771
- [Nakai et al.(1993)] Nakai, N., Inoue, M., & Miyoshi, M. 1993, Nature, 361, 45. doi:10.1038/361045a0
- [Rees(1984)] Rees, M. J. 1984, ARA&A, 22, 471
- [Tanaka et al.(2017)] Tanaka, I., Yagi, M., & Taniguchi, Y. 2017, PASJ, 69, 90
- [Yamauchi et al.(2004)] Yamauchi, A., Nakai, N., Sato, N., et al. 2004, PASJ, 56, 605


.
Adopted parameters of NGC 1068.
Phase tracking center
Morphological type††\dagger††\daggerfootnotemark:
(R)SA(rs)b
Distance‡‡\ddagger‡‡\ddaggerfootnotemark:
14 Mpc
Systemic velocity§§\S§§\Sfootnotemark:
1137 km s-1
Inclination angle∥∥\|∥∥\|footnotemark:
Position angle∥∥\|∥∥\|footnotemark:
{tabnote}
††\dagger††\daggerfootnotemark: NED.
‡‡\ddagger‡‡\ddaggerfootnotemark: Tully & Fisher 1988.
§§\S§§\Sfootnotemark: LSR velocity converted from heliocentric velocity by Brinks et al. 1997.
∥∥\|∥∥\|footnotemark: Brinks et al. 1997.
| Velocity | R.A. Offset | Dec. Offset | Peak int. | Flux | |
|---|---|---|---|---|---|
| [kms-1] | [mas] | [mas] | [mJy/beam] | [mJy] | |
| S1: Disk | |||||
| 718.4 | -25.4 0.3 | 8.6 0.3 | 3.8 0.8 | 19.7 4.9 | |
| 719.1 | -24.7 0.1 | -8.3 0.1 | 4.9 0.9 | 4.4 1.4 | |
| 723.7 | -3.8 0.3 | 14.3 0.3 | 3.5 0.8 | 18.8 4.8 | |
| 731.1 | 3.0 0.1 | 23.2 0.1 | 6.7 0.8 | 6.6 1.5 | |
| 735.9 | -3.6 0.1 | -10.9 0.1 | 11.4 0.9 | 22.1 2.5 | |
| [pc] | 0.62 (8.1 mas) |
|---|---|
| [pc] | 0.92 (11.9 mas) |
| [km s-1 ] | 320 |
| [km s-1 ] | 280 |
is the inner radius, is the outer radius, is the inner velocity, is the outer velocity, and is the mass of the SMBH.
| Center Position | |
|---|---|
| R.A. offset [mas] | ( pc) |
| Dec. offset [mas] | ( pc) |
| Major axis [mas] | ( pc) |
| Minor axis [mas] | ( pc) |
| Position angle [deg] |