Late Fusion with Triplet Margin Objective for
Multimodal Ideology Prediction and Analysis
Abstract
Prior work on ideology prediction has largely focused on single modalities, i.e., text or images. In this work, we introduce the task of multimodal ideology prediction, where a model predicts binary or five-point scale ideological leanings, given a text-image pair with political content. We first collect five new large-scale datasets with English documents and images along with their ideological leanings, covering news articles from a wide range of US mainstream media and social media posts from Reddit and Twitter. We conduct in-depth analyses of news articles and reveal differences in image content and usage across the political spectrum. Furthermore, we perform extensive experiments and ablation studies, demonstrating the effectiveness of targeted pretraining objectives on different model components. Our best-performing model, a late-fusion architecture pretrained with a triplet objective over multimodal content, outperforms the state-of-the-art text-only model by almost 4% and a strong multimodal baseline with no pretraining by over 3%.
1 Introduction
In an increasingly divided world rife with misinformation and hyperpartisanship, it is important to understand the perspectives and biases of the creators of the media that we consume. Media bias can manifest in many ways and has been analyzed from a variety of angles: the news may favor one side of a political issue (Card et al., 2015; Mendelsohn et al., 2021), select certain events to report on (McCarthy et al., 1996; Oliver and Maney, 2000; Fan et al., 2019) or even distort or misrepresent facts (Gentzkow and Shapiro, 2006; Entman, 2007).
Identifying a news article’s underlying political slant is the task of ideology prediction, which has focused largely on political texts like news articles and has been tackled with a variety of models, including Bayesian approaches with attention (Kulkarni et al., 2018), graph neural networks (Li and Goldwasser, 2019), and LSTMs and BERT (Baly et al., 2020). However, past work focuses solely on news articles’ text; news articles contain other forms of non-verbal information in which the underlying ideology may be realized.
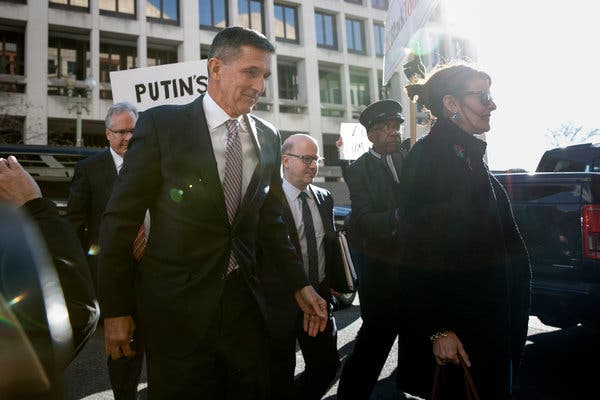

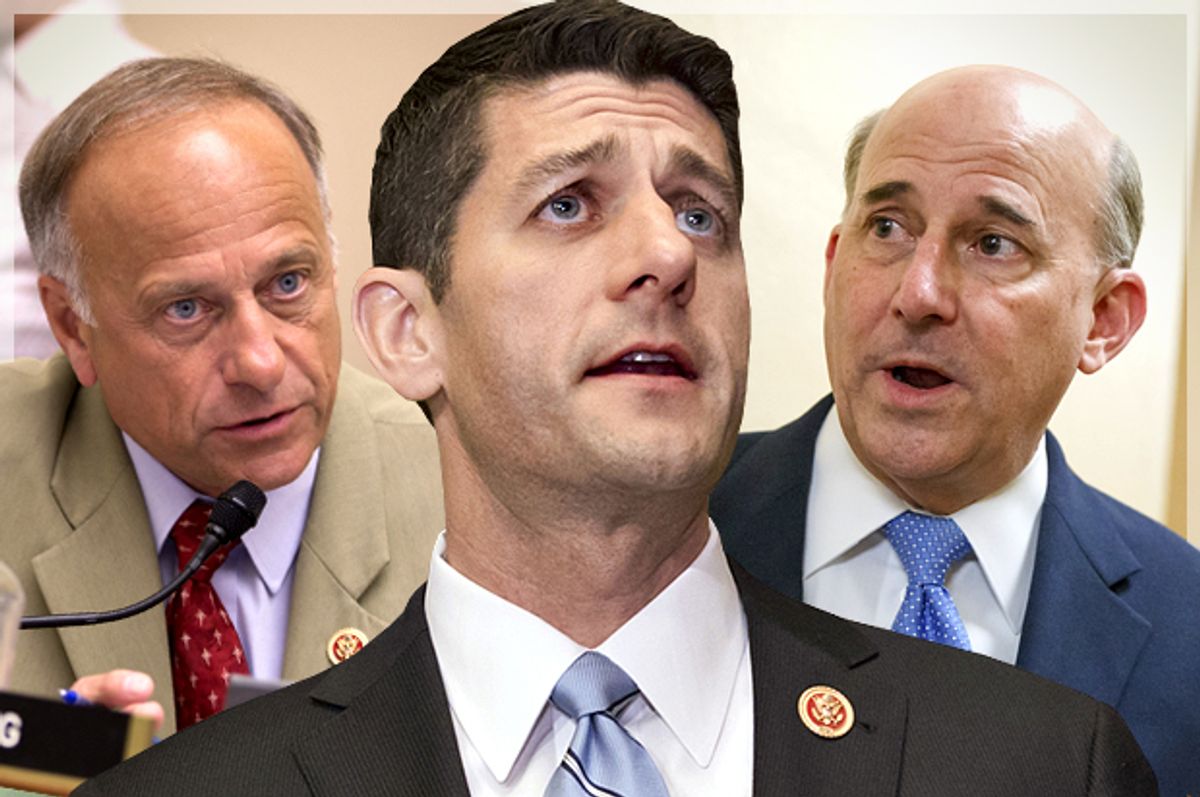
Consider Figure 1a and Figure 1b, two images from articles depicting the same news story, but by news sources with opposing ideologies (New York Times and Fox News, respectively). The underlying ideology of the news source may influence the choice of image: in Figure 1a, Michael Flynn is depicted with a happy expression and surrounded by other figures, while in Figure 1b, Flynn bears a stern expression and is the sole figure. Images are an integral part of news articles: over 56% of articles in AllSides111allsides.com, a website that categorizes media outlets and news articles by political slant. It associates multiple articles with a single story about which these articles were written. include at least one image. Images are often used to frame certain issues or influence the reader’s opinion. For example, liberal websites devote more visual coverage of Donald Trump and also portray Trump with more negative emotions compared with conservative websites (Boxell, 2021). In addition, images of groups of immigrants, in contrast to individual immigrants, tend to decrease survey respondents’ support for immigration (Madrigal and Soroka, 2021). These findings naturally lead us to conduct a study of political images. In Section 3.3, we present a thorough analysis of images, finding, inter alia, that (1) liberal sources tend to include more figures in an image, (2) conservative sources have a higher usage of collage images, and (3) faces are more likely to show negative or neutral emotion rather than positive.
Although modern American politics have centered around two polar opposites (Klein, 2020), 38% of US adults identify as politically independent and do not agree wholly with left or right ideologies.222https://www.pewresearch.org/fact-tank/2019/05/15/facts-about-us-political-independents/ Ideology exists on a spectrum (Bobbio, 1996), and we wish to predict more fine-grained ideology than merely left or right. Thus, we define multimodal ideology prediction in this work as predicting one of five ideological slants (left, lean left, center, lean right, right) given both an article’s text and cover image. To support this new task, we present several new large-coverage datasets of news articles and images across the ideological spectrum from various sources including AllSides, Reddit, Twitter, and 11 independent news sources.
We experiment with several early and late fusion architectures and evaluate several continued pretraining objectives to improve the image and text encoder separately as well as jointly. Our technical contributions include a novel triplet margin loss over multimodal inputs, and the first systematic study on multimodal models for ideology prediction, which reveals several findings: (1) images are indeed helpful for ideology prediction, improving over a text-only model especially on right-leaning images; (2) late-fusion architectures perform better than early-fusion architectures; (3) ideology-driven pretraining on both the text and image encoders is beneficial; (4) fine-tuning with a joint triplet difference loss encourages the model to learn informative representations of ideology. Code and datasets can be found at github.com/launchnlp/mulmodide.
2 Related Work
Media Bias/Ideology on Texts
The study of media bias and ideology has a long history going as far back as White (1950). Computationally, researchers have studied various approaches in classical machine learning as well as neural methods (e.g. Evans et al., 2007; Yu et al., 2008; Sapiro-Gheiler, 2019; Iyyer et al., 2014). However, these works focus solely on text. There exist several resources of news articles across the political spectrum, compiled for the purpose of educating users on media bias (Park et al., 2009, 2011; Hamborg et al., 2017, 333https://adfontesmedia.com,444https://www.allsides.com,555https://mediabiasfactcheck.com). Multimodal studies such as ours need annotated data for training and testing. Thus, we collect several datasets containing both political text and images from various sources.
Media Bias/Ideology on Texts and Images
Only very recently has there been much study on media bias with respect to both text and images. Existing work on characterizing political images has been limited to narrow domains such as Russian trolls on Twitter (Zannettou et al., 2020), political memes (Beskow et al., 2020), and COVID content on TikTok (Southwick et al., 2021). In addition, data containing both text and images annotated for political ideology are not readily available.666Thomas and Kovashka (2019) claims to have released such a dataset, but their link was dead. Their dataset also does not annotate fine-grained ideology. Thus, we collect, annotate, and analyze a variety of new datasets, focusing on political figures in news images. For the tasks of multimodal ideology prediction, one similar work to ours is Thomas and Kovashka (2019), who investigate adding text to help an image encoder train an enhanced representation of images. Afterwards, they ignore the text and focus on ideology prediction from images alone. They consider only left or right ideologies, in contrast to our more fine-grained 5-way set.
3 Data
In this section, we describe several datasets collected in this work for pretraining and finetuning the proposed models.
3.1 Pretraining Datasets
We build two pretraining datasets based on BigNewsBln (Liu et al., 2022a), a corpus of over 1.9M English news articles collected from 11 news sources balanced across the political spectrum.
BN-ImgCap
We first collect a new dataset, BN-ImgCap, of 1.2M images that occur anywhere in a news article,777In contrast to just the cover image. along with their captions, from seven news sources represented in BigNewsBln, chosen to roughly cover equal proportions of left-, center-, and right-leaning ideologies. Details of this collection process are described in Appendix A. We use these image-caption pairs in our experiments for pretraining the image encoder with the InfoNCE loss and bidirectional captioning loss (Section 4.3).
BNA-Img
Liu et al. (2022a) also introduced a subset of BigNewsBln called BigNewsAlign containing articles associated with a story cluster, i.e., news articles from different news sources but written about the same story, for pretraining with an ideological triplet loss. From this subset, we identify articles containing images and crawl these images from each article’s corresponding webpage. We call this dataset of article text and images BNA-Img and use this for pretraining the cross-modal attention with our proposed triplet margin loss (Section 4.3). Table 1 summarizes these datasets.
| Source | Daily Kos | HuffPost | CNN | WaPo | NYTimes | USA Today | AP | The Hill | WashTimes | Fox News | Breitbart |
|---|---|---|---|---|---|---|---|---|---|---|---|
| Ideology | L | L | L | L | L | C | C | C | R | R | R |
| BN-ImgCap | 58k | — | 300k | — | 96k | — | 370k | — | 116k | 41k | 251k |
| BNA-Img | 93k | 221k | 56k | 92k | 94k | 156k | 253k | 318k | 212k | 303k | 184k |
3.2 Evaluation Datasets
AllSides
We extract a dataset of news articles and images from AllSides, which associates stories (e.g., of a particular event) with multiple articles about that story but written by various news sources across a 5-point ideology scale (left, lean-left, center, lean-right, and right). We crawl the AllSides website to obtain (story, article, source) tuples from 2012/06/01–2021/08/31, focusing on articles from the 25 news sources with the most number of articles in AllSides and spanning the complete range of ideology (see Appendix B for the complete list). For each news article, we extract the article text and cover image from each article’s corresponding news source’s website, totaling 5,662 stories containing 12,471 articles.
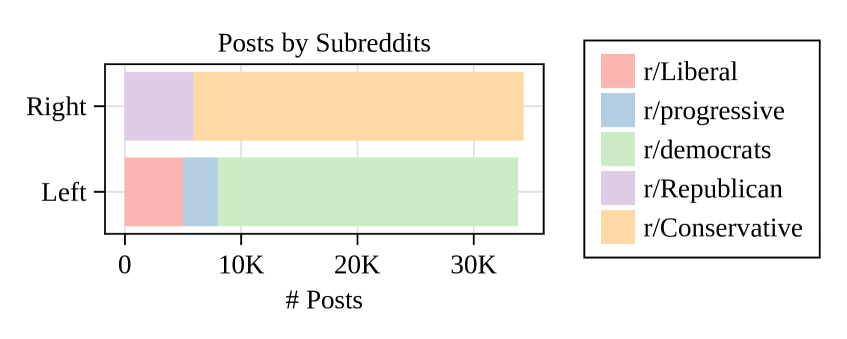
We also collect a dataset of 357k Reddit posts with images from the past 10 years from five subreddits representing both the left-leaning (r/Liberal, r/democrats, r/progressive) and right-leaning (r/Conservative, and r/Republican) political stances, chosen for being among the largest and most active partisan subreddits. For each post, we keep the post title and the image itself, as long as the post was not removed (~2,300 posts). In order to avoid data leakage, we filter out all posts linking to images from the 11 news sources represented in BigNews, resulting in a set of 313k posts. In addition, because the number of posts from right-leaning subreddits overwhelms the number of left-leaning posts, we subsample the right-leaning posts, resulting in a balanced dataset of 65k posts with images, half from each political leaning. The Reddit dataset is summarized in Figure 2. In contrast to news articles, Reddit imposes a 300-character limit on the post title.888We considered using the post’s selftext (i.e. description), but only 101 of our collected posts contained any selftext. The majority of titles are under 100 characters (~20 words). Thus, this dataset and the Twitter data described below provide a good opportunity to examine how our models perform on short texts, compared to the longer-form news articles.
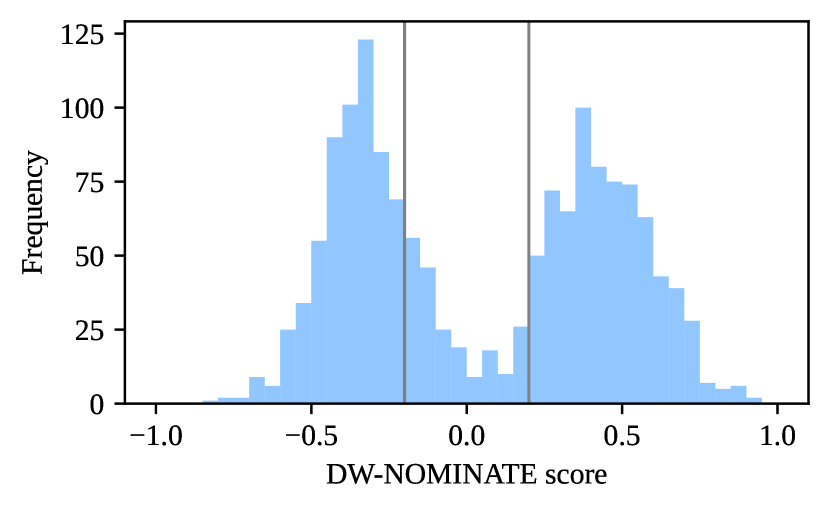
We additionally collect a dataset of 2.1M political tweets from Twitter from the past 10 years using the Twitter Decahose stream, selecting tweets by political figures included in a list of 9,981 US politicians and their Twitter handles (Panda et al., 2020). In contrast to AllSides, Twitter does not explicitly annotate discrete ideologies. Thus, we label tweets with their author’s ideology, identified based on their DW-NOMINATE999The DW-NOMINATE scores are obtained from VoteView.com. dimension (Boche et al., 2018), a measure of a politician’s voting history: a positive number indicates a conservative leaning (e.g. Donald Trump, 0.403), while a negative number indicates a liberal leaning (e.g. Barack Obama, -0.343). We partition politicians into left, center, and right ideologies, containing those whose ideology score is less than -0.2, between -0.2 and 0.2, and above 0.2, respectively. The distribution of these scores is shown in Figure 3. Finally, we discard tweets without images, leaving 57,093 tweets from 1,422 politicians as our final evaluation dataset. More details are summarized in Table 2.
| Ideology | Users | Tweets | Mean | Median | Std |
|---|---|---|---|---|---|
| Left | 523 | 26,362 | 50.4 | 37 | 48.7 |
| Center | 137 | 6,963 | 50.8 | 34 | 54.1 |
| Right | 628 | 23,768 | 37.9 | 25 | 41.6 |
3.3 Characterization and Analysis of Datasets
To motivate different model and pretraining variants described in the next section, we analyze the content of images and text in our newly-collected AllSides dataset using both automatic and manual means.
Automatic Annotation of Images
The majority of images contain political figures; we wish to identify these figures101010Figure, face, and person are synonymous in this work. Faces are used in the facial detection process by DeepFace, but in some cases, faces are not visible and are thus not identifiable. and some salient aspects that may be relevant to predicting the ideology of the article. We employ DeepFace (Taigman et al., 2014), a state-of-the-art facial recognition framework. Given an input image, DeepFace identifies faces and matches them to a set of reference images; we construct a set of 10 reference images for 722 political figures using a combination of entity linking and manual heuristics, detailed in Appendix C. We also employ DeepFace to detect gender (male/female), race (Asian, Black, Indian, Latino, Middle Eastern, or White), and emotion (neutral, angry, fear, sad, disgust, happy, surprise) in AllSides images.111111These categories are those supported by DeepFace, not specifically chosen by us.
Pitfalls of Facial Recognition
While using DeepFace, we encountered a few pitfalls. First, DeepFace is often unable to recognize faces that are small, blurred, or in side profile. This corroborates existing work showing that reduced quality of faces is detrimental to the detection of faces and emotions (Jain and Learned-Miller, 2010; Yang et al., 2016, 2021). Second, we noticed frequent mistakes with a few high-profile figures. For example, DeepFace often classifies Barack Obama and Eric Holder as Hispanic or Middle Eastern, and Donald Trump as Asian, showing that DeepFace can be faulty even for famous people with lots of training images.
Manual Annotation of Images
No facial recognition tool is perfect, and aspects of images that could be relevant for ideology, such as main figures or the presence of certain objects, are not captured by DeepFace. Therefore, we manually annotate 400 random images from AllSides. For each image, we identify the number of people in the image (1-5, or “group” if there are 6 or more people). We identify the main figure(s) in the image. For each main figure, we identify their name (if a known political figure), gender, race, and emotion (Positive, Negative, or Neutral).121212We only annotate three categories of emotion, because we found it hard to distinguish between the fine-grained negative emotions detected by DeepFace. If the figure is of mixed race (e.g., Barack Obama) or if the figure is unknown (i.e., not easily identifiable after examining the article’s text and searching Google), we label their most salient race.
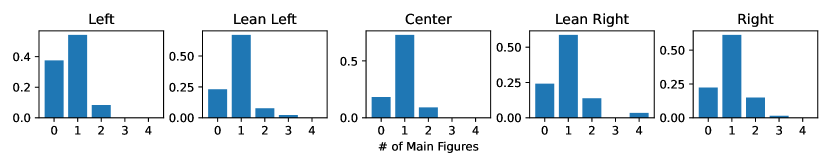
We also identify any salient aspects of the image that help convey the image’s message. This may include the presence of certain objects (e.g., guns, flags), activities (e.g., protests), or text in the image. We also annotate special image classes: whether the image is an invalid/missing image, a news source banner, a cartoon drawing, a collage, or a composite image. The difference between the latter two is explained in Figure 4.
| Left | Lean Left | Center | Lean Right | Right | |
| No Face | 18% | 16% | 19% | 12% | 15% |
| 1 Face | 41% | 38% | 4% | 49% | 46% |
| 2 Faces | 14% | 14% | 14% | 14% | 16% |
| 3 Faces | 5% | 9% | 7% | 8% | 7% |
| 4 Faces | 6% | 6% | 4% | 4% | 4% |
| 5+ Faces | 16% | 18% | 16% | 12% | 12% |
| Mean # faces | 1.89 | 2.04 | 1.87 | 1.80 | 1.74 |
| Total # Images | 665 | 2152 | 1142 | 923 | 2058 |
| Left | Lean Left | Center | Lean Right | Right | |
|---|---|---|---|---|---|
| Regular | 85% | 93% | 100% | 95% | 85% |
| Removed | 7% | 0% | 0% | 0% | 0% |
| Banner | 2% | 0% | 0% | 2% | 2% |
| Cartoon | 0% | 0% | 0% | 2% | 0% |
| Collage | 0% | 6% | 0% | 0% | 12% |
| Composite | 5% | 1% | 0% | 0% | 1% |
Analysis
We present annotator agreement between DeepFace and humans in Appendix D. In this section, we focus on drawing insights from the analysis of the images.
We first examine the number of figures in the image (Table 3). We find that images from liberal sources on average contain more figures than images from conservative sources. Specifically, a higher percentage of left-leaning and center images contained 5 or more faces. Within the 5+ faces category, a large fraction are unknown figures (i.e., not well-known politicians), though these images may contain more notable politicians (e.g., Trump at a podium surrounded by supporters). The distribution of the number of figures in these images may reflect liberals’ focus on equality as a group in comparison to conservatives’ focus on self-reliance as part of their political identity, as revealed by prior work (Hanson et al., 2019).
We also examine the distribution of face occurrence by topic of the article. We find images about topics such as civil rights, labor, and holidays have the most figures on average, while topics such as national defense, FBI, and criminal justice have relatively fewer people. This is simply a natural reflection of the nature of the topic. Within a topic, the distribution largely follows the liberal images have more figures rule. For example, in the gun control topic, lean-left images contain on average 4.9 people, while lean-right images contain on average 2.0 people.
Roughly 12–19% of images contain no face. We find that the majority of these images contain inanimate subjects mentioned in the news articles, which are about e.g. an oil tanker that caught on fire, or rubble from an earthquake, rather than about a specific political figure. Around 13% of these no-face pictures contain well-known government buildings including the White House, the Capitol building, and the Supreme Court building. One explanation is that these images represent the three branches of government in the US and are thus a form of metonymy, e.g. the White House can refer to not only the president but also the country as a whole. However, future work is needed to understand why reporters would select, e.g., an image of the White House instead of an image of the president.
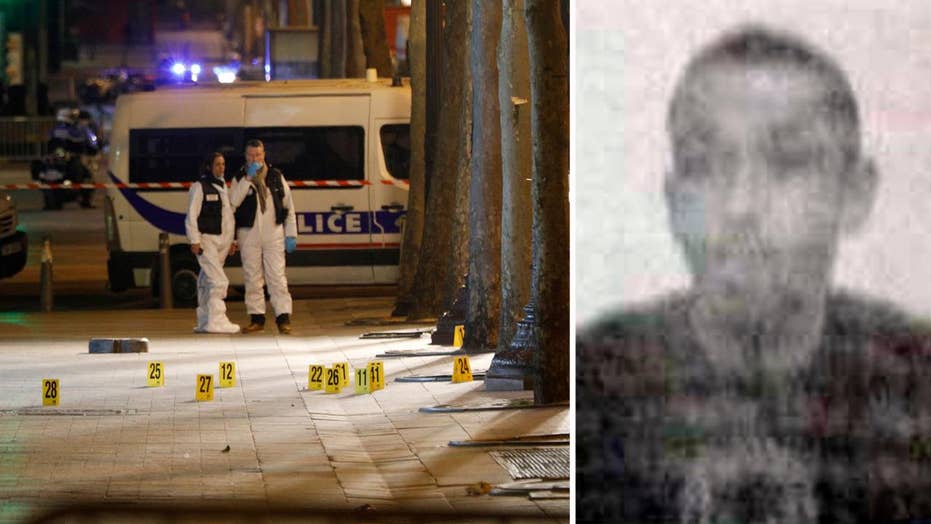
We also investigate types of images in Table 4. Most are ordinary images, but we find that over 12% of images from Right sources are collages, which are often arranged in the form of a narrative. For example, in Figure 4(a), from an article describing a bombing in France, the first image contains the police scene, while the second image is the suspect. Existing work has demonstrated links between the usage of collages and the dissemination of misinformation (Krafft and Donovan, 2020). Composite images make up over 5% of Left images, and we observe that these images are often used to indicate confrontation between the figures in the image, such as two contestants in an election, or policymakers who disagree on an issue.
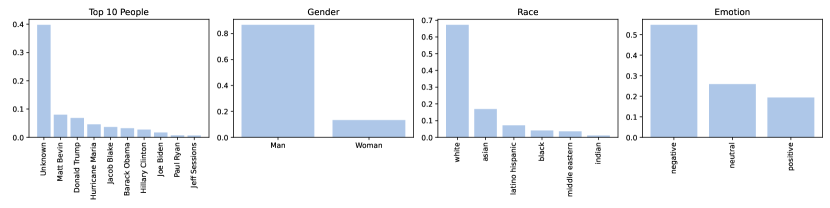
The four most frequent figures in images are Donald Trump, Barack Obama, Hillary Clinton, and Joe Biden (see Table D.1 for details). We find a trend that articles from a particular ideology tend to have more images of the opposing figure (e.g., right-leaning media contains more images of Obama). This is likely a result of attack politics (Haynes and Rhine, 1998; Theilmann and Wilhite, 1998), where politicians attack their opponent instead of bolstering their own position, especially when campaigning. This type of negative campaigning has been shown to be employed more by Republicans (Lau and Pomper, 2001).
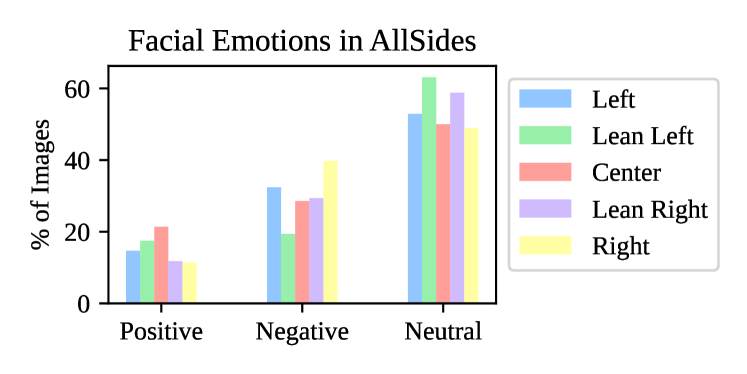
Lastly, we analyze the emotion of the figures in AllSides (Figure 5). Across all ideologies, the majority of faces have negative or neutral emotion. Consumers actually prefer negative news over positive news (Trussler and Soroka, 2014), and negative images in news are more memorable (Newhagen and Reeves, 1992; Newhagen, 1998). Specifically for facial expressions, liberal and conservative news sources have differences in portrayals of Donald Trump (Boxell, 2021). Angry facial emotion primes also tend to increase trust in negative news messages (Ravaja and Kätsyri, 2014). This may explain why more extreme Left and Right news sources, which are more likely to contain less credible news (Allen et al., 2020), have a higher rate of negative emotion faces than Lean-Left and Lean-Right.
4 Models
Armed with new diverse datasets of articles and images, we now propose several models, input encoding strategies, and pretraining regimens to tackle the challenges of multimodal ideology prediction.
4.1 Text-Only and Image-Only Models
We first experiment with text-only models, including RoBERTa (Liu et al., 2019) and POLITICS (Liu et al., 2022a), a RoBERTa model further pretrained with a political ideology objective and thus specialized for ideology prediction and stance detection.
For image-only models, we use Swin Transformer (Hu et al., 2019; Liu et al., 2021, 2022b; Xie et al., 2022), a general-purpose hierarchical Transformer-based model that computes representations of images using shifted windows and has obtained strong or state-of-the-art performance on several image processing tasks. Because of our focus on faces, we experiment with several face-aware image preprocessing methods before encoding the images. These methods are described in Appendix F but were ultimately not successful. Thus, we use the images unchanged.
4.2 Multimodal Models
Early Fusion
Also known as single-stream, an early fusion model takes the joint sequence of text and images as input and merges both modalities to obtain a single representation. We experiment with VisualBERT (Li et al., 2019) and ViLT (Kim et al., 2021), two Transformer-based models that have demonstrated strong performance on a series of vision-and-language downstream tasks such as VQAv2 Goyal et al. (2017), NLVR2 Suhr et al. (2019), and Flickr30K Plummer et al. (2015). VisualBERT concatenates words and image segments identified by an object detector, with an additional embedding indicating the input modality. Instead of using object detectors, we feed in faces detected by DeepFace, as we consider political figures more relevant to the ideology prediction task. ViLT is a similar architecture, but with separate positional embeddings for the text and image inputs and does not use an object detector. We use the pretrained weights released publicly by the authors.
Late Fusion
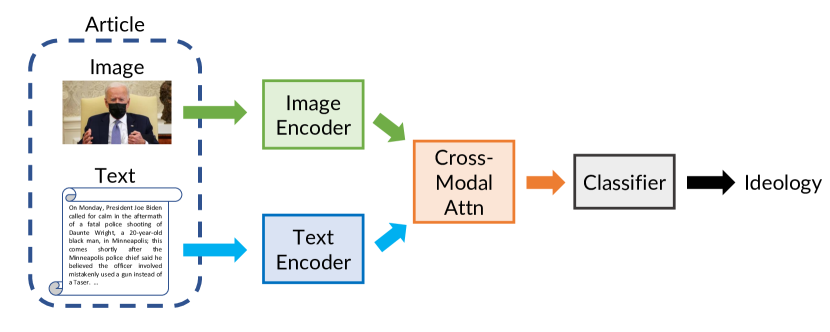
Also known as dual-stream, two models separately encode each modality; then the two representations are joined into a single representation. This is in contrast to early fusion, where a single encoder processes the image and text jointly. We use RoBERTa to encode the text, and Swin Transformer to encode images.
We evaluate several representation joining mechanisms: concatenation, Hadamard product , gated fusion (Wu et al., 2021), and cross-modal attention (LXMERT; Tan and Bansal, 2019). Gated fusion combines the two representations by learning a gate vector so that the combined representation is . For cross-modal attention, Hendricks et al. (2021) has comprehensively analyzed different types of attention mechanisms and found that the coattention scheme (given queries from one modality, e.g., image, keys and values can be taken only from the other modality, e.g., language) has the best performance. Therefore, we use the co-attention scheme for our cross-modal attention module; our implementation largely resembles the cross-modal attention module in LXMERT, with the number of cross-modality layers increased from 5 to 6.
4.3 Continued Pretraining to Inject Knowledge of Ideology
Recent work has shown that continuing to train a pretrained model on domain-specific data or on an auxiliary task can improve the model’s performance on the target task (Beltagy et al., 2019; Gururangan et al., 2020; Lee et al., 2020). In this vein, we aim to improve our ideology prediction model by performing continued pretraining with relevant objectives and auxiliary data.
For pretraining the image encoder, we experiment with an InfoNCE loss (Sohn, 2016; Van den Oord et al., 2018; Radford et al., 2021), a contrastive loss computed within each batch, where the image and text encoders are trained to maximize the cosine similarity of the image and text embeddings of the correct pairs in the batch, while minimizing the cosine similarity of the embeddings of the incorrect pairings. We use this loss with images and their captions, with the hypothesis that supervision from captions will allow the image encoder to develop a more robust representation and potentially learn features of the image that are present in the caption.
We also experiment with a bidirectional captioning loss (VirTex; Desai and Johnson, 2021), in which the image embedding is passed to an image captioning Transformer head, which generates a corresponding caption token by token in both the left-to-right and right-to-left directions.
Finally, we propose a novel triplet margin loss on triplets of news (anchor, positive, negative), where the positive pair shares the same ideology with the anchor, while the negative image has a different ideology than the anchor. Mathematically, , where is the set of news triplets in the training set; , , and are the joint representations of text and image (concatenated and passed through a linear transformation) of the anchor, positive, and negative news in triplet . is a bias term; and is the ramp function . This is inspired by the triplet loss used in FaceNet (Schroff et al., 2015) and is similar to the triplet ideology loss proposed by (Liu et al., 2022a), who pretrain a text-only ideology prediction model with this loss. We apply this loss to pretrain the image encoder, text encoder, and embedding combination components of our model.
5 Experiments
We first perform preliminary experiments comparing single-modality models to determine whether the inclusion of images helps ideology prediction. Then, we evaluate multimodal experimental setups, exhaustively selecting an image encoder, embedding combination methods, and pretraining methods; performing the continued pretraining; then finetuning the entire model on the task of ideology prediction.
Implementation Details
We implement the new models in PyTorch, importing existing models from their authors’ respective GitHub pages. All models were trained for a maximum of 20 epochs with early-stopping patience of 4. For detailed hyperparameters for pretraining and finetuning and other specific implementation details, please refer to our code on the project page.
6 Results and Analysis
| Text Enc | Image Enc | Image Prep | Acc. | Macro |
|---|---|---|---|---|
| RoBERTa | — | — | 85.14 ± 0.50 | 84.41 ± 0.58 |
| \hdashline— | Swin-T | Full Image | 48.94 ± 0.68 | 50.49 ± 0.70 |
| — | Swin-S | Full Image | 49.33 ± 0.41 | 50.63 ± 0.39 |
| — | Swin-B | Full Image | 48.26 ± 0.89 | 49.52 ± 0.93 |
| — | Swin-S | Only Faces | 25.31 ± 0.00 | 8.08 ± 0.00 |
| Category | Model | Acc. | Macro |
|---|---|---|---|
| Early Fusion | VisualBERT | 78.45 ± 0.69 | 75.34 ± 0.67 |
| ViLT | 78.39 ± 1.24 | 76.22 ± 1.43 | |
| \hdashlineLate Fusion | RoBERTa+Swin-S | ||
| Concat. | 82.39 ± 0.59 | 79.82 ± 1.02 | |
| Hadamard Prod. | 85.14 ± 0.74 | 82.62 ± 1.15 | |
| Gated Fusion | 82.77 ± 1.24 | 80.71 ± 1.20 | |
| Cross-modal Attn. | 86.88 ± 0.38 | 85.47 ± 0.41 | |
| Pre-training Component & Objective | Acc. | Macro F1 | |||||||
|---|---|---|---|---|---|---|---|---|---|
| Text Enc. | Image Enc. | Cross-modal Attn. | Overall Acc. | Left | Lean Left | Center | Lean Right | Right | Overall F1 |
| ✗ | ✗ | ✗ | 85.47 ± 0.41 | 69.10 ± 3.34 | 88.03 ± 0.85 | 91.41 ± 0.83 | 88.15 ± 1.31 | 76.40 ± 2.38 | 82.62 ± 1.15 |
| ✓(POLITICS) | ✗ | ✗ | 86.80 ± 0.72 | 96.42 ± 0.96 | 92.42 ± 1.95 | 90.36 ± 0.93 | 81.80 ± 1.45 | 72.58 ± 3.43 | 86.39 ± 0.72 |
| ✗ | ✓(InfoNCE) | ✗ | 86.40 ± 0.74 | 88.35 ± 1.24 | 90.09 ± 0.50 | 89.96 ± 0.88 | 82.37 ± 1.04 | 81.24 ± 1.84 | 86.12 ± 0.73 |
| ✗ | ✓(VirTex-style) | ✗ | 87.60 ± 0.47 | 88.72 ± 1.89 | 89.77 ± 0.73 | 89.87 ± 0.91 | 85.58 ± 0.74 | 84.06 ± 0.84 | 87.84 ± 0.45 |
| ✗ | ✗ | ✓(Triplet Margin) | 87.86 ± 0.93 | 87.99 ± 0.62 | 90.88 ± 0.76 | 90.67 ± 1.68 | 86.19 ± 0.61 | 83.59 ± 2.16 | 87.45 ± 0.87 |
| ✓(POLITICS) | ✓(VirTex-style) | ✗ | 88.49 ± 0.58 | 94.03 ± 1.30 | 88.87 ± 2.65 | 92.30 ± 2.73 | 88.62 ± 2.17 | 78.52 ± 2.22 | 88.26 ± 0.88 |
| ✗ | ✓(VirTex-style) | ✓(Triplet Margin) | 88.18 ± 0.56 | 87.80 ± 0.99 | 90.32 ± 0.92 | 91.83 ± 1.11 | 85.98 ± 0.76 | 84.97 ± 0.94 | 88.16 ± 0.59 |
| ✓(POLITICS) | ✓(VirTex-style) | ✓(Triplet Margin) | 88.98 ± 0.65 | 91.04 ± 1.50 | 91.08 ± 0.59 | 91.36 ± 0.84 | 85.82 ± 0.55 | 84.90 ± 0.57 | 88.64 ± 0.68 |
| Twitter (2-way, center filtered out) | ||||||
|---|---|---|---|---|---|---|
| Category | Model | Acc. | Macro | Acc. | Macro | |
| Text-only | RoBERTa | 76.82 ± 0.32 | 76.81 ± 0.32 | 77.70 ± 0.43 | 77.53 ± 0.45 | |
| POLITICS | 76.68 ± 1.57 | 76.42 ± 1.81 | 78.80 ± 0.15 | 78.78 ± 0.14 | ||
| Vision-only | Swin-S | 70.90 ± 0.55 | 70.87 ± 0.58 | 62.53 ± 0.85 | 62.49 ± 0.84 | |
| \hdashlineLate Fusion | RoBERTa+Swin-S+Cross-modal Attn. | |||||
| No Further Pre-training | 77.79 ± 0.17 | 77.72 ± 0.15 | 78.50 ± 0.06 | 62.97 ± 0.66 | ||
| VirTex-style+Triplet Margin | 80.82 ± 1.05 | 80.78 ± 1.09 | 79.49 ± 0.44 | 78.46 ± 0.06 | ||
| POLITICS+Swin-S+Cross-modal Attn. | ||||||
| No Further Pre-training | 79.06 ± 0.14 | 79.02 ± 0.14 | 78.82 ± 0.69 | 78.80 ± 0.68 | ||
| VirTex-style+Triplet Margin | 81.72 ± 0.87 | 81.69 ± 0.69 | 79.85 ± 0.18 | 79.82 ± 0.20 | ||
Text-Only and Image-Only Models
We first present unimodal experiments on AllSides in Table 5. We find that the vision-only model performs significantly worse than the text-only baseline, indicating that an image alone is inadequate for predicting ideology. Surprisingly, Swin-Small slightly outperforms Swin-Base (which is larger in size), though the difference is not substantial. Thus, we decided to use Swin-Small (Swin-S) as the image encoder backbone for our multimodal models due to its performance and size. These baseline results motivate the premise of multimodal ideology prediction, in which we use images as additional signal to augment the text.
Multimodal Models without Pretraining
Next, we present multimodal model results without pretraining in Table 6. We find that early fusion models cannot outperform the text-only baselines, in contrast to late fusion models, indicating that the combination of text and image is beneficial for ideology prediction, but the choice of architecture is important. The late fusion architecture with cross-modal attention performs the best, and thus we take this model as our starting point for the rest of the experiments in this paper.
Multimodal Models with Pretraining
We then exhaustively experiment with combinations of pretraining objectives for each component of the model (language encoder, image encoder, and cross-modal attention) for ablation and analysis. Results on the AllSides evaluation set are shown in Table 7.
First, we find that replacing RoBERTa with the pretrained POLITICS model already gains a 1% improvement to the overall model. By pretraining on similar domain text, the model is able to generate better text representations. Liu et al. (2022a) find that the POLITICS objective allows the model to perform much better on left-leaning articles, which have higher perplexity (i.e. the language is more diverse). In a multimodal setup, we find that this text encoder helps the multimodal model improve on right-leaning input data more than left-leaning, indicating that the inclusion of images helps the classification of right-leaning ideology.
For pretraining the image encoder, our experiments show that the VirTex-style bidirectional captioning loss performs better than the InfoNCE contrastive learning objective. This pretraining method allows the model to better capture the similarities between the image and its associated text. Text may also provide a more semantically dense signal than contrastive approaches (Desai and Johnson, 2021), thus leading to better performance.
For pretraining the cross-modal attention, we find that our proposed Triplet Margin Loss objective, which optimizes all three components (image encoder, text encoder, cross-modal attention) of the entire model, improves over no pretraining.
Overall, ablation experiments show that the best combination (RoBERTa pretrained with POLITICS loss, and Swin pretrained with VirTex loss on the image encoder) contribute around 1 percentage point and 2 percentage points respectively (Table 7). Further combining them with the triplet margin loss leads to the best-performing model, with more than 3 percentage points over the baseline late-fusion model.
Twitter & Reddit
Finally, we evaluate our models on the Reddit and Twitter datasets to get a more comprehensive perspective of the model’s ideology prediction ability on different domains. Results are presented in Table 8. Overall, performance is substantially lower than on AllSides, because of domain mismatch: Reddit posts and tweets are not usually written in the long, formal language of news articles. However, the improvements over a text-only baseline are more substantial than on AllSides, where the long text already contains enough information for predicting ideology. We also find that for Twitter, which was split into left, center, and right ideologies, the models perform poorly on Center tweets, probably due to high dataset imbalance (Table 2), though the addition of images greatly improved over text-only models.
7 Conclusion
This paper introduces the task of fine-grained multimodal ideology prediction, where a model predicts one of five ideologies leanings given a pair of text and an image. We collect five new large-scale datasets of political images and present an in-depth characterization of these images, examining aspects such as facial features across ideologies. We experiment with a combination of state-of-the-art multimodal architectures and pretraining schemes, including a newly-proposed triplet margin loss objectives. Along with the release of our datasets, our experimental findings will inform the selection of models and training objectives in future work and spur future research in politics, ideology prediction, and other multimodal tasks.
Acknowledgments
This work is supported in part by the National Science Foundation under grant III-2127747 and by the Air Force Office of Scientific Research through grant FA9550-22-1-0099. We would like to thank the members of the LAUNCH lab at the University of Michigan and the anonymous reviewers for their helpful comments and feedback. We would especially like to thank Yujian Liu for providing us with the BigNews dataset.
Ethical Considerations
Dataset Collection
All images were collected in a manner consistent with the terms of use of the original sources. The articles and images from AllSides, Reddit, Twitter, and the 11 news sources are copyrighted by their respective sources. We consulted Section 107131313https://www.copyright.gov/title17/92chap1.html#107. of the U.S. Copyright Act and ensured that our collection action fell under the fair use category. As we are not the copyright holders, we do not release the images that we collected. Rather, we provide code for analyzing these datasets for those who may already have the datasets. In addition, to discourage the misuse of the data, we warn users about potential misuse and any ethical concerns that could raise from improperly dealing with the data.
Facial Recognition
We use DeepFace to perform facial recognition as well as attribute recognition for gender, race, and emotion. However, in this work, we only use DeepFace to perform analysis (rather than prediction) on our new datasets, and we compare DeepFace’s analyses with human annotations. The categories for gender, race, and emotion are defined by DeepFace. Though some may question these categories, it is not within the scope of this paper to argue for or against them.
As mentioned in Section 3.3, DeepFace often classifies Barack Obama and Eric Holder as Hispanic or Middle Eastern, and Donald Trump as Asian. This is likely due to models learning that dark skin or squinty eyes, respectively, are important features predictive of race. As researchers, we must be aware of these biases in the models and be careful not to reinforce racial stereotypes due to models’ predictions. We do not explicitly use race, gender, or ethnicity as features in our prediction model. Moreover, we call on all researchers to deal with automatic facial recognition tools like DeepFace carefully and take all possible biases into consideration.
Ideology
In our work, we have made several assumptions about ideology, namely that the ideology of a news source, Reddit subreddit, and Tweet author is consistent. This may not always be true; a left-leaning post may appear in r/Conservative, or a politician on Twitter may be a moderate whose tweets reflect liberal and conservative stances on different issues. However, these are relatively rare cases, and we will warn all potential users about such cases.
Model
Intended Use
The use case we have described for our multimodal ideology prediction model is to educate users about ideology bias in media of various genres with both texts and images.
Failure mode
The failure mode referred to a case where our model fails to predict the correct ideology of a piece of media work with both text and image. While we showed that these models have high accuracy, the models are not 100% perfect. End users of our model must not take model predictions as fact. We encourage end users to consult machine learning experts as well as political scientists when using our models.
Limitations
Facial Recognition
As our analysis has shown, DeepFace is not 100% reliable as an automatic annotation tool. To confidently use DeepFace as an analysis tool, manual annotation (which we have done in the paper) is necessary but time-consuming, requiring human labor.
Compute Resources - GPUs
Due to the scale of the data (summarized in Table 1) and the size of the model (summarized in Table 9), pretraining is extremely computationally expensive and requires large GPU resources. Our experiments are performed using 2 NVIDIA RTX A6000 and 2 Quadro RTX 8000 GPUs. Batch sizes are chosen to meet hardware constraints and we pretrain the models for 2500 steps. The pretraining on BN-ImgCap and BNA-Img takes approximately 3 and 4 days, respectively.
| Model | # parameters |
|---|---|
| RoBERTa / POLITICS | 125M |
| \hdashlineSwin-T | 29M |
| Swin-S | 50M |
| Swin-B | 88M |
| \hdashlineRoBERTa+Swin-S | 175M |
| RoBERTa+Swin-S+Cross-modal Attn. | 273M |
References
- Allen et al. (2020) Jennifer Allen, Baird Howland, Markus Mobius, David Rothschild, and Duncan J Watts. 2020. Evaluating the fake news problem at the scale of the information ecosystem. Science advances, 6(14):eaay3539.
- Baly et al. (2020) Ramy Baly, Giovanni Da San Martino, James Glass, and Preslav Nakov. 2020. We can detect your bias: Predicting the political ideology of news articles. In Proceedings of the 2020 Conference on Empirical Methods in Natural Language Processing (EMNLP), pages 4982–4991, Online. Association for Computational Linguistics.
- Beltagy et al. (2019) Iz Beltagy, Kyle Lo, and Arman Cohan. 2019. SciBERT: A pretrained language model for scientific text. In Proceedings of the 2019 Conference on Empirical Methods in Natural Language Processing and the 9th International Joint Conference on Natural Language Processing (EMNLP-IJCNLP), pages 3615–3620, Hong Kong, China. Association for Computational Linguistics.
- Beskow et al. (2020) David M Beskow, Sumeet Kumar, and Kathleen M Carley. 2020. The evolution of political memes: Detecting and characterizing internet memes with multi-modal deep learning. Information Processing & Management, 57(2):102170.
- Bobbio (1996) Norberto Bobbio. 1996. Left and right: The significance of a political distinction. University of Chicago Press.
- Boche et al. (2018) Adam Boche, Jeffrey B Lewis, Aaron Rudkin, and Luke Sonnet. 2018. The new voteview. com: preserving and continuing keith poole’s infrastructure for scholars, students and observers of congress. Public Choice, 176(1):17–32.
- Boxell (2021) Levi Boxell. 2021. Slanted images: Measuring nonverbal media bias during the 2016 election. Available at SSRN 3837521.
- Card et al. (2015) Dallas Card, Amber E. Boydstun, Justin H. Gross, Philip Resnik, and Noah A. Smith. 2015. The media frames corpus: Annotations of frames across issues. In Proceedings of the 53rd Annual Meeting of the Association for Computational Linguistics and the 7th International Joint Conference on Natural Language Processing (Volume 2: Short Papers), pages 438–444, Beijing, China. Association for Computational Linguistics.
- Desai and Johnson (2021) Karan Desai and Justin Johnson. 2021. Virtex: Learning visual representations from textual annotations. In Proceedings of the IEEE/CVF Conference on Computer Vision and Pattern Recognition, pages 11162–11173.
- Entman (2007) Robert M Entman. 2007. Framing bias: Media in the distribution of power. Journal of communication, 57(1):163–173.
- Evans et al. (2007) Michael Evans, Wayne McIntosh, Jimmy Lin, and Cynthia Cates. 2007. Recounting the courts? applying automated content analysis to enhance empirical legal research. Journal of Empirical Legal Studies, 4(4):1007–1039.
- Fan et al. (2019) Lisa Fan, Marshall White, Eva Sharma, Ruisi Su, Prafulla Kumar Choubey, Ruihong Huang, and Lu Wang. 2019. In plain sight: Media bias through the lens of factual reporting. In Proceedings of the 2019 Conference on Empirical Methods in Natural Language Processing and the 9th International Joint Conference on Natural Language Processing (EMNLP-IJCNLP), pages 6343–6349, Hong Kong, China. Association for Computational Linguistics.
- Gentzkow and Shapiro (2006) Matthew Gentzkow and Jesse M Shapiro. 2006. Media bias and reputation. Journal of political Economy, 114(2):280–316.
- Goyal et al. (2017) Yash Goyal, Tejas Khot, Douglas Summers-Stay, Dhruv Batra, and Devi Parikh. 2017. Making the V in VQA matter: Elevating the role of image understanding in Visual Question Answering. In Conference on Computer Vision and Pattern Recognition (CVPR).
- Gururangan et al. (2020) Suchin Gururangan, Ana Marasović, Swabha Swayamdipta, Kyle Lo, Iz Beltagy, Doug Downey, and Noah A. Smith. 2020. Don’t stop pretraining: Adapt language models to domains and tasks. In Proceedings of the 58th Annual Meeting of the Association for Computational Linguistics, pages 8342–8360, Online. Association for Computational Linguistics.
- Hamborg et al. (2017) Felix Hamborg, Norman Meuschke, and Bela Gipp. 2017. Matrix-based news aggregation: exploring different news perspectives. In 2017 ACM/IEEE Joint Conference on Digital Libraries (JCDL), pages 1–10. IEEE.
- Hanson et al. (2019) Kristin Hanson, Emma O’Dwyer, and Evanthia Lyons. 2019. The individual and the nation: a qualitative analysis of us liberal and conservative identity content. Journal of Social and Political Psychology, 7(1):378–401.
- Haynes and Rhine (1998) Audrey A Haynes and Staci L Rhine. 1998. Attack politics in presidential nomination campaigns: An examination of the frequency and determinants of intermediated negative messages against opponents. Political Research Quarterly, 51(3):691–721.
- Hendricks et al. (2021) Lisa Anne Hendricks, John Mellor, Rosalia Schneider, Jean-Baptiste Alayrac, and Aida Nematzadeh. 2021. Decoupling the role of data, attention, and losses in multimodal transformers. Trans. Assoc. Comput. Linguistics.
- Hu et al. (2019) Han Hu, Zheng Zhang, Zhenda Xie, and Stephen Lin. 2019. Local relation networks for image recognition. In Proceedings of the IEEE/CVF International Conference on Computer Vision (ICCV), pages 3464–3473.
- Iyyer et al. (2014) Mohit Iyyer, Peter Enns, Jordan Boyd-Graber, and Philip Resnik. 2014. Political ideology detection using recursive neural networks. In Proceedings of the 52nd Annual Meeting of the Association for Computational Linguistics (Volume 1: Long Papers), pages 1113–1122, Baltimore, Maryland. Association for Computational Linguistics.
- Jain and Learned-Miller (2010) Vidit Jain and Erik Learned-Miller. 2010. Fddb: A benchmark for face detection in unconstrained settings. Technical report, UMass Amherst technical report.
- Kim et al. (2021) Wonjae Kim, Bokyung Son, and Ildoo Kim. 2021. Vilt: Vision-and-language transformer without convolution or region supervision. In International Conference on Machine Learning, pages 5583–5594. PMLR.
- Klein (2020) Ezra Klein. 2020. Why we’re polarized. Simon and Schuster.
- Krafft and Donovan (2020) Peaks M Krafft and Joan Donovan. 2020. Disinformation by design: The use of evidence collages and platform filtering in a media manipulation campaign. Political Communication, 37(2):194–214.
- Kulkarni et al. (2018) Vivek Kulkarni, Junting Ye, Steve Skiena, and William Yang Wang. 2018. Multi-view models for political ideology detection of news articles. In Proceedings of the 2018 Conference on Empirical Methods in Natural Language Processing, pages 3518–3527, Brussels, Belgium. Association for Computational Linguistics.
- Lau and Pomper (2001) Richard R Lau and Gerald M Pomper. 2001. Negative campaigning by us senate candidates. Party Politics, 7(1):69–87.
- Lee et al. (2020) Jinhyuk Lee, Wonjin Yoon, Sungdong Kim, Donghyeon Kim, Sunkyu Kim, Chan Ho So, and Jaewoo Kang. 2020. Biobert: a pre-trained biomedical language representation model for biomedical text mining. Bioinformatics, 36(4):1234–1240.
- Li and Goldwasser (2019) Chang Li and Dan Goldwasser. 2019. Encoding social information with graph convolutional networks forPolitical perspective detection in news media. In Proceedings of the 57th Annual Meeting of the Association for Computational Linguistics, pages 2594–2604, Florence, Italy. Association for Computational Linguistics.
- Li et al. (2019) Liunian Harold Li, Mark Yatskar, Da Yin, Cho-Jui Hsieh, and Kai-Wei Chang. 2019. Visualbert: A simple and performant baseline for vision and language. arXiv preprint arXiv:1908.03557.
- Liu et al. (2019) Yinhan Liu, Myle Ott, Naman Goyal, Jingfei Du, Mandar Joshi, Danqi Chen, Omer Levy, Mike Lewis, Luke Zettlemoyer, and Veselin Stoyanov. 2019. Roberta: A robustly optimized bert pretraining approach. arXiv preprint arXiv:1907.11692.
- Liu et al. (2022a) Yujian Liu, Xinliang Frederick Zhang, David Wegsman, Nicholas Beauchamp, and Lu Wang. 2022a. POLITICS: pretraining with same-story article comparison for ideology prediction and stance detection. In Findings of the Association for Computational Linguistics: NAACL 2022, pages 1354–1374.
- Liu et al. (2022b) Ze Liu, Han Hu, Yutong Lin, Zhuliang Yao, Zhenda Xie, Yixuan Wei, Jia Ning, Yue Cao, Zheng Zhang, Li Dong, Furu Wei, and Baining Guo. 2022b. Swin transformer v2: Scaling up capacity and resolution. In International Conference on Computer Vision and Pattern Recognition (CVPR).
- Liu et al. (2021) Ze Liu, Yutong Lin, Yue Cao, Han Hu, Yixuan Wei, Zheng Zhang, Stephen Lin, and Baining Guo. 2021. Swin transformer: Hierarchical vision transformer using shifted windows. In Proceedings of the IEEE/CVF International Conference on Computer Vision (ICCV).
- Madrigal and Soroka (2021) Guadalupe Madrigal and Stuart Soroka. 2021. Migrants, caravans, and the impact of news photos on immigration attitudes. The International Journal of Press/Politics, page 19401612211008430.
- McCarthy et al. (1996) John D McCarthy, Clark McPhail, and Jackie Smith. 1996. Images of protest: Dimensions of selection bias in media coverage of washington demonstrations, 1982 and 1991. American sociological review, pages 478–499.
- Mendelsohn et al. (2021) Julia Mendelsohn, Ceren Budak, and David Jurgens. 2021. Modeling framing in immigration discourse on social media. In Proceedings of the 2021 Conference of the North American Chapter of the Association for Computational Linguistics: Human Language Technologies, pages 2219–2263, Online. Association for Computational Linguistics.
- Newhagen (1998) John E Newhagen. 1998. Tv news images that induce anger, fear, and disgust: Effects on approach-avoidance and memory. Journal of broadcasting & electronic media, 42(2):265–276.
- Newhagen and Reeves (1992) John E Newhagen and Byron Reeves. 1992. The evening’s bad news: Effects of compelling negative television news images on memory. Journal of communication, 42(2):25–41.
- Oliver and Maney (2000) Pamela E Oliver and Gregory M Maney. 2000. Political processes and local newspaper coverage of protest events: From selection bias to triadic interactions. American Journal of Sociology, 106(2):463–505.
- Panda et al. (2020) Anmol Panda, A’ndre Gonawela, Sreangsu Acharyya, Dibyendu Mishra, Mugdha Mohapatra, Ramgopal Chandrasekaran, and Joyojeet Pal. 2020. Nivaduck-a scalable pipeline to build a database of political twitter handles for india and the united states. In International Conference on Social Media and Society, pages 200–209.
- Park et al. (2009) Souneil Park, Seungwoo Kang, Sangyoung Chung, and Junehwa Song. 2009. Newscube: delivering multiple aspects of news to mitigate media bias. In Proceedings of the SIGCHI conference on human factors in computing systems, pages 443–452.
- Park et al. (2011) Souneil Park, Minsam Ko, Jungwoo Kim, Ho-Jin Choi, and Junehwa Song. 2011. Newscube 2.0: an exploratory design of a social news website for media bias mitigation. In Workshop on Social Recommender Systems.
- Plummer et al. (2015) Bryan A Plummer, Liwei Wang, Chris M Cervantes, Juan C Caicedo, Julia Hockenmaier, and Svetlana Lazebnik. 2015. Flickr30k entities: Collecting region-to-phrase correspondences for richer image-to-sentence models. In Proceedings of the IEEE international conference on computer vision, pages 2641–2649.
- Radford et al. (2021) Alec Radford, Jong Wook Kim, Chris Hallacy, Aditya Ramesh, Gabriel Goh, Sandhini Agarwal, Girish Sastry, Amanda Askell, Pamela Mishkin, Jack Clark, et al. 2021. Learning transferable visual models from natural language supervision. In International Conference on Machine Learning, pages 8748–8763. PMLR.
- Ravaja and Kätsyri (2014) Niklas Ravaja and Jari Kätsyri. 2014. Suboptimal facial expression primes in textual media messages: Evidence for the affective congruency effect. Computers in Human Behavior, 40:64–77.
- Sapiro-Gheiler (2019) Eitan Sapiro-Gheiler. 2019. Examining political trustworthiness through text-based measures of ideology. In Proceedings of the AAAI Conference on Artificial Intelligence, volume 33, pages 10029–10030.
- Schroff et al. (2015) Florian Schroff, Dmitry Kalenichenko, and James Philbin. 2015. Facenet: A unified embedding for face recognition and clustering. In Proceedings of the IEEE conference on computer vision and pattern recognition, pages 815–823.
- Sohn (2016) Kihyuk Sohn. 2016. Improved deep metric learning with multi-class n-pair loss objective. Advances in neural information processing systems, 29.
- Southwick et al. (2021) Lauren Southwick, Sharath C Guntuku, Elissa V Klinger, Emily Seltzer, Haley J McCalpin, and Raina M Merchant. 2021. Characterizing covid-19 content posted to tiktok: public sentiment and response during the first phase of the covid-19 pandemic. Journal of Adolescent Health, 69(2):234–241.
- Suhr et al. (2019) Alane Suhr, Stephanie Zhou, Ally Zhang, Iris Zhang, Huajun Bai, and Yoav Artzi. 2019. A corpus for reasoning about natural language grounded in photographs. In Proceedings of the 57th Conference of the Association for Computational Linguistics, ACL 2019, Florence, Italy, July 28- August 2, 2019, Volume 1: Long Papers.
- Taigman et al. (2014) Yaniv Taigman, Ming Yang, Marc’Aurelio Ranzato, and Lior Wolf. 2014. Deepface: Closing the gap to human-level performance in face verification. In Proceedings of the IEEE conference on computer vision and pattern recognition, pages 1701–1708.
- Tan and Bansal (2019) Hao Tan and Mohit Bansal. 2019. LXMERT: Learning cross-modality encoder representations from transformers. In Proceedings of the 2019 Conference on Empirical Methods in Natural Language Processing and the 9th International Joint Conference on Natural Language Processing (EMNLP-IJCNLP), pages 5100–5111, Hong Kong, China. Association for Computational Linguistics.
- Theilmann and Wilhite (1998) John Theilmann and Allen Wilhite. 1998. Campaign tactics and the decision to attack. The Journal of Politics, 60(4):1050–1062.
- Thomas and Kovashka (2019) Christopher Thomas and Adriana Kovashka. 2019. Predicting the politics of an image using webly supervised data. In Advances in Neural Information Processing Systems, volume 32. Curran Associates, Inc.
- Trussler and Soroka (2014) Marc Trussler and Stuart Soroka. 2014. Consumer demand for cynical and negative news frames. The International Journal of Press/Politics, 19(3):360–379.
- Van den Oord et al. (2018) Aaron Van den Oord, Yazhe Li, and Oriol Vinyals. 2018. Representation learning with contrastive predictive coding. arXiv e-prints, pages arXiv–1807.
- White (1950) David Manning White. 1950. The “gate keeper”: A case study in the selection of news. Journalism quarterly, 27(4):383–390.
- Wu et al. (2021) Zhiyong Wu, Lingpeng Kong, Wei Bi, Xiang Li, and Ben Kao. 2021. Good for misconceived reasons: An empirical revisiting on the need for visual context in multimodal machine translation. In Proceedings of the 59th Annual Meeting of the Association for Computational Linguistics and the 11th International Joint Conference on Natural Language Processing (Volume 1: Long Papers), pages 6153–6166, Online. Association for Computational Linguistics.
- Xie et al. (2022) Zhenda Xie, Zheng Zhang, Yue Cao, Yutong Lin, Jianmin Bao, Zhuliang Yao, Qi Dai, and Han Hu. 2022. Simmim: A simple framework for masked image modeling. In International Conference on Computer Vision and Pattern Recognition (CVPR).
- Yang et al. (2021) Kangning Yang, Chaofan Wang, Zhanna Sarsenbayeva, Benjamin Tag, Tilman Dingler, Greg Wadley, and Jorge Goncalves. 2021. Benchmarking commercial emotion detection systems using realistic distortions of facial image datasets. The Visual Computer, 37(6):1447–1466.
- Yang et al. (2016) Shuo Yang, Ping Luo, Chen-Change Loy, and Xiaoou Tang. 2016. Wider face: A face detection benchmark. In Proceedings of the IEEE conference on computer vision and pattern recognition, pages 5525–5533.
- Yu et al. (2008) Bei Yu, Stefan Kaufmann, and Daniel Diermeier. 2008. Classifying party affiliation from political speech. Journal of Information Technology & Politics, 5(1):33–48.
- Zannettou et al. (2020) Savvas Zannettou, Tristan Caulfield, Barry Bradlyn, Emiliano De Cristofaro, Gianluca Stringhini, and Jeremy Blackburn. 2020. Characterizing the use of images in state-sponsored information warfare operations by russian trolls on twitter. In Proceedings of the International AAAI Conference on Web and Social Media, volume 14, pages 774–785.
Appendix A Details of Image Collection
This section contains details of the collection of images and their corresponding captions from news articles. Images were obtained by searching for <img> tags within the article’s HTML. The captions were obtained as follows. We started with examining the alt attribute of the <img> tags, which often contain the caption. For Associated Press, we identified captions in a different part of the HTML and extracted them using regex matching. To ensure that captions adequately describe their images and prevent data spillage, we use regex matching to remove portions of the captions containing names of photographers and the news source name, such as “(TOM SMITH/NEW YORK TIMES)”. We also discard captions shorter than 30 characters, which were often a series of keywords rather than an entire sentence.
Appendix B List of News Sources from AllSides
The following are the 25 news sources in AllSides: BBC News, Breitbart News, CBN, Christian Science Monitor, CNN, Fox News, HuffPost, National Review, New York Times, Newsmax, NPR, Politico, Reason, Reuters, Salon, The Guardian, The Hill, TheBlaze.com, Townhall, USA TODAY, Vox, Wall Street Journal, Washington Examiner, Washington Post, Washington Times.
Appendix C Preprocessing Images for DeepFace
We first perform entity linking on the text portion of AllSides articles using the Google Cloud Natural Language API,141414https://cloud.google.com/natural-language/docs/analyzing-entities identifying 9,556 entities (73K total occurrences) that have Wikipedia pages. We keep 817 entities with more than 10 occurrences in the AllSides training set and also discard entities such as God, Jesus, or Russians that are clearly not politician names, resulting in a list of 722 entities. For each of these entities, we query Google Images with their name and download 50 images filtered to contain only a single face (as detected by DeepFace). Finally, we compute the similarity between each of the 50 images to select 10 reference images with the highest average similarity.
Appendix D Annotator Agreement with DeepFace
Agreement with DeepFace
Because inter-annotator agreement on the pilot study was high, one author of this paper annotated images from 200 news stories following the above guidelines. We compute Cohen’s kappa to measure the agreement between our annotator and the DeepFace predictions. A summary of statistics is shown in Figure D.2. We examine each aspect of the images in turn.
For the number of people in an image, = 0.69 indicates relatively high agreement. Note that we bin 6+ people into the “group” label. In most cases, disagreement stemmed from DeepFace recognizing more faces than the annotator; these faces were often small, blurred, or partially obscured.
For the main figures in an image, DeepFace does not explicitly have such a notion, and we did not tell the annotator what a “main figure” should be. By examining the annotations, we find that main figures tend to be large, often in the center of the image, and in focus (i.e., not blurred). The number of main figures per ideology is presented in Figure D.1.
DeepFace however does rank the extracted faces by their saliency. For each image, we examine the most salient face identified by the model and compare it with our annotator’s labels. First, we find that identifying the figure’s name results in low-annotator agreement ( = 0.32). We observe that DeepFace is often not able to recognize faces if they are relatively small in the image, or if the face is in side profile, even if the image is of a well-known figure. This indicates that although facial recognition tools are adept at detecting the presence of a face, they may be sensitive to the size of the face when identifying the face. We also find that DeepFace incorrectly predicts Matt Bevin (former governor of Kentucky) and Jacob Blake (a black man who was a victim of a police shooting) for many images. Due to their unusually high frequency in model predictions, we believe that these two images may represent the model’s notion of a “stereotypical” white man and black man, respectively.
For gender, DeepFace shows high agreement ( = 0.76) with our annotator. Gender can be easily retrieved from a database once the person is correctly identified. Nevertheless, we find it interesting to note that DeepFace’s mistakes were all misclassifying women as men; these instances included Hillary Clinton, Samantha Power, Gina Haspel, and Patty Murray.
Similar to gender, race can also be queried if the person is known. However, race is also problematic in several regards, one of which is mixed-race figures (e.g., Barack Obama). DeepFace predicts a single most apparent race, and we asked our annotator to do the same. Annotator agreement on gender prediction was relatively low ( = 0.34). Some common errors by DeepFace include Barack Obama and Eric Holder being misclassified as Hispanic/Latino (possibly due to skin color) and Donald Trump being misclassified as Asian (possibly due to eye size).
Emotion is difficult to annotate. Our annotator labeled fine-grained emotion for about 20% of images, remarking that it was difficult to distinguish negative emotions. By grouping emotions into three large bins (positive, negative, neutral), DeepFace achieves moderate agreement ( = 0.45) with the annotator. The main disagreements were between negative and neutral emotions.
| Left | Lean Left | Center | Lean Right | Right | |
|---|---|---|---|---|---|
| Contains Trump | 15.1% | 9.1% | 10.5% | 16.2% | 12.1% |
| Contains Obama | 3.5% | 3.4% | 1.8% | 4.6% | 5.5% |
| Contains Clinton | 3.1% | 3.3% | 1.2% | 4.1% | 3.4% |
| Contains Biden | 1.2% | 2.3% | 4.7% | 2.9% | 2.2% |
| With Trump | 2.4 | 1.6 | 2.3 | 1.0 | 0.7 |
| With Obama | 0.7 | 1.5 | 0.0 | 1.8 | 0.6 |
| With Clinton | 1.8 | 4.0 | 0.0 | 0.6 | 1.4 |
| With Biden | 0.0 | 0.9 | 0.5 | 0.2 | 1.0 |
Appendix E Information about Reddit and Twitter Datasets
| r/Liberal | % |
|---|---|
| youtube.com | 16 |
| reddit.com | 10 |
| rawstory.com | 3.1 |
| businessinsider.com | 3.1 |
| theguardian.com | 2.3 |
| yahoo.com | 2.1 |
| npr.org | 1.8 |
| politico.com | 1.8 |
| thedailybeast.com | 1.7 |
| nbcnews.com | 1.6 |
| r/democrats | % |
|---|---|
| reddit.com | 41 |
| youtube.com | 12 |
| twitter.com | 3.4 |
| i.imgur.com | 2.0 |
| politico.com | 1.4 |
| businessinsider.com | 1.4 |
| nbcnews.com | 1.2 |
| theguardian.com | 1.0 |
| cnbc.com | 0.9 |
| liberalwisconsin.blogspot.com | 0.9 |
| r/progressive | % |
|---|---|
| youtube.com | 14 |
| reddit.com | 5.6 |
| yahoo.com | 3.4 |
| theguardian.com | 2.1 |
| npr.org | 1.9 |
| nbcnews.com | 1.8 |
| politico.com | 1.8 |
| twitter.com | 1.7 |
| cnbc.com | 1.6 |
| commondreams.org | 1.5 |
| r/Republican | % |
|---|---|
| reddit.com | 24 |
| youtube.com | 7.8 |
| nypost.com | 3.8 |
| thepostmillennial.com | 3.3 |
| timcast.com | 2.6 |
| thefederalist.com | 2.0 |
| redstate.com | 1.8 |
| dailywire.com | 1.7 |
| dailymail.co.uk | 1.6 |
| washingtonexaminer.com | 1.5 |
| r/Conservative | % |
|---|---|
| reddit.com | 17 |
| youtube.com | 6.1 |
| nypost.com | 3.7 |
| dailywire.com | 3.0 |
| tampafp.com | 2.7 |
| washingtonexaminer.com | 2.2 |
| redstate.com | 2.1 |
| dailycaller.com | 1.7 |
| townhall.com | 1.4 |
| thinkcivics.com | 1.4 |
The top 10 tweeters from each ideology, along with their tweeting stats, are shown in Table E.2.
| Left | ||
|---|---|---|
| Username | Tweets | % |
| RepWilson | 344 | 1.3 |
| repdinatitus | 272 | 1.0 |
| TheDemocrats | 238 | 0.9 |
| BillPascrell | 221 | 0.8 |
| BruceBraley | 215 | 0.8 |
| RepJimmyGomez | 210 | 0.8 |
| RepDonaldPayne | 206 | 0.8 |
| RepBeatty | 206 | 0.8 |
| SenatorMenendez | 203 | 0.8 |
| VP | 195 | 0.7 |
| Center | ||
|---|---|---|
| Username | Tweets | % |
| RosLehtinen | 412 | 5.9 |
| LtGovHochulNY | 214 | 3.1 |
| lisamurkowski | 193 | 2.8 |
| SenatorHeitkamp | 167 | 2.4 |
| EliseStefanik | 164 | 2.4 |
| RepJoshG | 145 | 2.1 |
| RepScottPeters | 141 | 2.0 |
| SpanbergerVA07 | 140 | 2.0 |
| RepCheri | 139 | 2.0 |
| SenatorShaheen | 137 | 2.0 |
| Right | ||
|---|---|---|
| Username | Tweets | % |
| GovMikeDeWine | 292 | 1.2 |
| timburchett | 268 | 1.1 |
| GOP | 262 | 1.1 |
| RepPeteOlson | 240 | 1.0 |
| auctnr1 | 237 | 1.0 |
| rep_stevewomack | 222 | 0.9 |
| AsaHutchinson | 206 | 0.9 |
| LASDBrink | 204 | 0.9 |
| NMalliotakis | 202 | 0.8 |
| SteveWorks4You | 171 | 0.7 |
Similar to Reddit, Twitter imposes a character limit on the length of posts (280 characters).
Appendix F Models
Image Preprocessing
Our preliminary analysis of images in our dataset shows that the majority of images contain faces of political figures. Thus, we experiment with preprocessing the image before passing it to the image encoder, based on several face-related criteria:
-
•
Full Image: We leave the original image unchanged when fed to the models. If there is no face, we feed in an entirely black image (with pixel values of 0).
-
•
Image with Face: We leave the original image unchanged if DeepFace detects faces in the image. If DeepFace detects no faces in the image, we feed in an entirely whole black image (with pixel values of 0).
-
•
Only Face: If an image contains a face, we use the cropped most-salient face as indicated by DeepFace. If DeepFace detects no faces in the image, we feed in an entirely black image (with pixel values of 0).
Appendix G Experiments on Social Media Data
Here we describe the results of our multimodal ideology prediction models on the social media data extracted from Reddit and Twitter.
Table G.1 presents results on the Reddit dataset, in which the task is to predict either Left or Right ideology. Overall, our VirTex-style late-fusion model with the triplet margin loss performs best. However, accuracy is worse than on the AllSides dataset due to data mismatch: the models are trained on entire news articles, but Reddit titles are short.
Table G.2 presents results on the Twitter dataset for the 3-way classification task (Left, Right, Center). We find that performance on the Center ideology is low, due to the relative lack of training data compared to Left and Right ideologies. In addition, the late-fusion multimodal models surprisingly perform worse than the text-only models. Because performance on the Center class was poor, we also experimented with a 2-way classification of Left vs. Right, whose results are shown in Table G.3. In this experiment, we again find that pretraining with our triplet margin loss improves performance, especially on Right-leaning tweets, over vision-only baselines.
| Category | Model | Overall Acc. | Left | Right |
|---|---|---|---|---|
| Text-only | RoBERTa | 76.82 ± 0.32 | 78.08 ± 2.40 | 75.62 ± 2.02 |
| POLITICS | 76.68 ± 1.57 | 87.43 ± 3.98 | 66.36 ± 6.15 | |
| Vision-only | Swin-S | 70.90 ± 0.55 | 75.05 ± 0.96 | 66.91 ± 1.82 |
| \hdashlineLate Fusion | RoBERTa+Swin-S+Cross-modal Attn. | |||
| No Further Pre-training | 77.79 ± 0.17 | 84.88 ± 1.09 | 70.98 ± 0.72 | |
| VirTex-style+Triplet Margin | 80.82 ± 1.05 | 87.32 ± 1.09 | 74.59 ± 1.19 | |
| POLITICS+Swin-S+Cross-modal Attn. | ||||
| No Further Pre-training | 79.06 ± 0.14 | 84.65 ± 0.54 | 73.69 ± 0.24 | |
| VirTex-style+Triplet Margin | 81.72 ± 0.87 | 87.79 ± 0.69 | 75.90 ± 0.70 | |
| Twitter (3-way) | |||||
|---|---|---|---|---|---|
| Category | Model | Overall Acc. | Left | Center | Right |
| Text-only | RoBERTa | 68.67 ± 0.32 | 70.29 ± 2.33 | 28.58 ± 1.95 | 78.10 ± 1.51 |
| POLITICS | 70.32 ± 0.18 | 75.29 ± 2.64 | 32.51 ± 4.16 | 76.65 ± 2.28 | |
| Vision-only | Swin-S | 51.86 ± 0.61 | 54.75 ± 4.26 | 17.47 ± 2.80 | 58.57 ± 3.57 |
| \hdashlineLate Fusion | RoBERTa+Swin-S+Cross-modal Attn. | ||||
| No Further Pre-training | 60.95 ± 1.87 | 61.54 ± 2.91 | 22.42 ± 3.30 | 70.89 ± 3.97 | |
| POLITICS+Swin-S+Cross-modal Attn. | |||||
| No Further Pre-training | 65.90 ± 0.63 | 68.87 ± 3.83 | 25.18 ± 3.32 | 74.26 ± 3.08 | |
| Twitter (2-way, center filtered out) | ||||
|---|---|---|---|---|
| Category | Model | Overall Acc. | Left | Right |
| Text-only | RoBERTa | 77.70 ± 0.43 | 72.48 ± 1.04 | 82.45 ± 0.75 |
| POLITICS | 78.80 ± 0.15 | 77.88 ± 1.60 | 79.67 ± 1.62 | |
| Vision-only | Swin-S | 62.53 ± 0.85 | 65.04 ± 2.72 | 60.13 ± 3.55 |
| \hdashlineLate Fusion | RoBERTa+Swin-S+Cross-modal Attn. | |||
| No Further Pre-training | 78.50 ± 0.06 | 76.01 ± 1.61 | 80.89 ± 1.58 | |
| VirTex-style+Triplet Margin | 79.49 ± 0.44 | 79.33 ± 2.81 | 79.64 ± 2.57 | |
| POLITICS+Swin-S+Cross-modal Attn. | ||||
| No Further Pre-training | 78.82 ± 0.69 | 78.33 ± 1.11 | 79.29 ± 2.04 | |
| VirTex-style+Triplet Margin | 79.85 ± 0.18 | 78.07 ± 1.70 | 81.55 ± 1.31 | |