DUVET: Spatially Resolved Observations of Star Formation Regulation via Galactic Outflows in a Starbursting Disk Galaxy
Abstract
We compare 500 pc scale, resolved observations of ionised and molecular gas for the starbursting disk galaxy IRAS08339+6517, using measurements from KCWI and NOEMA. We explore the relationship of the star formation driven ionised gas outflows with colocated galaxy properties. We find a roughly linear relationship between the outflow mass flux () and star formation rate surface density (), , and a strong correlation between and the gas depletion time, such that . Moreover, we find these outflows are so-called “breakout” outflows, according to the relationship between the gas fraction and disk kinematics. Assuming that ionised outflow mass scales with total outflow mass, our observations suggest that the regions of highest in IRAS08 are removing more gas via the outflow than through the conversion of gas into stars. Our results are consistent with a picture in which the outflow limits the ability for a region of a disk to maintain short depletion times. Our results underline the need for resolved observations of outflows in more galaxies.
1 Introduction
Galactic outflows are observed ubiquitously in star-forming galaxies across cosmic time (Heckman et al., 2000; Chen et al., 2010; Steidel et al., 2010; Newman et al., 2012; Rubin et al., 2014; Arribas et al., 2014; Rodríguez del Pino et al., 2019; Bolatto et al., 2021; Veilleux et al., 2020) and have a critical role in galaxy evolution models (e.g. Somerville & Davé, 2015). When star formation driven outflows are not included, models are unable to reproduce basic galaxy properties such as the galaxy mass function, galaxy sizes, and the Kennicutt-Schmidt Law (see review by Somerville & Davé, 2015). The most energetic winds are observed coming from active galactic nuclei (Veilleux et al., 2005; Fluetsch et al., 2019; Förster Schreiber et al., 2019), which send gas into the halo (Nelson et al., 2019; Oppenheimer et al., 2020). Galactic fountains arising from clusters of intense star formation remove gas from their local region (e.g. Bolatto et al., 2013b; Leroy et al., 2015a; Salak et al., 2020), which is then recycled into the disk after moving through the lower regions of the halo.
Star formation driven outflows are widely thought to play multiple roles in regulating star formation. One such role is to directly remove gas from regions of active star formation, for example as observed in nearby starbursts NGC 253 (Bolatto et al., 2013b) and M 82 (Leroy et al., 2015b). In such environments the mass loss rate due to the wind can be comparable to the rate at which gas is converted into stars.
Moreover, theory argues that the energy and momentum injected from supernovae driven winds plays a regulatory role by increasing the turbulence of the interstellar medium (e.g Ostriker et al., 2010; Faucher-Giguère et al., 2013; Hayward & Hopkins, 2017; Krumholz et al., 2018). The increased turbulence is critical to providing pressure support in galaxies, setting the thickness of the gas disk and preventing runaway star formation, and is known as star formation feedback. This regulation generates a local balance between the inward gravitational pressure on the disk, characterised by the molecular and stellar mass surface densities, and the outward pressure provided by the feedback, which is typically characterised by the star formation rate (SFR) surface density multiplied by an efficiency factor (for description see Kim et al., 2013). Observations do recover positive correlations of gravitational pressure with SFR surface density over 6 orders-of-magnitude (Fisher et al., 2019; Barrera-Ballesteros et al., 2021; Sun et al., 2020; Girard et al., 2021), albeit those published thus far find shallower power-law slopes than theory predicts. Ostriker & Kim (2022) argued that this may be due to systematics in the estimations of pressure. Lenkić et al. in prep will investigate this. It is not clear how outflows may impact feedback regulated star formation theory. Theoretical work employing results from supernova clustering suggest that clustering may lead to increases in the momentum input into the ISM (Gentry et al., 2020; Fielding et al., 2018). Conversely, Orr et al. (2022) argued that if winds leave the disk they carry momentum with them, which might reduce turbulence.
Current theory therefore implies that supernova driven winds (or outflows) play multiple roles (1) removing gas directly from disks and (2) injecting turbulence into the ISM. Resolved observations of outflows are, however, challenging due to the intrinsic faintness of the spectral features of the wind. We use data from the DUVET sample (Fisher et al. in prep) that uses high signal-to-noise observations from the Keck Cosmic Web Imager (KCWI) to study resolved properties of outflows in rare starburst disk galaxies at (e.g Cameron et al., 2021; Reichardt Chu et al., 2022). In this paper, we focus on using resolved outflow observations of IRAS 08339+6517 from the DUVET sample to compare the properties of molecular gas and star formation.
The paper is organised as follows. We describe our target galaxy, IRAS 08339+6517 (hereafter IRAS08), in Section 2.1. Our observations and data reduction of IRAS08 for ionised gas are described in Section 2.2, and for molecular gas in Section 2.3, together with our methods. In Section 2.4 we find resolved stellar masses for IRAS08. In Sections 3.1, 3.2 and 3.3 we explore the relationship between outflows and the star formation rate surface density and the molecular gas surface density. In Sections 3.4 and 3.5 we compare our resolved outflow observations to models. A summary of our results and conclusions is presented in Section 4. We assume a flat CDM cosmology with and (Hinshaw et al., 2013).
2 Observations and Methods
Our analysis combines observations of outflows from Reichardt Chu et al. (2022) (hereafter RC22) with observations of molecular gas from Fisher et al. (2022) (hereafter F22). All data have been published, and the data reduction methods are described in more detail in those papers. We briefly summarise these data and methods here.
2.1 IRAS 08339+6517
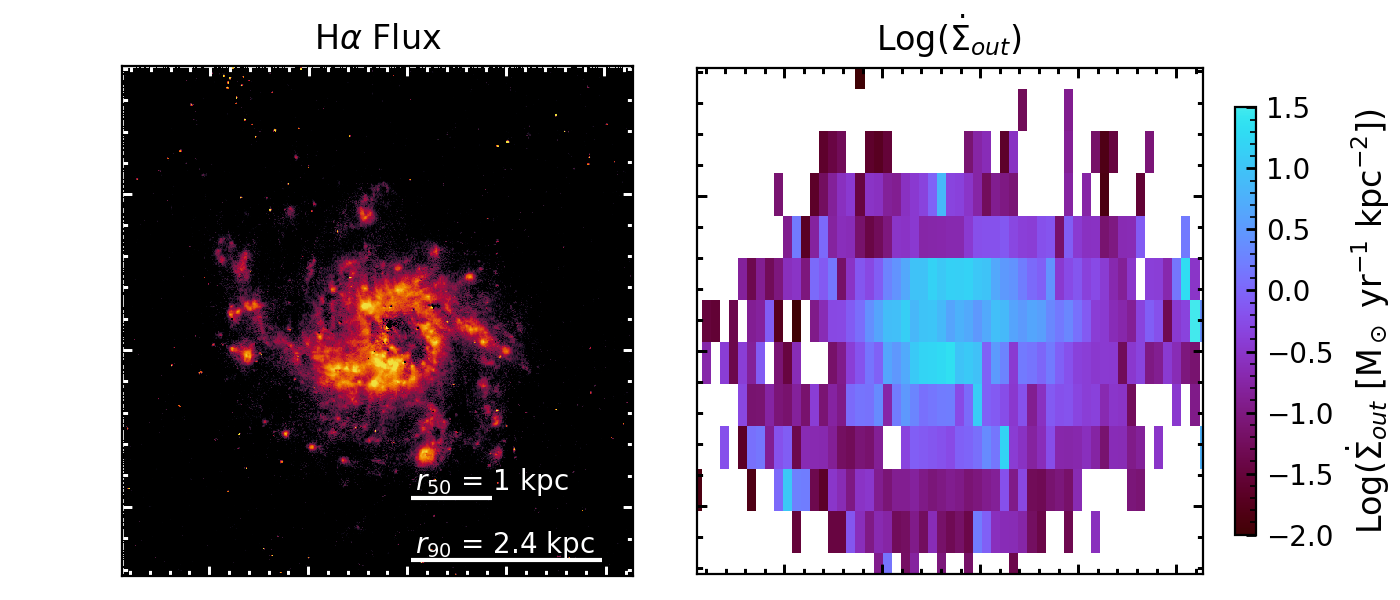
IRAS08 is a face-on, UV-bright, blue-compact galaxy at . It is a outlier from the star forming main sequence. In Figure 1 we show the H flux map from , which shows IRAS08’s star forming ring. IRAS08’s young stellar population has been shown to be consistent with containing super-star clusters in /COS spectra (Otí-Floranes et al., 2014). For more physical properties of IRAS08, see Table 1.
| Property | Value | Reference | |
|---|---|---|---|
| Redshift | 0.0191 | Kim et al. (1995) | |
| Inclination | Leitherer et al. (2013) | ||
| Stellar mass | F22 | ||
| Star formation rate | SFR | F22 | |
| Stellar population age | 10 Myr | Leitherer et al. (2002) | |
| Molecular gas fraction | 17% | F22 | |
| Toomre stability parameter | 0.5 | F22 | |
| Resolved ionised gas mass outflow rate ( cm-3) | 34.7 | RC22 | |
| Resolved ionised gas mass outflow rate ( cm-3) | 11.6 | RC22 | |
| Total galaxy ionised gas mass loading factor (from absorption) | 0.07 | Chisholm et al. (2017) | |
| Resolved ionised gas mass loading factor ( cm-3) | 3.2 | RC22 |
2.2 KCWI observations of SFR and outflows
IRAS08 was observed with the Keck Cosmic Web Imager (KCWI, Morrissey et al., 2018) using the BM grating in the Large Slicer mode (FOV: ) for 20 minutes with the central wavelength setting at Å. These observations are described in both RC22 and F22. The data were reduced using the standard IDL pipeline (Version 1.1.0) and in-frame sky subtraction. A continuum fit and subtraction was applied using pPXF (Cappellari, 2017) with BPASS templates (Version 2.2.1 Stanway & Eldridge, 2018).
To measure SFR and outflow properties we follow a very similar procedure as described in RC22. The most significant adjustment is that we modify the adopted electron density (discussed below).
KCWI spaxels are non-square, with dimensions for the large slicer. RC22 carried out an analysis in which outflows were fit in various spatial bin sizes. They found that correlations of outflow physical properties are more stable for bin sizes of 51 spatial sampling of the KCWI data and larger, summing the spectra in each set of 51 spaxels. In order to more easily interpret the data, we resample all data sets to match this 51 spatial sampling of the KCWI data. This binning corresponds to sizes of , which in physical scale is 0.57 kpc0.53 kpc.
Following the method described in RC22, to identify outflows we fit both a single and a double Gaussian profile to the H emission lines in spaxels where the continuum has a signal-to-noise greater than 10 per pixel. We used the Bayesian Information Criterion (BIC) to decide whether the extra parameters in the double Gaussian fit are required. When two Gaussians are required, we assume that the broad second Gaussian represents the outflowing gas (see RC22 for more detail).
Using the double Gaussian fits, we calculated the outflow velocity
| (1) |
where and are the velocities at the centre of the narrow and broad Gaussians respectively, and is the standard deviation of the broad Gaussian. This definition of is comparable to the velocity at 90% of the continuum, , measured from absorption line studies (e.g. Rupke et al., 2005; Chisholm et al., 2015, 2016), and similar to previous emission line studies (e.g. Genzel et al., 2011; Davies et al., 2019; Fluetsch et al., 2019).
The mass outflow rate is defined as
| (2) |
where is the atomic mass of Hydrogen, is the H emissivity at electron temperature K for case B recombination (, Osterbrock & Ferland, 2006), is the local electron density in the outflow, is the radial extent of the outflow, and is the extinction-corrected H luminosity of the broad component. We assume kpc; see the discussion in RC22 for motivation and the likely systematic uncertainty on .
RC22 showed that the main driver of is the luminosity of the broad component, with only a small dependence on the outflow velocity. In IRAS08 there is a order-of-magnitude variation in the broad-component luminosity, but only a factor of a few change in velocity.
There is an explicit inverse dependence of on . Since depends inversely on , different assumptions in directly change derived . Cameron et al. (2021) provides a direct measurement of Te from the [OIII] 4363 line for MRK 1486. They found that Te decreases in the outflow compared to the disk by an order of 1000 K, with a typical outflow of 12,000-14,000 K. IRAS08 has a higher metallicity than MRK 1486, (0.7 , López-Sánchez et al., 2006), which corresponds to a lower (Kewley et al., 2019). Indeed, López-Sánchez et al. (2006) derives T K for IRAS08. There is no evidence that the metallicity varies across the disk of IRAS08 (López-Sánchez et al., 2006; Fisher et al., 2022). We, therefore, assume a constant throughout our outflow. Using the code PyNeb (Luridiana et al., 2015) we find that if we assume an electron temperature for the outflow of K, the derived would be 1.4 higher than we find for our standard assumption of K. Conversely, if we assume a high electron temperature of K, the would be 0.7 lower.
We do not know a priori what electron density should be adopted for the outflows. We only have access to the [OII] density tracer, but the broad outflow components are blended in the spectrum such that we do not have sufficient spectral resolution to measure the electron density of the outflow in IRAS08. We therefore must adopt a value. The electron density of IRAS08 based on the total integrated [OII] emission line ratio from the galaxy and outflow, together, is of order . Standard assumptions expect to decline in the outflow compared to the disk, though recent work suggests this may not be the case (Förster Schreiber et al., 2019; Fluetsch et al., 2021). In the current paper, we are specifically focused on the amount of mass in the outflow. We therefore adopt the electron density scaling as done by Veilleux & Rupke (2002), where the mass outflow is normalised to . We estimate that introduces a systematic uncertainty of order 0.4-0.5 dex on the outflow mass. In a previous work, RC22 made a different assumption for in order to compare with other observations. We discuss this further in Sections 3.3 and 3.4. To illustrate this systematic uncertainty, in Figures 2, 4 and 6 we include points that represent a higher assumption as well as the assumption, as described in associated captions.
To calculate the star formation rate of each spaxel in IRAS08, we use the narrow line flux from the H fits, according to the conversion
| (3) |
Here C M⊙ yr-1 (erg s-1)-1, which assumes a Kroupa & Weidner (2003) Initial Mass Function (Hao et al., 2011). is the luminosity ratio for electron temperature K and case B recombination (Osterbrock & Ferland, 2006). is the extinction derived from the observed HH ratios and a Calzetti (2001) attenuation curve. is the observed H luminosity.
RC22 found the spatially resolved velocity, , of the ionised gas outflow to be consistent with a shallow slope in , with , similar to simulations (e.g. Kim et al., 2020). IRAS08 has an integrated mass outflow rate in ionised gas of and a corresponding ionised gas mass loading factor of when assuming (RC22). In RC22 the integrated mass loading factor was calculated using SFRs from only those regions of IRAS08 where evidence of outflows is observed. These values of , and are comparable to strong winds in well studied local galaxies like NGC 253 (Bolatto et al., 2013b) and M 82 (Shopbell & Bland-Hawthorn, 1998), and suggest that the outflow is removing gas from the galaxy at comparable rates to the star formation.
2.3 NOEMA CO(2-1) observations of molecular gas
CO(2-1) was observed in IRAS08 using the NOrthern Extended Millimeter Array (NOEMA) for 13 hours in A configuration and 5.5 hours in C configuration. Observations used the PolyFix correlator tuned to a sky frequency of 226.215 GHz in USB with a channel width of 2.7 km s-1 using 9 antennas. We recover CO emission over twice the half-light radius of the stars in IRAS08 ( kpc or 2.5″) with a point source sensitivity of 1.4 mJy beam-1 in 20 km s-1 of bandwidth, and with a beam size of arcsec2 ( pc2). For further details on the observations and data reduction, see F22.
To convert CO to H2, we consider both the metallicity and compactness of IRAS08 in selecting the appropriate conversion factor, . IRAS08 has a low metallicity (0.7 , López-Sánchez et al., 2006), indicating that a higher should be used. On the other hand, IRAS08 is also a compact and starbursting galaxy, suggesting a lower . Following the parametrisations from Bolatto et al. (2013a) these two properties offset each other in IRAS08. For simplicity’s sake we use a Milky Way corrected to the CO(2-1) transition using a line ratio of CO(2-1)/CO(1-0)=0.7 such that . The assumption of introduces a factor of 2-3 systematic uncertainty in the gas mass surface density that is difficult to characterise further due to the competing effects of the metallicity and the starburst.
The molecular gas fraction of IRAS08 has been measured to be of order % (F22). Toomre’s characterises the stability of a self-gravitating disk, where disks with high velocity dispersion are unstable if (Romeo et al., 2010). Dynamically, F22 show that IRAS08 is consistent with a galaxy wide violent disk instability (Dekel et al., 2009) with across most of the disk, and high molecular gas velocity dispersions of km s-1.
F22 used NOEMA A+C observations of IRAS08 to study the star formation efficiency per free-fall time, , where the free-fall time is . They found at the 100 pc scale that reaches high values in the galaxy center of , which translates to a variable gas depletion time that decreases from Gyr in the disk to 0.1 Gyr in the galaxy center. The found for IRAS08 by F22 is in the range of values expected from the models of Grudić et al. (2018), which we will discuss further in the context of outflows later in this paper. A strongly variable is not well explained by current theory, and motivates our comparison to the impact that outflows may have on the star formation regulation.
2.4 Stellar Mass
We determine the stellar masses in 0.53 kpc0.57 kpc regions by applying stellar population fits using the CIGALE code (Boquien et al., 2019) to HST/ACS image filters HRC F330W, WFC F435W, WFC F550M and Spitzer/IRAC Ch1. Before fitting, all stellar continuum images are rotated, convolved to matched PSF and resampled to match the sampling of the KCWI data using Python routines. We remove backgrounds in all images by the standard process of fitting a simple surface to the images in galaxy emission free regions. In the case of the HST images the background is near to zero. We only measure the stellar mass in regions of the image with significant detections of CO(2-1) and the outflow. This restricts the measurement to regions of the stellar continuum images with or higher in individual resolution elements.
To carry out the fitting, we assume the Calzetti et al. (2000) extinction law, allowing for a range of extinctions between We note the typical extinction in IRAS08 is quite low, similar to derivations from the Balmer decrement. We follow the standard prescription for starburst galaxies as outlined in CIGALE papers (e.g. Boquien et al., 2019), and fit the star formation history with a delayed starburst superimposed on an exponentially decaying star formation rate. The burst in each pixel is restricted to be less than 15% of the mass. Ambachew et al. (2022) studied the impact of the choice of SFH parametrisation using CIGALE on derived stellar masses in galaxies similar to IRAS08, and find that it has only a small effect. Although we calculate the SFR assuming a Kroupa IMF, CIGALE only implements the Chabrier IMF, which has been shown to under estimate stellar mass-to-light ratios by 5-10% in the ages that we expect for IRAS08 (Conroy et al., 2009). We, therefore, scale the derived masses by 1.08 to match the expected mass-to-light ratio of Kroupa IMFs (Conroy et al., 2009). We note that this is a minor adjustment compared to the systematic uncertainty in point-to-point measurements of stellar masses in high SFR galaxies. The typical mass-to-light ratio derived from this is of order , which is consistent with similarly young, high SFR surface density systems (Ambachew et al., 2022). We find that the overall fit recovers a stellar mass of 1.1 M⊙ for the entire galaxy, which is similar as reported elsewhere (e.g. Leitherer et al., 2013; López-Sánchez et al., 2006).
2.5 Prototype Outflow Galaxies For Comparison
We will compare the molecular gas surface density, , and the star formation rate surface density, , from IRAS08 to literature values for outflow galaxies in the local Universe (M82, NGC 253 and NGC 1482). For these galaxies throughout this work we adopt values of and that are intended to be from the area of the galaxy near the base of and likely driving the outflow, rather than the global galaxy integrated quantity. For M82, this corresponds to a kiloparsec wide region, which has a molecular gas surface density of M⊙ pc-2 and SFR surface density of 2.5-3 M⊙ yr-1 kpc-2 (Leroy et al., 2015b; Kennicutt, 1989).
For NGC 253, we use the values given by Leroy et al. (2015a) for the starbursting nuclear disk, M⊙ pc-2 and M⊙ yr-1 kpc-2.
For NGC 1482, we use the central kiloparsec values from Salak et al. (2020), M⊙ pc-2 and M⊙ yr-1 kpc-2.
Note that values of the local outflows (M 82, NGC 253, & NGC 1482) are only used for context. We never include them in fitting relationships.
3 Relationship between molecular gas depletion and outflows
3.1 and
The outflow mass flux is defined as the mass outflow rate normalised by the surface area of the measurement, . This quantity is described in Kim & Ostriker (2017), and is useful for resolved outflow studies. We show the ionised gas outflow mass flux, , for IRAS08 found using observations with KCWI on Keck II in Figure 1. Our NOEMA observations were not deep enough to detect broad line emission that could be associated with the molecular component of the outflow.
It is commonly expected that a higher star formation rate surface density, , drives a higher mass outflow rate, (e.g. Hopkins et al., 2012; Hayward & Hopkins, 2017; Arribas et al., 2014; Heckman et al., 2015; Muratov et al., 2015; Roberts-Borsani et al., 2020). In Figure 2 we plot against for IRAS08 at pc sampling scale.
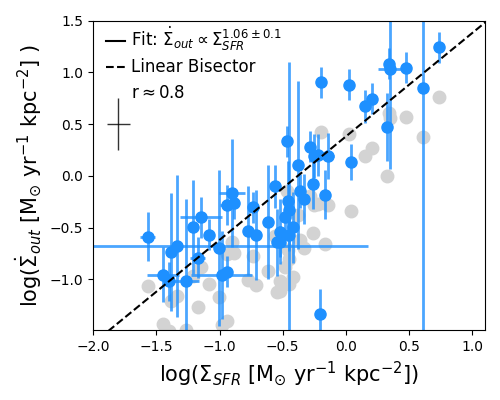
In IRAS08 we measure M⊙ yr-1 kpc-2 to kpc-2 over 2 orders of magnitude in (Fig. 2). We find a Pearson correlation coefficient of (p-value ) for log()-log(). There is a large range in errorbars on , which would bias the fit to those few points at high signal-to-noise. We, therefore, place a minimum uncertainty of 0.15 dex on for the fit. Using the method of orthogonal distance regression, we find the fit to be
| (4) |
In Fig. 2 we also show the linear bisector. If we do not constrain the errorbars the fit returns a slightly non-linear powerlaw of . The root-mean-squared (RMS) deviation of the fit is essentially equivalent to the RMS of the bisecting line, at 0.36 dex. Therefore, while the regression to the unconstrained errorbars returns a slightly nonlinear fit, our results are consistent with a linear relationship (within 1.5).
While there are no observational measurements that we are aware of that compare to , there are some studies that investigate correlations between the integrated star formation and outflow mass rates (e.g. Heckman et al., 2015). We note that there are significant differences between these measurements. We are measuring and in ionised gas in equally sized areas in a single galaxy at a fixed distance. Fluetsch et al. (2019) found a slightly non-linear relationship for molecular gas outflows in local star forming galaxies. Avery et al. (2021) found a similarly linear slope of for integrated outflows on MaNGA galaxies using H to measure outflows.
To compare to our results from IRAS08, we calculate the mass outflow rate in ionised gas of M 82 and NGC 1482 from the total H luminosity and outflow velocity using values from Shopbell & Bland-Hawthorn (1998) and Veilleux & Rupke (2002) respectively. For each of these, we assume, as we do for IRAS08, cm-3 and an kpc. We find ionised gas mass outflow rates of 2 M⊙ yr-1 for M 82 (Shopbell & Bland-Hawthorn, 1998) and 0.6 M⊙ yr-1 for NGC 1482 (Veilleux & Rupke, 2002). These values translate to M⊙ yr-1 kpc-2 for M 82, and 0.75 M⊙ yr-1 kpc-2 for NGC 1482. We note these are measured in edge-on systems and are thus quite different methods of estimating the mass outflow rate. Nonetheless they are in the range of what we measure for the high regions in IRAS08 (see Fig. 2).
The relationship between and we observe in IRAS08 is broadly consistent with both theoretical expectations and observations of entire galaxies. In the subsequent analysis it will be important to keep track of when the fundamental driver of any relationship may be a reflection of this strong correlation in Fig. 2.
3.2 Connecting relationship to outflows
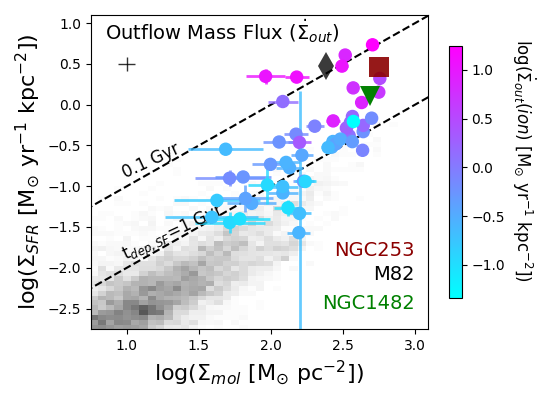
There is a long history of literature discussing the resolved observations of the relationship between and the molecular gas surface density, , in galaxies (Kennicutt, 1989; Bigiel et al., 2008; Genzel et al., 2011; Leroy et al., 2013; Kennicutt Jr & Evans, 2012) and theories explaining it (Ostriker et al., 2010; Faucher-Giguère et al., 2013; Krumholz et al., 2018; Hayward & Hopkins, 2017). F22 recently analysed the resolved molecular gas depletion timescale for IRAS08. They find it is consistent with a steep power-law slope for N, with , similar to starburst outflow systems like NGC 253, M 82 and NGC 1482.
In Figure 3 we show the relation between and the molecular gas surface density, , for IRAS08 in 0.5 kpc sampling scale. The high center of IRAS08 is comparable in both and to other well-known outflow galaxies in the local Universe (NGC 253, M 82 and NGC 1482).
We colour the IRAS08 points by . In Fig. 2 we showed a tight correlation between and . However, it is clear from Fig. 3 that there is a large spread in for a given value of . The Pearson correlation coefficient is (p-value ) for log()-log(). This reduces significantly to (p-value ) for log()-log().
The average error on the points is 0.06 dex. This typically small value is due to the very high S/N of the KCWI data. One point in Figures 2 and 3 shows a much larger error, and comes from a measurement made with lower S/N than the remainder of the galaxy.
Figure 3 shows a clear trend that regions of IRAS08 with shorter molecular gas depletion times (indicated by the dashed lines) have larger values of , as indicated by the coloured points. A powerlaw fit to the relationship yields a power-law slope that is close-to-linear, and is likely driven by the correlation in Fig. 2. We find
| (5) |
with a correlation coefficient of and a p-value of roughly .
We can also estimate the momentum flux, defined as . We do not plot these values, because is primarily determined by and therefore has nearly identical dependency as . The momentum flux we measure increases from to . The highest values of are similar to what is derived for molecular gas in M 82 (Leroy et al., 2015b). The correlation for IRAS08 between the momentum flux and the star formation depletion time is significant and non-linear (Pearson correlation coefficient , p-value ), implying that regions in IRAS08 which are more efficient at turning gas into stars are increasingly more efficient at generating significant momentum in the outflow.
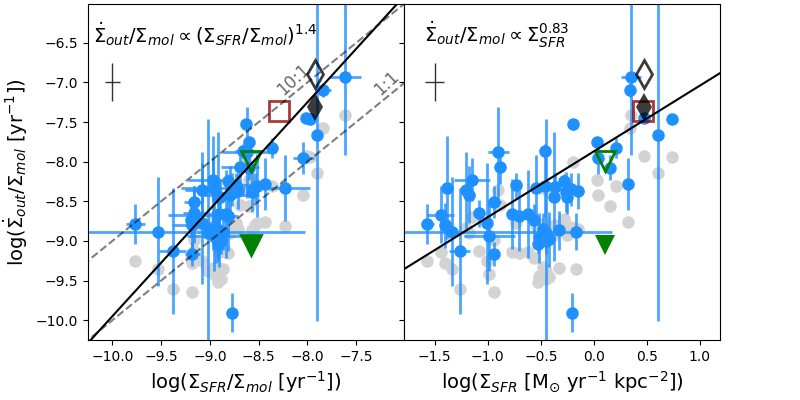
3.3 Outflow Efficiency
In Figure 4, we compare , which we refer to as the “outflow efficiency” of ionised gas, to and to the unnormalised star formation rate surface density (). The outflow efficiency may be interpreted as the rate at which the outflow exhausts the gas mass with the measured mass outflow rate (assuming there is no supply of fresh gas). We will refer to as the star formation efficiency for ease of discussion, noting the important distinction between this quantity and the star formation efficiency per free fall time (discussed in F22, ).
In the left panel of Fig. 4 we compare the outflow efficiency to the star formation efficiency. When outflow efficiency is greater than star formation efficiency this suggests that outflows more rapidly remove gas from the local region than does the conversion of gas into new stars. We note that the ratio of these two quantities gives the more well-known metric, the mass loading factor , which we will consider in Section 3.4. In IRAS08 the average log( [yr-1]) with standard deviation of 0.55 dex. We find that 87% of measured regions in IRAS08 fall above the one-to-one line in this space, with a median ratio of 2.4, when assuming cm-3. This is similar to unresolved observations of similar quantities, and , in Fluetsch et al. (2019). For star formation driven winds in 8 galaxies they found that the galaxies have longer star formation depletion times (smaller SFR/) in those galaxies with longer outflow depletion times (smaller ).
We find the outflow efficiency and star formation efficiency are correlated with a Pearson correlation coefficient of (p-value ). We find the resulting fit, by method of error-weighted orthogonal distance regression, to be
| (6) |
This steeper than linear slope suggests that in regions of high star formation efficiency, the outflow dominates slightly more than it does in regions with star formation similar to that in typical spiral disks. Note that a typical depletion time of Gyr, as is found in spirals (Leroy et al., 2013), corresponds to a star formation efficiency of dex in Fig. 4. It is technically challenging, with present day instrumentation, to observe outflows in typical spirals due to the lower and smaller velocity offset (e.g. Roberts-Borsani et al., 2020). Moreover, in the main disks of spirals the ratio of changes by less than 20% with galactocentric distance within 8 kpc, not including the galactic nucleus (Leroy et al., 2013). It is, therefore, not clear how this relationship would behave in the disks of spiral galaxies.
We note that the systematic uncertainty introduced from would not necessarily change the trend, however, it may imply that the ionised gas outflow efficiency is more comparable to the star formation efficiency. If the of the outflow changes with within a galaxy, this would alter the slope in Fig. 4, but we do not have any results to suggest whether this occurs. Another large systematic uncertainty, however, is the ratio of the outflow mass flux in different phases, specifically the ionised-to-molecular gas ratio. Molecular gas is the more dominant phase of outflow mass (review Veilleux et al., 2020), which increases the total by a factor of 5-10 (Fluetsch et al., 2019; Herrera-Camus et al., 2020). This suggests that even with a higher , outflows likely dominate over star formation in removing the gas in the starbursting center of IRAS08. If the ratio of ions-to-molecules changes with this too would affect the relationship between the outflow efficiency and star formation efficiency. In four galaxies, Fluetsch et al. (2019) found a relatively constant relationship between the mass outflow rate measured in ions compared to molecules.
In the right panel of Fig. 4 we compare outflow efficiency to the SFR surface density. There is likewise a positive correlation between the quantities such that outflows co-located with regions of high have higher efficiency. We find a correlation coefficient of (p-value ). We find that,
| (7) |
We can compare this correlation to that of Fig. 2, which has a steeper power law, higher correlation coefficient, and less scatter in the fit as indicated by the fit uncertainties. The larger correlation coefficient implies that the inclusion of the galactic disk molecular gas mass in the outflow efficiency increases scatter in Fig. 4.
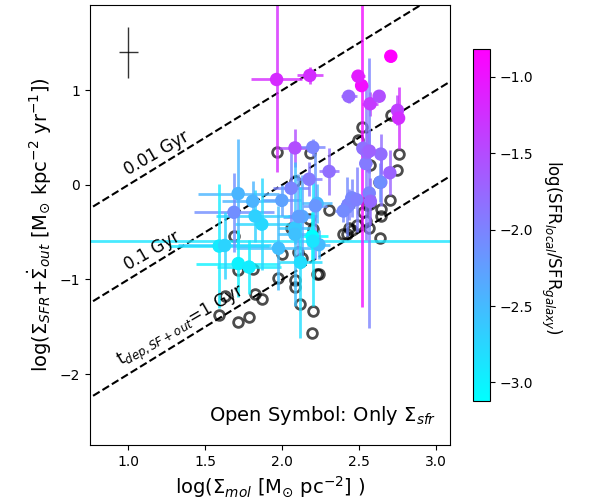
In Fig. 5 we compare the molecular gas surface density to the combination of both the SFR surface density and outflow mass flux. The combination of can be thought of as a more complete estimate of the removal of gas from the star forming region, noting of course that the addition of molecular outflows are needed for a full accounting of the outflow mass. The figure clearly demonstrates that the addition of both the and , together, shortens the depletion time significantly in the high regions by nearly an order-of-magnitude.
Similar to the depletion time measured with only the star formation, the combination of outflow and star formation results in a depletion time that varies within the galaxy and with local . This is not surprising given our result in Fig. 2 that . We find for radii within 1 kpc the median outflow+star formation depletion time () is of order 0.05 Gyr. We find a similar value if we select those regions with M⊙ yr-1 kpc-2. This depletion time increases to 0.3 Gyr for larger radii and lower . We note that while 1 kpc is a small area, it represents over 50% of the total star formation in the galaxy, as indicated by the colours in Fig. 5.
We reiterate that the main systematic uncertainty in our results is that the observations of outflows are only of a single phase, and that the addition of the molecular phase could increase the outflow mass rate by as much as an order-of-magnitude. This would reduce the total depletion time to only 0.005-0.01 Gyr in the center of IRAS08, which is very short, and is comparable to the free-fall time found for these regions (F22).
3.4 Mass-loading Factors
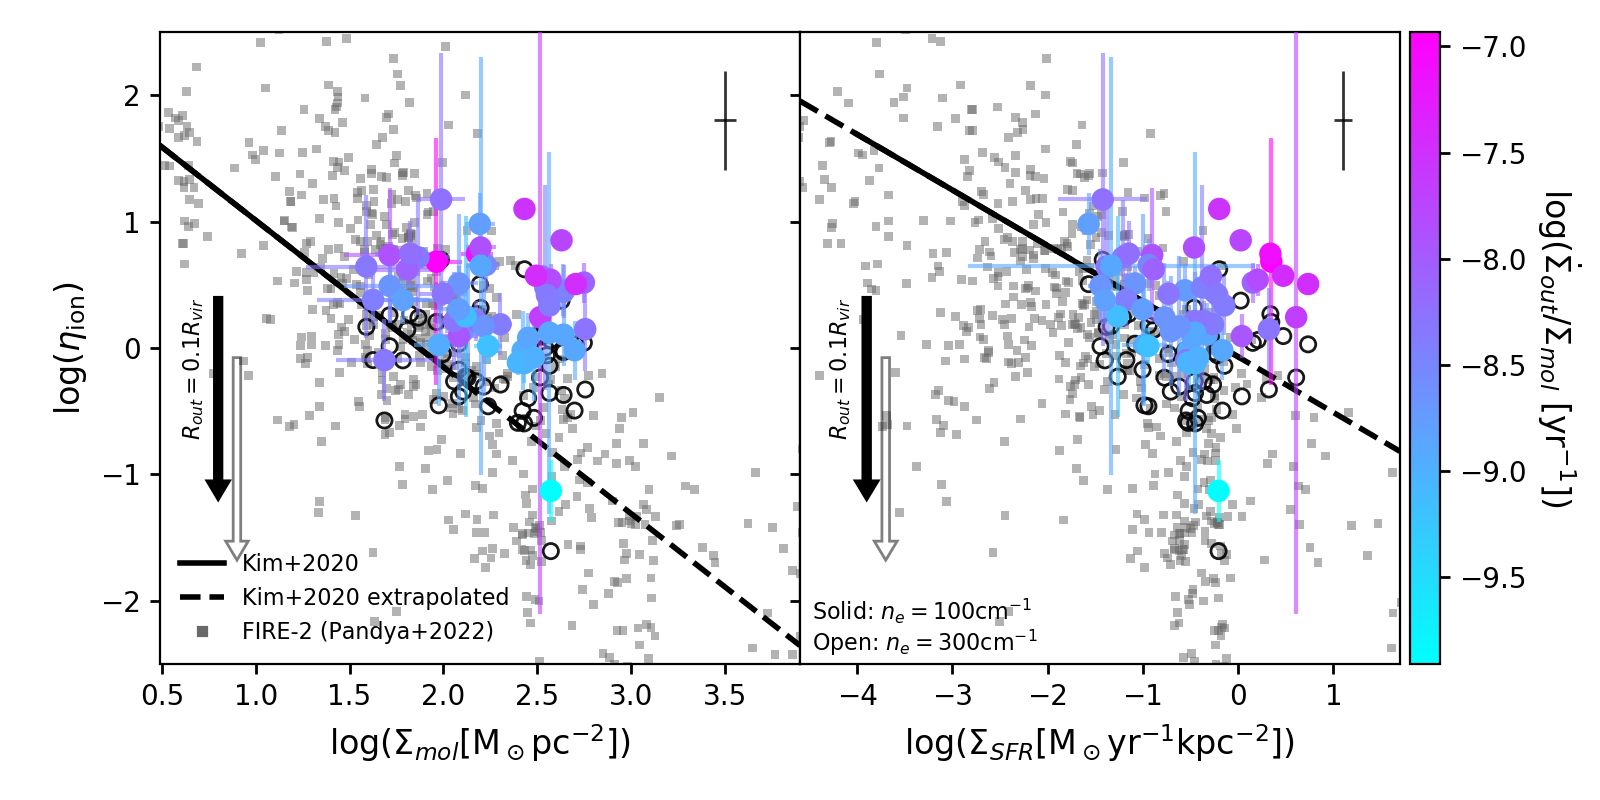
In Figure 6 we compare the mass loading factor, , to and in IRAS08. We additionally overplot results from the recent FIRE-2 simulations (Pandya et al., 2021) and the SMAUG-TIGRESS simulation (Kim et al., 2020). A number of simulations and analytic theories predict a decreasing with increasing (recently Fielding et al., 2017; Li et al., 2017; Kim et al., 2020; Pandya et al., 2021). Observations are mixed as to how well these correlate (Arribas et al., 2014; Roberts-Borsani et al., 2020).
In IRAS08 we find very little correlation between and . We find a Pearson correlation coefficient of (p-value ) for . We note, however, that values of in IRAS08 cover a fairly small range compared to the FIRE-2 simulations. We also note that the FIRE-2 simulations calculate the total values of and for entire galaxy halos, rather than resolved regions. Moreover, the values of IRAS08, while being on the high side of the FIRE-2 data and over the Kim et al. (2020) correlation, are not completely discrepant. Nevertheless, our data are consistent with no correlation between and . This is in contrast to the steeper trend expected from both the TIGRESS and FIRE-2 simulations (Kim et al., 2020; Pandya et al., 2021). It could be that we should expect different relations when comparing our resolved observations to simulations on different spatial scales. In order to recover the high scatter correlation which simulations predict between and , we may need to include observations of more galaxies covering a larger range in .
For we similarly find a weak-to-no trend (Pearson correlation coefficient of , p-value ). We note that below M⊙ yr-1 kpc the data in IRAS08 is much more consistent with theoretical expectations from Kim et al. (2020) and is consistent with a negative correlation (correlation coefficient of , p-value ). It is possible that regions of the galaxy below this follow the predicted relationship, but that in regions with higher the outflow efficiency increases (see Fig. 4) and we therefore observe a flat . It is important to also point out that the simulations of Kim et al. (2020) are only run to M⊙ yr-1 kpc-2 and to M⊙ pc-2. We have extrapolated their - and - relations past this parameter space in order to compare to our observations of a starbursting environment. It is unclear whether this extrapolation should hold in starbursting environments.
We note that the systematic uncertainty of is such that assuming higher values of would bring our observed into better agreement with the Kim et al. (2020) prediction. This would, however, simultaneously make the mass-loading factors too low in comparison to .
While we observe the molecular gas surface density , the TIGRESS simulations measure the total ISM gas mass divided by the horizontal area of the disk included in the box of the simulation. Their horizontal box sizes range from 512 pc to 2048 pc. The largest of these is the area of our pixels. Moreover, we need to be mindful that the comparison to the FIRE-2 results is not an apples-to-apples comparison. Pandya et al. (2021) defined particles as outflows if they flow away from the galaxy disk and reach with enough energy remaining to make it to a larger radius. To convert the down-the-barrel observations of outflows into a mass outflow rate we assume an “outflow radius” of for our target (for more details, see RC22, ). This is four times smaller than the used by Pandya et al. (2021), which would be for a galaxy of IRAS08’s mass. We don’t know how the velocity and density profiles of the outflow change with radius, however assuming everything stays the same, we rescale our data to use . Rescaling our data decreases the median value of from 2.5 to 0.06. This rescaling introduces significant uncertainty. It would be useful in the future for simulations to estimate the properties of outflows such as the mass loading factor of the warm ionised gas in the region less than 10 kpc from the galaxy disk, where we observationally measure outflow properties.
3.5 Breakout Outflows
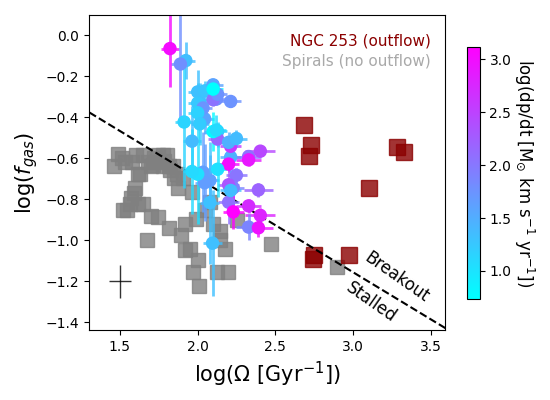
In a series of papers, Orr et al. (2021, 2022) considered the impacts of supernova clustering on the regulation of star formation by stellar feedback, and the conditions in which supernovae leave the disk or impart their momentum to the ISM. They outlined the scenarios in which a resulting superbubble generated by a supernova explosion expands until it either breaks out of the galaxy disk, or stalls within the galaxy. This simple, yet predictive, model is motivated by and is consistent with simulations of outflows (Fielding et al., 2018) and star cluster formation (Grudić et al., 2018). As the authors define it, in the event of “breakout”, more than 60% of the momentum from the subsequent supernovae transfers to the outflow rather than coupling to the ISM.
Orr et al. (2021) put forward the prediction that a boundary line exists in the parameter space between local gas fraction, , and the orbital frequency, , that determines whether an outflow travels beyond the vertical scale-height of the disk (i.e. breakout) or stays bound inside the disk (i.e. stalled) (see also Orr et al., 2022).
We compare our observations for IRAS08 to the predictions from Orr et al. (2022) in Figure 7. We find that the vast majority () of our resolved regions in IRAS08 have and consistent with the predicted region for breakout outflows. We take the velocity models used in F22 for IRAS08, in which a flat rotation curve is fit to the CO(2-1) data, such that . There is a significant systematic uncertainty in IRAS08 due to the low inclination of the galaxy. We adopt , which F22 derived from the HST/F550M isophotes at large radius, which is similar to the assumed inclination in Leitherer et al. (2013). An uncertainty in the inclination angle of would result in an uncertainty in Figure 7 of dex in . Observationally this produces a challenging balance, as outflows would become more difficult to observe in more highly inclined systems. The figure also compares the IRAS08 measurements to NGC 253, which is known to contain an outflow. Given that we have thus far seen similar behaviour between NGC 253 and IRAS08, it is therefore further consistent that both are above the breakout line. Moreover, as a control Orr et al. (2022, see their Fig. 1) showed data for 4 spiral galaxies that are known to not have outflows, which we show are not colocated with IRAS08.
We can compare the outflow velocity in IRAS08 to local velocity dispersion to check if the Orr et al. (2021, 2022) breakout scenario is consistent with outflows moving beyond the scale-height of the disk. The scale-height of a disk is set by , where is the velocity dispersion (see discussion in Wilson et al., 2019). For standard scenarios, if an outflow is moving faster than it will reach the scale-height of the disk. F22 showed that the velocity dispersion of the molecular gas is on average 256 km s-1, with the highest values being 40 km s-1. The minimum of our estimated outflow velocities, , is of order 130 km s-1, which is well above the dispersion of the disk, even if we account for systematic differences between ionised and molecular gas velocity dispersions (Girard et al., 2021). The position of IRAS08 in the diagram is therefore consistent with the theory put forward in Orr et al. (2021). We can also argue that this implies the depletion of gas discussed in previous sections is indeed leaving the plane of the disk, and removing gas from star formation.
Orr et al. (2021) also predicted that at fixed and larger less momentum couples to the gas in the disk, and more momentum couples to the outflow. For every unit of new stellar mass which is formed, there is an amount of momentum which is available to be coupled to the surrounding gas (ISM or outflow). We do not know the exact relationship between our observable outflow momentum flux, , and the amount of momentum per unit new stellar mass formed, . While we cannot observe the momentum which couples to the ISM gas, we can observe the momentum flux of the outflow in each region. In Figure 7 we colour the points of IRAS08 by their outflow momentum flux. We find that increasing corresponds with increasing momentum flux within the outflow, i.e. outflows launched closer to the galaxy center have greater momentum. Note that to first order simply traces , we therefore expect similar correlations with . There are a number of uncertainties, not the least of which is likely the phase distribution of the momentum of the outflow (see Fielding & Bryan, 2022 for an in-depth theoretical exploration of the momentum content of multiphase galactic winds). Nonetheless, it is plausible that as more momentum flux is incorporated in the outflow this would imply that less is available to generate turbulence in the ISM. The effect is thus to decrease the effective felt by the disk surrounding the outflow.
4 Summary & Discussion
4.1 Summary
We present resolved measurements of IRAS08 in ionised gas using KCWI/Keck and molecular gas using NOEMA. We use these observations to relate the molecular gas mass and star formation observed in the galaxy to the resolved outflow and its properties. We have shown that the combined comparison of , and allows for very direct comparison to theory, in which three parameters that are thought to combine to regulate star formation in disk galaxies are characterised.
We have shown direct correlation between the resolved and the co-located outflow mass flux, , in regions of 500 pc. We find that correlates much more strongly with than . This leads to a connection between outflow strength and location in the Kennicutt-Schmidt relationship between , such that regions of the galaxy with shorter molecular gas depletion times have stronger outflows. There is therefore a strong, superlinear relationship between the outflow efficiency and the inverse of the gas depletion time .
We find that the mass-loading factors we observe are consistent with predictions from multiple simulations (Pandya et al., 2021; Kim et al., 2020). The outflows we resolve are consistent with breakout outflows according to the region in the plane defined by Orr et al. (2021, 2022). For our galaxy we can compare the velocity of the outflow to the local velocity dispersion, which we indeed find is consistent with outflows travelling fast enough to leave the disk.
4.2 Systematic Uncertainties
In this paper we attempt to derive physical quantities of outflows from observations. This is necessary to compare to theory and simulation, however the derivation is heavily impacted by assumptions that introduce systematic uncertainties. We do not have strong constraints on how the of the outflow changes across either a range of galaxies, or for regions within a galaxy. Moreover, outflows are clearly multiphase phenomena (e.g Fluetsch et al., 2021, 2019; Herrera-Camus et al., 2020). However, the ratio of the mass outflow rate in ions to other phases of gas is not well constrained by observations, especially on resolved scales within galaxies. Leroy et al. (2015b) provided a heuristic model in which this ratio could change based on the local region of the galaxy. More work constraining these properties with ALMA, MUSE and KCWI is direly needed in order to reduce these systematics, and confirm the results we have presented.
4.3 Implications for star formation regulation in high galaxies
The superlinear relationship between outflow efficiency and star formation efficiency (Fig. 4) has implications for how galaxies regulate their star formation. This correlation suggests that in the disk-mode of star formation, the outflow and the star formation are similarly effective at removing gas, thus regulating the ability to form new stars. However, as the disk moves into a starburst mode, this regulation becomes more dominated by the outflow.
We can therefore outline a picture in which the nature of the mechanism regulating star formation may change with respect to location in the plane. At a fixed , as the increases above the typical depletion time of Gyr, the outflows become the dominant mechanism in removing gas. Krumholz et al. (2018) argues that gas inflow rates in disks are comparable to the SFR, and therefore if the mass-outflow rate becomes significantly greater than , as we show in Fig. 6, then the gas removal by the outflow will reduce the gas surface density. This then causes the star formation rate surface density to decline, and further gas removal is dominated by star formation rather than outflows. Outflows in the center of starbursting disks, such as observed here, may therefore act to reduce the impacts of other effects that drive up the gas velocity dispersion. Theoretical work that incorporates outflows into dynamical equilibrium models of star formation may be necessary to explain high disk galaxies.
We note that this is heuristically similar to a scenario in which feedback can be overcome on short timescales by very efficient star formation (Torrey et al., 2017). Orr et al. (2019) and Rathjen et al. (2021) made similar analyses of simulation data, at lower . The difference between IRAS08 and the conclusions in Torrey et al. (2017), however, is that in Torrey et al. (2017) this phenomenon only occurs over the very central nuclei of a galaxy, whereas in IRAS08 it extends to beyond the half-light radius of the star-light. F22 reported short free-fall times, Myr in a very large fraction of the galaxy, and high star formation efficiencies per free-fall time. Taken together, the observations of F22 and the outflow observations here are likewise conceptually consistent with the picture in which departures from dynamical equilibrium are regulated by strong winds.
We note that there are many similarities between IRAS08 and galaxies, including the higher gas fraction, high molecular gas velocity dispersion and location in the diagram (for a full comparison see F22, ). Our results may therefore indicate that the low molecular gas depletion times observed in galaxies at (e.g. Tacconi et al., 2018; Herrera-Camus et al., 2019) may be due more to outflows depleting the local area of the disk, rather than conversion of gas into stars. What we do not currently know is which relationship is more important, that of or the relationship between outflow efficiency and star formation efficiency. For example, both Genzel et al. (2011) and Molina et al. (2019) found galaxies with high and at sub-galactic resolution, but they have disk-like depletion times. Observations of outflows in systems like this would be informative.
Our work has shown the diagnostic power of comparing the properties of outflows to both and in resolved observations. Tracking three of the parameters responsible for regulating star formation in galaxy disks in resolved observations enables us to make unique comparisons to theory. Yet we have examined only one galaxy. To repeat this on multiple targets, however, requires a substantial investment of observing time. Outflows are more easily detected on high efficiency spectrographs on 8-10 m class telescopes (such as Keck/KCWI and VLT/MUSE). This then must be combined with data from millimeter-wave interferometers, such as ALMA, SMA and NOEMA. Finally, observations of the ratio of -to- vary significantly on the handful of targets that have been measured (Fluetsch et al., 2019; Herrera-Camus et al., 2020). Combining resolved observations from optical and millimeter-wave instruments, we would ideally have much better constraints on the phase distribution of outflows. Deep ALMA observations of molecular gas outflows targeting galaxies with known ionised gas outflows would be very informative, as ionised gas outflows are much easier to observe, especially in more distant galaxies. We expect future work using DUVET galaxies to address these concerns.
We are grateful to Viraj Pandya, for discussion and sharing FIRE-2 simulation results, and to Matt Orr for helpful discussion. Parts of this research were supported by the Australian Research Council Centre of Excellence for All Sky Astrophysics in 3 Dimensions (ASTRO 3D), through project number CE170100013. D.B.F. acknowledges support from Australian Research Council (ARC) Future Fellowship FT170100376 and ARC Discovery Program grant DP130101460. A.D.B. acknowledges support from NSF-AST2108140. A.J.C. acknowledges funding from the “FirstGalaxies” Advanced Grant from the European Research Council (ERC) under the European Union’s Horizon 2020 research and innovation programme (Grant agreement No. 789056). R.H.-C. thanks the Max Planck Society for support under the Partner Group project ”The Baryon Cycle in Galaxies” between the Max Planck for Extraterrestrial Physics and the Universidad de Concepción. R.H-C also acknowledges financial support from Millenium Nucleus NCN19058 (TITANs) and support by the ANID BASAL projects ACE210002 and FB210003. D.O. is a recipient of an Australian Research Council Future Fellowship (FT190100083) funded by the Australian Government. R.R.V. and K.S. acknowledge funding support from National Science Foundation Award No. 1816462.
This work is based on observations carried out under project number W17CB with the IRAM NOEMA Interferometer. IRAM is supported by INSU/CNRS (France), MPG (Germany) and IGN (Spain).
Some of the data presented herein were obtained at the W. M. Keck Observatory, which is operated as a scientific partnership among the California Institute of Technology, the University of California and the National Aeronautics and Space Administration. The Observatory was made possible by the generous financial support of the W. M. Keck Foundation. Observations were supported by Swinburne Keck program 2018A_W185. The authors wish to recognise and acknowledge the very significant cultural role and reverence that the summit of Maunakea has always had within the indigenous Hawaiian community. We are most fortunate to have the opportunity to conduct observations from this mountain.
References
- Ambachew et al. (2022) Ambachew, L., Fisher, D. B., Glazebrook, K., et al. 2022, MNRAS, doi: 10.1093/mnras/stac622
- Arribas et al. (2014) Arribas, S., Colina, L., Bellocchi, E., Maiolino, R., & Villar-Martín, M. 2014, A&A, 568, A14, doi: 10.1051/0004-6361/201323324
- Astropy Collaboration et al. (2013) Astropy Collaboration, Robitaille, T. P., Tollerud, E. J., et al. 2013, A&A, 558, A33, doi: 10.1051/0004-6361/201322068
- Astropy Collaboration et al. (2018) Astropy Collaboration, Price-Whelan, A. M., Sipőcz, B. M., et al. 2018, AJ, 156, 123, doi: 10.3847/1538-3881/aabc4f
- Avery et al. (2021) Avery, C. R., Wuyts, S., Förster Schreiber, N. M., et al. 2021, MNRAS, doi: 10.1093/mnras/stab780
- Barrera-Ballesteros et al. (2021) Barrera-Ballesteros, J. K., Sánchez, S. F., Heckman, T., et al. 2021, MNRAS, 503, 3643, doi: 10.1093/mnras/stab755
- Bigiel et al. (2008) Bigiel, F., Leroy, A., Walter, F., et al. 2008, AJ, 136, 2846, doi: 10.1088/0004-6256/136/6/2846
- Bolatto et al. (2013a) Bolatto, A. D., Wolfire, M., & Leroy, A. K. 2013a, ARA&A, 51, 207, doi: 10.1146/annurev-astro-082812-140944
- Bolatto et al. (2013b) Bolatto, A. D., Warren, S. R., Leroy, A. K., et al. 2013b, Nature, 499, 450, doi: 10.1038/nature12351
- Bolatto et al. (2021) Bolatto, A. D., Leroy, A. K., Levy, R. C., et al. 2021, ApJ, 923, 83, doi: 10.3847/1538-4357/ac2c08
- Boquien et al. (2019) Boquien, M., Burgarella, D., Roehlly, Y., et al. 2019, A&A, 622, A103, doi: 10.1051/0004-6361/201834156
- Calzetti (2001) Calzetti, D. 2001, PASP, 113, 1449, doi: 10.1086/324269
- Calzetti et al. (2000) Calzetti, D., Armus, L., Bohlin, R. C., et al. 2000, ApJ, 533, 682, doi: 10.1086/308692
- Cameron et al. (2021) Cameron, A. J., Fisher, D. B., McPherson, D., et al. 2021, ApJ, 918, L16, doi: 10.3847/2041-8213/ac18ca
- Cappellari (2017) Cappellari, M. 2017, MNRAS, 466, 798, doi: 10.1093/mnras/stw3020
- Chen et al. (2010) Chen, Y.-M., Tremonti, C. A., Heckman, T. M., et al. 2010, The Astronomical Journal, 140, 445
- Chisholm et al. (2017) Chisholm, J., Tremonti, C. A., Leitherer, C., & Chen, Y. 2017, Monthly Notices of the Royal Astronomical Society, 469, 4831
- Chisholm et al. (2016) Chisholm, J., Tremonti, C. A., Leitherer, C., Chen, Y., & Wofford, A. 2016, MNRAS, 457, 3133, doi: 10.1093/mnras/stw178
- Chisholm et al. (2015) Chisholm, J., Tremonti, C. A., Leitherer, C., et al. 2015, The Astrophysical Journal, 811, 149
- Conroy et al. (2009) Conroy, C., Gunn, J. E., & White, M. 2009, ApJ, 699, 486, doi: 10.1088/0004-637X/699/1/486
- Davies et al. (2019) Davies, R. L., Schreiber, N. F., Übler, H., et al. 2019, The Astrophysical Journal, 873, 122
- Dekel et al. (2009) Dekel, A., Sari, R., & Ceverino, D. 2009, ApJ, 703, 785, doi: 10.1088/0004-637X/703/1/785
- Faucher-Giguère et al. (2013) Faucher-Giguère, C.-A., Quataert, E., & Hopkins, P. F. 2013, MNRAS, 433, 1970, doi: 10.1093/mnras/stt866
- Fielding et al. (2018) Fielding, D., Quataert, E., & Martizzi, D. 2018, Monthly Notices of the Royal Astronomical Society, 481, 3325
- Fielding et al. (2017) Fielding, D., Quataert, E., Martizzi, D., & Faucher-Giguère, C.-A. 2017, MNRAS, 470, L39, doi: 10.1093/mnrasl/slx072
- Fielding & Bryan (2022) Fielding, D. B., & Bryan, G. L. 2022, ApJ, 924, 82, doi: 10.3847/1538-4357/ac2f41
- Fisher et al. (2022) Fisher, D. B., Bolatto, A. D., Glazebrook, K., et al. 2022, ApJ, 928, 169, doi: 10.3847/1538-4357/ac51c8
- Fisher et al. (2019) Fisher, D. B., Bolatto, A. D., White, H., et al. 2019, The Astrophysical Journal, 870, 46
- Fluetsch et al. (2019) Fluetsch, A., Maiolino, R., Carniani, S., et al. 2019, MNRAS, 483, 4586, doi: 10.1093/mnras/sty3449
- Fluetsch et al. (2021) —. 2021, MNRAS, 505, 5753, doi: 10.1093/mnras/stab1666
- Förster Schreiber et al. (2019) Förster Schreiber, N., Übler, H., Davies, R., et al. 2019, The Astrophysical Journal, 875, 21
- Gentry et al. (2020) Gentry, E. S., Madau, P., & Krumholz, M. R. 2020, MNRAS, 492, 1243, doi: 10.1093/mnras/stz3440
- Genzel et al. (2011) Genzel, R., Newman, S., Jones, T., et al. 2011, The Astrophysical Journal, 733, 101
- Girard et al. (2021) Girard, M., Fisher, D. B., Bolatto, A. D., et al. 2021, ApJ, 909, 12, doi: 10.3847/1538-4357/abd5b9
- Grudić et al. (2018) Grudić, M. Y., Hopkins, P. F., Faucher-Giguère, C.-A., et al. 2018, MNRAS, 475, 3511, doi: 10.1093/mnras/sty035
- Hao et al. (2011) Hao, C.-N., Kennicutt, R. C., Johnson, B. D., et al. 2011, ApJ, 741, 124, doi: 10.1088/0004-637X/741/2/124
- Hayward & Hopkins (2017) Hayward, C. C., & Hopkins, P. F. 2017, MNRAS, 465, 1682, doi: 10.1093/mnras/stw2888
- Heckman et al. (2015) Heckman, T. M., Alexandroff, R. M., Borthakur, S., Overzier, R., & Leitherer, C. 2015, The Astrophysical Journal, 809, 147
- Heckman et al. (2000) Heckman, T. M., Lehnert, M. D., Strickland , D. K., & Armus, L. 2000, ApJS, 129, 493, doi: 10.1086/313421
- Herrera-Camus et al. (2019) Herrera-Camus, R., Tacconi, L., Genzel, R., et al. 2019, ApJ, 871, 37, doi: 10.3847/1538-4357/aaf6a7
- Herrera-Camus et al. (2020) Herrera-Camus, R., Janssen, A., Sturm, E., et al. 2020, A&A, 635, A47, doi: 10.1051/0004-6361/201936434
- Hinshaw et al. (2013) Hinshaw, G., Larson, D., Komatsu, E., et al. 2013, ApJS, 208, 19, doi: 10.1088/0067-0049/208/2/19
- Hopkins et al. (2012) Hopkins, P. F., Quataert, E., & Murray, N. 2012, MNRAS, 421, 3522, doi: 10.1111/j.1365-2966.2012.20593.x
- Kennicutt (1989) Kennicutt, Robert C., J. 1989, ApJ, 344, 685, doi: 10.1086/167834
- Kennicutt Jr & Evans (2012) Kennicutt Jr, R. C., & Evans, N. J. 2012, Annual Review of Astronomy and Astrophysics, 50, 531
- Kewley et al. (2019) Kewley, L. J., Nicholls, D. C., & Sutherland, R. S. 2019, ARA&A, 57, 511, doi: 10.1146/annurev-astro-081817-051832
- Kim & Ostriker (2017) Kim, C.-G., & Ostriker, E. C. 2017, ApJ, 846, 133, doi: 10.3847/1538-4357/aa8599
- Kim et al. (2013) Kim, C.-G., Ostriker, E. C., & Kim, W.-T. 2013, ApJ, 776, 1, doi: 10.1088/0004-637X/776/1/1
- Kim et al. (2020) Kim, C.-G., Ostriker, E. C., Somerville, R. S., et al. 2020, ApJ, 900, 61, doi: 10.3847/1538-4357/aba962
- Kim et al. (1995) Kim, D. C., Sanders, D. B., Veilleux, S., Mazzarella, J. M., & Soifer, B. T. 1995, ApJS, 98, 129, doi: 10.1086/192157
- Kroupa & Weidner (2003) Kroupa, P., & Weidner, C. 2003, ApJ, 598, 1076, doi: 10.1086/379105
- Krumholz et al. (2018) Krumholz, M. R., Burkhart, B., Forbes, J. C., & Crocker, R. M. 2018, MNRAS, 477, 2716, doi: 10.1093/mnras/sty852
- Leitherer et al. (2013) Leitherer, C., Chandar, R., Tremonti, C. A., Wofford, A., & Schaerer, D. 2013, ApJ, 772, 120, doi: 10.1088/0004-637X/772/2/120
- Leitherer et al. (2002) Leitherer, C., Li, I. H., Calzetti, D., & Heckman, T. M. 2002, ApJS, 140, 303, doi: 10.1086/342486
- Leroy et al. (2013) Leroy, A. K., Walter, F., Sandstrom, K., et al. 2013, AJ, 146, 19, doi: 10.1088/0004-6256/146/2/19
- Leroy et al. (2015a) Leroy, A. K., Bolatto, A. D., Ostriker, E. C., et al. 2015a, ApJ, 801, 25, doi: 10.1088/0004-637X/801/1/25
- Leroy et al. (2015b) Leroy, A. K., Walter, F., Martini, P., et al. 2015b, ApJ, 814, 83, doi: 10.1088/0004-637X/814/2/83
- Li et al. (2017) Li, M., Bryan, G. L., & Ostriker, J. P. 2017, ApJ, 841, 101, doi: 10.3847/1538-4357/aa7263
- López-Sánchez et al. (2006) López-Sánchez, Á. R., Esteban, C., & García-Rojas, J. 2006, A&A, 449, 997, doi: 10.1051/0004-6361:20053119
- Luridiana et al. (2015) Luridiana, V., Morisset, C., & Shaw, R. A. 2015, A&A, 573, A42, doi: 10.1051/0004-6361/201323152
- Molina et al. (2019) Molina, J., Ibar, E., Smail, I., et al. 2019, MNRAS, 487, 4856, doi: 10.1093/mnras/stz1643
- Morrissey et al. (2018) Morrissey, P., Matuszewski, M., Martin, D. C., et al. 2018, ApJ, 864, 93, doi: 10.3847/1538-4357/aad597
- Muratov et al. (2015) Muratov, A. L., Kereš, D., Faucher-Giguère, C.-A., et al. 2015, MNRAS, 454, 2691, doi: 10.1093/mnras/stv2126
- Nelson et al. (2019) Nelson, D., Pillepich, A., Springel, V., et al. 2019, MNRAS, 490, 3234, doi: 10.1093/mnras/stz2306
- Newman et al. (2012) Newman, S. F., Genzel, R., Förster-Schreiber, N. M., et al. 2012, The Astrophysical Journal, 761, 43
- Oppenheimer et al. (2020) Oppenheimer, B. D., Davies, J. J., Crain, R. A., et al. 2020, MNRAS, 491, 2939, doi: 10.1093/mnras/stz3124
- Orr et al. (2021) Orr, M. E., Fielding, D. B., Hayward, C. C., & Burkhart, B. 2021, arXiv e-prints, arXiv:2109.14656. https://arxiv.org/abs/2109.14656
- Orr et al. (2022) —. 2022, ApJ, 924, L28, doi: 10.3847/2041-8213/ac479f
- Orr et al. (2019) Orr, M. E., Hayward, C. C., & Hopkins, P. F. 2019, MNRAS, 486, 4724, doi: 10.1093/mnras/stz1156
- Osterbrock & Ferland (2006) Osterbrock, D. E., & Ferland, G. J. 2006, Astrophysics Of Gas Nebulae and Active Galactic Nuclei (University science books)
- Ostriker & Kim (2022) Ostriker, E. C., & Kim, C.-G. 2022, arXiv e-prints, arXiv:2206.00681. https://arxiv.org/abs/2206.00681
- Ostriker et al. (2010) Ostriker, E. C., McKee, C. F., & Leroy, A. K. 2010, The Astrophysical Journal, 721, 975
- Otí-Floranes et al. (2014) Otí-Floranes, H., Mas-Hesse, J. M., Jiménez-Bailón, E., et al. 2014, A&A, 566, A38, doi: 10.1051/0004-6361/201323069
- Pandya et al. (2021) Pandya, V., Fielding, D. B., Anglés-Alcázar, D., et al. 2021, MNRAS, 508, 2979, doi: 10.1093/mnras/stab2714
- Rathjen et al. (2021) Rathjen, T.-E., Naab, T., Girichidis, P., et al. 2021, MNRAS, 504, 1039, doi: 10.1093/mnras/stab900
- Reichardt Chu et al. (2022) Reichardt Chu, B., Fisher, D. B., Nielsen, N. M., et al. 2022, MNRAS, 511, 5782, doi: 10.1093/mnras/stac420
- Roberts-Borsani et al. (2020) Roberts-Borsani, G. W., Saintonge, A., Masters, K. L., & Stark, D. V. 2020, MNRAS, doi: 10.1093/mnras/staa464
- Rodríguez del Pino et al. (2019) Rodríguez del Pino, B., Arribas, S., Piqueras López, J., Villar-Martín, M., & Colina, L. 2019, MNRAS, 486, 344, doi: 10.1093/mnras/stz816
- Romeo et al. (2010) Romeo, A. B., Burkert, A., & Agertz, O. 2010, MNRAS, 407, 1223, doi: 10.1111/j.1365-2966.2010.16975.x
- Rubin et al. (2014) Rubin, K. H. R., Prochaska, J. X., Koo, D. C., et al. 2014, ApJ, 794, 156, doi: 10.1088/0004-637X/794/2/156
- Rupke et al. (2005) Rupke, D. S., Veilleux, S., & Sanders, D. B. 2005, ApJS, 160, 115, doi: 10.1086/432889
- Salak et al. (2020) Salak, D., Nakai, N., Sorai, K., & Miyamoto, Y. 2020, ApJ, 901, 151, doi: 10.3847/1538-4357/abb134
- Shopbell & Bland-Hawthorn (1998) Shopbell, P. L., & Bland-Hawthorn, J. 1998, ApJ, 493, 129, doi: 10.1086/305108
- Somerville & Davé (2015) Somerville, R. S., & Davé, R. 2015, ARA&A, 53, 51, doi: 10.1146/annurev-astro-082812-140951
- Stanway & Eldridge (2018) Stanway, E. R., & Eldridge, J. J. 2018, MNRAS, 479, 75, doi: 10.1093/mnras/sty1353
- Steidel et al. (2010) Steidel, C. C., Erb, D. K., Shapley, A. E., et al. 2010, The Astrophysical Journal, 717, 289
- Sun et al. (2020) Sun, J., Leroy, A. K., Ostriker, E. C., et al. 2020, ApJ, 892, 148, doi: 10.3847/1538-4357/ab781c
- Tacconi et al. (2018) Tacconi, L. J., Genzel, R., Saintonge, A., et al. 2018, ApJ, 853, 179, doi: 10.3847/1538-4357/aaa4b4
- Torrey et al. (2017) Torrey, P., Hopkins, P. F., Faucher-Giguère, C.-A., et al. 2017, MNRAS, 467, 2301, doi: 10.1093/mnras/stx254
- Veilleux et al. (2005) Veilleux, S., Cecil, G., & Bland-Hawthorn, J. 2005, ARA&A, 43, 769, doi: 10.1146/annurev.astro.43.072103.150610
- Veilleux et al. (2020) Veilleux, S., Maiolino, R., Bolatto, A. D., & Aalto, S. 2020, A&A Rev., 28, 2, doi: 10.1007/s00159-019-0121-9
- Veilleux & Rupke (2002) Veilleux, S., & Rupke, D. S. 2002, ApJ, 565, L63, doi: 10.1086/339226
- Wilson et al. (2019) Wilson, C. D., Elmegreen, B. G., Bemis, A., & Brunetti, N. 2019, ApJ, 882, 5, doi: 10.3847/1538-4357/ab31f3