Dual density waves with neutral and charged dipolar excitons of GaAs bilayers
Abstract
Strongly correlated quantum particles in lattice potentials are the building blocks for a large variety of quantum insulators, for instance Mott phases and density waves breaking the lattice symmetry. Such collective states are accessible to bosonic and fermionic systems. To expand further the spectrum of accessible quantum matter phases, mixing both species is theoretically appealing, since density order then competes with phase separation. Here we manipulate such Bose-Fermi mixture by confining neutral (boson-like) and charged (fermion-like) dipolar excitons in an artificial square lattice of a GaAs bilayer. At unitary lattice filling, strong inter- and intra-species interactions stabilise insulating phases when the fraction of charged excitons is around (1/3, 1/2, 2/3). We evidence that dual Bose-Fermi density waves are then realised, with species ordered in alternating stripes. Our observations highlight that dipolar excitons allow for controlled implementations of Bose-Fermi Hubbard models extended by off-site interactions.
Strongly interacting quantum particles confined in periodic potentials are specifically described by the Hubbard model (HM) Salomon_2010 ; Arovas_2022 . This Hamiltonian constitutes one of the most celebrated models of condensed matter physics. For fermions, the HM has been extensively studied, underlying the current theoretical description of high temperature superconductivity Arovas_2022 ; Tranquada_2015 . For bosons, it has also raised considerable attention, triggered by pioneering experiments with ultra-cold atoms Greiner_2002 ; Chin_2009 .
Recently, the physics of the HM has been fostered by two-dimensional semiconductors. These offer new opportunities to study bosonic and fermionic realisations of Hubbard Hamiltonians. Triangular moiré lattices obtained by interfacing atomic monolayers provide a successful example for Fermi-Hubbard physics. Indeed, moiré lattices have enabled electronic Wigner crystals Li_21 ; Regan_20 , as well as a wide range of insulating density waves (DWs) at fractional lattice fillings Huang_21 ; Xu_20 ; Jin_21 . For bosons, the HM has been implemented with dipolar excitons that are Coulomb bound electrons and holes spatially separated in a GaAs bilayer Combescot_ROPP . These are efficiently confined in gate-defined electrostatic lattices Butov_lattice ; Lagoin_2020 and caracterised by their photoluminescence (PL) emission. Mott insulator and checkerboard solid were then reported at integer and half fillings respectively Lagoin_22 ; Lagoin_22b , the latter phase evidencing the extended Bose-Hubbard model Baranov_2011 ; Dutta_2015 .
Here, we implement the Bose-Fermi Hubbard Hamiltonian extended by off-site interactions, by confining dipolar excitons and holes in an electrostatic lattice of a GaAs bilayer. These two species experience strong attractions. Holes are thus captured in lattice sites occupied by excitons, yielding fermion-like charged excitons (CX). With a charge control down to an ultra-low residual doping level, we implement the Bose-Fermi HM by controlling neutral and charged excitons fillings, and respectively. At , we uncover incompressible states for fractional values of , around (1/3, 1/2, 2/3). We find spectroscopic evidence that neutral and charged excitons then implement alternating striped DWs. Thus, we confirm the rich variety of quantum insulators accessible to Bose-Fermi mixtures Buchler_2003 ; Maciej_2004 ; Hofstetter_2008 ; Sugawa_2011 .
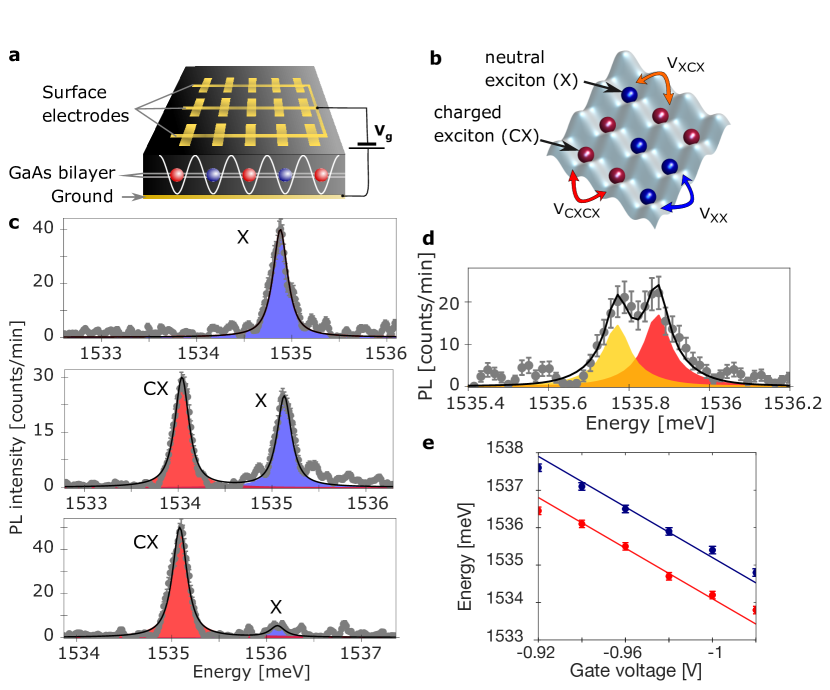
As illustrated in Fig.1.a, we study a field-effect device where an array of surface gate electrodes, polarised at , applies a transverse electric field sinusoidally varying in the plane of a GaAs double quantum well. The latter confine electrons and holes, spatially separated in each layer and Coulomb bound to realise dipolar excitons. These are characterised by their permanent electric dipole, interacting with the applied field. Hence, we confine excitons in a 250 nm period square lattice, with around 250 eV depth. Excitons then have two accessible confined states (Wannier states – WS) separated by 150 eV (Ref.Lagoin_22b and Methods). Moreover, note that excitons are optically injected, using a 100 ns long laser excitation repeated at 1 MHz. The laser excitation power controls the lattice filling and we study the photoluminescence (PL) radiated 300 ns after extinction of the laser pulse (Methods). This delay is around half the excitons effective lifetime. Hence, carriers are efficiently thermalised down to our lowest bath temperature (T=330 mK) Beian_2015 .
Figure 1.c reports the PL spectra radiated by our device, for different gate voltages and for a lattice filling around 1. Let us first note that here and in the following the PL is averaged over a (3x2.5) region, thereby including around 120 lattice sites (Methods). While at V the top panel of Fig.1.c shows that the PL is mostly due to the recombination of dipolar excitons (high energy peak), we observe that a second emission grows at lower energies when is reduced to about V (middle panel). By further decreasing to V, the bottom panel shows that the PL is mostly given by the low energy contribution.
Dual PL emissions have been previously reported for GaAs bilayers Dietl_2019 ; Bar_Joseph_21 . It was shown that the low energy line marks the strong attraction between excitons and excess carriers, yielding (composite) fermionic complexes usually referred to as charged excitons (CX). On the other hand, the higher energy PL line signals the radiative recombination of neutral dipolar excitons. The energy separation between these two contributions, around 1 meV, well matches theoretical expectations Suris_2003 ; Witham_2018 . Moreover, we note that excess carriers can only be attributed to holes for our heterostructure characterised by ultra-high electronic mobilities Loren_21 . Indeed, holes are trapped in the regions of the bilayer where a perpendicular field is applied, i.e. inside the lattice, whereas electrons are expelled out of this zone Kowalik_2012 .
Neutral dipolar excitons are characterised by a linear dependence of their PL energy with Ronen_2007 , scaling like (). Here denotes the electron charge, the spatial separation between the center of the two quantum wells and the thickness of our field-effect device (Methods). In Fig.1.e we evidence this signature (blue), for such that the lattice depth remains essentially unchanged (Methods). Furthermore, we note that the PL energy of CX follows the same scaling (red). We then deduce that holes are captured in the lattice sites occupied by dipolar excitons. As a result our device efficiently confines both neutral and charged dipolar excitons, in the same lattice potential. This conclusion is further confirmed by scrutinising the spectrum of the PL emitted by CX. Indeed, Fig.1.d underlines that for low lattice fillings the PL spectrum consists of two emission lines, separated by around 100 eV. This magnitude agrees reasonably with the theoretically expected energy separation between the 2 WS accessible to an exciton complex made by two holes and one electron, and for around 250 eV lattice depth (Methods).
Figure 1.c and extended data Fig.1 evidence that the fraction of neutral and charged excitons are efficiently varied by the gate voltage. On the other hand, we verified that the overall lattice filling is mostly given by the laser excitation power (extended data Fig.1). Experimentally, to set and we first adjusted so that . The neutral excitons filling is then controlled by , set for instance such that by realising a Mott insulator. For the chosen laser excitation power, is then tuned by the gate voltage while remains mostly unchanged (extended data Fig.1). Note that neutral and charged exciton fillings are quantified by computing their PL integrated intensities (Methods). Thus, we possibly assess the purity of our device. Indeed, extended data Fig.2 shows that by suitably adjusting the PL due to CX can not be distinguished from the spectral noise for . This shows that the concentration of residual holes is bound to cm-2 (Methods). Remarkably, this value is comparable to the record residual doping measured for our heterostructure Loren_21 , a regime previously inaccessible to optical techniques.
By confining tuneable concentrations of neutral and charged excitons, our lattice device can emulate Hubbard Hamiltonians, continuously from the bosonic to the fermionic regime. We have recently quantified the former one Lagoin_22 ; Lagoin_22b . Below, we first implement the Fermi Hubbard model by equalising the fraction of excess holes and excitons. Combined inter-species attractions and fast carrier tunnelling (Methods) then ensure that the lattice is only filled with CX.
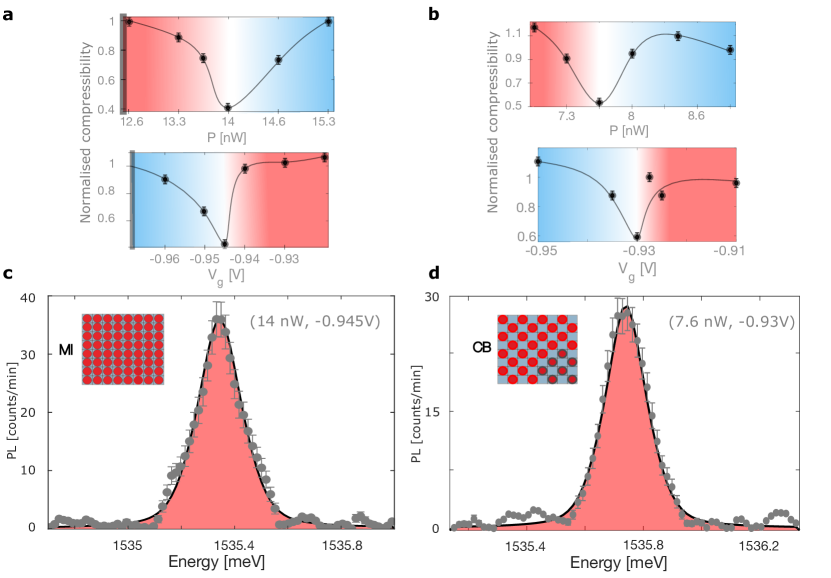
Exploring the parameter space we found two specific combinations, namely (7.6 nW, -0.93 V) and (14 nW, -0.945 V), for which the CX compressibility is minimised, see white areas in Fig.2.a-b. In fact, varying either or from these coupled values leads to a two-fold increase of , towards the level given by poissonian fluctuations, since excitons (blue area) or holes (red area) are then in excess. Furthermore, the two incompressible phases are characterised by a a lorentzian-like PL spectrum, given by our spectral resolution (Fig.2.b-d). Hence, we deduce that CX mostly occupy the same state in the lattice. In the charge neutral regime we verified that for P= 7.6 nW and 1 for P=14 nW. The spectra displayed in Fig.2.a-b then evidence two insulating states, at , theoretically corresponding to MI and checkerboard solid respectively Arovas_2022 .
As for neutral excitons Lagoin_22b , from the difference between the PL energies at unitary and half fillings we deduce the nearest neighbour (NN) interaction strength (Fig.1.b). Indeed, at the energy of a MI is enhanced by 4 compared to a checkerboard phase, since NN couplings are fully avoided for the latter. Taking into account the slight difference of gate voltages necessary to realise the two insulating states, we obtain . This leads to (140 ) eV. Importantly, this magnitude is confirmed by studying the thermal melting of the insulating state at . Indeed, extended data Fig.3 evidences that is minimised up to a critical temperature around 1 K. Thus, our measurements follow theoretical expectations, namely that a checkerboard solid melts when becomes of the order of Lagoin_22b ; Troyer_2002 .
In the following, we turn to the Bose-Fermi HM in the regime where the overall filling is set to unity, since strong on-site interactions prevent double occupancies in our lattice (Methods). We continuously vary neutral and charged excitons filling fractions by sweeping the gate voltage, and we monitor simultaneously the corresponding compressibility, and respectively, by statistically computing PL intensity fluctuations (Methods).
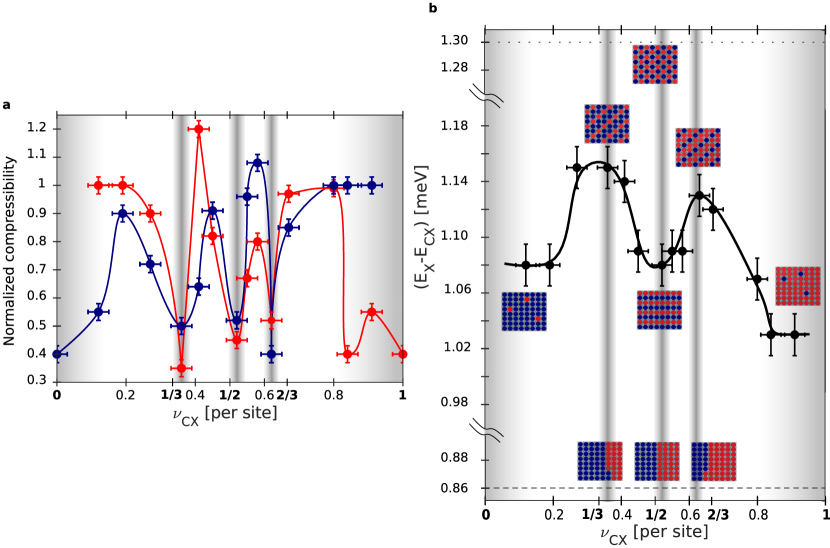
Figure 3.a presents (blue) and (red), normalised by the level set by poissonian fluctuations, as a function of . For , the PL spectrum is dominated by the excitonic component and is minimised. Excitons then realise a boson-like MI that is weakly perturbed by the fraction of fermionic defects, i.e. by the fraction of charged excitons . Similarly, is minimised for so that charged excitons realise a fermion-like MI at unitary filling, weakly perturbed by the fraction of (bosonic defects) excitons . By contrast, and are mostly of the order of the level given by poissonian fluctuations for . The system evolves then in a normal fluid phase. Nevertheless, for (0.35, 0.52, 0.61) 0.03 we strikingly observe that and simultaneously drop, manifesting correlated incompressible states.
Combined insulating phases at (1/3, 1/2, 2/3) suggest that neutral and charged excitons realise dual DWs Buchler_2003 ; Maciej_2004 ; Hofstetter_2008 . To confirm this expectation, we studied ), and being the PL energy of neutral and charged excitons respectively. quantifies the average difference between the surroundings of each specie, since NN couplings are the main interaction channel. Hence, distinguishes the two types of orders that compete in the insulating regime Buchler_2003 ; Hofstetter_2008 , namely DWs and spatially separated Mott phases of neutral and charged excitons (Methods).
We first extract the inter-species NN interaction strength (Fig.1.b) by comparing between the two MI regimes (see extended data Fig.4). Indeed, at 0.1 neutral excitons realise a Mott insulator with a few charged excitons impurities, so that . In the same way, at we obtain . Accordingly we find . From the measurements shown in Fig.3.b (black points), we conclude that eV, since eV Lagoin_22b and ) eV.
As shown above, repulsive NN interactions between charged excitons greatly exceed other interaction strengths. As a result, Fig.3b and extended data Fig.4 show that (dashed line in Fig.3b) is smallest for spatially separated Mott phases, notably at (1/3, 1/2, 2/3). By contrast, the greatest amplitude is obtained for a double checkerboard density wave at 1/2, while intermediate values are found for striped DWs (Fig.3.b and extended data Fig.4). For this latter ordering, one expects at that , corresponding to an increase by eV compared to the exciton MI regime. Remarkably, this enhancement is confirmed experimentally in Fig.3b, since ( eV. Hence, we deduce that alternating stripe phases are realised at , relatively close to the theoretical 2/3 filling. Similarly, we verify in Fig.3.b that ((0.36)- . This matching again reveals that alternating stripes are favoured, with a pattern symmetric to that for . Finally, at Fig.3.b shows that ((0.52)(0.12)) eV, as expected for horizontal or vertical stripes. Otherwise ((0.52)(0.1)) would amount to around 220 eV (dotted line) for alternating checkerboards (Fig.3.b and extended data Fig.4).
To conclude, we have characterised the insulating part of the phase diagram for the Bose-Fermi Hubbard model. Dipolar excitons naturally explore the regime extended by off-site interactions, so that density waves emerge, even at half boson/fermion filling unlike for mixtures bound to short-range interactions Buchler_2003 ; Hofstetter_2008 . Reducing further the carriers temperature to a few tens of milli-Kelvin, which is within experimental reach, would extend our studies to the situation where excitons exhibit extended phase coherence. Mixtures of neutral and charged excitons could then serve as a platform to engineer supersolid-like states, stabilised by ordered fermionic phases. Also, the low (boson) doping regime relevant to superconducting electronic systems may be accessed, by doping Mott insulators of charged excitons with a coherent fluid of neutral ones.
Acknowledgments
Research at CNRS (C.L. and F.D.) has been financially supported by IXTASE from the French Agency for Research (ANR-20-CE30-0032-01). The work at Princeton University (L.P. and K.B.) was funded in part by the Gordon and Betty Moore Foundation’s EPiQS Initiative, Grant GBMF9615 to L. Pfeiffer, and by the National Science Foundation MRSEC grant DMR 2011750 to Princeton University.
Authors contributions
K.B. and L.P. realised the GaAs bilayer while C.L., S.S. and F.D. fabricated the gate electrodes imprinting the 250 nm period electrostatic lattice. C.L. and F.D. performed all experiments, data analysis, and wrote the manuscript. F.D. designed the project.
Competing financial interests
The authors declare no financial interests.
References
- (1) ”Many-Body Physics with Ultracold Gases”, Lecture Notes of the Les Houches Summer School (Eds. C. Salomon, G. V. Shlyapnikov, and L. F. Cugliandolo, 2010)
- (2) D. P. Arovas, E. Berg, S. A. Kivelson and S. Raghu, ”The Hubbard model”, Ann. Rev. of Cond. Matt. Phys. (2022) https://doi.org/10.1146/annurev-conmatphys-031620-102024
- (3) E. Fradkin, S. A. Kivelson, J. M. Tranquada ”Colloquium: Theory of intertwined orders in high temperature superconductors”, Rev. Mod. Phys. 87, 457 (2015)
- (4) M. Greiner, O. Mandel, T. Esslinger, T. W. Haensch and I. Bloch ”Quantum phase transition from a superfluid to a Mott insulator in a gas of ultracold atoms” Nature 415, 39-44 (2002)
- (5) N. Gemelke, X. Zhang, C. L. Hung and C. Chin ”In situ observation of incompressible Mott-insulating domains in ultracold atomic gases” Nature 460, 995-998 (2009)
- (6) H. Li et al., ”Imaging two-dimensional generalized Wigner crystals”, Nature 597, 650-654 (2021).
- (7) E.C. Regan, et al., ”Mott and generalized Wigner crystal states in WSe2/WS2 moiré superlattices”, Nature 579, 359-363 (2020).
- (8) X. Huang et al., ”Correlated insulating states at fractional fillings of the WS2/WSe2 moiré lattice”, Nature Physics 17, 715-719 (2021).
- (9) Y. Xu et al., ”Correlated insulating states at fractional fillings of moiré superlattices”, Nature 587, 214-218 (2020).
- (10) C. Jin et al. ”Stripe phases in WSe2/WS2 moiré superlattices”, Nat. Mat. 20, 940-944 (2021)
- (11) M. Combescot, R. Combescot, F. Dubin ”Bose-Einstein condensation of indirect excitons: a review”, Rep. Prog. Phys. 80, 066401 (2017).
- (12) M. Remeika, M. M. Fogler, L. V. Butov, M. Hanson, and A. C. Gossard, ”Two-dimensional electrostatic lattices for indirect excitons”, Appl. Phys. Lett. 100, 061103 (2012)
- (13) C. Lagoin et al. ”Microscopic lattice for two-dimensional dipolar excitons” Phys. Rev. B 102, 245428 (2020)
- (14) C. Lagoin, S. Suffit, K. Baldwin, L. Pfeiffer, F. Dubin, ”Mott insulator of strongly interacting two-dimensional excitons”, Nat. Phys. 18, 149-153 (2022)
- (15) C. Lagoin et al., ”Extended Bose-Hubbard model with dipolar excitons”, Nature 609, 485–489 (2022)
- (16) M. A. Baranov, M. Dalmonte, G. Pupillo, P. Zoller ”Condensed Matter Theory of Dipolar Quantum Gases”, Chem. Rev. 112, 5012-5061 (2012)
- (17) O. Dutta et al. ”Non-standard Hubbard models in optical lattices: a review”, Rep. Prog. Phys. 78, 066001 (2015)
- (18) H.P. Büchler, G. Blatter, ”Supersolid versus Phase Separation in Atomic Bose- Fermi Mixtures”, Phys. Rev. Lett. 91, 130404 (2003).
- (19) M. Lewenstein, L. Santos, M.A. Baranov, H. Fehmann, ”Atomic Bose-Fermi mixtures in an optical lattice”, Phys. Rev. Lett. 92, 050401 (2004)
- (20) I. Titvinidze, M. Snoek, W. Hofstetter, ”Supersolid Bose-Fermi Mixtures in Optical Lattices”, Phys. Rev. Lett. 100, 100401 (2008)
- (21) S. Sugawa, K. Inaba, S. Taie, R. Yamazaki, M. Yamashita, Y. Takahashi ”Interaction and filling-induced quantum phases of dual Mott insulators of bosons and fermions”, Nat. Phys. 7, 642 (2011)
- (22) M. Beian et al., ”Spectroscopic signatures for the dark Bose-Einstein condensation of spatially indirect excitons”, EuroPhys. Lett. 119, 37004 (2017)
- (23) S Dietl et al., ”On the parabolicity of dipolar exciton traps and their population of excess charge carriers”, New J. Phys. 21, 063028 (2019)
- (24) S. Misra et al., ”The Role of Spin-Flip Collisions in a Dark-Exciton Condensate”, PNAS 119, e2203531119 (2022)
- (25) Sergeev, R., Suris, R. A., ”The X+ trion in a system with spatial separation of the charge carriers”, Semiconductors 37, 1205 (2003).
- (26) O. Witham, R. J. Hunt, and N. D. Drummond, ”Stability of trions in coupled quantum wells modeled by two-dimensional bilayers”, Phys. Rev. B 97, 075424 (2018)
- (27) Y.J. Chung et al., ”Ultra-high-quality two-dimensional electron systems”, Nat. Materials 20, 632–637 (2021)
- (28) K. Kowalik Seidel et al., ”Tunable photo-emission from an excitonic anti-trap”, Nano Lett. 12, 326–330 (2012)
- (29) R. Rapaport and G. Chen ”Experimental methods and analysis of cold and dense dipolar exciton fluids”, J. Phys.: Condens. Matter. 19, 295207 (2007)
- (30) G. Schmid, S. Todo, M. Troyer, and A. Dorneich ”Finite-Temperature Phase Diagram of Hard-Core Bosons in Two Dimensions” Phys. Rev. Lett. 88, 167208 (2002)
Methods
.1 Sample structure and experimental procedure
The period electrostatic lattice is identical to the one studied in Ref. Lagoin_22b . It is based on two wide GaAs quantum wells, separated by a AlGaAs barrier. Dipolar excitons made by spatially separated electrons and holes then carry a permanent electric dipole with a moment around 12.nm, where denotes the electron charge. Also, note that the quantum wells are positioned below the surface of the field-effect device where they are embedded, and above a conductive layer that serves as electrical ground.
Electronic carriers are injected in the lattice potential using a laser excitation at resonance with the direct exciton absorption of the quantum wells. Hence, we ensure that the concentration of photo-injected free carriers is minimised, nevertheless not necessarily vanishing. This regime is only found by suitably adjusting . In fact charge control is accessed for correlated values of and . This behaviour is illustrated Fig.2, since the optimal values of to engineer CX insulators at = 1 and 1/2 differ by 0.015 V.
To spectrally analyse the PL radiated by our device we rely on a 1800 lines/mm grating. The PL is then sampled with 15 eV precision so that the narrowest profile possibly measured, e.g. a laser line, is lorentzian-like with around 150 eV full-width-at-half-maximum. To model PL spectra we assign this profile to the emission from the WS for neutral and charged excitons.
As stated in the main text, we extract and by computing the PL integrated intensities of neutral and charged excitons, these being directly proportional to the concentration of each species. Importantly, we verified that the overall lattice filling () weakly varies in the explored range of gate voltages. Indeed, extended data Fig.1 shows that for fixed the overall PL integrated intensity is rather constant. Accordingly, we assumed that only and vary with , and given the signal-to-noise-ratio of our experiments we deduced that is obtained with precision.
.2 Excitonic compressibility
To quantify the compressibility of neutral and charged excitons we statistically analyse intensity fluctuations of their PL maxima, and respectively. In practice, we rely on samples of 10 measurements all performed under fixed conditions, for every experimental settings. Note that the sample size is limited by the time (6h) available at our lowest bath temperature, since acquiring a single 10 measurements sample requires around 20 minutes.
By monitoring PL intensity fluctuations, we directly compute the compressibility, since is proportional to according to the fluctuation-dissipation theorem Chin_2009 . Here and denote the variance and the mean value of the PL maximum respectively. Moreover, note that we systematically rescale neutral and charged excitons compressibility to the value computed for the level of poissonian fluctuations, for every experimental settings. Thus, experimental observations are more easily confronted. Finally, for our sample size, i.e. 10 realisations for each experimental conditions, we estimated the precision with which the compressibility is deduced. For that, we computed by randomly selecting 7 measurements out of 10. Hence, we observed that varies by around . We then assigned this error bar to measured compressibility.
.3 Neutral and charged excitons in the lattice
Relying on finite element simulations we have computed the lattice profile confining neutral dipolar excitons. We thus found that the lattice depth is about 250 eV when is set to V. Then, excitons are confined in two WS, separated by around 150 eV. Furthermore, we computed the variation of the lattice depth when is varied between and V, as in Figs.1-3. We concluded that decreases from 250 to 230 eV between these two values, and that the energy separation between the two accessible WS ranges then from 140 to 150 eV. This variation is small compared to other energy scales, such as the thermal energy. Then it plays a minimal role in our studies.
We have also simulated the nature of the lattice confinement for CX. Noting that holes have their minimum potential energy at the position of the lattice sites, we first considered that holes are captured in lattice sites occupied by dipolar excitons, favoured by the strong inter-species attraction. For electron and hole effective masses, and Witham_2018 respectively, and considering the same 250 eV deep lattice, we find that CX are confined in two WS separated by around 120 eV, in reasonable agreement with experimental findings (Fig.1).
Alternatively, one may consider that CX are confined in the lattice due to the interaction between their positive charge and the electric field applied in the plane of the double GaAs quantum wells. To explore this scenario we computed the lattice depth for a point-like and positively charged exciton. We deduced that would then be around 1 meV, but more importantly that the point-like charged particle would have access to 3 WS, separated by around 250 eV. This conclusion is in contradiction with the measurements shown in Fig.1. The hole confinement in the lattice is then better captured by considering their strong Coulomb attraction with dipolar excitons.
.4 Hubbard parameters for neutral and charged excitons
We have recently calculated and measured the on-site and NN interactions between dipolar excitons, and respectively Lagoin_22 ; Lagoin_22b . We thus found that exceeds the lattice depth, it can be as large as 1 meV for the lowest WS, whereas eV. On the other hand, the measurements shown in Fig.2-3 yield eV and eV. This evidences that repulsions between neutral excitons constitute the weakest interaction channel. Also, we note that on-site intra- and inter-species scatterings largely exceed the lattice depth so that lattice sites can not be doubly occupied.
In Ref.Lagoin_22b we have shown that the tunnelling strength between lattice sites amounts to a few eV for neutral excitons. Given that the hole effective mass is around 2/3 of the exciton one, we deduce that holes benefit from a tunnelling strength in the eV range too. Thus we ensure that the lattice only confines CX when the hole and neutral excitons concentration are matched (Fig.2), since our experiments are acquired during a 100 ns long time interval allowing for hundreds of particle tunneling between lattice sites.
.5 Minimum hole doping level
Extended data Fig.2 reports a PL spectrum measured for and for a minimised concentration of holes. The spectrum is obtained by averaging 10 realisations. Its maximum is ( counts/min while the level of spectral white noise is counts/min. The signal-to-noise-ratio () is then about 10 in these experiments. Furthermore, we deduce that translates into a mean concentration of neutral excitons cm-2 for our 250 nm period lattice. Since we do not distinguish the PL due to charged excitons from the spectral noise level, we deduce an upper limit for the mean concentration of holes in these measurements, namely cm-2. This value, limited by , is then of the same order as the one obtained from transport techniques for our GaAs quantum wells ( cm-2, see Ref.Loren_21 ).
.6 Spatial order of incompressible phases
Within the framework of the Hubbard model, one expects theoretically that density waves emerge for fractional fillings, mostly around (1/3, 1/2, 2/3) where stripes or checkerboards orders are possibly realised. In our lattice neutral and charged excitons interact through NN couplings, . We then directly deduce the mean single particle interaction energy, , and denoting the mean neutral and charged excitons interaction energies respectively.
At DWs necessarily correspond to alternating diagonal stripes of neutral and charged excitons. We find that these are characterised by = 4/3() 240 eV and 4/3() 387 eV at 1/3 and 2/3 respectively (see extended data Fig.4). On the other hand, phase separated Mott insulators exhibit mean interaction energies around 267 and 413 eV respectively. These are thereby unfavourable. The previous explicit evaluations illustrate that alternating stripe phases exhibit lower energies than separated Mott phases when . Importantly this condition is satisfied in our experiments, since as detailed in the main text.
At , we deduce that eV for a double checkerboard DW, and eV for a striped DW. On the other hand eV for separated Mott phases of neutral and charged excitons. Again, we recover that DW arrangements are energetically favoured over phase separation. However, we also find that the alternating stripe phase exhibits a larger mean interaction energy than the checkerboard one. This conclusion contrasts with our observations. This may first suggest that the precision with which we extract NN interaction strengths is not sufficient to accurately determine the DW ground-state energy. Alternatively, one can not exclude that the alternating stripe phase at =1/2 is of metastable nature. Indeed, insulating states with Bose-Fermi mixtures are characterised by instabilities, triggered by a sensitive competition between inter- and intra-species interaction strengths Buchler_2003 ; Maciej_2004 ; Hofstetter_2008 .
![[Uncaptioned image]](/html/2211.01820/assets/x4.png)
Extended data Fig.1: Lattice filling vs. gate voltage. a Total integrated intensities of the PL radiated by neutral and charged excitons, as a function of and at unitary filling (=14 nW). b Same experimental results as in a but expressed as a function of . c Scaling of as a function of deduced from the measurements shown in a and b. The line provides a guide for the eyes. Experiments were all realised at 330 mK and acquired during four different experimental runs so that detection efficiencies are close but not identical. Vertical error bars display the poissonian precision in a-b and the precision on in c. In a-c, the horizontal error is smaller than the points size while in b it corresponds to the precision when extracting .
![[Uncaptioned image]](/html/2211.01820/assets/x5.png)
Extended data Fig.2: Evaluation of the residual doping level. PL spectrum radiated by neutral dipolar excitons for (at ). The spectrum is measured by averaging 10 realisations performed under unchanged conditions. The profile is given by our spectral resolution, i.e. reproduced by a single lorentzian-like line with around 150 eV full-width-at-half-maximum (blue area and black line). Measurements were performed at 330 mK, error bars displaying the level of poissonian fluctuations.
![[Uncaptioned image]](/html/2211.01820/assets/x6.png)
Extended data Fig.3: Thermal melting of CX insulators at and 1. a Compressibility normalised to the level given by poissonian noise for (, ) as a function of the bath temperature. b Identical measurements for (, ) . While in a the thermal melting of the insulating phase occurs around 1K, as expected for the magnitude measured for , a similar critical temperature is found in b for the Mott phase. This possibly reflects fluctuations of the density of injected holes while the bath temperature is increased. For all measurements error bars mark our statistical precision when computing the compressibility ().
![[Uncaptioned image]](/html/2211.01820/assets/x7.png)
Extended data Fig.4: Interaction energies and spatial ordering. Possible configurations of incompressible phases made by neutral (blue) and charged (red) excitons. The respective energy shifts of PL energies, and , are indicated below each configuration together with the resulting magnitude of , by only taking into account NN interactions.