Revisiting Grammatical Error Correction Evaluation and Beyond
Abstract
Pretraining-based (PT-based) automatic evaluation metrics (e.g., BERTScore and BARTScore) have been widely used in several sentence generation tasks (e.g., machine translation and text summarization) due to their better correlation with human judgments over traditional overlap-based methods. Although PT-based methods have become the de facto standard for training grammatical error correction (GEC) systems, GEC evaluation still does not benefit from pretrained knowledge. This paper takes the first step towards understanding and improving GEC evaluation with pretraining. We first find that arbitrarily applying PT-based metrics to GEC evaluation brings unsatisfactory correlation results because of the excessive attention to inessential systems outputs (e.g., unchanged parts). To alleviate the limitation, we propose a novel GEC evaluation metric to achieve the best of both worlds, namely PT-M2, which only uses PT-based metrics to score those corrected parts. Experimental results on the CoNLL14 evaluation task show that PT-M2 significantly outperforms existing methods, achieving a new state-of-the-art result of 0.949 Pearson correlation. Further analysis reveals that PT-M2 is robust to evaluate competitive GEC systems. Source code and scripts are freely available at https://github.com/pygongnlp/PT-M2.
1 Introduction
Grammatical error correction (GEC) is the task that takes a sentence with grammatical errors as input, and outputs a corrected sentence. Due to the important role of GEC in the field of second language learning and intelligent writing, GEC has attracted wide attention from the community (Chollampatt and Ng, 2018a; Lewis et al., 2020; Omelianchuk et al., 2020). As a typical natural language generation task (NLG), the common practice for GEC evaluation is to calculate the similarity between system outputs and their corresponding references (Dahlmeier and Ng, 2012; Napoles et al., 2015; Bryant et al., 2017).
| Task | Training | Evaluation |
| Machine Translation | ||
| Text Summarization | ||
| Grammatical Error Correction |
With the rapid development of pretraining (PT) (Devlin et al., 2019; Liu et al., 2019; Lewis et al., 2020), several NLG tasks, such as machine translation, text summarization and GEC, have been utilizing PT-based models to improve the model training process (Kaneko et al., 2020; Omelianchuk et al., 2020; Tarnavskyi et al., 2022), as shown in Table 1. Furthermore, since PT-based models can learn rich syntactic and semantic knowledge from a large amount of unlabeled data, they are able to calculate the similarity between two sentences more accurately. Therefore, many mainstream NLG tasks try to develop new evaluation metrics based on PT-based models, and the new metrics have been sufficiently validated in terms of the high consistency with human judgments (Zhang et al., 2020; Yuan et al., 2021). However, existing GEC systems still use traditional metrics for evaluation.
In this paper, to find the reason why GEC systems do not use PT-based metrics for evaluation, we revisit existing GEC evaluation, comparing the traditional overlap-based evaluation metrics with recently popular PT-based metrics. Surprisingly, our preliminary experiment on the CoNLL14 evaluation task shows that arbitrarily applying PT-based metrics to GEC evaluation results in a relatively worse correlation to human judgments than the traditional metrics. Further analysis reveals that the scoring strategies of PT-based metrics are questionable for GEC evaluation. GEC is a local substitution task that only partially changes from the source sentences, but PT-based metrics have to compute the score of the whole sentence despite most words staying the same after correction. The scores from the unchanged words bias the final sentence score, leading to an unreliable evaluation for GEC.
To alleviate the above limitation, in this paper we propose PT-M2, a novel PT-based GEC metric that combines the advantages of both the PT-based metrics and traditional metrics. Unlike the PT-based metrics scoring a whole sentence, PT-M2 only uses PT-based metrics to score the changed words that can be extracted by the M2 metric (Dahlmeier and Ng, 2012). Experimental results on the CoNLL14 evaluation task show that PT-M2 achieves the highest correlation compared to traditional metrics based on two kinds of system ranking methods, either calculating score at the corpus- or sentence-level. We also show that PT-M2 does not heavily rely on the scale of PT-based models, even equipped with a small-scale model can obtain satisfactory results.
Our main contributions are listed as follows:
-
•
We revisit GEC evaluation and find that the arbitrary use of PT-based metrics results in poor correlation with human judgments. We analyze the corresponding reasons in terms of scoring strategies for different metrics.
-
•
We propose a novel PT-based GEC metric PT-M2, which only uses PT-based metrics to score the correction words. PT-M2 achieves a new state-of-the-art of 0.949 Pearson correlation on the CoNLL14 evaluation task.
-
•
We find that PT-M2 still performs well in evaluating high-performing GEC systems, which is helpful for promoting GEC research and upgrading the GEC system in the future.
| Latest GEC Work | M2 | ERRANT | GLEU |
| Omelianchuk et al. (2020) | |||
| Sun and Wang (2022) | |||
| Lai et al. (2022) | |||
| Tarnavskyi et al. (2022) | |||
| \hdashlineStahlberg and Kumar (2020) | |||
| Kaneko et al. (2020) | |||
| Katsumata and Komachi (2020) | |||
| Parnow et al. (2021) |
2 Related Work
2.1 Overlap-based GEC Metrics
As a growing number of high-performance GEC models are proposed (Liu et al., 2021; Li et al., 2022; Zhang et al., 2022), it is important to provide interpretable and reliable evaluation metrics to measure their quality. Several overlap-based GEC metrics have been provided to evaluate GEC models. As shown in Table 2, despite employing PT-based models for model training, recently published works still use overlap-based GEC metrics (e.g., M2 Dahlmeier and Ng (2012), GLEU Napoles et al. (2015), and ERRANT Bryant et al. (2017)) for GEC evaluation.
Dale and Kilgarriff (2011) first align source sentences and hypothesis sentences using the Levenshtein algorithm for GEC evaluation. Dahlmeier and Ng (2012) convert each source-hypothesis pair to an edit sequence dynamically, extracting the corresponding edits and using the F1 measure to represent the score of each system. Similar to Dahlmeier and Ng (2012), Felice and Briscoe (2015) evaluate corrections at the token level, leveraging a globally optimal alignment algorithm on source-hypothesis pairs and source-reference pairs respectively. Napoles et al. (2015) propose a variant of BLEU that rewards n-grams appearing in hypothesis sentences and reference sentences but not in source sentences, penalizing n-grams in source sentences and hypothesis sentences but not in reference sentences and averaging scores over different references. Bryant et al. (2017) employ a linguistically-enhanced Damerau-Levenshtein algorithm to align sentence pairs, merging parts of the alignment and automatically classifying each edit with pre-defined rules. Choshen et al. (2020) propose a multilingual variant of ERRANT, extracting and classifying edits with universal dependencies. Gotou et al. (2020) focus on difficulty for the model to correct different types of errors and use several GEC models to compute the difficulty weight for each edit. However, a natural weakness is that traditional overlap-based metrics cannot capture the similarity between semantically similar words, limiting their effectiveness.
2.2 PT-based NLG Metrics
PT-based methods are not only used in the training stage of NLG tasks but also in designing evaluation metrics to assess the performance of NLG models, which can overcome the above core weakness of overlap-based metrics. Several recently proposed PT-based metrics have dominated a large number of NLG evaluation tasks. Lo (2019) use cross-lingual PT-based models to encode source sentences and hypothesis sentences and compute the cosine distances with a semantic parser. Zhao et al. (2020) compute scores for source-hypothesis pairs with cross-lingual PT-based models, re-aligning the vector space and using a language model to score fluency. Belouadi and Eger (2022) develop a fully unsupervised evaluation metric that leverages pseudo-parallel pairs obtained from fully unsupervised evaluation metrics and use pseudo reference sentences from unsupervised translation systems. Song et al. (2021) introduce a metric combined by BERTScore, Word Mover’s Distance and sentence semantic similarity. Gekhman et al. (2020) extract the entities from source sentences and hypothesis sentences via a multilingual knowledge base respectively and measure the recall of two entitie sets. Yoshimura et al. (2020) train a BERT-based regression model to optimize multiple sub-metrics on the GEC evaluation dataset. Islam and Magnani (2021) leverage GPT2 Radford et al. (2018) to measure the grammaticality for the GEC outputs.
Zhang et al. (2020) compute the similarity score for each token in hypothesis sentences with each token in reference sentences and use greedy matching to maximize each similarity score. Zhao et al. (2019) combine contextualized embeddings with Word Mover’s Distance to soft align tokens from hypothesis sentences to reference sentences. Yuan et al. (2021) introduce that a high-quality hypothesis will be easily generated based on source sentence or reference sentence or vice-versa, and use the generation probability to evaluate system outputs. Sellam et al. (2020) generate a large number of synthetic hypothesis-reference sentence pairs and pretrain BERT on several supervision signals with a parameterized regression layer to help the model generalization. Rei et al. (2020) propose two evaluation frameworks that predict the quality score and minimize the distance between the “better” hypothesis sentence and the corresponding reference sentence respectively. Zhan et al. (2021b) evaluate different PT-based NLG metrics for machine translation tasks. Benefiting from PT-based metrics, the correlation with human judgments has significantly improved on NLG evaluation. In this work, we would like to investigate the effectiveness of PT-based metrics on GEC evaluation.
| System | Sentence | Rank | BERTScore |
| SRC | They play the important role in our life which can not be substituted . | - | - |
| REF | They play an important role in our life which can not be substituted . | - | - |
| AMU | They play an (0.99) important role in our life which can not be replaced (0.75) . | 1 | 0.94 |
| UFC | They play the (0.63) important role in our life which can not be substituted (0.99) . | 2 | 0.95 |
3 Revisiting Existing Metrics
This section revisits existing overlap-based GEC metrics and PT-based metrics on the GEC evaluation task, computing the metric correlation with human judgments, analyzing experimental results and exploring the differences among the metrics.
3.1 Experimental Setup
Dataset Settings
We conduct experiments on the CoNLL14 evaluation task Grundkiewicz et al. (2015). There are 1,312 source sentences, and each source sentence corresponds to two standard reference sentences. Twelve teams have provided their system outputs and the source sentences are used as the thirteenth system. Eight annotators judge the quality of hypothesis sentences generated by corresponding GEC systems. Each hypothesis sentence is scored from 1 to 5, which means from worst to best. Two system ranking lists are respectively generated by Expected -Wins (EW) and Trueskill (TS) algorithms.
Experiment Settings
The method to estimate the performance of GEC evaluation metrics is measuring the degree of correlation with human judgments. Following Grundkiewicz et al. (2015), we measure the correlation between metrics and human judgments based on the system-level ranking, computing Pearson and Spearman respectively as the final correlations. We compute the score for each system in two settings: corpus-level and sentence-level. Given the metric M, source sentences , hypothesis sentences and reference sentences , the first setting computes the system score based on the whole corpus , and the last one uses the average of the sentence-level scores .
Evaluation Metrics
We compare the following overlap-based GEC metrics and PT-based metrics:
-
•
GLEU rewards hypothesis n-grams that match reference sentences but not source sentences and penalizes hypothesis n-grams that match source sentences but not reference sentences Napoles et al. (2015).
-
•
M2 aligns source sentences and hypothesis sentences with Levenshtein algorithm, dynamically choosing the alignment that maximally matches the gold edits and extracting the system edits. Dahlmeier and Ng (2012). F0.5 is used as the system score.
-
•
SentM2 is a variant of M2, using the average of F0.5 scores computed at the sentence-level as the system score.
-
•
ERRANT aligns sentence pairs with a linguistic-enhanced Damerau-Levenshtein algorithm and uses two kinds of rules to merge alignment, extract and classify edits Bryant et al. (2017). F0.5 is used as the system score.
-
•
SentERRANT is a variant of ERRANT, using the average of F0.5 scores computed at the sentence-level as the system score.
-
•
BERTScore is a PT-based metric, which computes the token similarity between the sentence pairs and uses greedy matching to maximize the matching similarity score Zhang et al. (2020).111We use the reference sentences from the CoNLL14 evaluation task as the corpus to compute the IDF weight.
-
•
BARTScore is a PT-based metric, which converts the evaluation task to a sequence generation task and uses the generation probability to estimate the quality of system outputs Yuan et al. (2021).222We use the reference sentence as the input and generate the corresponding hypothesis sentence.

| Metric | EW | TS | ||
| GLEU | 0.701 | 0.467 | 0.750 | 0.555 |
| ERRANT | 0.642 | 0.659 | 0.688 | 0.698 |
| SentERRANT | 0.870 | 0.742 | 0.846 | 0.747 |
| M2 | 0.623 | 0.687 | 0.672 | 0.720 |
| SentM2 | 0.871 | 0.731 | 0.864 | 0.758 |
| BARTScore | 0.172 | 0.253 | 0.173 | 0.269 |
| BERTScore | 0.262 | 0.074 | 0.166 | -0.022 |
3.2 Preliminary Results
PT-based Metrics Fail
The results of the existing metrics are shown in Table 4. The advantages are different between GLEU and M2 as GLEU is better than M2 on Pearson and worse on Spearman Chollampatt and Ng (2018b). We introduce ERRANT to compute its correlation with human judgments since ERRANT can extract and classify edits automatically, which has been used as the standard metric in GEC Bryant et al. (2017). Without using the gold edits annotated by humans, ERRANT can still get a relatively high correlation. We also find that computing the system score at the sentence-level for M2 and ERRANT can get a higher correlation than computing at the corpus-level, which is the same as in Napoles et al. (2016).
Besides, we observe that even though the PT-based metrics such as BERTScore and BARTScore have dominated in the evaluation of multiple NLG tasks Scialom and Hill (2021), they correlate much lower than overlap-based GEC metrics on the GEC evaluation task, whether for Pearson or Spearman, and are even negatively correlated with human judgments. So why are PT-based metrics not suitable to evaluate GEC systems? What are the differences between the PT-based metrics and overlap-based GEC metrics?
Discussion
This part aims to answer the above questions. As shown in Table 3, to figure out why PT-based metrics are not suitable for GEC evaluation, we analyze a representative from the CoNLL14 evaluation task. For the two edits provided by the AMU system, even though the change of the correct edit score is larger than that of the wrong correction edit, the AMU system score provided by BERTScore is lower than that of the UFC system, which leads to the result being different with human annotation. A possible reason is that BERTScore computes scores for all the tokens in the sentence, a large percentage of the score for the unchanged part affects the trend of the overall score. When an edit is applied, not only the corresponding edit score is changed, but the scores of surrounding tokens are also affected, causing BERTScore to fail to make a correct assessment. The excessive attention to unchanged words potentially biases the final score of PT-based metrics.
4 PT-M2: The Best of Both Worlds
4.1 Motivation
Based on the above findings, to inject pretrained knowledge into GEC evaluation metrics, we propose PT-M2, which takes advantage of both PT-based metrics and overlap-based GEC metrics. PT-M2 computes edit scores with PT-based metrics. Without directly using PT-based metrics to score hypothesis-reference sentence pairs, we use them at the edit-level to compute a score for each edit. As shown in Figure 1, we first extract the system edit set and gold edit set from the source-hypothesis sentence pair and source-reference sentence pair respectively. We then compute the score of each edit with PT-based metrics as the scorer. Lastly we apply edit scores as the edit weights on the M2.
4.2 Implementation
Edit Extraction
Given a source sentence , a hypothesis sentence and a reference sentence , the first step we have to do is to extract the system edit set and gold edit set from the source-hypothesis sentence pair and source-reference sentence pair respectively Dahlmeier and Ng (2012); Bryant et al. (2017). As shown in Figure 1, each edit is composed of edit operation, start index, end index and correct tokens. We use the edit extraction module from M2 to extract both two edit sets.333Due to the fact that the CoNLL14 evaluation task has provided the gold edit set, we only need to extract the system edit set by M2. The intersection of the system edit set and gold edit set represents all of the correct edits provided by corresponding system.
| Type | Metric | PT Model | EW (Corpus) | TS (Corpus) | EW (Sentence) | TS (Sentence) | ||||
| Overlap | GLEU | - | 0.701 | 0.467 | 0.750 | 0.555 | 0.784 | 0.720 | 0.828 | 0.775 |
| ERRANT | - | 0.642 | 0.659 | 0.688 | 0.698 | 0.870 | 0.742 | 0.846 | 0.747 | |
| M2 | - | 0.623 | 0.687 | 0.672 | 0.720 | 0.871 | 0.731 | 0.864 | 0.758 | |
| PT | BARTScore | BART | - | - | - | - | 0.172 | 0.253 | 0.173 | 0.269 |
| BERTScore | BERT | - | - | - | - | 0.262 | 0.074 | 0.166 | -0.022 | |
| Ours | PT-ERRANT | BART | 0.681 | 0.797 | 0.727 | 0.841 | 0.905 | 0.786 | 0.897 | 0.824 |
| PT-ERRANT | BERT | 0.705 | 0.780 | 0.745 | 0.797 | 0.941 | 0.879 | 0.917 | 0.846 | |
| \cdashline2-11 | PT-M2 | BART | 0.667 | 0.775 | 0.715 | 0.813 | 0.898 | 0.813 | 0.901 | 0.841 |
| PT-M2 | BERT | 0.693 | 0.758 | 0.737 | 0.769 | 0.949 | 0.907 | 0.938 | 0.874 | |
Edit Score
Without treating each edit equally, we propose a novel method to score each edit, employing PT-based metrics (e.g., BERTScore and BARTScore) as the edit scorer (PTScore). As shown in Figure 1, we first build an edit set , which is the union of the system edit set and gold edit set . Then, we compute the score of each edit in the edit set and obtain an edit score set , in which is the score of the edit . To achieve this goal, the first step we applied is to use each edit in the edit set to generate a partially correct version of the source sentence . Then we use PTScore to compute the scores of the sentence pair and respectively, the more similarity between the sentence pair which input to PTScore, the higher the score that PTScore gives. The score differences are used to measure whether the edit is beneficial or not:
| (1) |
> 0 means the edit is helpful for correction, which shows it is a correct edit, otherwise is a wrong correction edit. We use the absolute value as the edit score. The larger the is, the edit has a greater impact on the sentence, whether beneficial or harmful.
Final Score
As shown in Figure 1, given the system edit set , the gold edit set , and the edit score set , we treat each edit score as the corresponding edit weight and apply edit weight on each edit to compute precision, recall and F0.5 measure respectively:
| (2) |
| (3) |
| (4) |
A value of 0.5 is used in PT-M2 follows vanilla M2. To compute the system score, we compute F0.5 based on the whole corpus to represent the corpus-level PT-M2 and use the average of F0.5 score for each sentence to represent the sentence-level PT-M2 Napoles et al. (2016). Besides, since our approach is transparent to the type of edits, it can be directly applied to other overlap-based GEC metrics, such as ERRANT.
5 Experiment
PT-M2 can combine the advantages of both PT-based metrics and overlap-based GEC metrics. In PT-M2, PT-based metrics only compute edit scores that can reduce the impact of unchanged part on the final score, paying more attention to the changes in the source sentences and editing scores are applied as corresponding edit weights on the M2.
To demonstrate the effectiveness of our approach, we use PT-M2 to evaluate GEC system outputs and compute the correlation with human judgments on the CoNLL14 evaluation task Grundkiewicz et al. (2015). We choose Pearson and Spearman to measure the correlations. We use PT-M2 to compute both the system score at corpus- and sentence-level Napoles et al. (2016). We adopt two well-known unsupervised PT-based metrics BERTScore and BARTScore to score edits, which can be used in multiple domains, tasks and languages Scialom and Hill (2021). The other metrics have been introduced in Section 3.1.
| Rank | Metric | Human | ||||
| BERTScore | M2 | SentM2 | PT-M2 | EW | TS | |
| 1 | INPUT (9) | CAMB (1) | CUUI (3) | AMU (0) | AMU | AMU |
| 2 | UFC (4) | CUUI (2) | AMU (1) | CUUI (2) | RAC | CAMB |
| 3 | IITB (6) | AMU (2) | CAMB (0) | CAMB (0) | CAMB | RAC |
| 4 | RAC (1) | POST (1) | POST (1) | RAC (1) | CUUI | CUUI |
| 5 | SJTU (5) | NTHU (7) | NTHU (7) | POST (0) | POST | POST |
| 6 | PKU (0) | RAC (3) | RAC (3) | PKU (0) | UFC | PKU |
| 7 | AMU (6) | UMC (0) | PKU (0) | UFC (1) | PKU | UMC |
| 8 | POST (3) | PKU (1) | UMC (0) | SJTU (2) | UMC | UFC |
| 9 | CUUI (5) | SJTU (1) | SJTU (1) | IITB (0) | IITB | IITB |
| 10 | UMC (2) | UFC (2) | UFC (2) | NTHU (2) | SJTU | INPUT |
| 11 | IPN (2) | IPN (2) | IITB (2) | INPUT (0) | INPUT | SJTU |
| 12 | CAMB (9) | IITB (3) | INPUT (1) | UMC (4) | NTHU | NTHU |
| 13 | NTHU (1) | INPUT (2) | IPN (0) | IPN (0) | IPN | IPN |
| \hdashline | 53 | 27 | 21 | 12 | - | - |
5.1 Main Results
Table 5 reports the correlations of overlap-based GEC metrics, PT-based metrics, and our PT-based GEC metric PT-M2. PT-M2 aligns better with human judgments compared to traditional overlap-based GEC metrics, either computed at corpus- or sentence-level Napoles et al. (2016). Besides, for the two human rankings proposed by EW and TS, PT-M2 makes a significant improvement on both Pearson and Spearman correlations. Although BERTScore and BARTScore are computed in different ways Sai et al. (2022), we find that our approach uses either of them as the edit scorer can get a similarly high correlation.
We also test a variant of our approach, namely PT-ERRANT, with the same operations as in PT-M2. Compared to ERRANT, PT-ERRANT gets higher correlation with human judgments. We find that comparing PT-M2 and PT-ERRANT, PT-M2 correlates better at the sentence-level while PT-ERRANT aligns better at the corpus-level. We also test different values of when computing Fβ as the final score. The results show that PT-M2 correlates more stable and is consistently better than M2. It is worth mentioning that the sentence-level PT-M2 with BERTScore as the scorer gets the highest correlation among all of the metrics we have experimented with. Therefore, we treat it as the main version of PT-M2 and use the sentence-level PT-M2 in the subsequent experiments.
| Models | Size | EW | TS | ||
| BART | Small | 0.883 | 0.743 | 0.869 | 0.740 |
| Base | 0.898 | 0.813 | 0.901 | 0.841 | |
| Large | 0.899 | 0.813 | 0.906 | 0.841 | |
| BERT | Small | 0.953 | 0.923 | 0.941 | 0.890 |
| Base | 0.949 | 0.907 | 0.938 | 0.874 | |
| Large | 0.945 | 0.918 | 0.931 | 0.879 | |
5.2 Analysis
Effect of PT-based models
To demonstrate the generality and generalizability of our approach, we use different sizes of PT-based metrics as the edit scorer to verify if the correlation of our approach is stable. As shown in Table 7, we experiment with PT-M2 at the sentence-level, employing BERTScore and BARTScore in three different sizes, from small to large respectively. Even if we use the distilled version of BERTScore Sanh et al. (2019), PT-M2 also aligns much better with human judgments than M2 and gets the similar correlation with the base and even the large size of models. So we can use the smaller size of PT-based metrics to accelerate the computation of GEC evaluation, with a trivial performance drop.
System Ranking
Table 5 presents the ranking results. Compared to other metrics, PT-M2 shows the lowest rank differences with human judgments. PT-M2 successfully ranks the best system (AMU) while the other metrics fail. Compared to BERTScore, PT-M2 successfully ranks the INPUT system. Meanwhile, PT-M2 gets a relatively better ranking result for the NTHU system than M2 and SentM2. This confirms the effectiveness of PT-M2.
Effect of Top- Systems
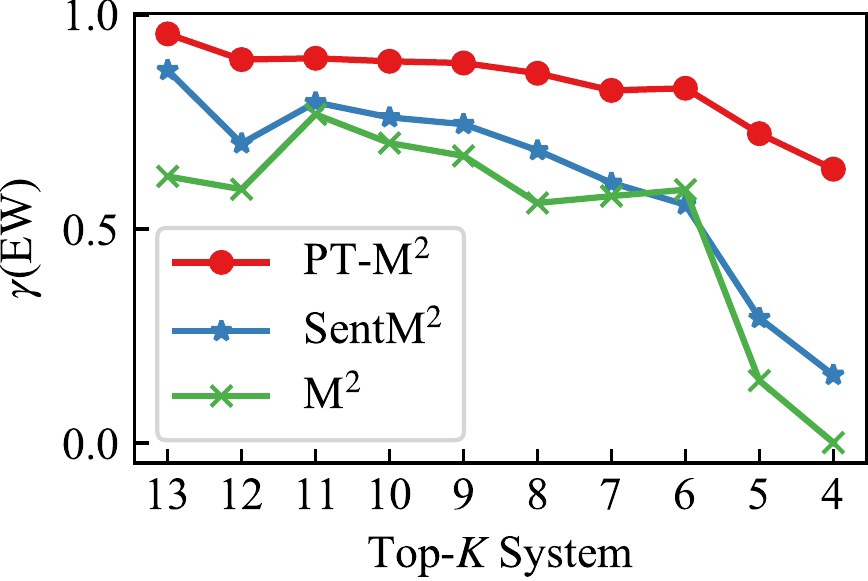
To demonstrate the effectiveness of our approach, we evaluate high-performing systems with our approach to observe the change of correlations among different metrics Zhan et al. (2021a). Figure 2 compares the Pearson correlation of the top- systems. When decreases, the correlations of M2 and SentM2 are lower than before correspondingly. Meanwhile, we find that the correlation of our approach PT-M2 computed at the sentence-level drops much slower than M2 and SentM2. Further, when is lower than 6, the Pearson correlations of M2 and SentM2 drop sharply while PT-M2 does not act the same way under the circumstances. More specifically, as the system count drops from 13 to 4, the Pearson correlations of M2 and SentM2 down three times or even more. In contrast, the decline of PT-M2 correlation is not obvious, which demonstrates the effectiveness of applying edit scores computed by PT-based metrics as corresponding edit weights on the overlap-based GEC metrics.
| System | Sentence | Rank | M2 | PT-M2 |
| SRC | It is also entire incorrect to fault social media alone for the lack of interpersonal skill . | - | - | |
| REF | It is also entirely incorrect to fault social media alone for the lack of interpersonal skills . | - | - | |
| NTHU | It is also entirely incorrect to fault social media alone for lack of interpersonal skills . | 1 | 0.71 | 0.88 |
| PKU | It is also entire incorrect to fault social media alone for the lack of interpersonal skills . | 2 | 0.83 | 0.44 |

Effect of Edit Score
We carry out a set of comparative experiments to demonstrate the necessity of computing edit weights. In our approach PT-M2, we use PT-based metrics such as BERTScore and BARTScore to compute edit scores. The more important the edit, the higher score we provide. In the comparative experiments, we use the inverse of each edit score computed by PT-based metrics as the corresponding edit weight, , to demonstrate the importance of edit weights on overlap-based GEC metrics. For convenience, we use PT-M2 (inverse) as the above comparative approach.
Figure 3 the comparison between the Pearson and Spearman correlations of the three metrics. After inversing edit weights computed by PT-based metrics, both the correlations measured by Pearson and Spearman are lower than SentM2 for a large. Based on the above results, we demonstrate the effectiveness and advantages of employing PT-based metrics to directly compute edit weights.
A Case Study
As shown in Table 8, to explain why our approach PT-M2 correlates better with human judgments than M2, we present an example from the CoNLL14 evaluation task Grundkiewicz et al. (2015). The human ranking shows that the NTHU system score is higher than that of the PKU system. M2 provides the wrong ranking result while PT-M2 aligns the same as human judgments. In this example, PT-M2 measures the gold edit only provided by the NTHU system as the highest score, which means it is much more important to predict this edit. Meanwhile, PT-M2 sets the wrong correction edit supplied by the NTHU system with a lower score, which influences the source sentence a little. PT-M2 successfully scores higher for the NTHU system.
6 Conclusion and Future Work
In this work, we revisit GEC metrics and explore the feasibility of employing PT-based metrics to evaluate GEC systems. Compared to overlap-based GEC metrics, PT-based metrics correlate worse with human judgments. The reason we find is that PT-based metrics compute score for each token in ungrammatical sentences, however, the scores of the unchanged part account for a large proportion of the final score, leading to an inaccurate evaluation result. To leverage pretrained knowledge in GEC evaluation, we propose a novel PT-based GEC metric PT-M2, employing PT-based metrics to score edits extracted from sentence pairs and applying edit scores as corresponding edit weights on the M2. Experiments demonstrate that PT-M2 gets the highest correlation on the CoNLL14 evaluation task, achieving a new state-of-the-art result of 0.949 Pearson correlation. Besides, further analysis shows that PT-M2 is competent to evaluate high-performing GEC systems.
In the future, we would like to test the effectiveness of PT-M2 in the GEC evaluation tasks of other languages (e.g., Chinese). It is also worthwhile to explore the benefits of PT-M2 as a signal for reinforcement learning to train better GEC systems.
Limitations
Our PT-based GEC metric PT-M2 has got the highest correlation with human judgments on GEC evaluation tasks. A reason that might limit the widespread use of PT-based metrics is that the calculation speed is slower than that of the traditional overlap-based GEC metrics. As PT-M2 uses PT-based metrics to score each edit, it takes nearly 2 minutes to calculate a system score based on a single NVIDIA GTX 3080TI card, which is slower than the calculation speed of the traditional M2 score that costs nearly 10 seconds. Therefore, there is still room for improvement in calculation speed, and we will continue developing parallel computing to speed it up in the future.
Acknowledgments
This work was supported in part by the National Natural Science Foundation of China (Grant No. 62206076) and Shenzhen College Stability Support Plan (Grant No. GXWD20220811173340003 and GXWD20220817123150002). The authors would like to thank the anonymous reviewers for their insightful suggestions.
References
- Belouadi and Eger (2022) Jonas Belouadi and Steffen Eger. 2022. Uscore: An effective approach to fully unsupervised evaluation metrics for machine translation. arXiv preprint arXiv:2202.10062.
- Bryant et al. (2017) Christopher Bryant, Mariano Felice, and Ted Briscoe. 2017. Automatic annotation and evaluation of error types for grammatical error correction. In Proceedings of the 55th Annual Meeting of the Association for Computational Linguistics (Volume 1: Long Papers), pages 793–805, Vancouver, Canada. Association for Computational Linguistics.
- Chollampatt and Ng (2018a) Shamil Chollampatt and Hwee Tou Ng. 2018a. A multilayer convolutional encoder-decoder neural network for grammatical error correction. In Proceedings of the Thirty-Second AAAI Conference on Artificial Intelligence, (AAAI-18), the 30th innovative Applications of Artificial Intelligence (IAAI-18), and the 8th AAAI Symposium on Educational Advances in Artificial Intelligence (EAAI-18), New Orleans, Louisiana, USA, February 2-7, 2018, pages 5755–5762. AAAI Press.
- Chollampatt and Ng (2018b) Shamil Chollampatt and Hwee Tou Ng. 2018b. A reassessment of reference-based grammatical error correction metrics. In Proceedings of the 27th International Conference on Computational Linguistics, pages 2730–2741, Santa Fe, New Mexico, USA. Association for Computational Linguistics.
- Choshen et al. (2020) Leshem Choshen, Dmitry Nikolaev, Yevgeni Berzak, and Omri Abend. 2020. Classifying syntactic errors in learner language. In Proceedings of the 24th Conference on Computational Natural Language Learning, pages 97–107, Online. Association for Computational Linguistics.
- Dahlmeier and Ng (2012) Daniel Dahlmeier and Hwee Tou Ng. 2012. Better evaluation for grammatical error correction. In Proceedings of the 2012 Conference of the North American Chapter of the Association for Computational Linguistics: Human Language Technologies, pages 568–572, Montréal, Canada. Association for Computational Linguistics.
- Dale and Kilgarriff (2011) Robert Dale and Adam Kilgarriff. 2011. Helping our own: The HOO 2011 pilot shared task. In Proceedings of the 13th European Workshop on Natural Language Generation, pages 242–249, Nancy, France. Association for Computational Linguistics.
- Devlin et al. (2019) Jacob Devlin, Ming-Wei Chang, Kenton Lee, and Kristina Toutanova. 2019. BERT: Pre-training of deep bidirectional transformers for language understanding. In Proceedings of the 2019 Conference of the North American Chapter of the Association for Computational Linguistics: Human Language Technologies, Volume 1 (Long and Short Papers), pages 4171–4186, Minneapolis, Minnesota. Association for Computational Linguistics.
- Felice and Briscoe (2015) Mariano Felice and Ted Briscoe. 2015. Towards a standard evaluation method for grammatical error detection and correction. In Proceedings of the 2015 Conference of the North American Chapter of the Association for Computational Linguistics: Human Language Technologies, pages 578–587, Denver, Colorado. Association for Computational Linguistics.
- Gekhman et al. (2020) Zorik Gekhman, Roee Aharoni, Genady Beryozkin, Markus Freitag, and Wolfgang Macherey. 2020. Kobe: Knowledge-based machine translation evaluation. arXiv preprint arXiv:2009.11027.
- Gotou et al. (2020) Takumi Gotou, Ryo Nagata, Masato Mita, and Kazuaki Hanawa. 2020. Taking the correction difficulty into account in grammatical error correction evaluation. In Proceedings of the 28th International Conference on Computational Linguistics, pages 2085–2095, Barcelona, Spain (Online). International Committee on Computational Linguistics.
- Grundkiewicz et al. (2015) Roman Grundkiewicz, Marcin Junczys-Dowmunt, and Edward Gillian. 2015. Human evaluation of grammatical error correction systems. In Proceedings of the 2015 Conference on Empirical Methods in Natural Language Processing, pages 461–470, Lisbon, Portugal. Association for Computational Linguistics.
- Islam and Magnani (2021) Md Asadul Islam and Enrico Magnani. 2021. Is this the end of the gold standard? a straightforward reference-less grammatical error correction metric. In Proceedings of the 2021 Conference on Empirical Methods in Natural Language Processing, pages 3009–3015.
- Kaneko et al. (2020) Masahiro Kaneko, Masato Mita, Shun Kiyono, Jun Suzuki, and Kentaro Inui. 2020. Encoder-decoder models can benefit from pre-trained masked language models in grammatical error correction. In Proceedings of the 58th Annual Meeting of the Association for Computational Linguistics, pages 4248–4254, Online. Association for Computational Linguistics.
- Katsumata and Komachi (2020) Satoru Katsumata and Mamoru Komachi. 2020. Stronger baselines for grammatical error correction using pretrained encoder-decoder model. arXiv preprint arXiv:2005.11849.
- Lai et al. (2022) Shaopeng Lai, Qingyu Zhou, Jiali Zeng, Zhongli Li, Chao Li, Yunbo Cao, and Jinsong Su. 2022. Type-driven multi-turn corrections for grammatical error correction. arXiv preprint arXiv:2203.09136.
- Lewis et al. (2020) Mike Lewis, Yinhan Liu, Naman Goyal, Marjan Ghazvininejad, Abdelrahman Mohamed, Omer Levy, Veselin Stoyanov, and Luke Zettlemoyer. 2020. BART: Denoising sequence-to-sequence pre-training for natural language generation, translation, and comprehension. In Proceedings of the 58th Annual Meeting of the Association for Computational Linguistics, pages 7871–7880, Online. Association for Computational Linguistics.
- Li et al. (2022) Bei Li, Quan Du, Tao Zhou, Yi Jing, Shuhan Zhou, Xin Zeng, Tong Xiao, JingBo Zhu, Xuebo Liu, and Min Zhang. 2022. ODE transformer: An ordinary differential equation-inspired model for sequence generation. In Proceedings of the 60th Annual Meeting of the Association for Computational Linguistics (Volume 1: Long Papers), pages 8335–8351, Dublin, Ireland. Association for Computational Linguistics.
- Liu et al. (2021) Xuebo Liu, Longyue Wang, Derek F. Wong, Liang Ding, Lidia S. Chao, and Zhaopeng Tu. 2021. Understanding and improving encoder layer fusion in sequence-to-sequence learning. In International Conference on Learning Representations.
- Liu et al. (2019) Yinhan Liu, Myle Ott, Naman Goyal, Jingfei Du, Mandar Joshi, Danqi Chen, Omer Levy, Mike Lewis, Luke Zettlemoyer, and Veselin Stoyanov. 2019. Roberta: A robustly optimized bert pretraining approach. arXiv preprint arXiv:1907.11692.
- Lo (2019) Chi-kiu Lo. 2019. Yisi-a unified semantic mt quality evaluation and estimation metric for languages with different levels of available resources. In Proceedings of the Fourth Conference on Machine Translation (Volume 2: Shared Task Papers, Day 1), pages 507–513.
- Napoles et al. (2015) Courtney Napoles, Keisuke Sakaguchi, Matt Post, and Joel Tetreault. 2015. Ground truth for grammatical error correction metrics. In Proceedings of the 53rd Annual Meeting of the Association for Computational Linguistics and the 7th International Joint Conference on Natural Language Processing (Volume 2: Short Papers), pages 588–593, Beijing, China. Association for Computational Linguistics.
- Napoles et al. (2016) Courtney Napoles, Keisuke Sakaguchi, and Joel Tetreault. 2016. There’s no comparison: Reference-less evaluation metrics in grammatical error correction. In Proceedings of the 2016 Conference on Empirical Methods in Natural Language Processing, pages 2109–2115, Austin, Texas. Association for Computational Linguistics.
- Omelianchuk et al. (2020) Kostiantyn Omelianchuk, Vitaliy Atrasevych, Artem Chernodub, and Oleksandr Skurzhanskyi. 2020. GECToR – grammatical error correction: Tag, not rewrite. In Proceedings of the Fifteenth Workshop on Innovative Use of NLP for Building Educational Applications, pages 163–170, Seattle, WA, USA → Online. Association for Computational Linguistics.
- Parnow et al. (2021) Kevin Parnow, Zuchao Li, and Hai Zhao. 2021. Grammatical error correction as GAN-like sequence labeling. In Findings of the Association for Computational Linguistics: ACL-IJCNLP 2021, pages 3284–3290, Online. Association for Computational Linguistics.
- Radford et al. (2018) Alec Radford, Karthik Narasimhan, Tim Salimans, Ilya Sutskever, et al. 2018. Improving language understanding by generative pre-training.
- Rei et al. (2020) Ricardo Rei, Craig Stewart, Ana C Farinha, and Alon Lavie. 2020. COMET: A neural framework for MT evaluation. In Proceedings of the 2020 Conference on Empirical Methods in Natural Language Processing (EMNLP), pages 2685–2702, Online. Association for Computational Linguistics.
- Sai et al. (2022) Ananya B Sai, Akash Kumar Mohankumar, and Mitesh M Khapra. 2022. A survey of evaluation metrics used for nlg systems. ACM Computing Surveys (CSUR), 55(2):1–39.
- Sanh et al. (2019) Victor Sanh, Lysandre Debut, Julien Chaumond, and Thomas Wolf. 2019. Distilbert, a distilled version of bert: smaller, faster, cheaper and lighter. arXiv preprint arXiv:1910.01108.
- Scialom and Hill (2021) Thomas Scialom and Felix Hill. 2021. Beametrics: A benchmark for language generation evaluation evaluation. arXiv preprint arXiv:2110.09147.
- Sellam et al. (2020) Thibault Sellam, Dipanjan Das, and Ankur Parikh. 2020. BLEURT: Learning robust metrics for text generation. In Proceedings of the 58th Annual Meeting of the Association for Computational Linguistics, pages 7881–7892, Online. Association for Computational Linguistics.
- Song et al. (2021) Yurun Song, Junchen Zhao, and Lucia Specia. 2021. Sentsim: Crosslingual semantic evaluation of machine translation. In Proceedings of the 2021 Conference of the North American Chapter of the Association for Computational Linguistics: Human Language Technologies, pages 3143–3156.
- Stahlberg and Kumar (2020) Felix Stahlberg and Shankar Kumar. 2020. Seq2Edits: Sequence transduction using span-level edit operations. In Proceedings of the 2020 Conference on Empirical Methods in Natural Language Processing (EMNLP), pages 5147–5159, Online. Association for Computational Linguistics.
- Sun and Wang (2022) Xin Sun and Houfeng Wang. 2022. Adjusting the precision-recall trade-off with align-and-predict decoding for grammatical error correction. In Proceedings of the 60th Annual Meeting of the Association for Computational Linguistics (Volume 2: Short Papers), pages 686–693.
- Tarnavskyi et al. (2022) Maksym Tarnavskyi, Artem Chernodub, and Kostiantyn Omelianchuk. 2022. Ensembling and knowledge distilling of large sequence taggers for grammatical error correction. arXiv preprint arXiv:2203.13064.
- Yoshimura et al. (2020) Ryoma Yoshimura, Masahiro Kaneko, Tomoyuki Kajiwara, and Mamoru Komachi. 2020. SOME: Reference-less sub-metrics optimized for manual evaluations of grammatical error correction. In Proceedings of the 28th International Conference on Computational Linguistics, pages 6516–6522, Barcelona, Spain (Online). International Committee on Computational Linguistics.
- Yuan et al. (2021) Weizhe Yuan, Graham Neubig, and Pengfei Liu. 2021. Bartscore: Evaluating generated text as text generation. Advances in Neural Information Processing Systems, 34.
- Zhan et al. (2021a) Runzhe Zhan, Xuebo Liu, Derek F. Wong, and Lidia S. Chao. 2021a. Difficulty-aware machine translation evaluation. In Proceedings of the 59th Annual Meeting of the Association for Computational Linguistics and the 11th International Joint Conference on Natural Language Processing (Volume 2: Short Papers), pages 26–32, Online. Association for Computational Linguistics.
- Zhan et al. (2021b) Runzhe Zhan, Xuebo Liu, Derek F. Wong, and Lidia S. Chao. 2021b. Variance-aware machine translation test sets. In Thirty-fifth Conference on Neural Information Processing Systems, Datasets and Benchmarks Track.
- Zhang et al. (2020) Tianyi Zhang, Varsha Kishore, Felix Wu, Kilian Q. Weinberger, and Yoav Artzi. 2020. Bertscore: Evaluating text generation with BERT. In 8th International Conference on Learning Representations, ICLR 2020, Addis Ababa, Ethiopia, April 26-30, 2020. OpenReview.net.
- Zhang et al. (2022) Zheng Zhang, Liang Ding, Dazhao Cheng, Xuebo Liu, Min Zhang, and Dacheng Tao. 2022. Bliss: Robust sequence-to-sequence learning via self-supervised input representation. ArXiv, abs/2204.07837.
- Zhao et al. (2020) Wei Zhao, Goran Glavaš, Maxime Peyrard, Yang Gao, Robert West, and Steffen Eger. 2020. On the limitations of cross-lingual encoders as exposed by reference-free machine translation evaluation. arXiv preprint arXiv:2005.01196.
- Zhao et al. (2019) Wei Zhao, Maxime Peyrard, Fei Liu, Yang Gao, Christian M. Meyer, and Steffen Eger. 2019. MoverScore: Text generation evaluating with contextualized embeddings and earth mover distance. In Proceedings of the 2019 Conference on Empirical Methods in Natural Language Processing and the 9th International Joint Conference on Natural Language Processing (EMNLP-IJCNLP), pages 563–578, Hong Kong, China. Association for Computational Linguistics.
Appendix A Appendix
A.1 Algorithm
Algorithm 1 illustrates the calculation procedure of our PT-based GEC metric PT-M2, showing the whole process of how to compute the sentence-level PT-M2.
A.2 Command-line Interface
We introduce how to compute PT-M2 and its variant PT-ERRANT in different settings with our code: {python} python evaluate.py –base [m2|sentm2|errant|senterrant] –scorer [self|bertscore|bartscore] –source <src_file> –hypothesis <hyp_file> –reference <ref_file> –output <out_file>