Disentangling Electron-Boson Interactions on the Surface of a Familiar Ferromagnet
Abstract
We report energy renormalizations from electron-phonon and electron-magnon interactions in spin minority surface resonances on Ni(111). The different interactions are identified, disentangled, and quantified from the characteristic signatures they provide to the complex self-energy and the largely different binding energies at which they occur. The observed electron-magnon interactions exhibit a strong dependence on momentum and energy band position in the bulk Brillouin zone. In contrast, electron-phonon interactions from the same bands appear to be relatively momentum- and symmetry-independent. Additionally, a moderately strong () electron-phonon interaction is distinguished from a near-parabolic spin majority band not crossing the Fermi level.
I Introduction
In condensed matter, the interplay of electrons and other fundamental and collective excitations can induce new and exotic phases of electronic ordering. Perhaps most studied is the coupling between electrons and lattice vibrations (phonons) which can trigger an effective and attractive electron interaction and lead to superconductivity in elementary metals [1]. While low superconductivity can be well explained from electron-phonon coupling (EPC) alone, other and less conventional pairing mechanisms have been suggested as ingredients of high superconductivity [2, 3, 4, 5]. In superconducting ferro- and antiferromagnets, electrons can also couple to spin waves (magnons) [6, 7, 8, 9, 10, 11, 12]. Electron-magnon interactions are furthermore expected to mediate proximity-induced superconductivity across magnetic interfaces [13, 14, 15, 16, 17, 18].
For the experimental study of many-body interactions with electrons, angle-resolved photoemission spectroscopy (ARPES) is the tool of choice as the complete, complex self-energy can be extracted from the measured electronic bandstructures [19, 20, 21, 22, 23]. While EPC has been extensively studied using ARPES, there are only a handful of reports of electron-magnon couplings (EMC) available [24, 25, 26, 27, 28, 29, 30, 31]. The majority of these consider couplings only in specific electron bands or over small sub-regions of reciprocal space. This motivates the need for further investigations of the EMC – for instance, exploring how the interactions can vary between different spin bands and throughout the Brillouin zone (BZ).
Herein, we present a thorough study of the many-body interactions present in Ni(111). Electron-phonon and electron-magnon interactions are unraveled from different spin bands, at several different positions in the bulk BZ, and along several high-symmetry directions of the projected bulk BZ (hereinafter referred to as the PBZ). The EPC and EMC are disentangled from one another based on their characteristic signatures and contributions to the electron self-energy. The EMC of the spin minority bands exhibits a strong dependence on the electron momentum, i.e., the location within the bulk BZ, both in interaction strength and regarding the participating magnon modes. In contrast, the EPC is much less momentum-dependent and visible with reasonable strength in both the spin minority and majority bands.
First, an overview of the electronic structure of Ni(111) is given in Section II.1. Next, the different many-body effects observed from its spin majority and minority bands are discussed, disentangled, and quantified in Section II.2. A summary and final remarks are given in Section III. Additional details about the experiments and many-body analysis are given in the Appendices V.1-V.3 and the Supplementary Note [32].
II Results and Discussion
II.1 Electronic Structure and Surface Resonances
An overview of the electronic structure of Ni(111) near the Fermi level () is shown in Fig. 1. Along the direction the bulk BZ of Ni is projected onto a two-dimensional zone that is hexagonal and threefold symmetric (Fig. 1a) [33]. The projected Fermi surface is shown in Fig. 1b: as measured by ARPES with (left), and as calculated from first principles (DFT) while accounting for the available free-electron final-states at this photon energy (right) [34, 35, 20].
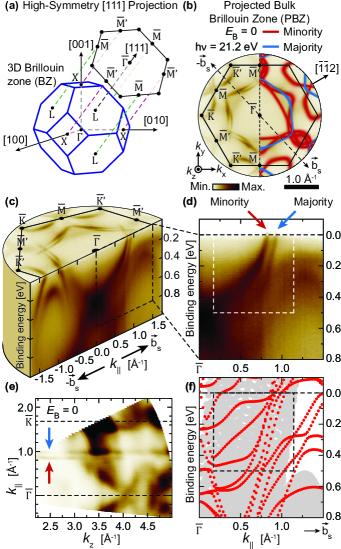
Approximately halfway from towards the edge of the first PBZ, two different spin minority contours and one spin majority contour can be distinguished near . The mentioned spin bands all meet near the high-symmetry point, and approximately halfway between and a maximum separation between the bands is seen. Defining an in-plane momentum vector () from and towards the PBZ boundary between and (Fig. 1b), the local energy dispersion of the spin bands can be investigated. An example cut along the directions is shown in Fig. 1c with two prominent spin bands highlighted (dashed rectangle). As further demonstrated in Fig. 1d, the two bands are nearly parallel and almost straight in the topmost near . Based on the free-electron final-state dependent calculations (Fig. 1b), the dispersion furthest away from at is interpreted as a spin majority band, and the one closer to as one of two possible spin minority bands.
Notably, a two-dimensional, dispersionless behavior can be observed from the mentioned spin minority and majority bands. While their surrounding energy band features at readily disperse with wave vector along the bulk direction, the two parallel spin bands appear approximately linear, with little or no dependence (Fig. 1e). These are common features of states that are localized or quasi-localized perpendicular at the atomic surface where the symmetry is broken [19].
In Fig. 1f, the calculated, unrenormalized spin minority surface states of Ni(111) along are shown, some of which appear to qualitatively resemble the dispersion of the measured spin minority states highlighted in Fig. 1d. The calculated spin minority states (Fig. 1f, red) appear to overlap with the projected spin majority states from the bulk (gray), thereby enabling coupling between surface and bulk states through spin-flip scattering processes by the absorption or emission of magnons [24]. A similar overlap is also present between the calculated spin majority surface states and the projected spin minority bulk bands (see the Supplementary Note [32]). Hence the measured, -independent bands in Figs. 1d and 1e are interpreted as surface resonance states [24, 19]. The calculations suggest that a handful of similar states exist near with -. Several different resonances should, therefore – in principle, be observable from ARPES measurements.
II.2 Signatures of Electron-Boson Interactions
The spin bands in Figs. 1c and 1d contain apparent signs of broadening over the binding energy range . Typically, such energy broadening can be described by various quasiparticle renormalizations, signaling a reduced lifetime and associated increased self-energy for the electron states [21]. One can often assume to vary slowly with momentum when observed over a narrow range of vs. – for instance, within the interaction region of a renormalized electron energy band [36]. The measured ARPES intensity at a temperature is then proportional to a simplified expression for the spectral function [20, 21]:
| (1) |
is again proportional to the imaginary part of the one-particle Green’s function for the photoexcitation process. Notably, Eq. II.2 states that for cuts through the data at constant binding energy , will assume a Lorentzian line profile with a peak maximum at the value of where and a full width at half maximum . By extracting and fitting momentum distribution curves (MDCs) at each measured energy one can then estimate the real and imaginary components of as [36, 25, 27]:
| (2) | ||||
| (3) |
Here, is the measured energy band dispersion, is the unrenormalized band, is the absolute value of its gradient, and is the measured peak half-width along the in-plane momentum () axis.
In Fig. 2a the fitted position of an interacting spin minority band of Ni(111) is shown. The same band that was also displayed along in Fig. 1c, but measured at a different position in the bulk BZ. Several clear deviations between the fitted band position and the one-particle band structure can be seen within of , and sudden energy broadenings along the measured band position are also apparent. Both features are typical hallmarks of electron-boson coupling (EBC) [23, 24, 25, 26, 27]. The experimental self-energy of the band was therefore estimated by a self-consistent analysis procedure based on Eqs. 2 and 3 (see Appendix V.2 for details). Its is shown in Fig. 2b, and is demonstrated to satisfy causality with via a Kramers-Kronig (K-K) transformation [37, 38]. From the spectrum a steep rise up to can be observed, followed by a broad feature over a larger energy range. The former can be related to the apparent ‘kink’ in the measured band position in Fig. 2a, and is a characteristic signature of EPC [39, 36, 37, 38, 40]. Its energy is furthermore in approximate agreement with the Debye temperature of bulk Ni [41].
Deconvolving by an integral inversion method produces the energy-dependent Eliashberg function , distinguishing the EBC modes that renormalize the locally measured electron band by their interaction energy [42, 43, 44, 45, 46, 47]. The resultant – as detailed in the Supplementary Note [32], immediately suggests two distinct couplings with energies matching the surface and bulk-derived vibrations of Ni [48, 49, 50, 51]. In addition, it contains several prominent couplings above the Ni Debye energy and up to [32].
Given the ferromagnetic nature of the system, interactions between electrons and magnons can occur [24, 25, 26, 27]. At a glance, signatures of EMC from ARPES should crudely resemble those of EPC. However, the two will typically have separate coupling energies, and their functional shape should also differ because of their intrinsically different energy dispersion relations [32, 29]. Alternatively, phonon or magnon mode-specific renormalizations can – under certain simplifying assumptions, be predicted from first principles calculations [52, 53, 54, 55]. However, discovering all the possible couplings requires an overview of the occupied bosonic modes; a detailed knowledge of the EBC matrix elements; and all the possible propagation channels between initial and final states that preserve energy and momentum. This is a complicated task already in lighter elements [47, 53, 55], and an accurate determination is beyond the scope of this work. We therefore attempt only a preliminary assignment of coupling modes to our data, basing our suggestions on the distinct energies of the phonons and magnons in Ni.
Resultingly, the interactions at are assigned to EPC with surface- and bulk-derived phonons [50, 48, 51]. Next, inelastic scattering measurements of bulk Ni have verified three different and characteristic magnon energy dispersions, namely: one acoustic branch along the propagation direction with energies ; another acoustic branch along with ; and one optical branch approximately between [56, 57, 58, 59]. The higher-energy signatures of are thus interpreted as EMC primarily with the acoustic magnons. However, some features may stem from the optical branch near its lower-energy extremum.
To disentangle the interaction strengths of the EPC and EMC, a minimalistic three-boson approximation consisting of two distinct phonon modes and one magnon mode was fitted to the data from Fig. 2b. This model reproduced the main features of , with energies , , and . The associated dimensionless EPC strength is in excellent agreement with previous estimates from calculations and surface-sensitive inelastic scattering measurements [60, 61]. Furthermore, the EMC strength approximately matches the value previously reported from ARPES [27]. The total EBC strength from the model is consistent within the value found from integral inversion analysis within the uncertainty (see Appendix V.2).
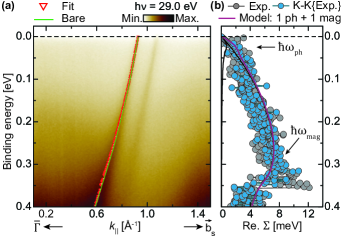
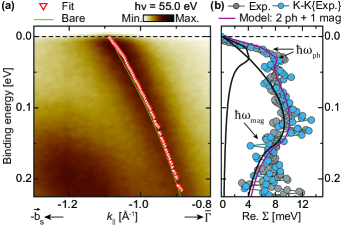
Interestingly, the innermost spin minority contour near the and points revealed additional EBC modes with different characteristic energies and strengths [32]. This spin minority band, as measured and fitted along direction , is shown in Fig. 3 together with the real part of its K-K consistent self-energy. Coupling can be readily distinguished up to , i.e., well beyond the maximum phonon and magnon energy values measured by inelastic scattering [48, 57]. However, calculations have indicated that the already mentioned optical magnon branch should exist in this energy range and out to the BZ boundary in [62]. EMC at similar energies in a different Ni spin minority band has also been reported [27]. We thus assign the higher-energy signatures to coupling primarily with optical magnons.
Similarly, the interactions as seen from Fig. 3b were quantified using a best-fit model consisting of two dominant boson modes: one EPC at with ; and one EMC at with . The former is situated amidst the phonon energy range and suggests a weak coupling to either of the known vibrational modes [48, 50, 51]. The latter indicates weak coupling to the optical magnons as already discussed [62]. Extracting by the integral inversion method yields interactions at similar energies and with a matching total EBC strength [32]. The reason behind the different participating boson modes and the smaller when compared to the EBC measured along (Fig. 2) is not immediately clear. Possibly, it may originate from having a different pairing of suitable initial and final electron states available at this position in the bulk BZ [63].
The estimated coupling energies and strengths from the two different vs. cuts along have been summarized in Table 1. Coupling parameters for the same cuts but measured at additional positions in the BZ, i.e. using different photoexcitation energies , have also been presented. Their corresponding plots are shown and discussed in the Supplementary Note [32].
Finally, attention is directed towards electron-boson interactions in the spin majority states. Close to midway between and a near parabolic spin majority band is found at below . This band also appeared along in Fig. 2a and was found to reach a global band maximum when measured with [32]. In Fig. 4a, the fitted spin majority band position is overlaid on the measured bandstructure, together with the one-particle band suggested by K-K analysis. To obtain a more accurate estimate of the band maximum, the renormalized band was asserted from a combination of MDC and energy distribution curve (EDC) fits [39, 21].
| Figure | Fitted band dispersion | [eV] | [meV] | [meV] | Temp. [K] | |||
|---|---|---|---|---|---|---|---|---|
| Fig. 2 | Min. spin | |||||||
| Fig. S6∗ | Min. spin | |||||||
| Fig. 3 | Min. spin | |||||||
| Fig. S7∗ | Min. spin | |||||||
| Fig. 4 | Maj. spin |
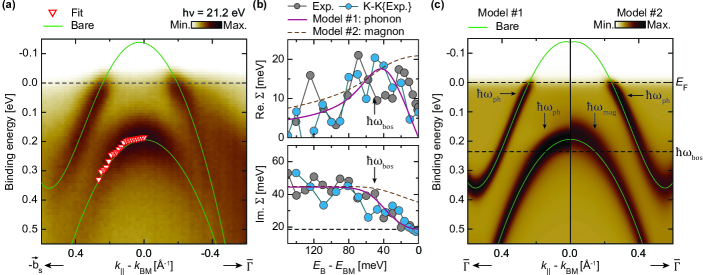
The resultant self-energy (Fig. 4b) indicates an EBC at , i.e., approximately below the band maximum energy . This is similar to one of the EMC energies reported from the spin minority bands (see Table 1). However, EMC at this energy does not satisfy the line shape of the measured . Specifically, it fails to reproduce the abrupt ‘step’ that is observed from . In comparison, a much better fit can be achieved using an EPC model that allows coupling from , with and . The abrupt increase in the electron density of states (DOS) at the band maximum then causes a relatively large compared to the EPC found near . Similarly strong EPC in near-parabolic bands below has been reported previously from ARPES, but only in two-dimensional and non-magnetic materials [64, 65, 66].
The data shown in Figs. 4a and 4b alone cannot give one definite answer about the bosonic origin of the interaction observed from the spin majority band. However, EPC appears to be more likely, based on the line shape of the contributions. To further explore the origin of the observed EBC, the spectral function from Fig. 4a was simulated within either of the two suggested coupling schemes. The simulations were performed using the suggested one-particle bands shown (i.e. ‘bare’ bands, in green), broadened by the experimental resolutions, and a Fermi-Dirac distribution at the measurement temperature (numbers in Appendix V.1). Based on additional measurements of the adjacent spin minority band (see Table 1), an EPC near with and was also included. The two simulations are shown side-by-side in Fig. 4c. Within the topmost below the two suggestions are very similar, as both have the same, dominant contribution from EPC in the spin minority band at . At larger binding energies, however, they reveal more striking differences. The suggested EMC significantly renormalizes the near-parabolic spin majority states, shifting these away from the one-particle energy band maximum and towards . A strong energy broadening is also present throughout the simulated energy range. In comparison, EPC within the spin majority band yields a more local renormalization: here, the energy broadening is concentrated around the one-particle energy band maximum at and a more pronounced kinking of the bandstructure is observed.
The simulated EPC is thus seen to better recreate the measured shape of the spin majority band (Fig. 4a) and its associated self-energy (Fig. 4b). The similar, but weaker coupling observed from the spin minority bands (Table 1) certainly confirms the presence of appreciable EPC in the system, which should also occur in the spin majority bands. Furthermore, one could argue that intra-band scattering from electron-phonon interactions can – in many cases, occur with a higher probability than inter-band electron-magnon scattering.
III Conclusions
In summary, we have demonstrated the existence and -dependence of both phonon- and magnon-derived quasiparticles in spin-minority, surface resonance energy bands on Ni(111). These have been disentangled based on their characteristic interaction energies and the functional form of their self-energy contributions. Different electron-magnon interactions have been observed and assigned to the distinctly different magnon modes available in the system. Previously unanticipated acoustic mode coupling has been demonstrated, and higher-energy optical mode coupling has been re-affirmed and re-interpreted, adding rigor to previous works [56, 57, 58, 59, 62, 27]. The specific magnon mode that electrons interact with – and also their associated coupling strengths , have been shown to vary dramatically with the spin minority band position within the bulk BZ.
Additionally, a moderately strong () renormalization has been observed in bulk spin majority bands at larger binding energies. This feature is best described by electron-phonon coupling near the corresponding energy band maximum and is – to the best of our knowledge, the first known reporting of such couplings from spin-polarized, sub-Fermi level energy band maxima in three-dimensional ferromagnets.
IV Acknowledgements
This work was partly supported by the Research Council of Norway (RCN), project numbers 324183, 315330, and 262633. Additional financial support was received from CALIPSOplus, under Grant Agreement 730872 from the EU Framework Programme for Research and Innovation HORIZON 2020. We acknowledge Elettra Sincrotrone Trieste and MAX IV Laboratory for providing time on their beamlines APE-LE and Bloch, respectively, and for technical support. Research conducted at MAX IV, a Swedish national user facility, is supported by the Swedish Research Council under contract 2018-07152, the Swedish Governmental Agency for Innovation Systems under contract 2018-04969, and Formas under contract 2019-02496. We would also like to thank T. Balasubramanian, T.-Y. Chien, B. Holst, R. Manson, J. Shi, A. Skarpeid, A. Sudbø, and E. Thingstad for insightful discussions on electron-boson interactions.
V Methods
V.1 Sample Preparation & Bandstructure Measurements
A clean Ni(111) surface was prepared by subjecting a bulk crystal to repeated cycles of Ar+ ion sputtering at , followed by annealing to for a short duration. The cleanliness of the surface was verified using low-energy electron diffraction (LEED) and X-ray photoelectron spectroscopy (XPS) of the relevant core levels (see the Supplementary Note [32]).
Energy bandstructure measurements were performed at using a NanoESCA III aberration-corrected EF-PEEM equipped with a He I photoexcitation source (), using pass energy and a entrance slit to the energy filter [67]. At the mentioned settings, the instrument had and resolutions of approximately and , respectively.
Higher energy resolution bandstructure measurements were performed at the synchrotron endstations APE-LE (Elettra, Trieste, Italy) and Bloch (MAX IV Laboratory, Lund, Sweden). At Elettra the Ni(111) crystal was cooled to and measured with an energy resolution . At Bloch the crystal temperature was and the energy resolution . All measurements at both facilities were performed using VG SCIENTA DA30 analyzers.
V.2 Self-Energy Analysis
Momentum distribution curves (MDCs) of the spin majority and minority bands were fitted over the relevant energy ranges using one or more Lorentzian line shapes, superimposed on a linear or polynomial background. The peak position and width (in ) of the bands at each measured energy were extracted, and in turn used to estimate and , respectively. An initial guess at the one-particle band was approximated by a degree polynomial over the same energy range as the fitted experimental data. Its shape was then adjusted to achieve causality between the self-energy components via the Kramers-Kronig (K-K) transform [37, 38, 65, 29].
To disentangle any bosonic contributions to the measured self-energies, the Eliashberg coupling function was extracted from each by an integral inversion method [42, 43, 44, 45, 46, 47]. The constant energy offset of each was assigned to broadening from a combination of electron-impurity scattering and the finite instrumental resolution [68]. Data points from the corresponding at energies were discarded to correct for distortions of the renormalized band position near [47]. Any signs of electron-electron scattering were indiscernible within the energy ranges measured and therefore excluded [69, 70]. From each extracted , the total electron mass-enhancement due to EBC in the quasielastic approximation was estimated as [71]:
| (4) |
where is the frequency of the observable bosonic mode with the highest energy.
To further quantify the individual EBC contributions to the measured , linear contributions of EPCs and EMCs were simulated and compared to the line shapes found from the experimental data. Each measured was fitted individually to minimize the root mean square (RMS) difference to the simulation of postulated couplings at the experimental temperature . The phonon occupancy was approximated by a three-dimensional Debye model with phonon DOS and Debye frequency [72]. A similar model was used for the magnons, with a maximum frequency and a magnon DOS , based on the energy dispersion expected for acoustic magnons [24, 27].
Each linear contribution () to from EBC was calculated as [36, 68]:
| (5) |
where is the Eliashberg coupling function for the interaction , and and are boson and fermion distributions, respectively. For phonons in the isotropic Debye model, when is assumed, with being the dimensionless strength of the EPC [39]. For isotropic magnons, for energies , with being the dimensionless EMC strength [24]. In each case, above . The corresponding to each was found using the K-K transform [37, 38].
V.3 First Principles Calculations
First-principles calculations were performed using the density functional theory (DFT) software package QuantumESPRESSO. A plane wave basis with ultra-soft pseudopotentials and the local density approximation (LDA) for the exchange-correlation energy were used. Bulk calculations were performed self-consistently in a system with periodic boundary conditions, and points were sampled using a Monkhorst-Pack grid of . The cut-off energy was and the convergence threshold . The surface states were calculated using a slab geometry with atomic layers and a separation of between slabs. Sampling of points was done using a Monkhorst-Pack grid of . The cut-off energy was and the convergence threshold .
To simulate the ARPES spectra visible when using photoexcitation energy of , the crystal momentum of the emitted electrons was selected according to the free-electron final state approximation of photoemission [20, 73]. In the extended BZ, a hemispherical cut with a radius corresponding to the free-electron final state wave vector at was calculated around . Only the states at the Fermi surface coinciding with the hemispherical shell were projected onto the (111) plane. See for instance Refs. 35 and 74 for additional details on the methodology. In determining the sphere radius, a work function (found by measurement, see the Supplementary Note [32]) and the value [74] for the inner potential was assumed. The corresponding projected bulk states yielded the spin-polarized constant energy surface displayed in Fig. 1b, matching the positions of the measured bands within an 8% difference. We assign this error to uncertainties in the and values used to determine the radius of the hemisphere.
References
- Bardeen et al. [1957] J. Bardeen, L. N. Cooper, and J. R. Schrieffer, Theory of superconductivity, Phys. Rev. 108, 1175 (1957).
- Gweon et al. [2004] G.-H. Gweon, T. Sasagawa, S. Zhou, J. Graf, H. Takagi, D.-H. Lee, and A. Lanzara, An unusual isotope effect in a high-transition-temperature superconductor, Nature 430, 187 (2004).
- Inosov et al. [2011] D. S. Inosov, J. T. Park, A. Charnukha, Y. Li, A. V. Boris, B. Keimer, and V. Hinkov, Crossover from weak to strong pairing in unconventional superconductors, Phys. Rev. B 83, 214520 (2011).
- Gotlieb et al. [2018] K. Gotlieb, C.-Y. Lin, M. Serbyn, W. Zhang, C. L. Smallwood, C. Jozwiak, H. Eisaki, Z. Hussain, A. Vishwanath, and A. Lanzara, Revealing hidden spin-momentum locking in a high-temperature cuprate superconductor, Science 362, 1271 (2018).
- Oh et al. [2021] M. Oh, K. P. Nuckolls, D. Wong, R. L. Lee, X. Liu, K. Watanabe, T. Taniguchi, and A. Yazdani, Evidence for unconventional superconductivity in twisted bilayer graphene, Nature 600, 240 (2021).
- Saxena et al. [2000] S. S. Saxena, P. Agarwal, K. Ahilan, F. M. Grosche, R. K. W. Haselwimmer, M. J. Steiner, E. Pugh, I. R. Walker, S. R. Julian, P. Monthoux, G. G. Lonzarich, A. Huxley, I. Sheikin, D. Braithwaite, and J. Flouquet, Superconductivity on the border of itinerant-electron ferromagnetism in UGe2, Nature 406, 587 (2000).
- Pfleiderer et al. [2001] C. Pfleiderer, M. Uhlarz, S. M. Hayden, R. Vollmer, H. v. Löhneysen, N. R. Bernhoeft, and G. G. Lonzarich, Coexistence of superconductivity and ferromagnetism in the -band metal ZrZn2, Nature 412, 58 (2001).
- Aoki et al. [2001] D. Aoki, A. Huxley, E. Ressouche, D. Braithwaite, J. Flouquet, J.-P. Brison, E. Lhotel, and C. Paulsen, Coexistence of superconductivity and ferromagnetism in URhGe, Nature 413, 613 (2001).
- Curro et al. [2005] N. J. Curro, T. Caldwell, E. D. Bauer, L. A. Morales, M. J. Graf, Y. Bang, A. V. Balatsky, J. D. Thompson, and J. L. Sarrao, Unconventional superconductivity in PuCoGa5, Nature 434, 622 (2005).
- Kamihara et al. [2008] Y. Kamihara, T. Watanabe, M. Hirano, and H. Hosono, Iron-Based Layered Superconductor La[O1-xFx]FeAs () with K, J. Am. Chem. Soc. 130, 3296 (2008).
- Karchev [2003] N. Karchev, Magnon exchange mechanism of ferromagnetic superconductivity, Phys. Rev. B 67, 054416 (2003).
- Zhang et al. [2011] G. M. Zhang, Z. Y. Lu, and T. Xiang, Superconductivity mediated by the antiferromagnetic spin wave in chalcogenide iron-based superconductors, Phys. Rev. B 84, 052502 (2011).
- Kargarian et al. [2016] M. Kargarian, D. K. Efimkin, and V. Galitski, Amperean Pairing at the Surface of Topological Insulators, Phys. Rev. Lett. 117, 076806 (2016).
- Gong et al. [2017] X. Gong, M. Kargarian, A. Stern, D. Yue, H. Zhou, X. Jin, V. M. Galitski, V. M. Yakovenko, and J. Xia, Time-reversal symmetry-breaking superconductivity in epitaxial bismuth/nickel bilayers, Sci. Adv. 3, e1602579 (2017).
- Rohling et al. [2018] N. Rohling, E. L. Fjærbu, and A. Brataas, Superconductivity induced by interfacial coupling to magnons, Phys. Rev. B 97, 115401 (2018).
- Thingstad et al. [2021] E. Thingstad, E. Erlandsen, and A. Sudbø, Eliashberg study of superconductivity induced by interfacial coupling to antiferromagnets, Phys. Rev. B 104, 014508 (2021).
- Mæland et al. [2021] K. Mæland, H. I. Røst, J. W. Wells, and A. Sudbø, Electron-magnon coupling and quasiparticle lifetimes on the surface of a topological insulator, Phys. Rev. B 104, 125125 (2021).
- Ok et al. [2022] J. M. Ok, C. I. Kwon, O. E. A. Valenzuela, S. Kim, R. D. McDonald, J. Kim, E. S. Choi, W. Kang, Y. J. Jo, C. Kim, E. G. Moon, Y. K. Kim, and J. S. Kim, Strong antiferromagnetic proximity coupling in the heterostructure superconductor Sr2VO3-δFeAs, Phys. Rev. B 105, 214505 (2022).
- Kevan and Eberhardt [1992] S. D. Kevan and W. Eberhardt, Angle-Resolved Photoemission: Theory and Current Applications, edited by S. D. Kevan (Elsevier Amsterdam, 1992) Chap. 2, 4.
- Damascelli [2004] A. Damascelli, Probing the electronic structure of complex systems by ARPES, Phys. Scr. 2004, 61 (2004).
- Hofmann et al. [2009a] P. Hofmann, I. Y. Sklyadneva, E. D. L. Rienks, and E. V. Chulkov, Electron–phonon coupling at surfaces and interfaces, New J. Phys. 11, 125005 (2009a).
- Hüfner [2013] S. Hüfner, Photoelectron spectroscopy: principles and applications (Springer Science & Business Media, Berlin, 2013) Chap. 1.
- Hüfner [2007] S. Hüfner, Very High Resolution Photoelectron Spectroscopy, Vol. 715 (Springer, 2007) Chap. 2.4.
- Schäfer et al. [2004] J. Schäfer, D. Schrupp, E. Rotenberg, K. Rossnagel, H. Koh, P. Blaha, and R. Claessen, Electronic quasiparticle renormalization on the spin wave energy scale, Phys. Rev. Lett. 92, 097205 (2004).
- Cui et al. [2007a] X. Cui, K. Shimada, M. Hoesch, Y. Sakisaka, H. Kato, Y. Aiura, S. Negishi, M. Higashiguchi, Y. Miura, H. Namatame, and M. Taniguchi, High-resolution angle-resolved photoemission spectroscopy of iron: A study of the self-energy, J. Magn. Magn. Mater. 310, 1617 (2007a).
- Cui et al. [2007b] X. Cui, K. Shimada, M. Hoesch, Y. Sakisaka, H. Kato, Y. Aiura, M. Higashiguchi, Y. Miura, H. Namatame, and M. Taniguchi, Angle-resolved photoemission spectroscopy study of Fe(110) single crystal: Many-body interactions between quasi-particles at the Fermi level, Surf. Sci. 601, 4010 (2007b), eCOSS-24.
- Hofmann et al. [2009b] A. Hofmann, X. Y. Cui, J. Schäfer, S. Meyer, P. Höpfner, C. Blumenstein, M. Paul, L. Patthey, E. Rotenberg, J. Bünemann, F. Gebhard, T. Ohm, W. Weber, and R. Claessen, Renormalization of bulk magnetic electron states at high binding energies, Phys. Rev. Lett. 102, 187204 (2009b).
- Młyńczak et al. [2019] E. Młyńczak, M. C. T. D. Müller, P. Gospodarič, T. Heider, I. Aguilera, G. Bihlmayer, M. Gehlmann, M. Jugovac, G. Zamborlini, C. Tusche, S. Suga, V. Feyer, L. Plucinski, C. Friedrich, S. Blügel, and C. M. Schneider, Kink far below the fermi level reveals new electron-magnon scattering channel in Fe, Nat. Commun. 10, 1 (2019).
- Mazzola et al. [2022] F. Mazzola, C.-M. Yim, V. Sunko, S. Khim, P. Kushwaha, O. J. Clark, L. Bawden, I. Marković, D. Chakraborti, T. K. Kim, M. Hoesch, A. P. Mackenzie, P. Wahl, and P. D. C. King, Tuneable electron–magnon coupling of ferromagnetic surface states in PdCoO2, npj Quantum Mater. 7, 1 (2022).
- Andres et al. [2022] B. Andres, M. Weinelt, H. Ebert, J. Braun, A. Aperis, and P. M. Oppeneer, Strong momentum-dependent electron–magnon renormalization of a surface resonance on iron, Appl. Phys. Lett. 120, 202404 (2022).
- Yu et al. [2022] T. L. Yu, M. Xu, W. T. Yang, Y. H. Song, C. H. P. Wen, Q. Yao, X. Lou, T. Zhang, W. Li, X. Y. Wei, J. K. Bao, G. H. Cao, P. Dudin, J. D. Denlinger, V. N. Strocov, H. C. Xu, and D. L. Feng, Strong band renormalization and emergent ferromagnetism induced by electron-antiferromagnetic-magnon coupling, Nat. Commun. 13, 6560 (2022).
- [32] Details on the sample preparation, LEED, XPS and work function measurements, additional ARPES data, and further details on the self-energy analysis.
- Tserkezis et al. [2011] C. Tserkezis, N. Stefanou, G. Gantzounis, and N. Papanikolaou, Photonic surface states in plasmonic crystals of metallic nanoshells, Phys. Rev. B 84, 115455 (2011).
- Liebowitz and Shevchik [1978] D. Liebowitz and N. J. Shevchik, Free-electron final-state model and angle-resolved photoemission from a Ag(111) surface, Phys. Rev. B 17, 3825 (1978).
- Aebi et al. [1994] P. Aebi, J. Osterwalder, R. Fasel, D. Naumović, and L. Schlapbach, Fermi surface mapping with photoelectrons at UV energies, Surf. Sci. 307-309, 917 (1994), proceedings of the European Conference on Surface Science (ECOSS).
- Gayone et al. [2005] J. E. Gayone, C. Kirkegaard, J. W. Wells, S. V. Hoffmann, Z. Li, and P. Hofmann, Determining the electron-phonon mass enhancement parameter on metal surfaces, Appl. Phys. A 80, 943 (2005).
- Kordyuk et al. [2005] A. A. Kordyuk, S. V. Borisenko, A. Koitzsch, J. Fink, M. Knupfer, and H. Berger, Bare electron dispersion from experiment: Self-consistent self-energy analysis of photoemission data, Phys. Rev. B 71, 214513 (2005).
- Pletikosić et al. [2012] I. Pletikosić, M. Kralj, M. Milun, and P. Pervan, Finding the bare band: Electron coupling to two phonon modes in potassium-doped graphene on Ir(111), Phys. Rev. B 85, 155447 (2012).
- LaShell et al. [2000] S. LaShell, E. Jensen, and T. Balasubramanian, Nonquasiparticle structure in the photoemission spectra from the Be(0001) surface and determination of the electron self energy, Phys. Rev. B 61, 2371 (2000).
- Higashiguchi et al. [2005] M. Higashiguchi, K. Shimada, K. Nishiura, X. Cui, H. Namatame, and M. Taniguchi, Energy band and spin-dependent many-body interactions in ferromagnetic Ni(110): A high-resolution angle-resolved photoemission study, Phys. Rev. B 72, 214438 (2005).
- Stewart [1983] G. Stewart, Measurement of low-temperature specific heat, Rev. Sci. Instrum. 54, 1 (1983).
- Jarrell and Gubernatis [1996] M. Jarrell and J. E. Gubernatis, Bayesian inference and the analytic continuation of imaginary-time quantum Monte Carlo data, Phys. Rep. 269, 133 (1996).
- Gubernatis et al. [1991] J. E. Gubernatis, M. Jarrell, R. N. Silver, and D. S. Sivia, Quantum monte carlo simulations and maximum entropy: Dynamics from imaginary-time data, Phys. Rev. B 44, 6011 (1991).
- Shi et al. [2004] J. Shi, S.-J. Tang, B. Wu, P. T. Sprunger, W. L. Yang, V. Brouet, X. J. Zhou, Z. Hussain, Z.-X. Shen, Z. Zhang, and E. W. Plummer, Direct Extraction of the Eliashberg Function for Electron-Phonon Coupling: A Case Study of , Phys. Rev. Lett. 92, 186401 (2004).
- Tang et al. [2004] S.-J. Tang, J. Shi, B. Wu, P. T. Sprunger, W. L. Yang, V. Brouet, X. J. Zhou, Z. Hussain, Z.-X. Shen, Z. Zhang, and E. W. Plummer, A spectroscopic view of electron–phonon coupling at metal surfaces, Phys. Status Solidi B 241, 2345 (2004).
- Chien et al. [2009] T. Chien, E. D. L. Rienks, M. F. Jensen, P. Hofmann, and E. W. Plummer, Anisotropic electron-phonon coupling on a two-dimensional circular Fermi contour, Phys. Rev. B 80, 241416 (2009).
- Chien et al. [2015] T. Chien, X. He, S.-K. Mo, M. Hashimoto, Z. Hussain, Z.-X. Shen, and E. W. Plummer, Electron-phonon coupling in a system with broken symmetry: Surface of , Phys. Rev. B 92, 075133 (2015).
- Birgeneau et al. [1964] R. J. Birgeneau, J. Cordes, G. Dolling, and A. D. B. Woods, Normal modes of vibration in nickel, Phys. Rev. 136, A1359 (1964).
- Szeftel [1985] J. Szeftel, Surface phonon dispersion, using electron energy loss spectroscopy, Surf. Sci. 152-153, 797 (1985).
- Stuhlmann and Ibach [1989] C. Stuhlmann and H. Ibach, Surface phonon dispersion in ultrathin nickel films on Cu(100), Surf. Sci. 219, 117 (1989).
- Menezes et al. [1990] W. Menezes, P. Knipp, G. Tisdale, and S. J. Sibener, Surface phonon spectroscopy of Ni(111) studied by inelastic electron scattering, Phys. Rev. B 41, 5648 (1990).
- Giustino et al. [2007] F. Giustino, M. L. Cohen, and S. G. Louie, Electron-phonon interaction using Wannier functions, Phys. Rev. B 76, 165108 (2007).
- Hellsing et al. [2018] B. Hellsing, T. Frederiksen, F. Mazzola, T. Balasubramanian, and J. W. Wells, Phonon-induced linewidths of graphene electronic states, Phys. Rev. B 98, 205428 (2018).
- Mahr et al. [2017] C. E. Mahr, M. Czerner, and C. Heiliger, Implementation of a method for calculating temperature-dependent resistivities in the KKR formalism, Phys. Rev. B 96, 165121 (2017).
- He et al. [2023] Z. He, A.-A. Sun, and S.-P. Gao, Electron-phonon scattering and stacking sequences in hexagonal boron nitride: An ab initio study, Phys. Rev. B 108, 165108 (2023).
- Mook and Tocchetti [1979] H. A. Mook and D. Tocchetti, Neutron-Scattering Measurements of the Generalized Susceptibility for Ni, Phys. Rev. Lett. 43, 2029 (1979).
- Mook and Paul [1985] H. A. Mook and D. M. Paul, Neutron-Scattering Measurement of the Spin-Wave Spectra for Nickel, Phys. Rev. Lett. 54, 227 (1985).
- Mook et al. [1988] H. A. Mook, D. M. Paul, and S. Hayden, Temperature dependence of the high-energy magnetic excitations for Ni, Phys. Rev. B 38, 12058 (1988).
- Brookes et al. [2020] N. B. Brookes, D. Betto, K. Cao, Y. Lu, K. Kummer, and F. Giustino, Spin waves in metallic iron and nickel measured by soft x-ray resonant inelastic scattering, Phys. Rev. B 102, 064412 (2020).
- Papaconstantopoulos et al. [1977] D. A. Papaconstantopoulos, L. L. Boyer, B. M. Klein, A. R. Williams, V. L. Morruzzi, and J. F. Janak, Calculations of the superconducting properties of 32 metals with , Phys. Rev. B 15, 4221 (1977).
- Holst et al. [2021] B. Holst, G. Alexandrowicz, N. Avidor, G. Benedek, G. Bracco, W. E. Ernst, D. Farías, A. P. Jardine, K. Lefmann, J. R. Manson, R. Marquardt, S. Miret Artés, S. J. Sibener, J. W. Wells, A. Tamtögl, and W. Allison, Material properties particularly suited to be measured with helium scattering: selected examples from 2D materials, van der Waals heterostructures, glassy materials, catalytic substrates, topological insulators and superconducting radio frequency materials, Phys. Chem. Chem. Phys. 23, 7653 (2021).
- Cooke et al. [1985] J. F. Cooke, J. A. Blackman, and T. Morgan, New Interpretation of Spin-Wave Behavior in Nickel, Phys. Rev. Lett. 54, 718 (1985).
- Hofmann [2006] P. Hofmann, The surfaces of bismuth: Structural and electronic properties, Prog. Surf. Sci 81, 191 (2006).
- Mazzola et al. [2013] F. Mazzola, J. W. Wells, R. Yakimova, S. Ulstrup, J. A. Miwa, R. Balog, M. Bianchi, M. Leandersson, J. Adell, P. Hofmann, and T. Balasubramanian, Kinks in the Band of Graphene Induced by Electron-Phonon Coupling, Phys. Rev. Lett. 111, 216806 (2013).
- Mazzola et al. [2017] F. Mazzola, T. Frederiksen, T. Balasubramanian, P. Hofmann, B. Hellsing, and J. W. Wells, Strong electron-phonon coupling in the band of graphene, Phys. Rev. B 95, 075430 (2017).
- Røst et al. [2023] H. I. Røst, S. P. Cooil, A. C. Åsland, J. Hu, A. Ali, T. Taniguchi, K. Watanabe, B. D. Belle, B. Holst, J. T. Sadowski, F. Mazzola, and J. W. Wells, Phonon-Mediated Quasiparticle Lifetime Renormalizations in Few-Layer Hexagonal Boron Nitride, Nano Lett. 23, 7539 (2023).
- Escher et al. [2005] M. Escher, N. Weber, M. Merkel, B. Krömker, D. Funnemann, S. Schmidt, F. Reinert, F. Forster, S. Hüfner, P. Bernhard, C. Ziethen, H. Elmers, and G. Schönhense, NanoESCA: imaging UPS and XPS with high energy resolution, J. Electron Spectros. Relat. Phenomena 144-147, 1179 (2005).
- Valla et al. [1999] T. Valla, A. V. Fedorov, P. D. Johnson, and S. L. Hulbert, Many-Body Effects in Angle-Resolved Photoemission: Quasiparticle Energy and Lifetime of a Mo(110) Surface State, Phys. Rev. Lett. 83, 2085 (1999).
- Echenique et al. [2004] P. Echenique, R. Berndt, E. Chulkov, T. Fauster, A. Goldmann, and U. Höfer, Decay of electronic excitations at metal surfaces, Surf. Sci. Rep. 52, 219 (2004).
- Chulkov et al. [2003] E. V. Chulkov, J. Kliewer, R. Berndt, V. M. Silkin, B. Hellsing, S. Crampin, and P. M. Echenique, Hole dynamics in a quantum-well state at Na/Cu(111), Phys. Rev. B 68, 195422 (2003).
- Grimvall [1981] G. Grimvall, The Electron-phonon Interaction in Metals (North-Holland Publishing Company, 1981).
- Hellsing et al. [2002] B. Hellsing, A. Eiguren, and E. V. Chulkov, Electron-phonon coupling at metal surfaces, J. Phys. Condens. Matter 14, 5959 (2002).
- Osterwalder [2006] J. Osterwalder, Spin-polarized photoemission, in Magnetism: A Synchrotron Radiation Approach, edited by E. Beaurepaire, H. Bulou, F. Scheurer, and J.-P. Kappler (Springer Berlin Heidelberg, 2006) pp. 95–120.
- Aebi et al. [1996] P. Aebi, T. J. Kreutz, J. Osterwalder, R. Fasel, P. Schwaller, and L. Schlapbach, -Space Mapping of Majority and Minority Bands on the Fermi Surface of Nickel below and above the Curie Temperature, Phys. Rev. Lett. 76, 1150 (1996).