A solar metallicity galaxy at ? Possible detection of the [N ii] 122 m and [O iii] 52 m lines
Abstract
We present the first detection of the [N ii] 122 m and [O iii] 52 m lines for a reionisation-epoch galaxy. Based on these lines and previous [C ii] 158 m and [O iii] 88 m measurements, using two different radiative transfer models of the interstellar medium, we estimate an upper limit on electron density of cm-3 and an approximate gas-phase metallicity of for A1689-zD1, a gravitationally-lensed, dusty galaxy at . Other measurements or indicators of metallicity so far in galaxy interstellar media at are typically an order of magnitude lower than this. The unusually high metallicity makes A1689-zD1 inconsistent with the fundamental metallicity relation, although there is likely significant dust obscuration of the stellar mass, which may partly resolve the inconsistency. Given a solar metallicity, the dust-to-metals ratio is a factor of several lower than expected, hinting that galaxies beyond may have lower dust formation efficiency. Finally, the inferred nitrogen enrichment compared to oxygen, on which the metallicity measurement depends, indicates that star-formation in the system is older than about 250 Myr, pushing the beginnings of this galaxy to .
keywords:
galaxies: high-redshift – galaxies: individual: A1689-zD1 – galaxies: ISM – ISM: abundances – submillimetre: galaxies1 Introduction
The frontier of the study of galaxy evolution has now moved to the epoch of reionisation, , where the physical conditions of the interstellar medium (ISM) are beginning to be investigated (e.g. Novak et al., 2019; Bouwens et al., 2022). Measuring these conditions is critical to our understanding of the evolution of galaxies and the growth of structure. The metal enrichment of the gas in galaxies, in particular, can tell us about the extent of processing of the ISM through stars, and therefore, the stage of evolution of the galaxy. However this fundamental ISM property is difficult to determine at high-.
While at low redshifts, ISM properties are often determined using optical and ultraviolet (UV) emission lines (e.g. Kewley et al., 2019; Maiolino & Mannucci, 2019), at those lines shift into the infrared (IR), where JWST is just beginning to produce the first results (e.g. Schaerer et al., 2022; Curti et al., 2022). However, heavily dust-obscured galaxies (e.g. Marrone et al., 2018; Fudamoto et al., 2021) cannot be studied with JWST because UV-optical observations cannot probe dust-obscured gas (Chartab et al., 2022). Hence, at high redshift, we require detections of bright far infrared (FIR) cooling lines and dust emission to estimate ISM properties (e.g. Nagao et al., 2011; Novak et al., 2019).
So far, FIR lines such as [C ii] 158 m and [O iii] 88 m (hereafter [C158] and [O88] respectively) have been detected in only a handful of galaxies (e.g. Maiolino et al., 2015; Pentericci et al., 2016; Carniani et al., 2017; Hashimoto et al., 2019; Carniani et al., 2020; Sommovigo et al., 2021; Schouws et al., 2022a). Very few galaxies have been detected in both [O88] and [C158] at (Carniani et al., 2017; Hashimoto et al., 2019; Tamura et al., 2019; Bakx et al., 2020; Harikane et al., 2020; Witstok et al., 2022), and only four of those are at .
Furthermore, while observations of the [O88] and [C158] lines and continuum emission allow the star-formation rate, dust mass and, to some extent, the temperature to be assessed with some reliability, determining the basic ISM parameters, i.e. the gas-phase metallicity, density, and ionisation parameter, requires other FIR lines. For instance, Pereira-Santaella et al. (2017) and Harikane et al. (2020) describe models that use lines such as [O iii] 52 m and [N ii] 122 m (hereafter [O52] and [N122] respectively) in addition to [O88] and [C158].
However, this poses an observational challenge because while [O88] and [C158] are bright, [N122] is relatively faint and difficult to detect at . There have been [N122] detections in quasar host galaxies at (Li et al., 2020), and (Novak et al., 2019), but non-detections for all other systems attempted at (Harikane et al., 2020; Sugahara et al., 2021). Although the [O52] line can be bright, it is also difficult to detect at this redshift as it lies in a wavelength region with low atmospheric transmission. Thus far, there have been no detections reported of [O52] at .
In this work, we report on the first measurement of the [O52] and [N122] lines for a non-quasar galaxy at . Together with previous [O88] and [C158] measurements (Akins et al. 2022; Wong et al. 2022; Knudsen et al. (in prep.)), we now have four FIR line detections for the gravitationally-lensed reionisation-epoch, dusty, normal galaxy A1689-zD1 at , making it the ideal candidate to study ISM conditions in re-ionisation era galaxies.
A1689-zD1 is lensed by the galaxy cluster Abell 1689 with a magnification factor of 9.3 (Watson et al., 2015). It was first discovered as a photometric candidate galaxy (Bradley et al., 2008). The Ly break was spectroscopically confirmed with deep VLT/X-shooter data, and it was shown to be a dusty galaxy with ALMA detections in bands 6 and 7 (Watson et al., 2015; Knudsen et al., 2017). This was the first detection of dust at , though more distant dust emitters have since been identified (e.g. Fudamoto et al., 2021; Ferrara et al., 2022; Schouws et al., 2022b; Laporte et al., 2017). A1689-zD1 has now been detected in strong [C158] and [O88] emission (Wong et al., 2022), the detailed 2D and 3D structure of which is studied in Akins et al. (2022) and Knudsen et al. (in prep.). The galaxy has also been detected in four continuum bands allowing an accurate measurement of its dust temperature and mass (Bakx et al., 2021). The rich multi-wavelength data set makes it one of the best-studied reionisation-epoch galaxies.
In this paper, we report the measured line fluxes, and calculate ratios among the four lines and their underlying continua to characterise the ISM of A1689-zD1. We deal here mainly with the galaxy-integrated properties. A resolved study of A1689-zD1 is presented in Knudsen et al. (in prep.).
We adopt a Flat CDM cosmology with , , and (Planck Collaboration et al., 2016).
2 Observations and Methods
For the analysis presented in this work, we use the following the values for the stellar mass (), dust mass (), and star-formation rate (SFR) for the galaxy: (Watson et al., 2015); total SFR yr-1 (Akins et al., 2022); (Bakx et al., 2021).
2.1 [N122] and [O52] observations
Observations were carried out at the Atacama Large Millimeter/submillimeter Array (ALMA) in Chile from November to December 2019 in cycle 7 (# 2019.1.01778.S, PI: D. Watson) under a precipitable water vapour (PWV) of 0.3–0.8 mm, using 42–45 antennae with projected baselines of 15–313 m. Based on a source redshift of , securely determined with [C158] and [O88] (Wong et al. 2022, Knudsen et al. (in prep.)), the available 7.5 GHz bandwidth with four spectral windows was centred at observed frequencies of 296.9 GHz (Band 7) and 703.8 GHz (Band 9) so that the [N122] and [O52] lines fall in one or two spectral windows. J1229+0203 and J13371257 were observed as the flux and bandpass calibrators. Phase calibration was performed by using observations of J12560547. The total on-source times were 200 minutes and 95 minutes for the [O52] and [N122] observations respectively.
We reduced the ALMA data with the Common Astronomy Software Applications package (CASA; McMullin et al. 2007) in the standard manner with the scripts provided by the ALMA observatory. We produced the continuum images and line cubes by running the CLEAN algorithm with the tclean task. For continuum, we flagged the calibrated visibility in the expected frequency ranges of the lines. We executed the tclean routines down to the level with a maximum iteration number of 10 000 in the automask mode with the sub-parameters determined by the recommendations of the ALMA automasking guide111https://casaguides.nrao.edu/index.php/Automasking_Guide. For cubes, we applied continuum subtraction to the calibrated visibility with the uvcontsub task by using the line-free frequency. We fit the continuum along channels at least ±500 km/s away from the expected line centre. We tried the subtraction with fitorders 0, 1, and 2. For [O52], the automasking and cleaning worked best for fitorder 0, and for [N122] the results were similar for all fitorders. We therefore chose to use fitorder of 0 for both [O52] and [N122] continuum subtraction. We adopted a spectral channel width of 20 km s-1 and performed the CLEAN algorithm in each channel in the same manner as the continuum map. In both cases, we used natural weighting to maximise the sensitivity and applied the multi-scale deconvolver with scales of 0 (i.e. point source), 1, and 3 times the beam size. We list the synthesised beam size and the standard deviation of the pixel values in the final natural-weighted maps and cubes in Table 1.
| ALMA Band | Target line/continuum | Beam-size | Sensitivity |
|---|---|---|---|
| [] | [mJy beam-1] | ||
| 6 | [C158] | 0.02 | |
| 7 | [N122] | 0.02 | |
| 8 | [O88] | 0.12 | |
| 9 | [O52] | 0.42 | |
| 7 | continuum | 0.06 | |
| 8 | continuum | 0.05 |
3 Results
3.1 Detection


| Line | Flux | Luminosity () | |
|---|---|---|---|
| [O iii] | 52 m | (Jy km s-1) | |
| [O iii] | 88 m | (Jy km s-1) | |
| [N ii] | 122 m | (Jy km s-1) | |
| [C ii] | 158 m | (Jy km s-1) | |
| continuum | 88 m | (mJy) | |
| continuum | 122 m | (mJy) |
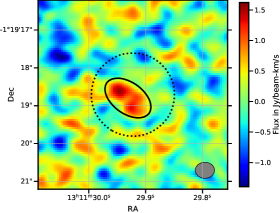
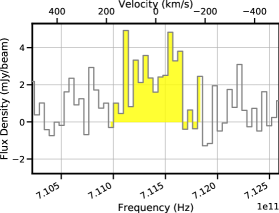
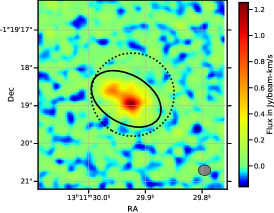
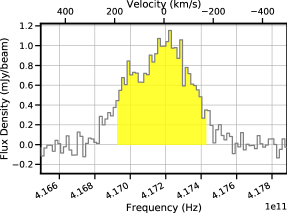
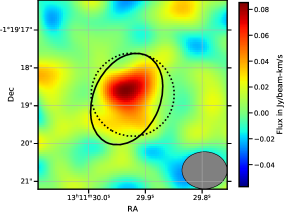
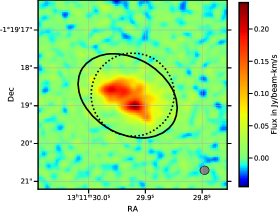
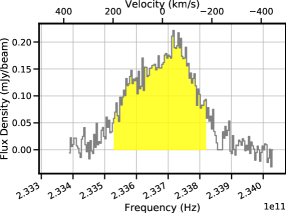
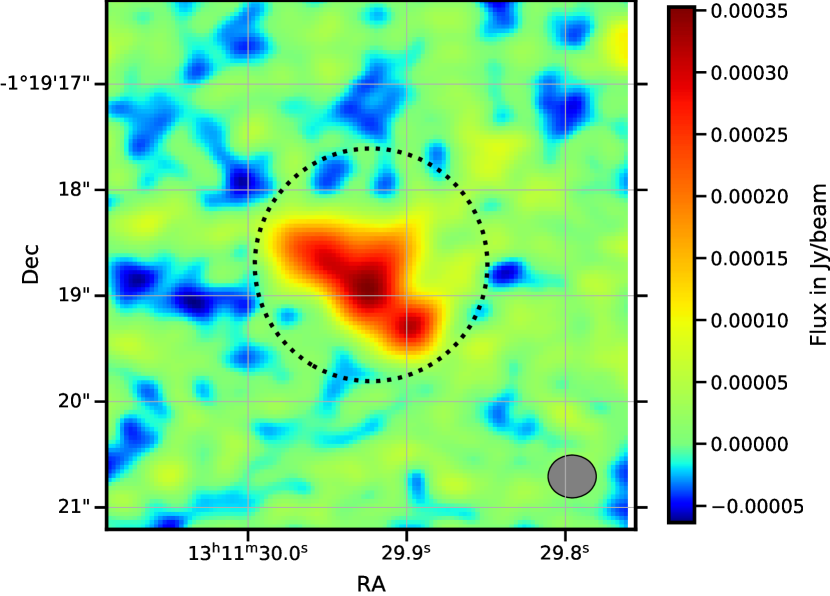
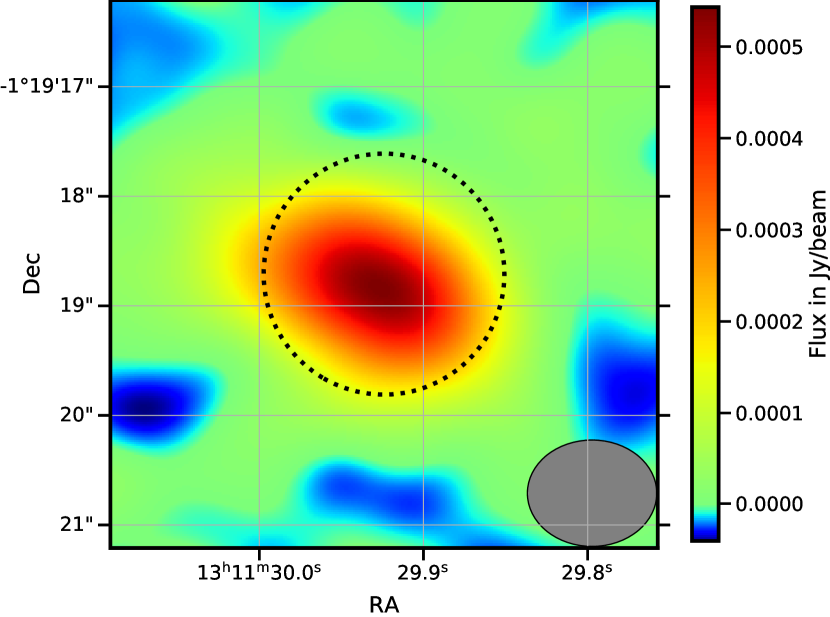
In Figure 1, we show the velocity-integrated moment 0 maps222produced using the spectral-cube package in Python (Ginsburg et al., 2019) and spectra for the [N122] and [O52] lines (along with the [C158] and [O88] detections from previous studies). The [N122] and [O52] lines show significance levels of and at the peak pixel, respectively. The respective significance is and in the aperture optimised to each line (Fig. 1), and and in the common aperture (see Sec. 3.2). The morphology of the [O52] line is spatially extended (well beyond the beamsize), consistent with the spatial position and rough extent of the rest-frame UV continuum observed with the Hubble Space Telescope (HST) (Watson et al., 2015). Given the consistency with HST, we conclude that we achieve the first detection of the faint FIR lines of [O52] as well as [N122] at .
3.2 Flux measurement
To perform a fair photometric comparison by analysing the same regions of the galaxy, we use a common aperture to extract the enclosed flux for the four lines and the underlying continua for [N122] and [O88]. The common aperture was selected to get the best estimate of the weakest lines, [O52] and [N122]. We use this common aperture for all our calculations. To find the best common aperture, we plotted the signal-to-noise ratio (SNR) as a function of increasing aperture radius for both [O52] and [N122]. For [O52], the highest SNR was at radius beyond which noise began to dominate. For [N122], the optimal aperture radius was around . As the beamsize of the [N122] line was , we chose not to use the optimal [O52] aperture to avoid flux loss in an aperture with diameter smaller than the largest beamsize. Hence, we used a circular aperture with radius to include most of the [N122] and [O52] flux. We also adopt a common velocity integration range of km s-1 to estimate the line flux. This range is based on the velocity width for the [C158] line as can be seen from the last panel of Fig. 1.
We use a circular aperture of radius, centred at RA = 13:11:29.924 and Dec. = 01:19:18.710 (J2000). The aperture was chosen to include both the [O52] and [N122] lines, which is slightly larger than the detectable [O52] emission region (see Figs. 1 and 2). This aperture also encompasses the central [C158] and [O88] emission regions. We ensured that the aperture size is not smaller than the beam-size of our worst resolution image ([N122]). The fluxes and corresponding luminosities are shown in Table 2.
To test whether the difference in resolution affects our flux measurement, we tapered the higher resolution [O88] map to match the lower resolution [O52] and [N122] maps. The fluxes measured were consistent to the values reported in Table 2 within uncertainty. Additionally, we tested several elliptical and circular apertures that also encompassed all four line emissions, and the results were consistent.
The detection significance of the [O52] and [N122] lines is . To test the significance of the line detection further, we employed a moving spectral window and produced several moment-0 maps with midpoints across the velocity axis. Then we performed a systematic search for off-centre sources in each moment-0 map using a circular aperture. While for [N122], we found no other sources with significance, we did find a few of them for [O52]. However, these did not have extended spatial morphologies like the central source. Moreover, [O52] was only used to derive an upper limit (see Sec. 3.3.1), so if the detection significance is lower, our upper limit still holds.
3.3 Metallicity Constraint
In this section, we obtain a constraint for the metallicity, , of A1689-zD1 in a series of steps. We first derive the electron density, , using the [O iii] line ratio. We then combine this with the 88 to 122 m dust continuum ratio to derive the ionisation parameter, . Finally, using and the [O88] to [N122] line luminosity ratio, we constrain .
The flux ratios could in principle be affected by differential magnification, which in turn depends on the lensing model assumed. However, in this case, since we are calculating integrated galaxy properties in a common aperture and all the lines and continuua are mostly co-spatial, differential magnification is likely to be small, only of the order of a few per cent.
3.3.1 [O iii] ratio
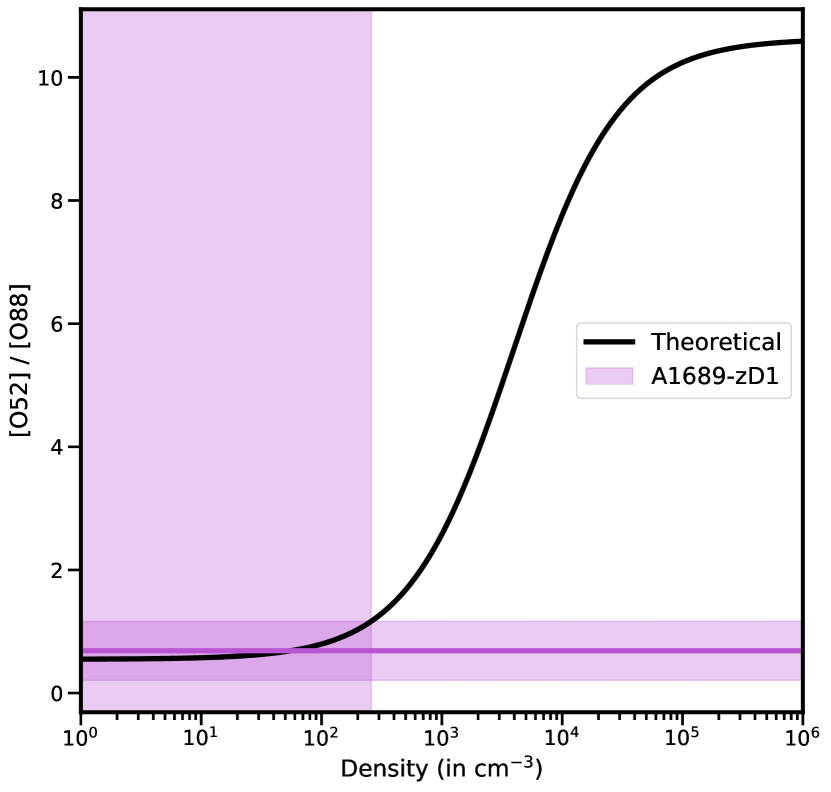
The ratio of the [O52] to [O88] luminosity is independent of both and as both lines originate from the same ion, and of the temperature, because the energy difference between these two states is small compared to the typical gas temperature in the ionising regions of the galaxy. It is therefore a robust probe of , up to or even cm-3 (Palay et al., 2012; Pereira-Santaella et al., 2017; Zhang et al., 2018; Yang & Lidz, 2020).
Fig. 3 shows the theoretical relationship between the [O iii] line ratio and . The [O52] to [O88] ratio for A1689-zD1 in the common aperture is plotted as a horizontal purple line with uncertainty plotted as the corresponding shaded purple region. We derive a nominal value of 55 cm-3 for the electron density. Including the uncertainty on the ratio, we obtain 1 and upper limit of 260 and 485 cm-3.
Our density derivation assumes that the gas is optically thin and in thermodynamic equilibrium at a temperature of 10 000 K. The upper limit is less than cm-3 for any temperature between 5 000 and 20 000K. In the following analysis, we adopt the bound of 260 cm-3 to propagate into our uncertainty calculation.
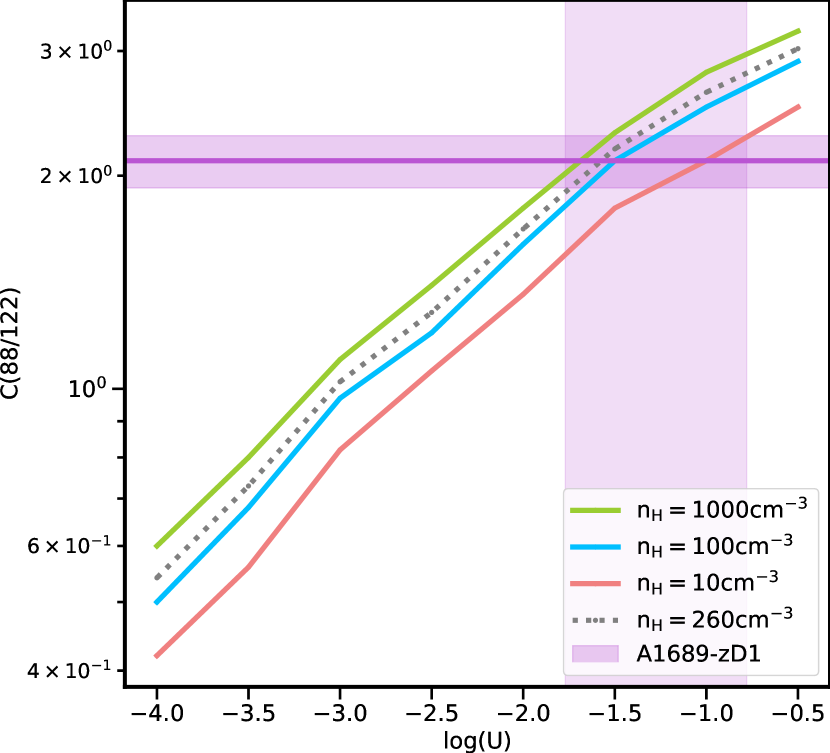
3.3.2 Dust continuum ratio and
The ratio of the continuum at 88 m and 122 m can be used to constrain , with some dependence on the density (Rigopoulou et al., 2018). We assume a density range with an upper bound of 260 cm-3 from the [O iii] line ratio and a lower bound of about 10 cm-3 (corresponding approximately to a uniform distribution of in gas over the galaxy area). While this lower bound is somewhat arbitrary, it is the upper density bound that influences how low the metallicity can be. A lower density would result in higher metallicity and ionisation parameter. In Fig. 4, we plot the continuum ratio as a function of based on CLOUDY modelling over these density bounds from Pereira-Santaella et al. (2017). We show the ratio for A1689-zD1 with uncertainty regions. The extreme values of this uncertainty region are then propagated through the model at the extreme values of the density range derived in Sec. 3.3.3. From this, we infer a value of within the uncertainty range.
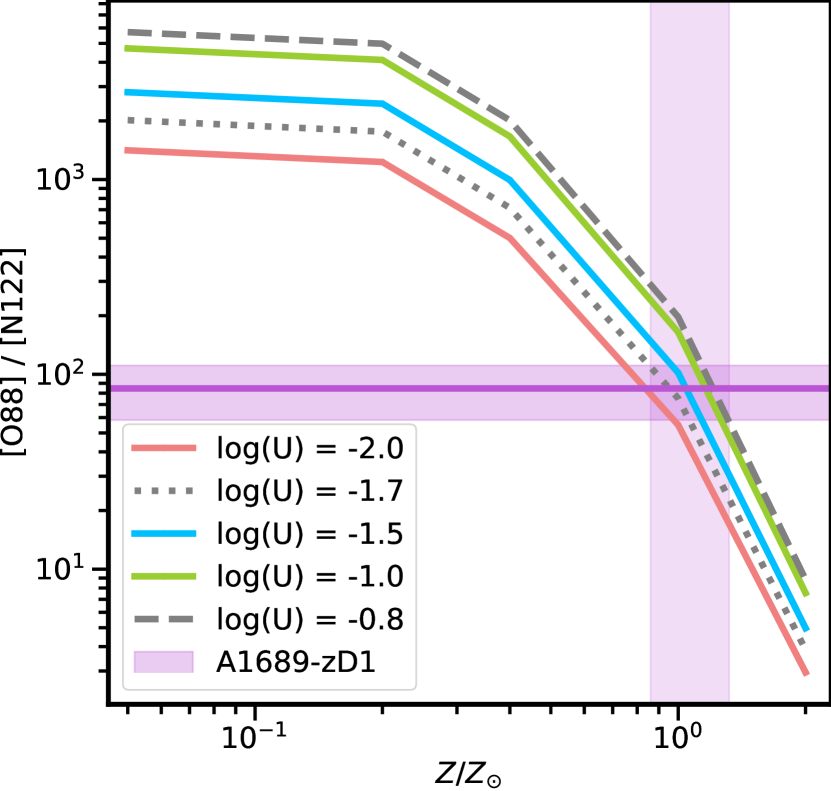
3.3.3 [O88]/[N122] ratio and the metallicity
Since the [O88] and [N122] lines have similar critical densities, their ratio is nearly independent of the density. However, it does depend on and . Fig. 5 plots the ratio as a function of for different model tracks of , once again using the Pereira-Santaella et al. (2017) model. While the model does hold beyond , this parameter space was only explored in their work for galaxies with an active galactic nucleus (AGN). Non-AGN galaxies generally do not have , but A1689-zD1 appears to be an exception with a high despite not having any appreciable AGN activity. We therefore extrapolate the non-AGN Pereira-Santaella et al. (2017) model plot to higher values of to accommodate the measurements for A1689-zD1. Since these extrapolated model values are in agreement with the numbers in the Harikane et al. (2020) models presented below, which is also CLOUDY based, and does extend all the way up to , we are confident that the extrapolation is valid.
As before, the ratio for A1689-zD1 is indicated with the uncertainty regions. Once again, we derive the uncertainty range on metallicity by propagating the extreme values of the uncertainty region on the [O88]/[N122] ratio through the model curves at the extreme values of the measurements from Sec. 3.3.2. We thus find . As mentioned in Sec 3.3.2, if we were to allow lower densities, and in turn, , would be higher.
For comparison, we use models from Harikane et al. (2020) with metallicity-dependent N/O and C/O ratios. These are plotted in Fig. 6. The model assumes that the nitrogen-to-oxygen abundance ratio depends on the metallicity due to secondary nucleosynthesis (see Sec. 4.2). This in turn uses the relation presented in Kewley & Dopita (2002) in the same manner as Nagao et al. (2011). With this model, we find to , and to (with to cm-3) roughly consistent with the estimates based on Rigopoulou et al. (2018).
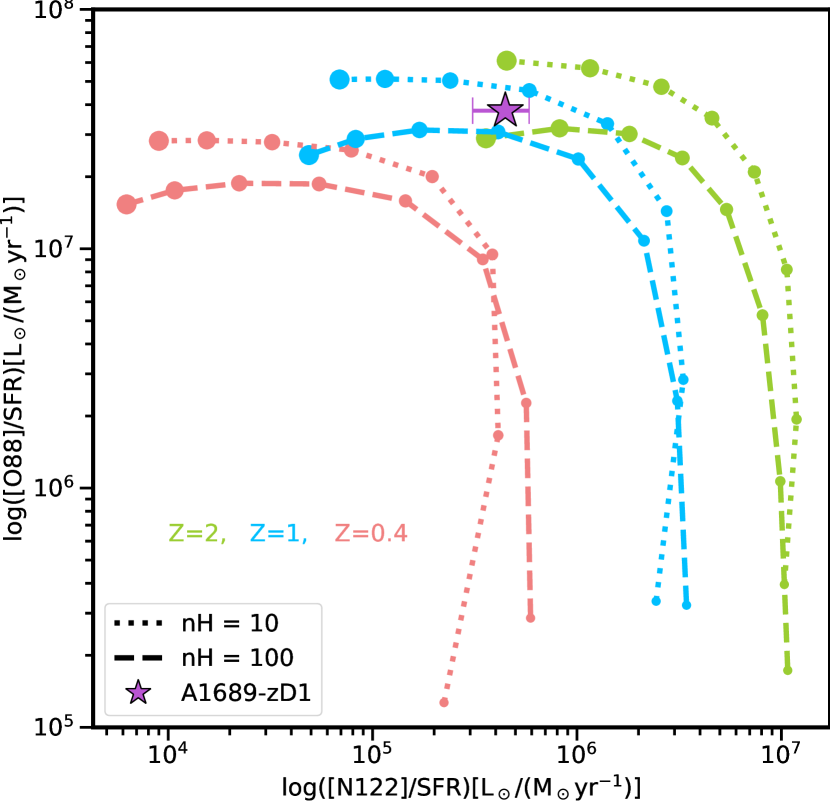
Despite both models being CLOUDY-based, the slight difference in metallicity estimate may arise from the different assumptions made in each one. For instance, Harikane et al. (2020) assumes a Chabrier initial mass function (IMF) and Pereira-Santaella et al. (2017) assumes a Kroupa IMF. In addition, we use a modified Harikane et al. (2020) model with metallicity-dependent nitrogen abundance, but a similar modification was not made for Rigopoulou et al. (2018) model. Regardless of these differences, metallicities significantly below the solar value do not reproduce our line ratios with either the Rigopoulou et al. (2018) or Harikane et al. (2020) model.
Nonetheless, there is some uncertainty associated with the model curves presented here. Firstly, there is some scatter in the N/O abundance to metallicity conversion (e.g. Liang et al., 2006). Additionally, CLOUDY model curves have a model uncertainty of the order 10–20 per cent as discussed in Pereira-Santaella et al. (2017), comparable to metallicity models based on optical emission lines. Although, as discussed in e.g. Croxall et al. (2013), models relying on FIR lines remove the heavy dependence on temperature which plagues optical emission lines.
3.4 [O88]/[C158] ratio and the PDR covering fraction
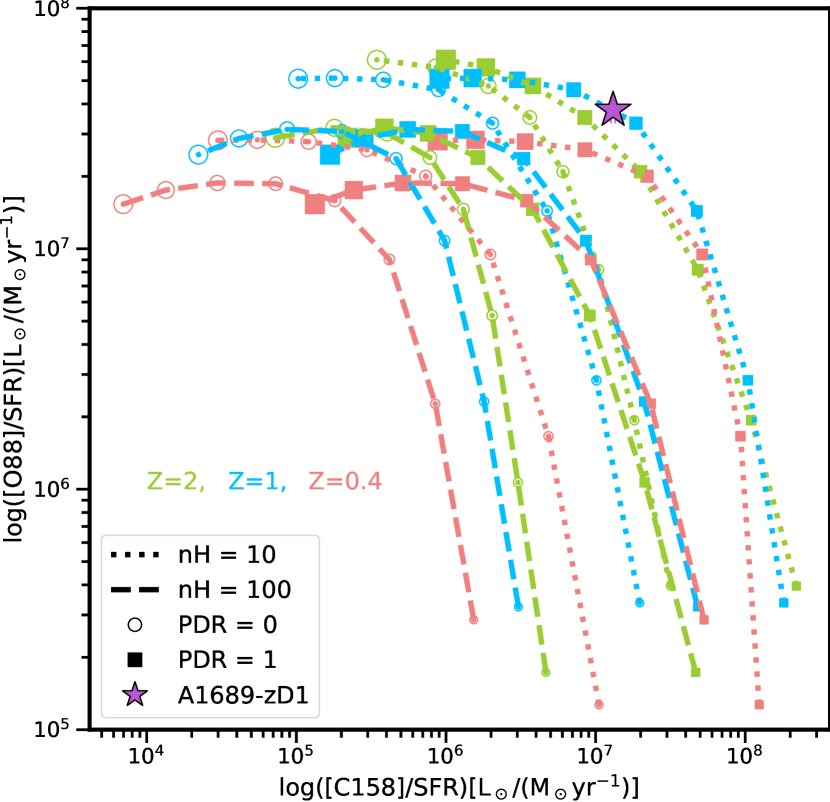
The ionisation energies of [O iii] (35.1 eV) and [N122] (14.5 eV) are higher than that of H (13.6 eV), whereas the ionisation energy of [C158] (11.2 eV) is lower than that of H. Hence, the [C158] emission comes from the cold atomic components, photo-dissociation regions (PDR), and H ii regions, whereas the emission from the other three lines comes exclusively from the H ii regions. Therefore, the ratio of [C158] to any of the other three lines can be used to estimate the PDR covering fraction, i.e. the extent of the ionised H gas compared to the neutral H gas (e.g. Cormier et al., 2019; Harikane et al., 2020).
In Fig. 7, we plot model curves for [C158] luminosity assuming PDR covering fractions of 0 and 1. The measurements for A1689-zD1 favour a model with PDR fraction close to 1, i.e. dominated by neutral atomic gas.
3.5 Dust-to-metals ratio
The total gas mass for A1689-zD1 is based on the sum of the atomic and molecular masses. We determine the atomic gas mass from the relation between the [C158] line luminosity, metallicity and the atomic gas mass from Heintz et al. (2021). We find M M⊙. This includes the scatter in the relation and the statistical error added in quadrature.
Assuming most of the gas is in the atomic phase, the total gas mass is between 1.2 and M⊙. Using a solar metal fraction of about 1/100 and a dust mass of M⊙ (Bakx et al., 2021), the corresponding dust-to-metals mass ratio (DTM) for A1689-zD1 is around 0.1. If there is significantly more gas in the system, say in the molecular phase, this will make the DTM even lower.
4 Discussion
Several striking features are derived from the line ratios reported here. First, the metallicity is close to solar, which deviates strongly from the expected mass-metallicity evolution towards high-.
Second, the nitrogen abundance is in excess of oxygen, indicating that the star-formation in the galaxy must be old enough to have produced secondary nitrogen through intermediate mass stellar envelopes, i.e. at least 250 Myr (Henry et al., 2000), pushing the formation age of the system back to .
Third, though this system is known as a prototypical dusty normal galaxy at this epoch, it seems to be deficient in dust compared to its total metal content.
4.1 Evolution of metal abundance
The most reliable metallicity estimates for star-forming galaxies come from back-lighting absorption studies, e.g. gamma-ray burst (GRB) afterglows. All show metallicities substantially below 0.1 solar (Salvaterra, 2015) at . With some assumptions on density and temperature, Jones et al. 2020 have estimated metallicities for a handful of galaxies using the relative strength of the [O88] line to the total SFR and find metallicities ranging from 8–36 per cent of the solar value. Using a similar method to the one used here, but assuming , Novak et al. (2019) find solar or possibly super-solar metallicity for the ISM of the host galaxy of the quasar J1342+0928 at , demonstrating that such a high metallicity is not unique at . Over the next 13 Gyr, if such a high metallicity galaxy is to increase its mass, it must do so mainly via dry mergers and not through a lot of star formation which would lead to supernova explosions that would substantially increase the metal content.
4.1.1 The fundamental metallicity relation
Galaxies up to lie on a plane in 3D space spanning , , and SFR. While there appears to be no evolution between local Sloan Digital Sky Survey (SDSS) galaxies at and those at , there is some evolution above (Mannucci et al., 2010). We do not know how early these relationships are set up in galaxies, but galaxies at appear to lie 0.6 dex below the metallicity prediction of the lower--calibrated fundamental metallicity relation (FMR) from Mannucci et al. (2010). Other studies have also found an evolution of the FMR relation with redshift (e.g. Stott et al., 2013; Torrey et al., 2018; Sanders et al., 2021).
Given the stellar mass and SFR for A1689-zD, its metallicity is substantially higher than the FMR by dex, and even the FMR by dex. Hence, the measured metallicity of A1689-zD1 is inconsistent with the trend suggested by Mannucci et al. (2010) by about an order of magnitude in metallicity. A revised FMR parameterisation was presented by Curti et al. (2020), but A1689-zD1 deviates from this relation as well by about 1 dex.
The reason for the deviation may be an inaccurate estimate of the stellar mass. The current value of is determined from rest-frame optical SED fitting, which could be heavily dust-obscured. The SFR of A1689-zD1 is more than 90 per cent obscured. While the obscuration of the stellar mass is unlikely to be as high as this, it could still be substantial. With a stellar mass of , i.e. a factor of 80 per cent obscuration of the stellar mass, the deviation from the FMR decreases to only 0.1 dex (although the deviation from the FMR is still 0.7 dex). A stellar mass at least as large as the gas mass is required to produce all the metals in a solar metallicity system assuming a Chabrier or Kroupa IMF. Therefore such a high stellar mass is reasonable. However, it is hard to imagine dust obscuration much greater than this.
Another potential reason for the discrepancy might be the assumed N/O ratio in our models based on Rigopoulou et al. (2018) and Harikane et al. (2020). Both models assume the relation between the N/O ratio and metallicity calibrated in the local universe. However, we do not know the N/O-metallicity relation at . Some studies (e.g. Queyrel et al., 2009; Yabe et al., 2015) report a possible increase of the N/O ratio at fixed metallicity at redshift , while others do not at (Kojima et al., 2017). If the N/O ratio does evolve, the estimated metallicity would decrease, and become more consistent with the fundamental metallicity relation.
4.2 Nitrogen excess and the age of A1689-zD1
The metallicity estimate derived from the [O88]/[N122] ratio depends on the overabundance of N with respect to O (Rigopoulou et al. 2018; Pereira-Santaella et al. 2017), a consequence of secondary nitrogen production that only becomes dominant at (e.g. Vincenzo et al., 2016; Pilyugin et al., 2014).
Henry et al. (2000) argue that the secondary production of nitrogen principally occurs in the asymptotic giant branch (AGB) phase of intermediate mass stars (4–8 M⊙), while O and C production continues to be dominated by high mass stars or type II supernovae. This leads to an increase in the N/O ratio with increasing abundance above . However, it also introduces a delay of about 250 Myr, the main-sequence lifetime of these intermediate mass stars, before the N/O ratio increase can occur.
The fact that we observe a relatively low [O88]/[N122] ratio, and from it infer a metallicity significantly above 0.25 solar, suggests that the stellar age of this galaxy is at least several hundred million years. The galaxy must have therefore started forming stars at . This is somewhat at odds with the stellar age inferred from the SED analysis ( Myr). However, as argued above, much of the stellar mass may be completely obscured.
The stellar mass inferred from the SED fitting is only detected as far as 4.6 m, corresponding roughly to the -band in the rest-frame. As indicated by the 80–90 per cent obscured SFR fraction, we can infer that the average extinction to most sightlines in the galaxy is high. As also indicated by the relatively modest extinction in the UV-bright parts of the galaxy, the dust distribution is likely very patchy, with some low obscuration regions, and most of the galaxy completely extinguished (for example, a dust mass of M⊙ spread over about 1 kpc2 gives an Watson 2011). This suggests that the stellar mass of M⊙ inferred from the SED is only a lower bound, and the real stellar mass could be up to an order of magnitude higher. A stellar mass of M⊙ would lead to a characteristic age of about 300 Myr, consistent with the age required for the N/O overabundance.
We therefore suggest two things from these considerations: that A1689-zD1 may have a much higher stellar mass than previously inferred, and that its stellar age is Myr. Hence, it must have started forming stars at a significant rate at . This is consistent with the claims for significant star-formation inferred from candidate galaxies (e.g. Laporte et al., 2021).
4.3 Low dust formation efficiency at z > 7
With a metallicity estimate in hand, we can address the question of the dust-formation efficiency of a galaxy at for the first time. We calculated in Sec. 3.5 a dust-to-metals mass ratio of about 0.1. This is significantly lower than the MW value. For a MW gas-to-dust ratio of 150 (Galliano et al., 2018), suitable for galaxies close to solar metallicity, the corresponding dust mass in A1689-zD1 for its inferred gas mass should be M⊙, an order of magnitude higher than the measured value of M⊙.
Although there have been suggestions that the formation of dust may be less efficient at low metallicity (De Cia et al., 2016; Galliano et al., 2018), at solar metallicity, dust-formation efficiency is observed to be high. In other words, the DTM is expected to be close to the MW value of 0.5 at metallicities at least down to about 0.3 dex below solar, as is observed in low redshift galaxies (De Vis et al., 2019). The small number of estimates from emission-line galaxies at (Shapley et al., 2020) suggest that the DTM is constant at about 0.5 to that redshift at high metallicity too, with the caveat that for those galaxies the molecular mass was assumed to represent all the gas. Estimates of the DTM for systems detected in absorption indicate both a dependence on metallicity (De Cia et al., 2016) and no metallicity dependence (Zafar & Watson, 2013; Wiseman et al., 2017).
Regardless, A1689-zD1 is therefore a unique case, indicating a low dust formation efficiency in spite of the high metallicity. The low dust formation efficiency could point to a gas mass much lower than we have inferred, indicating a breakdown of the [C158]-Hi relation of Heintz et al. (2021), or a dust formation timescale longer than the stellar mass build-up or nitrogen-enrichment timescale of million years, or possibly a lack of high-emissivity dust originating in e.g. AGB stars. One caveat here is indeed the uncertainty in the emissivity of the dust. Local studies of the dust emissivity or dust mass absorption coefficient suggest lower emissivity by up to a factor of two in high density or higher temperature environments (Bianchi et al., 2022; Clark et al., 2019). This factor would alleviate some of the tension we observe here, though not eliminate it entirely.
Another way to resolve the tension would be to reduce the inferred metallicity. Reducing the metallicity by a factor of several, coupled with lowering the dust emissivity, could be enough to replicate the MW DTM. However, this would require either that the [N122] line luminosity is over an order of magnitude lower than our estimate or that the N/O line ratio-to-metallicity conversion (Rigopoulou et al., 2018; Harikane et al., 2020) is very different at this redshift (see Sec. 4.1.1)
4.4 [C158] deficit and the initial mass function
We find no [C158] deficit (e.g. Hodge & da Cunha, 2020) in A1689-zD1, similar to some other massive galaxies at (e.g. Capak et al., 2015; Schaerer et al., 2020; Schouws et al., 2022a). Katz et al. 2022 claim that the deficit comes from low C/O abundance at high redshift, which in turn arises from enrichment by low metallicity core-collapse supernovae with a top-heavy IMF with no AGB stars to provide carbon. Since most AGB stars take billion years to contribute substantially to the ISM, the presence of [C158]-bright sources at militates against the hypothesis of a top-heavy IMF with carbon-deficient supernovae.
4.5 Metallicity variation across the galaxy
As the SNR and spatial resolution of the [N122] data is much lower than that of the other lines, we could not create a resolved metallicity map. However, considering the fact that the [C158] and dust emission are stronger to the northwest side while the HST emission is stronger to the southeast (Knudsen et. al.(in prep.)), the metallicity may vary across the galaxy. A distinct difference in the metallicity between the major components measured with higher SNR measurements could indicate that the system was in the process of merging (Knudsen et al., 2017; Wong et al., 2022).
5 Conclusions
We have measured [O52] and [N122] for the first time in a reionisation-epoch galaxy. These measurements, coupled with previous measurements of [O88] and [C158], and several dust continuum detections, have allowed us to determine the electron density and metallicity of the galaxy, subject to modelling uncertainties.
A1689-zD1 appears to have approximately solar gas-phase metallicity, remarkably high and unusual for a normal galaxy at this epoch. The excess of nitrogen to oxygen indicates that the star-formation in this galaxy started at least 250 Myr earlier, i.e. at . The galaxy also appears to be atomic gas dominated, and to have a low dust-to-gas ratio for its metallicity, possibly hinting at a low efficiency for dust production in galaxies at this epoch.
Acknowledgements
We thank the anonymous referee for insightful comments, and Shengqi Yang and Luca Di Mascolo for helpful discussions.
This paper makes use of the following ALMA data: ADS/JAO.ALMA#2013.1.01064.S, ADS/JAO.ALMA#2015.1.01406.S, ADS/JAO.ALMA#2016.1.00954.S, ADS/JAO.ALMA#2017.1.00775.S, ADS/JAO.ALMA#2019.1.01778.S. ALMA is a partnership of ESO (representing its member states), NSF (USA) and NINS (Japan), together with NRC (Canada), MOST and ASIAA (Taiwan), and KASI (Republic of Korea), in cooperation with the Republic of Chile. The Joint ALMA Observatory is operated by ESO, AUI/NRAO and NAOJ. The National Radio Astronomy Observatory is a facility of the National Science Foundation operated under cooperative agreement by Associated Universities, Inc.
DW and SF are supported in part by Independent Research Fund Denmark grant DFF-7014-00017. The Cosmic Dawn Center is funded by the Danish National Research Foundation under grant number 140. KK acknowledges support from the Knut and Alice Wallenberg Foundation. FR acknowledges support from the European Union’s Horizon 2020 research and innovation program under the Marie Sklodowska-Curie grant agreement No. 847523 ‘INTERACTIONS’
Data Availability
The data used in the paper are available in the ALMA archive at https://almascience.nrao.edu. The derived data and models generated in this research will be shared on reasonable request to the corresponding author.
References
- Akins et al. (2022) Akins H., et al., 2022, The Astrophysical Journal
- Bakx et al. (2020) Bakx T. J. L. C., et al., 2020, Monthly Notices of the Royal Astronomical Society, 493, 4294
- Bakx et al. (2021) Bakx T. J. L. C., et al., 2021, Monthly Notices of the Royal Astronomical Society: Letters, 508, L58
- Bianchi et al. (2022) Bianchi S., et al., 2022, Astronomy & Astrophysics, 664, A187
- Bouwens et al. (2022) Bouwens R. J., et al., 2022, The Astrophysical Journal, 931, 160
- Bradley et al. (2008) Bradley L. D., et al., 2008, The Astrophysical Journal, 678, 647
- Capak et al. (2015) Capak P. L., et al., 2015, Nature, 522, 455
- Carniani et al. (2017) Carniani S., et al., 2017, Astronomy and Astrophysics, 605, A42
- Carniani et al. (2020) Carniani S., et al., 2020, Monthly Notices of the Royal Astronomical Society, 499, 5136
- Chartab et al. (2022) Chartab N., et al., 2022, Nature Astronomy
- Clark et al. (2019) Clark C. J. R., et al., 2019, Monthly Notices of the Royal Astronomical Society, 489, 5256
- Cormier et al. (2019) Cormier D., et al., 2019, Astronomy & Astrophysics, 626, A23
- Croxall et al. (2013) Croxall K. V., et al., 2013, The Astrophysical Journal, 777, 96
- Curti et al. (2020) Curti M., Mannucci F., Cresci G., Maiolino R., 2020, Monthly Notices of the Royal Astronomical Society, 491, 944
- Curti et al. (2022) Curti M., et al., 2022, Monthly Notices of the Royal Astronomical Society, p. stac2737
- De Cia et al. (2016) De Cia A., Ledoux C., Mattsson L., Petitjean P., Srianand R., Gavignaud I., Jenkins E. B., 2016, Astronomy & Astrophysics, 596, A97
- De Vis et al. (2019) De Vis P., et al., 2019, Astronomy & Astrophysics, 623, A5
- Ferrara et al. (2022) Ferrara A., et al., 2022, Monthly Notices of the Royal Astronomical Society, 512, 58
- Fudamoto et al. (2021) Fudamoto Y., et al., 2021, Nature, 597, 489
- Galliano et al. (2018) Galliano F., Galametz M., Jones A. P., 2018, Annual Review of Astronomy and Astrophysics, 56, 673
- Ginsburg et al. (2019) Ginsburg A., et al., 2019, radio-astro-tools/spectral-cube: v0.4.4, doi:10.5281/ZENODO.2573901, https://zenodo.org/record/2573901
- Harikane et al. (2020) Harikane Y., et al., 2020, The Astrophysical Journal, 896, 93
- Hashimoto et al. (2019) Hashimoto T., et al., 2019, Publications of the Astronomical Society of Japan, 71, 71
- Heintz et al. (2021) Heintz K. E., Watson D., Oesch P. A., Narayanan D., Madden S. C., 2021, The Astrophysical Journal, 922, 147
- Henry et al. (2000) Henry R. B. C., Edmunds M. G., Köppen J., 2000, The Astrophysical Journal, 541, 660
- Hodge & da Cunha (2020) Hodge J. A., da Cunha E., 2020, Royal Society Open Science, 7, 200556
- Jones et al. (2020) Jones T., Sanders R., Roberts-Borsani G., Ellis R. S., Laporte N., Treu T., Harikane Y., 2020, The Astrophysical Journal, 903, 150
- Katz et al. (2022) Katz H., et al., 2022, Monthly Notices of the Royal Astronomical Society, 510, 5603
- Kewley & Dopita (2002) Kewley L. J., Dopita M. A., 2002, The Astrophysical Journal Supplement Series, 142, 35
- Kewley et al. (2019) Kewley L. J., Nicholls D. C., Sutherland R. S., 2019, Annual Review of Astronomy and Astrophysics, 57, 511
- Knudsen et al. (2017) Knudsen K. K., Watson D., Frayer D., Christensen L., Gallazzi A., Michalowski M. J., Richard J., Zavala J., 2017, Monthly Notices of the Royal Astronomical Society, 466, 138
- Kojima et al. (2017) Kojima T., Ouchi M., Nakajima K., Shibuya T., Harikane Y., Ono Y., 2017, Publications of the Astronomical Society of Japan, 69
- Laporte et al. (2017) Laporte N., et al., 2017, The Astrophysical Journal, 837, L21
- Laporte et al. (2021) Laporte N., Meyer R. A., Ellis R. S., Robertson B. E., Chisholm J., Roberts-Borsani G. W., 2021, Monthly Notices of the Royal Astronomical Society, 505, 3336
- Li et al. (2020) Li J., et al., 2020, The Astrophysical Journal, 900, 131
- Liang et al. (2006) Liang Y. C., Yin S. Y., Hammer F., Deng L. C., Flores H., Zhang B., 2006, The Astrophysical Journal, 652, 257
- Maiolino & Mannucci (2019) Maiolino R., Mannucci F., 2019, The Astronomy and Astrophysics Review, 27, 3
- Maiolino et al. (2015) Maiolino R., et al., 2015, Monthly Notices of the Royal Astronomical Society, 452, 54
- Mannucci et al. (2010) Mannucci F., Cresci G., Maiolino R., Marconi A., Gnerucci A., 2010, Monthly Notices of the Royal Astronomical Society, 408, 2115
- Marrone et al. (2018) Marrone D. P., et al., 2018, Nature, 553, 51
- McMullin et al. (2007) McMullin J. P., Waters B., Schiebel D., Young W., Golap K., 2007, Astronomical Data Analysis Software and Systems XVI, 376, 127
- Nagao et al. (2011) Nagao T., Maiolino R., Marconi A., Matsuhara H., 2011, Astronomy & Astrophysics, 526, A149
- Novak et al. (2019) Novak M., et al., 2019, The Astrophysical Journal, 881, 63
- Palay et al. (2012) Palay E., Nahar S. N., Pradhan A. K., Eissner W., 2012, Monthly Notices of the Royal Astronomical Society, 423, L35
- Pentericci et al. (2016) Pentericci L., et al., 2016, The Astrophysical Journal, 829, L11
- Pereira-Santaella et al. (2017) Pereira-Santaella M., Rigopoulou D., Farrah D., Lebouteiller V., Li J., 2017, Monthly Notices of the Royal Astronomical Society, 470, 1218
- Pilyugin et al. (2014) Pilyugin L. S., Grebel E. K., Kniazev A. Y., 2014, The Astronomical Journal, 147, 131
- Planck Collaboration et al. (2016) Planck Collaboration et al., 2016, Astronomy & Astrophysics, 594, A13
- Queyrel et al. (2009) Queyrel J., et al., 2009, Astronomy & Astrophysics, 506, 681
- Rigopoulou et al. (2018) Rigopoulou D., Pereira-Santaella M., Magdis G. E., Cooray A., Farrah D., Marques-Chaves R., Perez-Fournon I., Riechers D., 2018, Monthly Notices of the Royal Astronomical Society, 473, 20
- Salvaterra (2015) Salvaterra R., 2015, Journal of High Energy Astrophysics, 7, 35
- Sanders et al. (2021) Sanders R. L., et al., 2021, The Astrophysical Journal, 914, 19
- Schaerer et al. (2020) Schaerer D., et al., 2020, Astronomy & Astrophysics, 643, A3
- Schaerer et al. (2022) Schaerer D., Marques-Chaves R., Barrufet L., Oesch P., Izotov Y. I., Naidu R., Guseva N. G., Brammer G., 2022, Astronomy & Astrophysics, 665, L4
- Schouws et al. (2022a) Schouws S., et al., 2022a, arXiv:2202.04080 [astro-ph]
- Schouws et al. (2022b) Schouws S., et al., 2022b, The Astrophysical Journal, 928, 31
- Shapley et al. (2020) Shapley A. E., Cullen F., Dunlop J. S., McLure R. J., Kriek M., Reddy N. A., Sanders R. L., 2020, The Astrophysical Journal, 903, L16
- Sommovigo et al. (2021) Sommovigo L., Ferrara A., Carniani S., Zanella A., Pallottini A., Gallerani S., Vallini L., 2021, Monthly Notices of the Royal Astronomical Society, 503, 4878
- Stott et al. (2013) Stott J. P., et al., 2013, Monthly Notices of the Royal Astronomical Society, 436, 1130
- Sugahara et al. (2021) Sugahara Y., et al., 2021, The Astrophysical Journal, 923, 5
- Tamura et al. (2019) Tamura Y., et al., 2019, The Astrophysical Journal, 874, 27
- Torrey et al. (2018) Torrey P., et al., 2018, Monthly Notices of the Royal Astronomical Society: Letters, 477, L16
- Vincenzo et al. (2016) Vincenzo F., Belfiore F., Maiolino R., Matteucci F., Ventura P., 2016, Monthly Notices of the Royal Astronomical Society, 458, 3466
- Watson (2011) Watson D., 2011, Astronomy & Astrophysics, 533, A16
- Watson et al. (2015) Watson D., Christensen L., Knudsen K. K., Richard J., Gallazzi A., Michałowski M. J., 2015, Nature, 519, 327
- Wiseman et al. (2017) Wiseman P., Schady P., Bolmer J., Krühler T., Yates R. M., Greiner J., Fynbo J. P. U., 2017, Astronomy & Astrophysics, 599, A24
- Witstok et al. (2022) Witstok J., et al., 2022, Monthly Notices of the Royal Astronomical Society, 515, 1751
- Wong et al. (2022) Wong Y. H. V., et al., 2022, The Astrophysical Journal, 929, 161
- Yabe et al. (2015) Yabe K., et al., 2015, Publications of the Astronomical Society of Japan, 67, 102
- Yang & Lidz (2020) Yang S., Lidz A., 2020, Monthly Notices of the Royal Astronomical Society, 499, 3417
- Zafar & Watson (2013) Zafar T., Watson D., 2013, Astronomy & Astrophysics, Volume 560, id.A26, <NUMPAGES>7</NUMPAGES> pp., 560, A26
- Zhang et al. (2018) Zhang Z.-Y., et al., 2018, Monthly Notices of the Royal Astronomical Society, 481, 59