1Department of Physics, Savitribai Phule Pune University, Pune 411007, India.
\affilTwo2National Centre for Radio Astrophysics (NCRA), Tata Institute of Fundamental Research (TIFR), Pune 411 007, India.
\affilThree3Department of Astronomy, Astrophysics and Space Engineering, Indian Institute of Technology Indore, Simrol, 453552, India.
\affilFour4Thüringer Landessternwarte, Sternwarte 5,
07778 Tautenburg, Germany.
\affilFive5Indian Institute of Astrophysics,
II Block, Koramangala,
Bengaluru 560 034, INDIA.
\affilSix6Department of Physics and Electronics, Rhodes University, PO Box 94, Makhanda, 6140, South Africa.
7AIM, CEA, CNRS, Université Paris-Saclay, Université Paris Diderot, Sorbonne Paris Cité, F-91191 Gif-sur-Yvette, France
8Laboratoire Univers et Particules de Montpellier (LUPM)/CNRS,
Université de Montpellier, CC 072 - Place Eugène Bataillon
34095 Montpellier Cedex 5, France.
9Institute of Astronomy and Department of Physics, National Tsing Hua University, No. 101, Section 2, Kuang-Fu Road, Hsinchu 30013, Taiwan.
10Inter-University Centre for Astronomy and Astrophysics, Ganeshkhind, Pune 411007, India
11Raman Research Institute, Raman Research Institute, Bangalore, 560080, India
\affilTwelve12Tata Institute of Fundamental Research, 1 Homi Bhabha Road, Colaba, Mumbai 400005, India
Exploring diffuse radio emission in galaxy clusters and groups with
the uGMRT and the
SKA
Abstract
Diffuse radio emission has been detected in a considerable number of galaxy clusters and groups, revealing the presence of pervasive cosmic magnetic fields, and of relativistic particles in the large scale structure of the Universe. Since the radio emission in galaxy systems is faint and its spectrum is steep, its observations are largely limited by the instrument sensitivity and frequency of observation, leading to a dearth of information, more so for lower-mass systems. The recent commissioning or upgrade of several large radio telescope arrays, particularly at the low frequency bands ( GHz), is, therefore, a significant step forward. The unprecedented sensitivity of these new instruments, aided by the development of advanced calibration and imaging techniques, have helped in achieving unparalleled image quality and revolutionised the study of cluster-scale radio emission. At the same time, the development of state-of-the-art numerical simulations and the availability of supercomputing facilities have paved the way for high-resolution numerical modeling of radio emission, and the structure of the cosmic magnetic fields, associated with large-scale structures in the Universe, leading to predictions matching the capabilities of observational facilities. In view of these rapidly-evolving developments in modeling and observations, in this review, we summarise the role of the new telescope arrays and the development of advanced imaging techniques and discuss the range of detections of various kinds of cluster radio sources, both in dedicated surveys as well as in numerous individual studies. We pay specific attention to the kinds of diffuse radio structures that have been able to reveal the underlying physics in recent observations. In particular, we discuss observations of large-scale sections of the cosmic web in the form of supercluster filaments, and studies of emission in low mass systems such as poor clusters and groups of galaxies, and of ultra-steep spectrum sources, the last two being notably aided by low-frequency observations and high sensitivity of the instruments being developed. We also discuss and review the current theoretical understanding of various diffuse radio sources in clusters and the associated magnetic field and polarization in view of the current observations and simulations. As the statistics of detections improve along with our theoretical understanding, we update the source classification schemes based on the intrinsic properties of these sources. We conclude by summarising the role of the upgraded GMRT (uGMRT) and our expectations from the upcoming Square Kilometre Array (SKA) observatories.
keywords:
keyword1—keyword2—keyword3.surajit@physics.unipune.ac.in
1 January 20221 January 2022
12.3456/s78910-011-012-3 \artcitid#### \volnum000 2022 \pgrange1– \lp1
1 Radio observations of galaxy clusters
Clusters of galaxies are massive () and large ( Mpc scale) systems residing at the top of the hierarchy of extragalactic gravitationally-bound structures in the Universe. They are usually found embedded at the cross-roads of the cosmic web (van de Weygaert & Bond, 2008; Springel et al., 2006) and many are found non-relaxed, indicating that they are still in the process of formation (Molnar, 2016). Various physical processes in the components of these systems make them luminous enough to be detected in astronomical observations at various wavelengths. Clusters are generally thermalized, their hot intra-cluster baryonic medium being prominent in X-ray emission (Sarazin, 1986). A number of them are also detected as diffuse sources at radio wavelengths (for a review: van Weeren et al. 2019), confirming their non-thermal energy content.
These diffuse continuum radio sources in galaxy clusters are associated with the intra-cluster medium (ICM) and are usually not associated with any optical counterparts in the system. Typically, their extent is in the range 100 kpc to a few Mpc with diverse morphologies. The emission usually has a power-law energy distribution with a steep spectral index111The spectral index, is defined as where is the flux density at the frequency . (). These sources are generally faint at GHz frequencies (0.1–1 Jy arcsec-2 at 1.4 GHz), and the steepness of the spectrum is largely due to the nature of the injection spectra (Stroe et al., 2014b). The evolution of the plasma associated with the radio emission is controlled largely by synchrotron and inverse Compton energy losses, and thus, as the plasma gets older, it results in further steepening of the radio spectrum (e.g. van Weeren et al., 2009).
The cluster radio sources have been traditionally classified as radio halos, relics and mini-halos, depending mainly on their shape, the process of origin and the location within the cluster (e. g. Ensslin et al., 1998a; Giovannini et al., 1999; Feretti & Giovannini, 2008; Feretti et al., 2012). An updated version appears in a review by van Weeren et al. (2019), where a new class has been added combining the revived AGN fossil plasma sources (“phoenix”) and Gently re-energized tails (GReETs, de Gasperin et al. 2017a), with a discussion on the characteristic properties of these sources.
Since these sources are low in brightness and have a steep spectrum, their detection is limited by the instrument sensitivity and the sophistication of imaging techniques. Therefore, the study of diffuse radio emission from clusters got a huge fillip with the advent of highly sensitive telescopes as well as with the development of advanced calibration and imaging software and pipelines.
The review is organized as follows. The role of large telescopes is described in §1.1 and the current software packages and methods are described in §1.2. We further summarize the large surveys conducted so far and their future scope in §2. The observational status of various kinds of cluster diffuse radio sources and the detection of associated magnetic fields have been updated in §3. Recently, systematic studies of the detection of diffuse radio sources from structures apart from and beyond the clusters (such as super-cluster filaments, galaxy groups and poor clusters) have gained momentum. We summarize and update on these efforts in §4 and §5. Updates on the theoretical understanding of diffuse synchrotron radio emission, the role of AGN feedback and the origin and evolution of cosmic magnetic fields from various cluster sources along with the efforts made so far on numerical simulations on this matter have been presented in §6. With a better understanding of the origin of these radio sources, we propose a novel classification in §7. The role of uGMRT and the expectations from the upcoming SKA telescopes in the context of clusters have been summarized in §8, and conclusions outlined in §9.
1.1 Role of large telescope arrays
The first large diffuse radio source was discovered in the nearby Coma cluster (Large et al., 1959) with a size of 1.1 Mpc. Yet, to gather a sizeable sample of galaxy cluster scale diffuse radio emissions, it took more than five decades, mostly through targeted individual objects and a handful of dedicated surveys (Venturi et al., 2007a, 2008a, 2013; Giacintucci et al., 2011; Kale et al., 2013; Kale et al., 2015b; Parekh et al., 2017a; Paul et al., 2019).
In recent times, however, there has been a race for searching diffuse radio emission in clusters, especially from large surveys. A large sample of 115 clusters, though many among them are previously known, were observed under The MeerKAT Galaxy Cluster Legacy Survey (MGCLS). MeerKAT has allowed us to study them at an unprecedented depth of Jy beam-1 at wide L-Band (900-1670 MHz) with full polarization information (Knowles et al., 2022), revealing many new unique features of diffuse structures. LoFAR Two Meter Sky Survey (LoTSS-1 & 2), on the other hand, has given an opportunity to study the sky at low frequencies (central frequency of 144 MHz) with a median rms as low as 83 Jy beam-1 (Shimwell et al., 2019, 2022). For deep fields, maps are further deeper at 30 Jy beam-1 (Osinga et al., 2021). LoFAR has so far discovered more than new clusters with halo, relics or revived fossil plasma sources (or candidates) (van Weeren et al., 2021; Osinga et al., 2021; Mandal et al., 2020; Botteon et al., 2022). Botteon et al. (2020a); Hoang et al. (2019) even discovered ultra-steep spectrum and extremely faint radio bridges between the pairs of interacting clusters. Studies with LoFAR helped in mapping diffuse radio emissions from the Supercluster members (Ghirardini et al., 2021) as well as constraining magnetic field in the filaments (Locatelli et al., 2021). Strikingly, ultra-steep spectrum halos have been discovered in massive relaxed clusters (Savini et al., 2019). The ultra-sensitive wideband frequency coverage by uGMRT made possible the study of extremely steep ( and curved spectrum relic/phoenix emissions (Kale et al., 2018; Lal, 2020). Low-mass clusters and groups that remained undetected due to their expected low luminosity have now been detected using the wideband uGMRT studies (Paul et al., 2021) as well as in LoFAR, the emission from the intra-group medium (Nikiel-Wroczyński et al., 2019). Spectral index studies of distant radio halos are done by combining data from uGMRT and LoFAR, two extremely sensitive telescopes working at complementary frequencies, (Di Gennaro et al., 2021b).
1.2 Role of imaging packages and pipelines
A vital aspect of radio interferometry is processing the raw data from telescope observation and converting it to science-ready images. Owing to the low surface brightness of the cluster diffuse radio sources, dynamic range and sensitivity limitations at low frequencies makes them challenging targets. New generation radio interferometry comes with wideband wide-field observations, which have helped scan the sky over a large field of view with improved sensitivity. Due to the large bandwidth, the observing radio frequency bands are also often crowded with several undesirable radio frequency interference (RFI) which should be removed properly for an improved image. AOFlagger (Offringa et al., 2010, 2012) is an automated pipeline for effective RFI excision with a faster execution time. Moreover, the resolution, sensitivity to extended emission, and primary beam changes over the large bandwidth need to be accounted for in wideband observations. Wide-field imaging suffers non-coplanar baseline aberration, which results in degradation of image and phase error and thus needs to be corrected for the w-term. The introduction of wide-field, Multi-scale (MS) and Multi Term (MT) Multi Frequency Synthesis (MFS) imaging (Rau & Cornwell, 2011) helped alleviate issues with wideband imaging and construct better spatial and spectral structure across a large field of view. The Astronomical Image processing System (AIPS), developed by NRAO (National Radio Astronomy Observatory), is one of the oldest imaging packages. While Common Astronomy Software Application (CASA: McMullin et al. 2007), developed by NRAO in the last decade, is more user-friendly. With flagging, direction-independent calibration, imaging techniques, and post-deconvolution primary beam correction, CASA has been successful in providing science-ready images. The imaging algorithm of CASA includes MS-MFS, and MT-MFS techniques, as well as the W projection method (Cornwell et al., 2008) for correcting the effects from non-coplanar baselines. The joint channel deconvolution in WSClean Imager (Offringa et al., 2014; Offringa & Smirnov, 2017) with w-stacking algorithm performs imaging 2-3 orders faster than CASA MSMFS. In addition to these, radio interferometric observations are hampered by a variety of time-dependent instrumental and ionospheric effects, particularly at low-frequency observations, and require direction-dependent calibration methods. These effects are well represented by Jones matrices and are now being addressed, thanks to upgraded calibration techniques. Source peeling and atmosphere modelling (SPAM: Intema, H. T. et al. 2009, 2017) is a widely used pipeline for both direction independent and dependent calibration for GMRT. KillMS (Tasse, 2014) and DD-FAcet (Tasse et al., 2018), Facet-based imaging software, are exceptional in dealing with externally defined direction-dependent Jones matrices and varying beam patterns for LoFAR. KillMS DD-FAcet can also be used for other telescopes like GMRT, VLA, MeerKAT, and ATCA. With the A-projection algorithm (Bhatnagar et al., 2008), the pointing errors and errors induced due to asymmetric antenna power pattern can be removed during deconvolution.
Larger arrays increase the data size, escalating the computing load for imaging and calibration. Manual data reduction for these big data sets is both labour-intensive and error-prone, and thus requires modern processing pipelines. With the introduction of automated and semi-automated pipelines, for instance VLA Calibration pipeline for updated VLA data, SPAM and CAPTURE for GMRT (Kale & Ishwara-Chandra 2021), Apercal for WSRT data reduction (Schulz et al., 2020), CARACal (Józsa et al., 2020) for MeerKAT, data handling has been made easier. The WSCleanIDG algorithm applies the correction in the image plane instead of the visibility plane and maps large sky areas with better efficiency and less computational cost (Sweijen et al., 2022). Cubical (Kenyon et al., 2018) is a cython-based calibration package designed for multiprocessing and much faster execution. Recent studies by Wilber et al. 2020; Parekh et al. 2021 have shown how the use of these software packages has significantly improved image dynamic range.
These highly sensitive telescopes and the development of advanced and sophisticated imaging packages and pipelines have helped in revealing a number of sources with new and unclassifiable properties, especially, plenty of ultra-steep and curved spectrum sources. Also, the discovery of many low-mass clusters with diffuse radio sources, with widely differing values of radio power, exceeded theoretical expectations. Interestingly, though it took six decades of radio observations to discover about 200 diffuse radio sources associated with galaxy clusters, only the last three years of observations have revealed more than 100 new sources (Botteon et al., 2022) with these new instruments, from even a limited sky coverage. LoFAR, from the Planck clusters list alone, is predicted to discover roughly 350 new clusters (Botteon et al., 2022) with diffuse radio sources in the near future, from the entire northern sky.
1.3 uGMRT and the SKA
The GMRT is a radio telescope array located in Khodad, near Pune, India (Swarup et al., 1991). It consists of 30 dish antennas, with a diameter of 45 m each, spread in a roughly “Y”-shaped array forming baselines with lengths in the range of 100 m to 25 km. The upgrade of the GMRT involved the replacement of the earlier narrowband receivers with broadband ones and a new correlator (GMRT Wideband Backend) that allows recording data with instantaneous bandwidths of up to 400 MHz (Gupta et al., 2017). The wideband observations (400 MHz) as compared to the earlier narrowband ones (33 MHz) imply an improvement in sensitivity by a factor 3.4. Most importantly, in the context of imaging diffuse radio sources, it significantly improves the -coverage. A simulation study of imaging extended sources with the uGMRT shows that there will be considerable improvement in recovering the morphology of extended sources due to the improved -coverage (Deo & Kale, 2017).
The SKA is proposed to be the largest radio observatory to be built. Phase 1 will consist of two parts: SKA1-mid and SKA1-low. The SKA1-mid will operate in the frequency range of 350 MHz–15 GHz and will consist of 197 dish antennas offering maximum baseline lengths of up to 150 km. The SKA1-low will operate at 50–350 MHz and will be an aperture array of 512 stations spread over an array offering maximum baselines of 65 km(Braun et al., 2019). The SKA will be able to image the sky south of declination .
In the context of diffuse radio emission from galaxy clusters, the SKA 1 is expected to uncover radio halo emission in thousands of clusters up to the redshift of 0.6 (Cassano et al., 2015a; Kale et al., 2016) and similarly for mini-halos (Gitti et al., 2018), allowing to compare the status of magnetic fields in low and high redshift clusters. With SKA pathfinders such as the uGMRT and precursor facilities, we expect to get a glimpse of the possible science.
2 Radio surveys of galaxy clusters
The search for diffuse emission in galaxy clusters has been carried out systematically by either using all-sky radio surveys or targeted observations. The GMRT Radio Halo Survey (GRHS) carried out at 610 MHz was the first, large, targeted sub-GHz survey of galaxy clusters (Venturi et al., 2007b, 2008b). The GRHS and its extension, together referred to as the EGRHS, consisted of 64 clusters selected from the REFLEX and eBCS catalogues with the criteria: X-ray luminosity erg s-1, redshift in the range and declination (Kale et al., 2013, 2015a). The occurrence of radio halos was found in , of relics in , and of mini-halos in of the EGRHS sample. A total of 31 upper limits for radio halos and 5 for mini-halos were reported using the method of injection of model radio halos in the cases of non-detections (Kale et al., 2013, 2015a). Further to this survey, with the availability of SZ-detected clusters, nearly complete mass-limited samples have been surveyed. A scaling relation between the radio halo power and the integrated Sunyaev-Zel’dovich (SZ) effect measurements (host cluster mass) and the weakness of the bimodality in this plane was reported by Basu (2012). Targeted studies of Planck-discovered clusters also revealed new radio halos (e. g. Bagchi et al., 2011; Bonafede et al., 2015). Further, Cuciti et al. (2021b) have surveyed 75 galaxy clusters from the Planck catalogue in the redshift range of 0.08-0.33 with masses and . In this study, it was found that of the radio halos are hosted in merging clusters, and their radio power is correlated with the mass of the host clusters, albeit with a large dispersion. Surveys of samples selected from the Massive Cluster Survey (MACS) and the South Pole Telescope have also revealed new cluster radio sources (Parekh et al., 2017a; Paul et al., 2019; Raja et al., 2021).
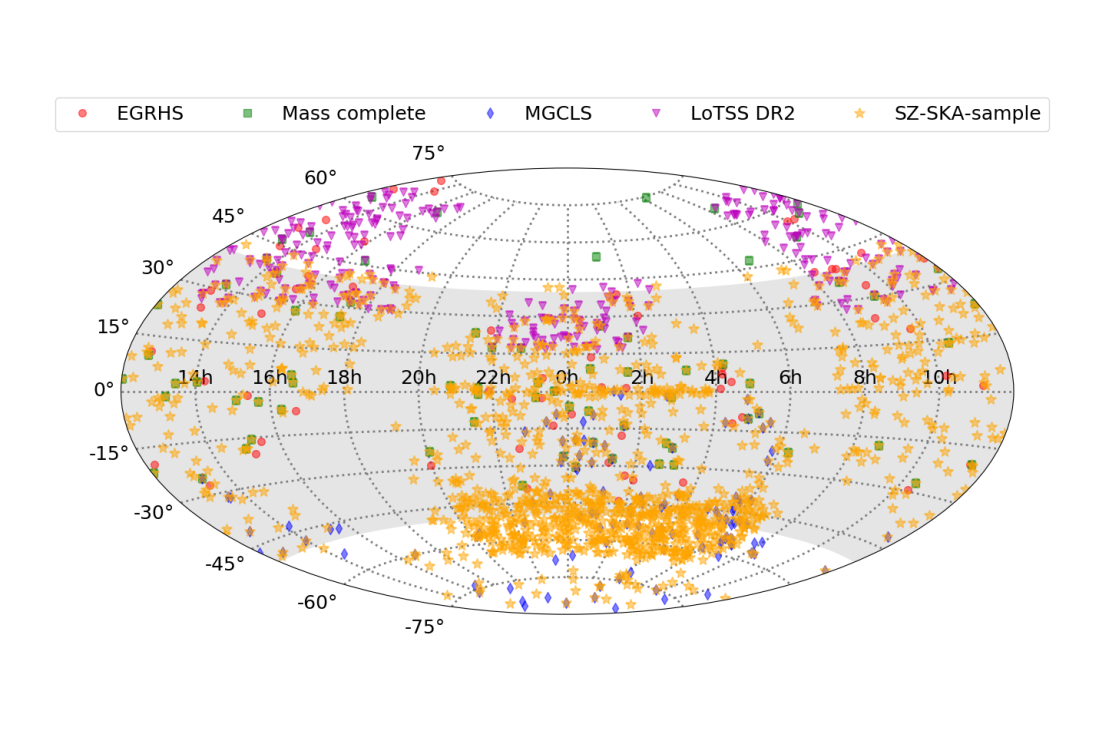
MeerKAT, the precursor for the SKA in South Africa, has recently released the radio images of about 115 clusters at 1280 MHz, called the MeerKAT Galaxy Cluster Legacy Survey (MGCLS; Knowles et al., 2022). This sample spans a declination range of to degrees, a redshift range of and consists of X-ray and radio selected clusters based on published works and the MCXC catalogue. The first glimpse at samples of clusters at high redshifts () was recently possible with the LOFAR. Among 20 clusters that were sampled, radio halos were found in of the clusters, which imply that a process of fast magnetic amplification may be playing a role (Di Gennaro et al., 2021a). The largest survey so far has been done recently by Botteon et al. (2022) taking a list of 309 clusters from the second catalogue of Planck SZ-detected sources that were in the area of 5634 deg2 covered by the Second Data Release of the LOFAR Two-meter Sky Survey (LoTSS-DR2). The survey has median redshift of in the range and mass range of . With a median rms noise of Jy, out of 309 clusters, 83 clusters are found to host radio halos, including candidate halos and 26 are detected with radio relics and candidate relics, with an overall detection rate of halos and relics, of which almost 50% are new detection. This survey also includes the earlier survey of HETDEX spring region using LOFAR telescope (van Weeren et al., 2021). We show the large surveys of clusters in the sky in Fig. 1.
Targeted radio surveys with interferometers such as the GMRT require long observations and thus if suitable surveys of wide regions of the sky are available, the search for diffuse emission in galaxy clusters can speed up considerably. In Fig. 1 we have marked the cluster sample from the Planck which will be accessible for studies with the SKA. There is a large overlap in the cluster samples accessible to uGMRT and the SKA between the declinations of and 222The limiting declination is taken to be the one where the observing time is 3.5 h given the elevation limit of the respective telescope..
3 Diffuse radio sources in clusters
3.1 Current classification of cluster radio sources
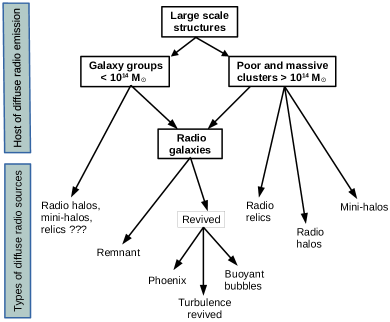
With the growing statistics of the diffuse cluster radio sources, to ease systematic studies, one needs classifying these sources. Historically, these sources were classified broadly into Radio halos, Relics and mini-halos, based on a mixture of their location and the origin (Ensslin et al., 1998a; Giovannini et al., 1999; Feretti & Giovannini, 2008; Feretti et al., 2012). Recently, with ample of data availability and with a better understanding of these sources, van Weeren et al. (2019) have made a new classification where they clubbed radio halo and mini-halos under the name (i) radio-halo, depending on their location and shape. Instead of radio relics, they named them (ii) cluster radio shocks, depending on their mechanism of origin, and finally, defined a new class of objects as (iii) revived AGN fossil plasma sources, phoenices, and GReET, because of their ultra-steep spectrum nature. Depending on the current classification schemes, we provide here a schematic diagram in Fig. 2, and present the updates on these various diffuse radio sources in further subsections.
Although, radio halos, mini-halos and cluster radio shocks in general show a power-law spectrum, AGN relics or fossil plasma sources and phoenices show a rather curved spectrum due to the ageing effect. While the power-law spectrum favours an in-situ particle acceleration mechanism, spectral curvature indicates the dying or revival of aged synchrotron emitting electrons (van Weeren et al., 2019). It shows, that the distinct nature of these sources depends primarily on the initial spectrum of the electrons and the dynamics of the ICM. With the large number of discoveries of diffuse radio sources in and around galaxy clusters, a reconsideration of the classification may be needed.
3.2 Radio halos and mini-halos
Diffuse, mega-parsec sized radio sources that extend over the cluster volume, are more or less co-spatial with the thermal X-ray emitting gas of the ICM and cannot be associated with any of the cluster galaxies, are termed as radio halos. Radio halos typically have radio powers at 1.4 GHz in the range W Hz-1 and are found to be unpolarized (Giovannini et al., 2009; Feretti & Giovannini, 2008). The most powerful radio halos have been found in merging clusters (e. g. Buote, 2001; Cassano et al., 2010). The radio halos are proposed to be powered by a re-acceleration process involving turbulence (Brunetti & Jones, 2014, for review) and the underlying population of relativistic electrons that are produced as a by-product of the hadronic collisions (Dennison, 1980; Schlickeiser et al., 1987). Part of the mildly relativistic seed electron population may also be a result of the radio galaxies in the cluster. The theoretical models in this regard are described in Sec. 6.
Radio mini-halos are diffuse radio sources surrounding the brightest cluster galaxies (BCGs) in relaxed, cool-core clusters, and have extents 100–500 kpc. Otherwise, they have observational radio properties almost similar to that of radio halos. Mini-halos are known to occur in both low and high redshift clusters, such as redshift 0.018 (Perseus cluster, Sijbring, 1993) and redshift 0.596 (Phoenixcluster, van Weeren et al., 2014)(Raja et al., 2020b). A mini-halo has been recently reported in the cluster ACT-CL J0022.2–0036 at redshift 0.8050 (Knowles et al., 2019) and an intermediate radio halo in SPT-CL J2031-4037 (Raja et al., 2020a). The spectral indices () of the few mini-halos that are known, are in the range of 1.2–1.6 at frequencies between 300–1400 MHz (Giacintucci et al., 2014; Richard-Laferrière et al., 2020). The correlation between the BCG and MH radio luminosities indicates that the radio emission from the BCG itself (known to be AGN feedback due to multiphase cooling of cluster cores) may have a crucial role to play (Giacintucci et al., 2014). In a recent work, Richard-Laferrière et al. (2020) have studied a sample of 33 clusters with mini-halos and explored the connection between the Brightest Cluster Galaxy and the mini-halo. They suggest a connection between the feedback processes at the AGN and the mini-halo, in line with the earlier hypothesis by Bravi et al. (2016).
The X-ray properties of clusters hosting mini-halos and radio halos are found to be very different. Mini-halos are found in relaxed clusters and radio halos in merging clusters (e. g. Cassano et al., 2010; Kale et al., 2015a). The distribution of central entropy () in galaxy clusters shows that the clusters hosting mini-halos have keV cm2 and those hosting radio halos typically have keV cm2 (Giacintucci et al., 2017).
The division between mini-halos and radio halos is getting blurred due to deeper observations leading to new discoveries that challenge the current classification. Theoretical models have also proposed that the clusters that are intermediate to merging or relaxed may show the presence of diffuse sources with properties consistent with mini-halos as well as radio halos (Brunetti & Jones, 2014). There are examples of transition systems such as RXCJ0232.2-4420 (Kale et al., 2019) and also mini-halos that have a more extended component (Sommer & Basu, 2014; Venturi et al., 2017) which is also steeper in spectrum (e. g. Savini et al., 2018, 2019; Rahaman et al., 2021). Classification as a mini-halo or a radio halo requires availability of X-ray data. In the recent search for diffuse radio emission in the LoFAR DR2 (Shimwell et al., 2022), the term mini-halo has been dropped to avoid the uncertain classification until X-ray data become available, and the term radio halo is used to describe centrally located diffuse radio emission in clusters (Botteon et al., 2022). A new look at the classification may be needed, in view of the variety of sources that are discovered.
3.3 Radio relics (cluster radio shocks)
Radio relics or cluster radio shocks are diffuse radio sources with elongated or arc-like morphology that typically occur at the peripheries of clusters, usually coinciding with the X-ray shocks. In some cases a pair of such sources occur on nearly opposite peripheries of clusters and these are termed as double radio relics (Bonafede et al., 2017). These radio shocks are found with sizes up to several Mpc, comparatively flatter spectrum than radio halos/mini-halos and are highly polarized having fractional polarization at 1.4 GHz; (van Weeren et al., 2009; Kierdorf et al., 2017; Schellenberger et al., 2022; Rajpurohit et al., 2022; de Gasperin et al., 2022).
Relics were proposed as originating in accretion shocks at cluster outskirts (e. g. Ensslin et al., 1998b). However, evidence from morphologies and spectral indices suggests that the shocks are most likely merger shocks that travel outward with respect to the cluster centre (Paul et al., 2011; Nuza et al., 2017). The Mach numbers of the underlying shocks are in the range 1–4 which are much lower than expected for accretion shocks (Markevitch & Vikhlinin, 2007). Observational evidence has been found in a few clusters showing an overall consistency of radio and X-ray derived Mach numbers (Akamatsu & Kawahara, 2013; Rajpurohit et al., 2021b; Chatterjee et al., 2022) supporting the merger shock scenario. Moreover, the polarization studies also exhibit aligned magnetic fields, along with the elongation of the relics (e. g. van Weeren et al., 2010a; Kale et al., 2012; Rajpurohit et al., 2021b).
3.4 Remnant radio galaxies
After the jets of radio galaxies cease to be active, the radio lobes evolve passively unless disturbed by any other event in the surrounding medium. Due to synchrotron radiation and inverse-Compton scattering, the relativistic electrons lose energy rapidly, making the radio lobe fainter. Over time scales of a million years or so, the lobe can be undetectable. Such diffuse radio sources can be found in clusters. The pressure of the intra-cluster medium can lead to confinement of the lobes and prevent expansion losses (Enßlin & Gopal-Krishna, 2001). Steep spectrum diffuse radio sources which have morphologies like double lobes but no obvious jet and a core can be classified as remnant radio galaxies (e.g. Murgia et al., 2011; Salunkhe et al., 2022). A sample of such sources having steep spectra extracted from the NVSS and VLSS surveys was presented by Dwarakanath & Kale (2009). Also, more recent studies with the Murchison Wide-field Array as well as MeerKAT (MGCLS) have resulted in discoveries of remnant radio galaxies (Quici et al., 2021; Hodgson et al., 2021; Oozeer et al., 2021; Knowles et al., 2022). However, such sources need not necessarily have steep spectra, as can be seen based on the properties of the remnant discovered with the LOFAR (Brienza et al., 2016). Deeper surveys are likely to expand the samples of such remnants as we reach fainter levels of detection across the frequency range, such as covered by the SKA precursors and pathfinders. Systematic search in these images can result in a census of such sources that will throw light on the late stages of radio lobe evolution.
3.5 Revived cluster diffuse radio sources
Numerous examples of another class of sources have been discovered, with the availability of highly sensitive low-frequency radio telescopes such as LoFAR and uGMRT, in recent times. They are of ultra-steep spectrum (), mostly with high spectral age, with curved spectrum at high frequencies and are found anywhere inside the clusters. Usually, they are known as phoenices or AGN relics (van Weeren et al., 2019). As the classification suggests, this diffuse emission come from the revival or re-energization of fossil non-thermal electrons in clusters, due to the passage of a shock or turbulence. The hosts of these sources are often the jets present in the cluster associated with active galactic nuclei (AGN), in their radio inactive phase. The spectral age of these jets or lobes are tens of Myr (Enßlin, T. A. & Gopal-Krishna, 2001). The faded synchrotron emission (see sec. 3.4) from these sources are boosted by shock compression or gentle re-energisation or complex plasma interaction and appear bright in sub GHz radio band (Enßlin & Gopal-Krishna, 2001; de Gasperin et al., 2017a). These sources typically have ultra steep integrated spectrum with (Mandal et al., 2019), shows steepening and curvature at high frequencies (Slee et al., 2001) and irregular spectral index distribution (Mandal et al., 2020). They do not have specific location or shape based classification. The ultra steep nature makes them difficult to detect at GHz frequency, and thus these sources remain unexplored in detail. Though the low spatial resolution of the low-frequency sky surveys like TGSS, GLEAM, VLSS etc. makes it challenging to distinguish these sources from other diffuse structures, with the improvement of telescope facilities in recent times, several fossil sources have been discovered (de Gasperin et al., 2017a; Mandal et al., 2019, 2020; Duchesne et al., 2021, 2022; Brienza et al., 2022). Recent discoveries have helped in quantifying properties of these revived plasma sources and have significantly improved our understanding.
3.5.1 Radio Phoenix:
Although most of the diffuse radio sources from the peripheral regions of clusters have been traditionally classified as radio relics, some of these sources clearly have different physical origins, which led, (e.g. Kempner et al., 2004) to suggest a different scheming of naming them based on our understanding of their origin. The radio phoenix is a class of diffuse source (e.g. Enßlin & Gopal-Krishna, 2001) where a plasma bubble resulting from past AGN activity is compressed by a passing shock wave (possibly from a recent merger). This provides sufficient energy to re-energize the relativistic electrons and also enhances the magnetic field strength. This results into a low power steep-spectrum radio source, now classified as radio phoenix. Simulations (e.g. Enßlin & Brüggen, 2002) have been used to find likely candidates in radio observations. These sources can be both roundish (e.g., Abell 1664, Kale & Dwarakanath 2012, or elongated (e.g. Abell 2048, van Weeren et al. 2009; A3017, Pandge et al. 2021), both in rich clusters (e.g. Abell 85, Knowles et al. 2022; Rahaman et al. 2022) or poorer systems (e.g. IC1262, Pandge et al. 2019), and can be found in a range of cluster-centric radius, but closer to the core than in the case of the radio relics. Furthermore, unlike relics, radio phoenices are found in both merging and relaxed clusters.
3.5.2 Turbulence revived ultra-steep spectrum sources:
Turbulence, as well as a passing shock wave, can revive old fossil plasma in the ICM. The first case of this kind was observed in the cluster of galaxies Abell 1033, (de Gasperin et al., 2017a) where the tail of a WAT source gradually fades and then suddenly starts to brighten again. A spectral study of this source also shows the flattening of the spectrum in this part of the tail. A possible mechanism behind this source was proposed to be second-order Fermi acceleration by the turbulence generated by Rayleigh-Taylor and Kelvin-Helmholtz instabilities in the tail. Two other similar sources are found in ZwCl 0634.1+4750 (Cuciti et al., 2018) and Abell 1314 (Wilber et al., 2019). Because of very few known examples of these sources, very little is understood about them. Future large scale surveys may provide a decent sample to work with.
3.5.3 Buoyant radio bubbles:
The X-ray image of a handful of cool core clusters has shown cavities near the central Brightest Cluster Galaxy (BCG), often coincident with buoyantly rising radio bubbles from the central AGN (McNamara et al., 2000; Fabian et al., 2000; Clarke et al., 2005; Su et al., 2017). These buoyant radio bubbles interact with the ICM, inducing subsonic turbulence and offsetting the overall cooling of the gas. So far, no evidence of strong shock has been found near these bubbles (Churazov et al., 2013). Simulations have shown that the rise of the bubbles in the ICM undergoes Rayleigh-Taylor (RT), and Kelvin-Helmholtz instabilities, and their expansion is closely comparable to the mushroom clouds formed by massive explosions on earth (Saxton et al., 2001; Reynolds et al., 2005; Gardini, 2007). The instabilities are balanced by viscosity and magnetic field (Reynolds et al., 2005; Dong & Stone, 2009; Ogiya et al., 2018). The bubbles are less dense compared to the ambient medium, which gives rise to the buoyancy (Blanton, 2004). The gas displaced by the bubble is compressed in X-ray bright rings and remains in pressure equilibrium surrounding the bubbles (Churazov et al., 2002). Depending on their radio luminosity, they are classified as radio bright or radio-filled cavities (A2390, Savini et al. 2019), radio-dim or ghost cavities (Perseus Cluster Fabian et al. 2002); and intermediate cavities, where the radio emission partly fills the cavity (A4059, Heinz et al. 2002). The short radiative lifetime of the cosmic ray electrons (only tens of Myr) makes it challenging to explore these sources in GHz frequency. Low-frequency radio observations with uGMRT, LOFAR can probe the radio emission from the old particle population of the AGN outflows in ghost and intermediate cavities. (Russell et al., 2019; Bîrzan et al., 2020; Biava et al., 2021; Brienza et al., 2021). Deep radio observations of these sources are needed to establish radio x-ray correlations which would help in understanding the bubble dynamics, the role of the magnetic field and also the feedback mechanism better.
As we are approaching more and more towards lower frequency radio study with telescopes like uGMRT, LOFAR, MWA, SKA-low (in future), many more details about these fossil sources are to be unveiled in coming years which would improve our understanding of these sources significantly.
3.6 Magnetic fields in clusters from polarization studies
Besides gravity, magnetic fields are also believed to play an important role in the evolution of the ICM. A host of X-ray and radio continuum observations have revealed their physical properties, such as, temperature, extent, presence of low Mach number shocks, and possible sites of particle acceleration (Ensslin et al., 1998b; Feretti et al., 2012; van Weeren et al., 2019).
A clear understanding of the structural nature and the coherence scale of magnetic fields in cluster halos is currently inadequate, and it is thus important to gather knowledge on the factors that drive turbulence in the ICM, and subsequently to understand how they distribute and accelerate relativistic plasma, contribute to pressure balance, and affect the gas content in galaxies (e.g., Donnert et al., 2009; Vazza et al., 2021b). Much of our knowledge of the cluster magnetic fields comes from the diffuse synchrotron emission from cosmic ray electrons. This emission is expected to be partially linearly polarized (e.g., Govoni et al., 2013; Sur et al., 2021), and its measurement is capable of providing insights into the properties of the magnetic field structure in the ICM.
Magnetic fields in the ICM have been mostly studied via analysis of the Faraday rotation measure (RM) of polarized radio sources lying in the background or embedded within the magnetized ICM (Kronberg, 1994; Clarke et al., 2001; Murgia et al., 2004; Rudnick & Blundell, 2004; Bonafede et al., 2010; Böhringer et al., 2016), the so-called RM-grid. These studies show that the dispersion of RM () decreases substantially as a function of impact distance from the cluster centre, where towards the centre to at distances from the centre. By comparing these results with numerical models, which assume Gaussian random distribution of magnetic fields in clusters, evidence for -level fields that are ordered on scales of several in the ICM have been found.
RM-grid-type studies are faced with a few challenges. Firstly, it is difficult to disentangle the RM contributed by the ICM from that of the RM intrinsic to the background sources. This might affect the inferred , and thereby an accurate understanding, of the magnetic field structures in the ICM (Locatelli et al., 2018). Secondly, RM-grids are severely limited to only a few, , background polarized sources per cluster (Bonafede et al., 2010), which makes constructing a 2-D RM-map arduous. Due to the limited number of Faraday RM measured towards background polarized sources of a cluster halo, the magnetic field along the line of sight in the ICM is discretely sampled and, therefore, background RM data from several clusters are statistically investigated (e.g., Böhringer et al., 2016). Thirdly, while the assumption of a Gaussian random magnetic field distribution allows for the power spectrum of the field to be expressed as a simple power-law and subsequently apply to the observed RM data (Clarke et al., 2001; Murgia et al., 2004; Bonafede et al., 2010), this assumption is in complete contrast to the intermittent nature and non-Gaussian distribution exhibited by the field components generated by fluctuation dynamos in the ICM (Seta et al., 2020; Sur et al., 2021). Thus, a meaningful comparison between numerical predictions and observations of RM is limited by assumptions made about the structure of magnetic fields in the cluster halo. This situation is unlikely to drastically improve, even with the advent of new and sensitive radio telescopes. For a proper quantification of the strength and structure of magnetic fields in the ICM, it is imperative to take into account the other two complementary observables that trace magnetic field structures — synchrotron emission and its polarization.
Despite years of work, polarized synchrotron emission from the radio halos is yet to be convincingly detected. For a confident detection of polarized emission from the diffuse ICM, the main problems are due to low surface brightness, strong Faraday depolarization, steep radio continuum spectra of the ICM, and confusion from polarized relic emission seen in projection. Based on cosmological magnetohydrodynamic (MHD) simulations, Govoni et al. (2013) expect that luminous halos may show a polarized flux density of 0.5–2 Jy at 1.4 GHz when observed with 3 arcsec angular resolution, corresponding to a surface brightness of only 50–200 . Due to the large Faraday dispersion expected in the ICM, Böhringer et al. (2016) found that the presence of a cluster medium increases by about 60 rad m-2, and therefore, polarized halo emission is expected to be severely depolarized at 1.4 GHz. Going to higher frequencies () to reduce Faraday depolarization is also challenging, as the surface brightness of the synchrotron emission is further reduced due to the steep radio continuum spectrum () of the ICM emission. Furthermore, since radio relics show substantial polarized emission near 1 GHz (van Weeren et al., 2010b; Wittor et al., 2019; Dominguez-Fernandez et al., 2021), even when observations are performed at relatively poor angular resolutions with single-dish telescopes (Kierdorf et al., 2017), the tentative polarized emission that have been reported for only three clusters, namely, for Abell 2255 (Govoni et al., 2005), MACS 0717.5+3745 (Bonafede et al., 2009b), and Abell 523 (Girardi et al., 2016) are likely to be related to relics rather than the halo (Pizzo et al., 2011; Rajpurohit et al., 2021a). Hence, in order to identify an efficient observing strategy, it is necessary to investigate the properties of the polarized emission using various types of MHD simulations.
3.7 High frequency radio observations
The Sunyaev-Zeldovich effect produces distortions in the CMB spectrum through inverse Compton scattering of CMB photons off the energetic electrons present in and around cosmic structures, most notably galaxy clusters (Birkinshaw, 1999). The SZe is proportional to the pressure (or energy density) of the electron population, and systematically shifts the CMB photons from the Rayleigh-Jeans to the Wien side of the spectrum. The SZe due to the thermal population of electrons such as in the ICM are well characterized through detections in directions of several galaxy clusters (Birkinshaw, 1999). It is now well-known that the ICM does not comprise entirely of thermal plasma, but contains relativistic electrons and protons. Thus, the distortions to the CMB spectrum caused by all the populations of electrons (thermal and non-thermal) need to be accounted for. The generalized expression for the SZe including combinations of electron populations has been derived by Colafrancesco et al. (2003).
The Bullet Cluster is one of the most spectacular and well-known examples of an energetic cluster merger. It hosts a powerful radio halo in the central region (Malu et al., 2016). The 5.5 GHz and 9 GHz detection of diffuse emission from the Bullet cluster has been performed with the ATCA. Due to limited short spacing, the images may suffer from missing flux from the diffuse emission. Similar high frequency work has been reported for Sausage Cluster at 16 GHz (Stroe et al., 2014a).
Spectra of radio halos and relics are crucial for constraining models proposed to explain the emission. The spectra are expected to have one or more breaks, where the spectrum is expected to steepen. In addition to these breaks, basic parameters that characterize the energy distribution of the electrons in the atmospheres of the galaxy cluster are the high- and low–energy cut-offs in the spectra of diffuse emission, which consists of non-thermal populations of electrons. For characterizing the high-energy cut-offs, high-frequency observations of diffuse emission in clusters are clearly needed. Only two relics have been imaged in the frequency range 0.15– 30 GHz using a number of radio telescopes (Stroe et al., 2016).
The energetics of non-thermal emission depends critically on the minimum energy to which the power-law distribution of relativistic particles is accelerated (Blundell et al., 2006). This low-energy / low-frequency cut-off can be found in two ways, through observations of inverse Compton scattering (ICS) – through the ICS emission in X-ray, or through the SZ Effect (Basu et al., 2016b; Basu et al., 2016a). For non-thermal populations of electrons – as in radio relics – a detection of the SZ effect amounts to the most direct characterization of this low-energy cut-off. This has been confirmed for relativistic electrons in a radio galaxy jet, for the first time, by Malu et al. (2017), through their cm-wave observations. The SZ effect has also been recently used to detect warm-hot intergalactic matter (WHIM, de Graaff et al. (2019)) through stacking. The characterization of WHIM and low-energy cut-offs through the SZ effect makes a compelling case for high-frequency ( GHz) observations of galaxy clusters – the two physical phenomena are promising techniques for probing the intergalactic/intracluster medium through the SZ effect. These are also relevant for SKA1-mid high bands up to 14 GHz. It is critical that SKA1-mid to retain sub-bands up to and above 14 GHz, which will aid to these high-frequency studies of galaxy clusters.
4 Radio emission from poor clusters and groups
Structure formation in the Universe is expected to be self-similar on scales of supercluster filaments down to smaller systems of galaxies (e.g. Kaiser, 1986; Morandi & Sun, 2016). However, the lower-mass end of these systems (i.e. poor clusters and groups) have not been observed in as much detail as the richer systems, mostly because of the challenges in the observations (e.g. limitations in sensitivity) at various parts of the spectrum necessary for such studies using existing facilities. Earlier studies expressed the expectation that such self-similar properties would be true even for X-ray and non-thermal radio emission (Vikhlinin et al., 2006; Cassano et al., 2013). The emerging scenario from deeper observations and simulations indicates that such self-similarity might be broken in energy and mass scaling in lower-mass systems (Paul et al., 2017; John et al., 2019; Lovisari et al., 2021, and references therein).
Low-mass clusters and groups are unstable to small mergers, owing to their shallow gravitational potential and are strongly affected by various non-gravitational processes (Lovisari et al., 2015). The content of cosmic rays in these systems is high, likely due to the influence of greater AGN feedback activity (Gilmour et al., 2009; Li et al., 2019). Simulations on the evolution of turbulence and cosmic rays in low-mass objects show that these significantly deviate from the self-similar scaling found in richer clusters, having flatter slopes and higher fluctuations, indicating better visibility of a fraction of them through their non-thermal properties (Paul et al., 2017; John et al., 2019), such as the radio halo emissions (Paul et al., 2018). This may also result in a systematic departure of these sources from the expected scaling relations. Furthermore, the low-mass clusters are usually cooler than the massive ones, the Mach number of a fraction of the merger shocks is expected to be noticeably higher inside the low-mass clusters (Sarazin, 2002). This is because, unlike the thermal evolution, merger shock velocity does not directly depend on the mass of the host cluster. However, to examine these observationally, we should have enough data at the lower mass end, currently, which is largely missing in the available literature (see Fig. 4 and §4.1).
4.1 Observations of low-mass clusters and groups
The environment of poor clusters and groups, dotted on the cosmic web, is the dominant location for the early evolution of galaxies, in contrast to the better-studied rich clusters, which contain only a few percent of galaxies (e.g. Freeland & Wilcots, 2011). Galaxy groups are the dominant reservoir of baryons in the Universe, but their shallow gravitational potential is vulnerable to tidal disturbances, galaxy interactions and mergers. Arguably, it is these low-mass systems that hold the key to the understanding of key processes of heating (feedback due to star formation or AGN activity) and cooling, the mechanisms and timescales of energy injection, and the effects of the galaxy and group evolution on the development of the hot intergalactic medium.
For this, the basic observations are a combination of deep X-ray observations of the hot intergalactic medium and the radio observations of the synchrotron-emitting plasma associated with AGN activity and star formation. Coupled with these, observations of molecular and atomic gas and dust yield crucial information.
Deep X-ray observations from Chandra and XMM-Newton are being obtained for a wide range of system masses ( to a few times ) (Popesso et al., 2004; Hofmann et al., 2017), of which groups are generally referred to as systems with (Paul et al., 2017), and poor clusters (). For decades, VLA L-band and C-band observations revealed radio sources in central galaxies in low-mass systems (e.g. Burns et al., 1987) The fact that diffuse radio emission was rarely detected in early shallow observations at L-band in such systems led to lack of information about activity of most nuclei in the central galaxies of low-mass systems. As AGN feedback began to emerge as the dominant source of heating in the intracluster gas in rich cluster, there were doubts about the nature of the extra heating in the cores of clusters. However, deeper observations, particularly at lower frequencies initially with the GMRT, have revealed the presence of these sources in poor clusters such as AWM4 (O’Sullivan et al., 2011a), and groups such as HCG 62 (Gitti et al., 2010), NGC 5044 (David et al., 2009), NGC 1407 (Giacintucci et al., 2012), NGC 741 (Schellenberger et al., 2017) and many others (Giacintucci et al., 2011; O’Sullivan et al., 2011b). In addition, as the relativistic plasma from these AGN become older, they lose energy and predominantly radiate at lower frequencies, thus being more prominent in low-frequency observations. Well-defined samples of galaxy groups need to be constructed for multi-wavelength observations in order to understand the systematics- the optically selected CLoGS study (Kolokythas et al., 2022) or the X-ray selected XXL sample (Šlaus et al., 2020) are positive steps in this direction.
The unprecedented sensitivity of LOFAR (Jy at 144 MHz) and uGMRT (Jy at band 3) has, however, revolutionized the study of diffuse emission in low-mass systems as observed through individual studies (Hoang et al., 2019; Knowles et al., 2019; Botteon et al., 2019; Paul et al., 2020) as well as in a handful of systematic explorations (Paul et al., 2021; van Weeren et al., 2021; Botteon et al., 2022).
Although less numerous, low mass clusters are now detected with almost all types of diffuse radio sources, even the ultra-steep sources (Mandal et al., 2020). Particularly, the detection fraction of relics is more in low-mass systems than in high mass systems (e.g. de Gasperin et al., 2014, 2017b; Kale et al., 2017; Dwarakanath et al., 2018). Almost 31% of all diffuse emissions from low-mass systems are cluster-radio shocks (relics) compared to only 21% in high mass systems, as observed by Botteon et al. (2022) in their large sample of 146 clusters with mass and 135 high mass systems from the Planck cluster list. So far, the lowest mass galaxy cluster known to host radio relics is Abell 168 (Dwarakanath et al., 2018) with a mass ). From the correlations of radio halo power vs halo size and radio halo power vs mass (Cassano et al., 2007; Feretti et al., 2012; Cassano et al., 2013; Cuciti et al., 2021a), it can be inferred that radio halos detected in poor clusters are usually smaller in extent. However, a rare giant halo of size kpc has been detected by Botteon et al. (2021) in one of the lowest mass () clusters PSZ2G145.92-12.53 using the LoFAR. It is also known to be the lowest power radio halo detected so far. Since low mass galaxy clusters are mostly dominated by the AGN activities, the dying component such as AGN relics with ultra-steep spectrum nature have been detected in some of them (e.g. Brüggen et al., 2018; Mandal et al., 2020). (Nikiel-Wroczyński et al., 2019) even reported the detection of diffuse emission from the intergalactic medium in compact galaxy groups. With these discoveries, researchers have demonstrated that low-frequency telescopes like uGMRT and LoFAR have huge potential to detect diffuse cluster radio sources, even in low-mass to group scales.
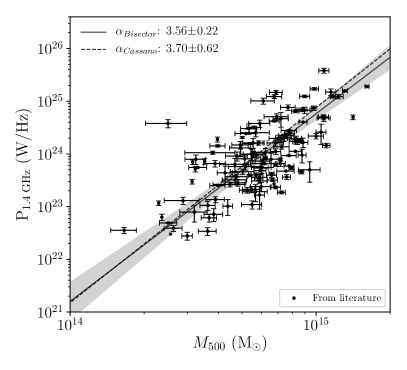
The existing radio halo power mass correlation () shows a steep spectrum (slope ) and bi-modal distribution in Radio power–X-ray () plane (Cassano et al., 2013), predominantly with the massive objects. With the previous (for a review van Weeren et al., 2019, and references therein) and more recent observations (Paul et al., 2021; Cuciti et al., 2021a; Botteon et al., 2022; Hoang et al., 2022) available in literature that revealed a sizable number of new radio halos and relics, some even in low-mass clusters (Paul et al., 2021; Botteon et al., 2022; Hoang et al., 2022), we re-plot and estimate the correlation for . Since, the diffuse emission from many of the galaxy clusters have been observed in different radio frequency bands, to be consistent with the estimates reported in literature, the halo radio power is scaled to 1.4 GHz, assuming the spectral index of (unless the spectral index is available in literature). The updated correlation plot is shown in Fig. 4. The BCES bisector slope for ( = 3.56 0.22) by and large follow the Cassano et al. (2013) correlation ( = 3.70 0.56). However, the slight flattening of the slope, and a lack of data points below the mass M⊙, motivates for more systematic and dedicated studies at the lower mass end.
5 Superclusters and the filamentary cosmic web
Superclusters of galaxies consist of galaxy clusters with linear or sheet-like inter-cluster filaments, corresponding to the denser crossroads of the cosmic web (e.g. Cautun et al., 2014) with groups of galaxies embedded in them. These are the most extensive and massive systems ( 1016 ) in the Universe that have decoupled from Universal expansion and are collapsing, significant parts of them being gravitationally bound. Cosmological n-body simulations and observations both support that strong concentrations of matter appear to be interconnected by vast, low-density filaments surrounded by volumes that are devoid of galaxies, which are identified as voids.
5.1 Superclusters of galaxies
In redshift surveys of galaxies and clusters, several well-known large-scale structures, that can be called superclusters according to the description above, have been identified. These include the Corona Borealis Supercluster (Postman et al., 1988), the Coma Supercluster (de Lapparent et al., 1988; Mahajan et al., 2011), Hydra-Centaurus Supercluster (da Costa et al., 1986), Pisces-Cetus Supercluster (Porter & Raychaudhury, 2005), Hercules Supercluster (Tarenghi et al., 1979), Shapley Supercluster (Raychaudhury, 1989; Day et al., 1991; Raychaudhury et al., 1991) Saraswati Supercluster (Bagchi et al., 2017), and our very own Laniakea Supercluster(Tully et al., 2014), of which the Local group is a part, and many others that have been catalogued (e.g. Bahcall & Soneira, 1984; Tempel et al., 2014; Liivamägi et al., 2012). Observations of superclusters are very important as they provide crucial information about the early evolution of structures in the Universe, and the formation and early evolution of galaxies, which spend most of their lives in this environment.
One of the important aspects of studying such filamentary superclusters is to trace the large scale shocks that pass through the intra-cluster medium (ICM) (or intergalactic medium, IGM), and their effect on the formation of the complex cosmic web (Miniati et al., 2000; Ryu et al., 2003; Pfrommer et al., 2006). Numerical simulations reveal different kinds of shocks, which control the overall evolution of large scale structure. These mainly belong to two categories: ‘internal’ and ‘external’ shocks. The former (internal or merger shocks) affect the material that is already heated to approximately the cluster temperature ( 107 K) and may be responsible for generating cluster scale ( 1 Mpc) diffuse radio sources in the form of halos and relics (mostly in massive clusters). The latter kind (external or accretion shocks) is responsible for heating the cold gas surrounding the cluster out to the virial radius, and may be associated with infall of matter along the filamentary web surrounding the cluster (Hoeft & Brüggen, 2007; Paul et al., 2011).
The merger shocks have a low Mach number ( 2–3), while accretion shocks have a high Mach number ( 10–102). Such infall velocities are high enough that the infalling material can be accelerated to total energies of 1018-1019 eV while accreting onto collapsing structures. In the presence of even a weak magnetic field ( nG) where the energy density of the magnetic field accounts for only of the total post-shock energy density, it is possible to detect the radio synchrotron emission that couples with accretion shock (Wilcots, 2004). Thus, sensitive and high-resolution radio observations of superclusters can be useful to probe the underlying distribution of cosmic rays and magnetic fields (Vernstrom et al., 2017; Miniati et al., 2000).
Simulations (Vazza et al., 2015; Araya-Melo et al., 2012) predict that it is possible to detect extended diffuse radio sources associated with filaments if the shocks accelerate the electrons sufficiently (Keshet et al., 2004). Vacca et al. (2018) have already detected, using the Sardinia Radio Telescope at L-band, a new population of faint and diffuse 28 candidate radio sources associated with a large scale filament. They have identified nine massive clusters ( 0.1) surrounding filaments in their survey area, which covers 8∘ 8∘. The sizes of these radio sources vary from 0.3 to 8.6 Mpc. The mean radio power and mean X-ray luminosity of these new radio sources are times lower than those of diffuse radio emissions normally associated with clusters. Moreover, superclusters are promising targets to attempt the detection of the very challenging warm-hot intergalactic medium (WHIM) in radio bands which shed light on shock heated collapsing diffuse intergalactic medium (IGM) in filaments (Tripp et al., 2000; Cen & Ostriker, 1999). In order to accurately map the “Cosmic web” after subtracting the confused foreground or background compact radio sources, we need high surface brightness sensitivity ( Jy arcsec-2) and sub-arcsec resolution of the SKA.
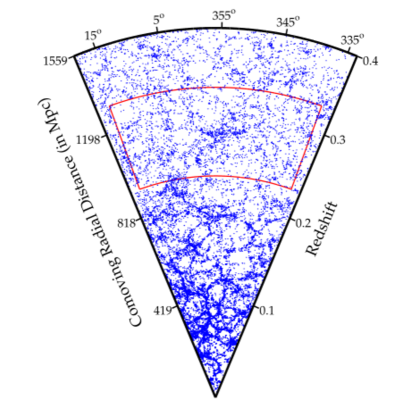
As a part of the radio observations of a supercluster with future generation radio telescopes, we are studying one of the extensive superclusters Saraswati with MeerKAT and uGMRT. The Saraswati supercluster was identified in the stripe 82 SDSS region, at redshift 0.3 (Bagchi et al., 2017). The total mass and size of this supercluster are and Mpc, respectively, making it one of the largest observed structures in the Universe. Figure 5 shows how SDSS galaxies are distributed in the Saraswati supercluster in a redshift cone plot (taken from Bagchi et al. (2017)). As seen in this plot, the Saraswati supercluster is situated (red box) within 336∘ Ra 16∘, -1.25∘ Dec 1.25∘ in the 270 degree2 equatorial Stripe 82 region. In sensitive MeerKAT L-band pilot radio observations of the Saraswati supercluster (Parekh et al., 2022), our primary aim is to detect faint and diffuse radio sources associated with filaments and study their properties.
5.2 Radio ridges in interacting clusters
Apart from radio halos and relics, as described above, due to the filamentary nature of the cosmic web, large-scale diffuse radio sources are also detected beyond the main extent of galaxy clusters, at the outskirts where the electron density is very low as compared to the cluster core. These rare, steep spectra and low-surface brightness radio sources could be well detected with low-frequency radio observations. Such “radio ridges” have now been detected in only a few systems, as filaments between pairs of merging clusters (Botteon et al., 2018; Govoni et al., 2019; Botteon et al., 2020a; Venturi et al., 2022).
The first low surface brightness radio ridge of this kind was found in the Coma supercluster, connecting the central halo and the outer relic (Kim et al., 1989). The corresponding X-ray observation (of the Coma cluster) suggests the moderate correlation between X-ray and radio brightness of the Coma bridge. Also, The effect of the flow of the cold diffuse gas down the filaments connecting the clusters in the supercluster can be seen in the star formation properties of galaxies in the Coma and A1367 clusters(e.g. Seth & Raychaudhury, 2020). This further indicates that the X-ray and radio emission is generated from the same volume and there is no projection effect.
Among the most notable discoveries in this genre is the spectacular 5 Mpc size radio ridge connecting the two massive clusters A399 and A401 (Govoni et al., 2019), discovered with the Low-Frequency Array (LOFAR) (van Haarlem et al., 2013) at 144 MHz frequency. Previously, X-ray observations of the A399-A401 galaxy cluster have revealed a hot (6-7 keV) X-ray filament between the pair Fujita et al. (2008). Moreover, (Murgia et al., 2010) detected radio halos with each of the clusters at their centre.
The detailed morphology of the cosmic web shows rich large-scale structures of interconnecting filaments with clusters and groups embedded in them, and the interaction of warm and cold gas on these filaments is likely to have a profound influence on the regulation of star formation in the early life of galaxies (e.g. Pimbblet et al., 2004; Mahajan et al., 2012). In the core of the Shapley Supercluster, Breen et al. (1994) had pointed out a chain of four merging clusters (the central cluster A3558, group SC1327-312, group SC1329-313 and A3562, from Einstein and ROSAT observations. Recently Venturi et al. (2022), using high sensitive MeerKAT L-band data, reported the first GHz detection of inter-cluster diffuse emission (1 Mpc scale) joining A3562 cluster and group SC1329-313 along this filament. This bridge had not been detected in previous radio observations, only being detected in the deep MeerKAT data. This certainly points to further possibilities of direct discovery in supercluster filaments along the cosmic web filaments. Another spectacular example is that of ZwCl 2341.1+0000, a complex merging structure of galaxies located at , where a system of three merging clusters along with radio and X-ray emitting ridges are found, along with post-merger relics, as the heart of the Saraswati Supercluster (Bagchi et al., 2002; van Weeren et al., 2009).
The origin of radio synchrotron emission from these radio ridges is not well understood. The radiating timescale of electrons at 140 MHz is short, and they can travel only a distance Mpc in their lifetime. On the other hand, the sizes of radio ridges are Mpc, which suggests in situ particle re-acceleration mechanism required for the radio ridge emission. Simulations have revealed a dynamically complex structure of radio ridge in which a shock acceleration mechanism, due to a cluster merger, is not the main source of the observed radio emission (Govoni et al., 2019), as is the case with radio relics. It is rather a turbulence in the inter-cluster bridge, caused by complex substructures embedded between galaxy clusters. This turbulence produces weak shocks () that cause re-acceleration of the pre-existing fossil electrons of energies ( GeV), which interact with the (nG) magnetic fields and generate radio emission. Brunetti & Vazza (2020) have predicted that the Fermi(II) re-acceleration mechanism is most favoured under these physical conditions and gives rise to long dynamical time scales of radiating electrons in the bridges connecting clusters. Observing this type of radio object is a major challenge due to its truly diffuse nature on such large spatial scales. We are interested to observe X-ray selected binary merging clusters (which also have hot X-ray filaments) with new radio telescopes such as MeerKAT and uGMRT to detect the radio ridges and probe their properties (Parekh et al., 2017b, 2019; Parekh et al., 2020).
6 Theoretical models and efforts on simulating cluster radio emissions and magnetic fields
The diffuse radio emissions found in the cluster medium are theoretically understood to be generated due to synchrotron radiation from GeV electrons in a magnetized medium (Giovannini & Feretti (2000) and for review Ferrari et al. (2008); Brunetti & Jones (2014), and references therein). Therefore, the detection of these diffuse radio structures in clusters provides indirect evidence for the non-thermal component of cosmic rays as well as the magnetic field in the ICM (e.g., Large et al. (1959); Willson (1970)). Cosmic rays are usually the charged particles re/accelerated due to the merger driven shocks and the turbulent flows in the intracluster medium (ICM). The particle (re-)acceleration supposedly happens either from the ICM thermal pool, pre-existing electrons or the radio quite AGN lobes through two well-known processes, namely Fermi acceleration of orders one and two. Although the entire processes are difficult to unfold directly from observations, in recent decades, the cosmological simulations of clusters of galaxy formation are a leap forward in understanding the processes quantitatively.
6.1 Diffusive shock acceleration (Fermi-I)
The diffuse radio emission at the periphery of the galaxy cluster has a morphology similar to the shock fronts in cluster simulations, (Ryu et al., 2003; Skillman et al., 2008; Vazza et al., 2009a; Paul et al., 2011; Skillman et al., 2011) which closely correlate the radio relics to the merger shocks. At the shock fronts, a small fraction of thermal electrons gets accelerated to relativistic energies, known as the diffusive shock acceleration mechanism (DSA), which in turn emits synchrotron radiation. In the DSA process, the charged particles temporarily get trapped inside the shock region and gain energy each time they reflect back to the upstream (pre-shocked) region across the shock (Drury, 1983; Blandford & Eichler, 1987; Jones & Ellison, 1991; Malkov & Drury, 2001). The magnetic field perturbations induced by plasma effects in shock-medium, accelerate the electrons by reflecting back to the upstream, this process is also known as the first-order Fermi mechanism. These accelerated electrons in the presence of compressed magnetic fields emit synchrotron radio emissions along the shock surface and its downstream, which can successfully explain the elongated diffuse radio structures at clusters scales, known as the radio relics (as discussed above). According to Drury (1983) and (Blandford & Eichler, 1987), for a planar steady shock, the electrons that are accelerated (via Fermi first-order process) by the shock of Mach number form a power-law distribution in momentum space;
| (1) |
With this, the radio synchrotron spectrum due to these accelerated electrons follow the power-law , with spectral index;
| (2) |
while the volume integrated radio spectrum becomes , where (Ensslin et al., 1998a; Kang, 2011). The observed radio spectral index at the shock surface is often compared with the theoretical spectral index to infer the Mach number of the shocks.
The particle acceleration efficiency is constrained to the particle acceleration from the thermal pool. Recent studies by Botteon et al. (2016); Eckert et al. (2016); Hoang et al. (2017) indicate that the particle acceleration from the thermal pool requires the large acceleration efficiencies to produce the total radio luminosity of the radio relic. Again, Botteon et al. (2020b) in his study, tested the scenario with ten well-studied radio relics where shocks were observed in X-rays as well. They calculate the electron acceleration efficiency of these shocks if injected from the thermal pool, to reproduce their observed radio luminosity. And report that the standard DSA model cannot explain the origin of the relics if efficiency is smaller than , as constrained by the studies of SN-driven shocks in galaxies. Whereas, SN-driven shocks are very strong with a high Mach number () and are also found in a low beta-plasma ( = gas pressure/ magnetic pressure). In contrast, the shocks in ICM are much weaker where ICM plasma has high beta (Kang et al., 2014).
6.2 Shock detection in cosmological simulations
Cosmological simulations are essential to closely study shocks resulting from cluster mergers. Identifying shock structures in simulations is crucial but significant to understanding the kinetic energy flux mediation through shocks in the ICM. A fraction of the shock kinetic energy thermalizes the ICM, and helps in achieving the virialization state. The remaining energy results in the production of cosmic-ray particles (protons or electrons) through the first-order Fermi mechanism.
In the literature, there are a few grid-based methods (Miniati et al., 2000; Ryu et al., 2003; Skillman et al., 2008; Vazza et al., 2009a; Vazza et al., 2012a) and in SPH code (Pfrommer et al., 2006; Hoeft et al., 2008) that identify the shocks and its magnitude, i.e, the associated Mach number, using the Rankine-Hugoniot jumps conditions across the shocks. Miniati et al. (2000) Ryu et al. (2003) attempt to identify the shock in the ‘single-grid’ codes and estimate the shock Mach number using temperature jump condition. They marked the shocks as, ’accretion shocks’, where for the first time the photo-ionized gas is shock-heated and ’merger shocks’, where the pre-shock gas has previous shock encounter(s). In addition, Ryu et al. (2003) accounts for the floor temperature of intra-galactic medium (IGM), i.e. the minimum gas temperature, K, created by the re-ionization of stars. This prevents us from over-estimation of the accretion shock strength in adiabatic simulations. The obliquity of the shock, multiple shock cells, and directional dependence in the shock cells are the significant issue to address. Ryu et al. (2003) adopts the co-ordinate split approach to estimate the shock Mach number, whereas Skillman et al. (2008) determine the shock strength in the direction of shock propagation. Skillman et al. (2008) made the first attempt to study the shock in adaptive mesh refinement grid-based code where the former attempts are on uni-grid-simulations, and report that the previous methods (Ryu et al., 2003) overestimate the number of low Mach number shocks by a factor of due to the misconception about the direction of shock propagation. Later, Vazza et al. (2009a) compute the shock strength using the velocity jump criterion which is very well consistent with the temperature jump criterion, except, the velocity jump method is more reliable at the outskirts of galaxy clusters or low-density environment in estimating the Mach number. All above-discussed shock detection schemes identify the shock and its strength as a post-process, which may cause uncertainties in the characterization of shocks since they consider the ideal conditions across the non-shocked-cells, i.e., no velocity and no temperature gradients, which already exist in a complex cosmological flow (in velocity and temperature fields) wherein the thermodynamic gradients due to shock are superimposed (Vazza et al., 2009a). It demands the run-time shock detection to overcome the uncertainties, Vazza et al. (2012a) attempt to hastily identify the shock, in a grid-based adaptive-mesh refinement (AMR) simulation code (ENZO), moreover, introduce a method to increase the level of refinement at the locations of shock fronts. Where, the AMR criterion based on one-dimensional velocity jump is added to the usual AMR criteria as adopted for gas and dark matter over-density in O’Shea et al. (2004). Additionally, in (Vazza et al., 2012a) the total shock strength is estimated by the pressure jump conditions which account for the feedback from cosmic-ray flux at the shock fronts. Even hydrodynamical cosmological simulation basically describe the merger shocks, achieving sufficient numerical resolution, and locating the shock fronts and their strength is still a challenge.
6.3 DSA in cosmological simulations
In the last decade, many attempts were made to estimate the synchrotron radio emission from the shock waves (Hoeft & Brüggen, 2007; Skillman et al., 2011; Hoeft et al., 2011; Nuza et al., 2012, 2017; Paul et al., 2018; Wittor et al., 2019; Brüggen & Vazza, 2020; Paul et al., 2020; Wittor et al., 2021b, a). The widely used semi-analytical solution to compute the total monochromatic radio power at frequency from a shock wave of area , having electron efficiency , with the downstream temperature , the downstream electron density , and magnetic field strength , have been derived by (Hoeft & Brüggen, 2007) as,
| (3) |
where is the magnetic field corresponding to the energy density of CMB. Eq. 3 enables one to implement it as a post-process to estimate the radio power in any cosmological/galaxy cluster simulation (e.g. Fig. 6). The underlying assumptions to derive this relation is that the electrons (i.e., with minimum momentum, say ) from the thermal pool, having Maxwellian distribution, get accelerated by the shock to a power-law distribution which is closely related to the Mach number of the shock (DSA theory). These accelerated electrons emit in radio through synchrotron process in a magnetized medium.
If one performs magneto-hydrodynamic simulations, the magnetic field strength as direction is the associative property of the cell in grid simulations (e.g. ENZO), else the approach will be to govern the magnetic field strength using semi-analytical methods (e.g Roettiger et al., 1999). The magnetic field strength is related to the baryonic matter density, i.e., modelling magnetic field strength with density (Bonafede et al., 2009a; Skillman et al., 2011) and modelling the magnetic field density with the turbulence energy density of the medium (e.g. Subramanian et al., 2006; Beresnyak & Miniati, 2016; Paul et al., 2018). Paul et al. (2018) demonstrate that the magnetic field in the ICM using magnetic energy density’s sub-equipartition with turbulence energy density successfully explains the cluster scale magnetic field. They compare the magnetic field radial profile of the simulated coma-cluster like environment, which is in good agreement with the radial profile studied using the Faraday rotation measure (RM) (Bonafede et al., 2009a).
Still, the DSA mechanism is poorly understood. The bottleneck is the minimum momentum required for the thermal electron to accelerate it to relativistic, non-thermal distribution and the efficiency of the shock to accelerate the sufficient charge particles for radio emission.
There are some more puzzles yet to address in DSA. If every shock can produce relativistic electrons from the thermal pool, then correspond to the shocks for every merging cluster there should be the associated radio relics. However, only a few per cent of merging clusters host the radio relics (Feretti et al., 2012). Furthermore, not all X-ray detected shocks show the signature of diffuse radio relics. Moreover, in some relic structures, the strength of the X-ray Mach number computed from the density/temperature jump does not agree with the radio-Mach number estimated from the radio spectral index. In order to address these puzzles, several authors (Kang & Ryu, 2011; Kang, 2012; Pinzke et al., 2013; Kang & Ryu, 2016) proposed the re-acceleration model in which the seed electrons are not from the thermal pool, instead they are considered to be pre-existed in the ICM as fossil electrons as the leftover of radio jets or lobes of the radio-quiet AGN. These radio-quiet electrons may be reborn as radio phoenix if re-accelerated by the merger shocks (also known as the adiabatic compression process) (Enßlin & Gopal-Krishna, 2001). The re-acceleration model is quite consistent with the observed radio relics where the X-ray Mach number shows a discrepancy with radio spectra-derived Mach number (e.g. Toothbrush radio relic,(Kang & Ryu, 2016). This confirms the strong connection between the fossil electrons from AGN and shock acceleration in ICM, provided the cluster must host an AGN (radio-quiet?) like in the case of Toothbrush radio relic (van Weeren et al., 2016).
6.4 Turbulence Re-acceleration Mechanism
Mergers of two or more galaxy clusters and motion of sub-halo(s) in cluster/halo deeply stir the ICM, i.e., from core sloshing and shear instabilities. The signatures of the ICM turbulence are largely observed in many numerical simulations (Maier et al., 2009; Schmidt et al., 2009; Ryu et al., 2010; Iapichino et al., 2010; Paul et al., 2011; Iapichino, 2011; Vazza et al., 2011; Vazza et al., 2012b; Vazza et al., 2017; Federrath et al., 2021) of galaxy clusters. Although there are a few attempts of quantifying the turbulence in merging clusters using X-ray observations (e.g. Roncarelli et al., 2018). The turbulence motion in clusters of galaxies is defined by its scale, which is almost comparable to the size of cluster cores. Although turbulence in the ICM is majorly sub-sonic, but is sufficient to translate to magneto-hydrodynamic (MHD) turbulences well below the scale at which the Alfvén-velocity equals the turbulent velocity. Studies indicate that these turbulent motions are super-Alfvénic, with Alfvénic Mach number, (Brunetti & Lazarian, 2007). For the assumed ICM conditions, i.e., , cm, K, and , in the schematic diagram of the turbulence energy over wavenumber (Fig. 7) the transition region (dark grey) from hydro to magneto-hydro turbulence has been shown (Donnert & Brunetti, 2014).
In addition, the plasma instabilities in the ICM results in various kind of wave, i.e., slow-mode, fast-mode, Alfvén-mode, and a few self-excited modes– slab and whistler. These modes are widely explored as the particle (re)-acceleration mechanisms to explain the radio halo-like emission. The term (re)-acceleration by the plasma driven turbulence is coined here because, the acceleration of charged particles to relativistic energies, directly from the ICM thermal pool, is quite inefficient, rather re-acceleration of pre-existing high energy particles is more efficient. In these stochastic re-acceleration processes, the particles drain energy from plasma turbulence due to resonant interaction with the MHD waves (excited due to plasma instabilities).
In the last few decades, the Alfvén-mode and fast-mode are widely explored for understanding particle acceleration. In incompressible turbulence, below the Alfvén scale, the acceleration is driven by the Alfvén-mode via gyro-resonance (Yan & Lazarian, 2002; Fujita et al., 2003; Brunetti et al., 2004). It efficiently re-accelerated the relativistic protons and the relativistic electrons, but the acceleration of charged particles, directly from the thermal pool, is possible only for the thermal protons. The duration of the non-thermal process in clusters of galaxies is largely limited by the back-reaction of protons on the MHD wave, which suppresses the efficient acceleration of relativistic electrons. Alfvén acceleration indicates a temporal correlation between the dynamical timescale of merger events and the acceleration timescale of electrons, which is estimated to be one order of magnitude shorter than the former one (Brunetti et al., 2004). In another scenario, the fast-mode induced in the compressible turbulence driven at large scales in the ICM can re-accelerate the CR-electrons to very high energies ( a few ) via Transit-Time-Damping (TTD) resonance (Yan & Lazarian, 2004; Brunetti & Lazarian, 2007; Yan et al., 2008; Brunetti & Lazarian, 2011a, b). It assumes quasi-isotropic turbulence cascade and high beta plasma (, ratio between plasma pressure to magnetic pressure). The coupling between the magnetic moment of charged particles and the parallel magnetic field gradients essentially causes the acceleration of charged particles. The damping of the compressible turbulence can be with thermal particles and relativistic particles. Fig. 7 (Donnert & Brunetti, 2014) illustrates that the damping rate with thermal particles (dark full line) is higher than the relativistic particles (light grey line), hence at small scales the cosmic ray re-acceleration becomes more efficient. In all these cases, the acceleration efficiency is constrained by the damping of the turbulence by the CR particles themselves. This modifies the spectrum of the turbulence, and hence the acceleration efficiency (as back-reaction). However, it is still unclear whether such small-scale waves can efficiently be generated in the ICM or not.
One can understand these mechanisms by studying them in controlled large scale cosmological simulations. In one case, this can be achieved by adopting an analytical or a semi-analytical approach, where the power-law for the particle spectra is estimated to be , with the assumed turbulence spectra and the fixed turbulence energy injection, and subsequently compute the radio synchrotron emission using Eq. 4 as post-processing on each grid-cell in the cosmological simulation to extract the synthetic synchrotron brightness map (Fang & Linden, 2016; Paul et al., 2018). The synchrotron emission at frequency, , is given as (Rybicki & Lightman, 1986; Longair-1994hea..book.....L)
| (4) |
where is the pitch angle, is the synchrotron kernel, is the critical frequency,
| (5) |
and is a tangled magnetic field. Here time-evolution of the spectra is not assumed/studied and estimations are drawn at the frozen epoch of large scale structures in cosmological simulations. On the other hand, significant deviations from the power law for the particle spectra are expected during the time evolution. Hence, numerically solving the Fokker-Planck equation to account for the re-acceleration of every particle in the dense gas in the computational domain is essential for more accurate insight. In this direction, Donnert et al. (2013) for the first time attempted to include the complex CR electron re-acceleration physics into the SPH-(Smooth Particle Hydrodynamical) Simulations. They simulate the cosmological flow with high Reynolds numbers to follow the rise and decay of turbulence in the cluster. The evolution of CR electrons is computed in post-processing with all relevant losses and stochastic re-acceleration processes (TTD damping of compressive turbulence in the ICM) by solving the Fokker-Planck equation for every SPH particle. In key observable of their work, in the different states of the merger evolution, they get the variety of observed radio spectra, i.e., flatter, curved and ultra-steep spectrum halos. Interested readers can also refer Donnert & Brunetti (2014) for more insight in numerical solution to the Fokker-Planck equation (Eq.1 of Donnert & Brunetti, 2014) and a sub-grid model for compressible magneto-hydrodynamic (MHD) turbulence in the ICM (Fig. 7).
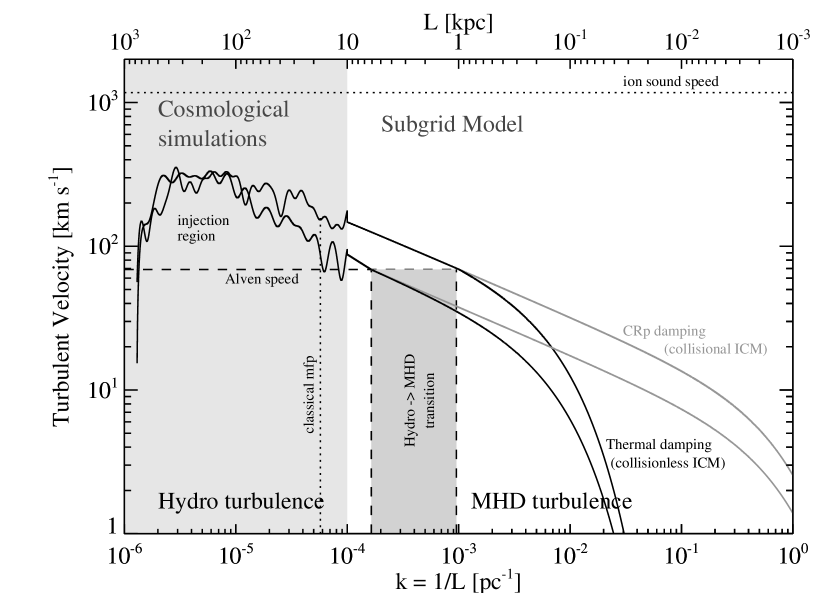
In the turbulent re-acceleration mechanism, to estimate well-motivated particle-acceleration coefficients and subsequent turbulence scale in different cosmological simulations, one needs to estimate the local turbulence velocity. One simplistic and physically motivated estimate can be the root-mean-square of the velocity dispersion inside the kernel, i.e., subtracting the bulk flow (the weighted or non-weighted average of velocity components) inside the kernel and the root-mean-square of this quantity signifies the turbulent velocity (see in SPH simulations- Vazza et al. (2006); Donnert & Brunetti (2014), Grid-based simulations Vazza et al. (2009b, 2011); Paul et al. (2018). The power spectrum of the velocity field of the simulated ICM can be estimated by applying the standard FFT algorithm to the data at the highest available resolution (Vazza et al., 2009b; Vazza, 2010; Federrath et al., 2008; Valdarnini, 2011), which describes the type of turbulence-induced in the ICM. Vazza et al. (2012b) adopted the multiscale filtering algorithms to identify the turbulent motions in hydrodynamical grid simulations (ENZO and FLASH). Most recently, Federrath et al. (2021) performed the world’s largest, highest-resolution simulations of turbulence in interstellar gas and molecular clouds. It allows for determining the position and width of the sonic scale, which was found to be very close to the theoretical predictions. For the first time, it enables researchers to draw a strong conclusion on the important transition of turbulence from supersonic to subsonic region. Although the initial aim of the simulation is to understand the impact of the turbulence on star formation in molecular clouds, it’s the biggest forward leap in understanding the turbulence at sonic scales (3D animation available online).
6.5 Secondary electrons as the source of synchrotron emission
As an alternative to the turbulent re-acceleration as the source of high energy (GeV) electrons, the “hadronic” or “secondary” model has been proposed to account for the production of diffuse radio emission in clusters of galaxies (see, e.g., Pfrommer & Enßlin 2004b; Keshet & Loeb 2010. This was conceptualized mainly to explain the Mpc scale size of the radio halos that spans almost the entire cluster volume. Similar to volume filling turbulence, Cosmic-ray protons are believed to fill the entire cluster volume (Enßlin et al., 2011; John et al., 2019) and can act as the constant injection source for long sustaining emission. The relativistic protons can be produced by the acceleration of thermal proton population by the shocks associated with cosmological structure formation (such as Fermi first order acceleration mechanism at shock fronts), galactic wind, injection by supernovae and the active galactic nuclei (AGN) (Ensslin et al. 1998a; Völk & Atoyan 1999; Ryu et al. 2003, for a review see Brunetti & Jones 2014). High energy electrons (or cosmic-ray electrons) responsible for synchrotron radio emission are the decay products (or the secondary particles), produced during the inelastic collision between these relativistic protons and the thermal ions in the ICM (Dennison, 1980; Schlickeiser et al., 1987; Blasi & Colafrancesco, 1999; Dolag & Enßlin, 2000).
The hadronic model somewhat resolves the difficulty in explaining the size of radio halos ( Mpc); i.e., the required diffusion time for the relativistic electrons to reach such large distances, which is much larger than their radiative lifetime. Since the radiative losses for protons are very low in comparison with electrons, and therefore the lifetime of CR protons is much longer than that of CR electrons. It makes these relativistic protons diffuse to very large scales and hence can accumulate in the cluster environment for a long time. The basic idea of the hadronic model is the continuous injection of cosmic-ray (CR) electrons in the ICM, happening through secondary processes that can successfully explain the sizes of radio halos.
To numerically model the radio synchrotron emission from the hadronic model: first, the power-law spectrum of the CR protons is considered and thereafter the spectrum of the secondary electrons is estimated from the proton-proton collisions (Brunetti & Blasi, 2005; Pfrommer & Enßlin, 2004a; Donnert et al., 2010a, b). Donnert et al. (2010a) simulate a scenario similar to the Coma cluster, and numerically predict the radio synchrotron emission from such a cluster, assuming the hadronic model, They report that the purely hadronic model disfavours the current radio-halo observations of the Coma cluster, and moreover, the hadronic model cannot explain the observed high frequency spectral steepening of the radio halo in the Coma cluster. Furthermore, the hadronic model is also incapable of explaining the observed general properties of giant radio halos, such as the observed radio bi-modality in the radio-X-ray correlation plot (Cassano et al., 2013), and the overall spectral properties of the halos, which can be very uniform to reasonably patchy (Donnert et al., 2010a). A great deal of debate on this issue can be found in a series of publications, as summarized in Brunetti & Jones (2014).
The neutral pions generated during the proton-proton collisions are expected to decay as ray emission (Blasi et al., 2007), which can be considered as an additional by-product of the hadronic model. It is the ray emission which gives an additional property to well constraint the secondary model, and the initially considered normalization of CR protons with power-law spectra. Although with the existing ray telescopes (FERMI telescope), no conclusive evidence of ray emission yet has been observed in clusters, except for the more recent work by Baghmanyan et al. (2022) showing some indications of extended emission from the nearby Coma cluster. There is a trade-off in the hadronic model, between the radio halo luminosity and the corresponding ray emissivity if halo emission is purely the cause of secondary particles (CR electrons). Another recent study towards the Coma cluster by Adam et al. (2021) reports the detection of gamma-rays, but they find that the hadronic model is insufficient to explain the radio halo.
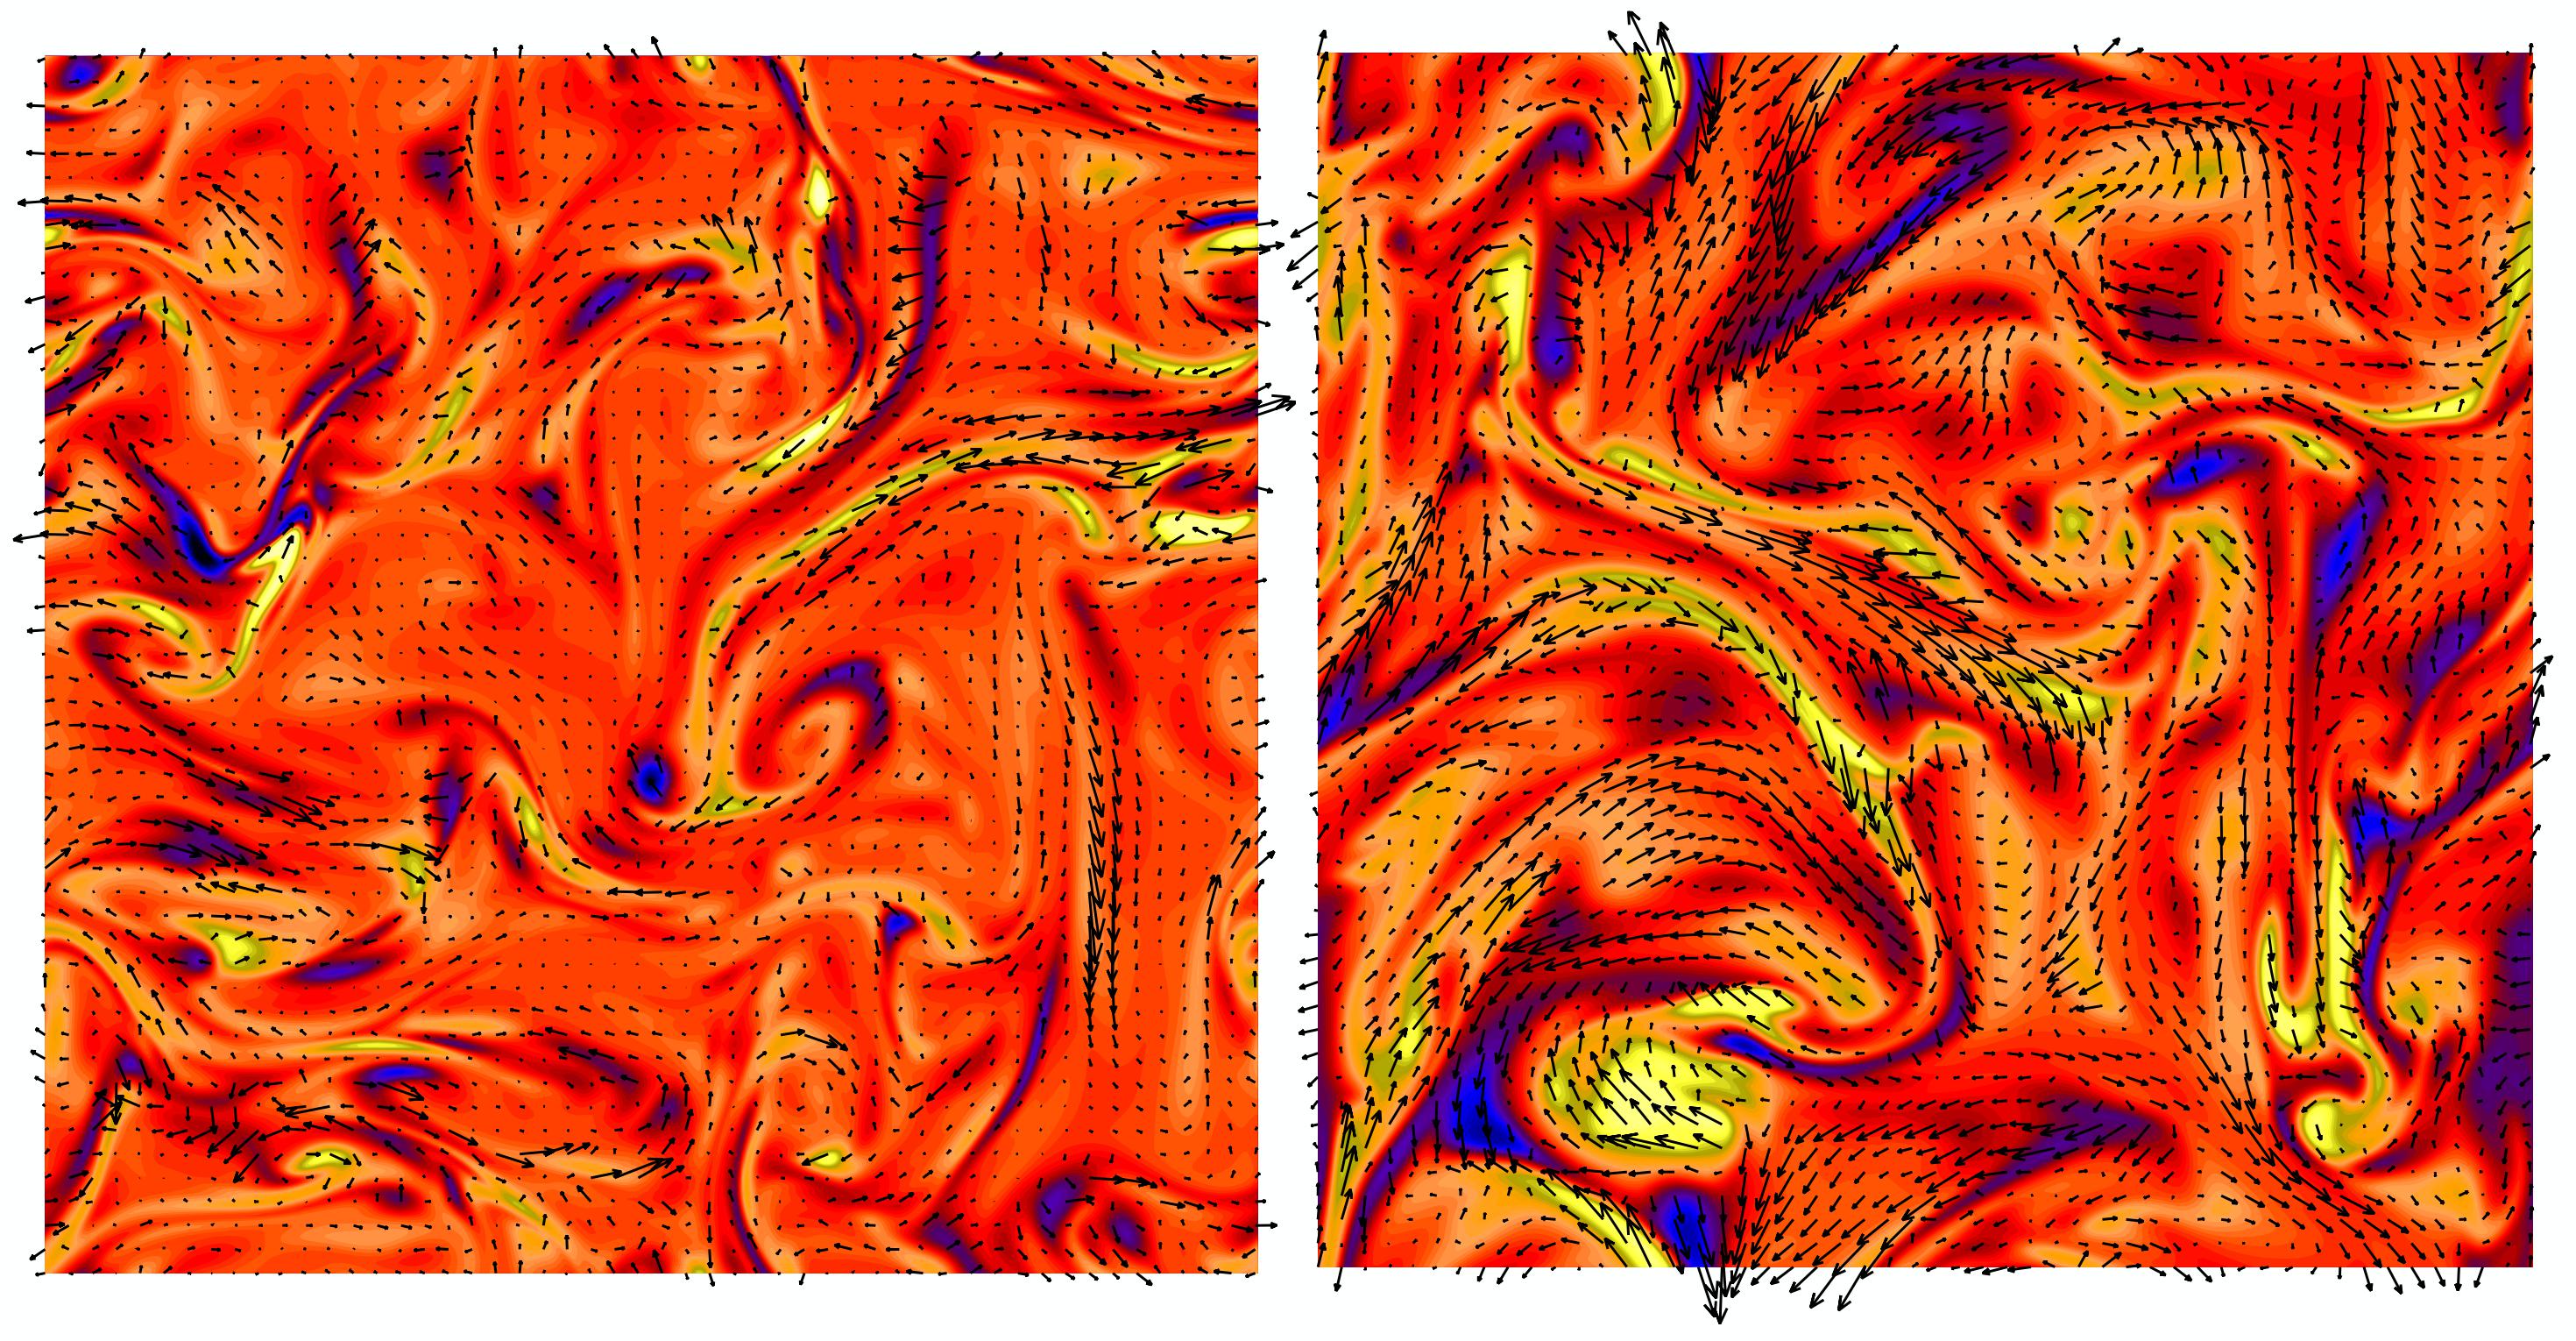
Although the numerical predictions for secondary electron models for radio halo emission do not favour the current observations of radio halos, it is found to be an effective model to explain the mini-halo radio structures (e.g. Pfrommer & Enßlin, 2004b; Ignesti et al., 2020). Ignesti et al. (2020) consider the hadronic scenario where they assume the CR-proton injection from the central AGN and CR-proton energy independent diffusion coefficient, to estimate the CR-proton spectrum to finally arrive at the radio emission profile. In their work, the final electron spectrum is computed assuming stationary conditions (Brunetti et al., 2017), which on the first-order approximation can be justified by the cooling time. On this timescale, the CR-protons can diffuse to scales similar to that of mini-halos, within the duty cycles of the AGN. Unfortunately, due to the high complexity of physical processes in the cooling flow clusters, no explicit attempts have been made to numerically simulate such structures.
6.6 Numerical simulations of magnetic fields in the ICM
Existing studies discussed in Section. 3.6 that compare observations of the Faraday RM and depolarization of cluster radio sources with those derived from numerical models reveal that the magnetic fields in the ICM to be ordered on -scales and have strengths of few . Magnetic fields in the ICM can be amplified and maintained at equipartition333Here ‘equipartition’ refers to the energy density of magnetic fields and kinetic energy of gas. levels via several processes operating on a large range of scales. For example, on several hundreds of kpc scales, shearing motion and sloshing of gas due to off-axis cluster mergers can drive turbulence (Subramanian et al., 2006). This turbulence can be driven by the cascade of vortical motions produced in oblique shocks as an aftermath of cluster formation and/or major collisions (Norman & Bryan, 1999; Subramanian et al., 2006; Ryu et al., 2008; Xu et al., 2012; Miniati, 2015; Marinacci et al., 2018). On the other hand, on a few tens of kpc scales, AGN and star-formation driven winds in cluster galaxies can drive turbulence (Donnert et al., 2009; Dubois et al., 2012; Pakmor et al., 2016; Wiener et al., 2017).
In the absence of noticeable rotation, fluctuation dynamos are ideally suited to amplify dynamically insignificant seed magnetic fields by randomly stretching them in turbulent eddies (Schekochihin et al., 2004; Haugen et al., 2004; Federrath et al., 2011; Porter et al., 2015; Sur et al., 2018; Seta & Federrath, 2021). Fluctuation dynamos amplify the fields to levels and order them on kpc-scales in a fast and efficient way (Kazantsev, 1968; Zeldovich et al., 1990). The amplification of fields by this mechanism occurs on the eddy-turnover timescale ( yr), which does not require any rotation or density stratification and only relies on the random or turbulent nature of the fluid flow. Fig. 8 shows that the resulting structure of the fluctuation dynamo generated magnetic fields from numerical simulations of Sur et al. (2021) is intermittent and arranged in folds (also see Seta et al., 2020), and are clearly in contrast to Gaussian field distributions (e.g., Murgia et al., 2004).
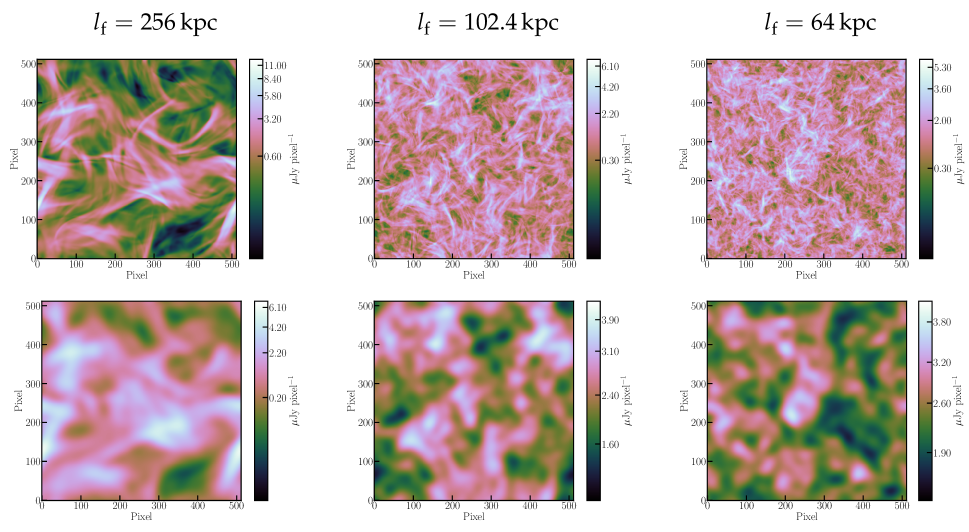
Cosmological simulations of tens of Mpc scales have shed meaningful insights into the role of magnetic fields in structure formation in the Universe (see e.g., Ryu et al., 2008; Donnert et al., 2009; Miniati, 2015; Vazza et al., 2017, 2018; Marinacci et al., 2018; Vazza et al., 2021a), and in understanding the radial distribution of gas and magnetic fields. Some of these simulations also confirm the possibility of fluctuation dynamo action in galaxy clusters (e.g., Miniati, 2015; Vazza et al., 2018; Marinacci et al., 2018; Domínguez-Fernández et al., 2019). Although these simulations are a powerful tool and are complementary to periodic box, local dynamo simulations, the limited resolution achievable to resolve the turbulent scales together with uncontrollable numerical dissipation (due to use of ideal MHD) may substantially affect the evolution and properties of magnetic fields. In fact, Vazza et al. (2018) are able to achieve a resolution at best by using the adaptive mesh refinement technique. Moreover, cosmological simulations of galaxy cluster assembly and evolution, at present, are only able to follow the dynamical behaviour for only a few tens of dynamical times (due to exorbitant computational costs). This implies that the magnetic energy would be grossly underestimated, with its value depending on the initial seed field and the effective Reynolds number of the simulation (Beresnyak & Miniati, 2016). Until computational power and numerical implementation are sufficient for performing cosmological simulations by aptly capturing the fluctuation dynamo action as well as resolving scales closer to the dissipation scale, numerical simulations of smaller volumes () with high resolutions, , can be useful to gain meaning insights on the properties of magnetic fields and their observational signatures (e.g., Subramanian et al., 2006; Bhat & Subramanian, 2013; Sur, 2019).
6.6.1 Polarized emission from fluctuation dynamo action:
In order to study the expected properties of the polarized synchrotron emission in the ICM due to the action of fluctuation dynamo, high resolution () simulations of a volume, representing the realistic conditions in the core regions of ICM, have been recently analysed by Sur et al. (2021) and Basu & Sur (2021) using the COSMIC polarization transfer package (Basu et al., 2019). By including the effects of frequency-dependent Faraday444A frequency-dependent reduction in polarization wherein emission originating from different locations along the line of sight undergo different degrees of Faraday rotation in the thermal component of the ICM gas., and frequency-independent beam depolarization555A reduction in the polarization caused by cancellation due to turbulent magnetic fields on scales smaller than the telescope beam., synthetic 2-D maps of the polarized synchrotron emission in the 0.5–7 GHz range and maps of Faraday depth were investigated for various representative scales of turbulent driving (). In the presence of subsonic turbulence in the ICM, the power spectrum of the Faraday depth map is directly related to the magnetic integral scale () defined as,
| (6) |
Here, is the power spectrum of the magnetic energy and is the wavenumber. Thus, the power spectrum of the map of Faraday depth can provide insights into the driving scale as it is linearly related to (Basu & Sur, 2021). However, obtaining Faraday depth maps for ICM is tricky due to the faintness of the polarized emission and limitations in analysis techniques, e.g., RM-synthesis (see e.g., Basu et al., 2019; Sur et al., 2021).
Figure 9 shows the maps of the total synchrotron intensity for different from Basu & Sur (2021). The top panels are at the native 1 kpc resolution of the simulations, and the bottom panels are after smoothing by a telescope beam with FWHM of 30 kpc corresponding to an angular resolution of 10 arcsec at redshift . It is clear that the filamentary structures on small scales are mostly smeared out in the presence of a telescope beam. These studies further revealed that at , a combination of low sensitivity and observation noise results in polarized emission from bright filamentary structures, wherever detectable, to be confined as clumps that could originate either due to shock compression or from Faraday depolarization.
Moreover, at low frequencies (), telescope beam drastically affects the properties of polarized emission in the presence of Faraday rotation (shown in the bottom panels of Figure 9). Thus, such detection may not provide adequate information on the global properties of turbulent magnetic fields in the ICM. On the other hand, the effects of Faraday depolarization and beam smoothing are mitigated for with polarization remaining largely unaffected and the mean fractional polarization () follows the relation as expected from random walk of the polarization vector when averaged over a volume (Basu & Sur, 2021).
This indicates that observational estimates of, or constrain on, at could be effectively used as an indicator of the driving scale of turbulence in the ICM, strongly underlining the need for high-frequency () polarization observations of radio halos using current or future radio telescopes. As depends on above , for observations performed with a spatial resolution better than (i.e., angular resolution of arcsec for a cluster at ), gives rise to indicating turbulence driven by gas accretion and star formation feedback from galaxies, in the range would arise for in the range 20–100 kpc driven by AGN feedback, while for , is expected, indicating turbulence being driven via vortical motions from cluster mergers. Therefore, to effectively probe the properties of polarized emission in the ICM and distinguish the different drivers of turbulence, sensitivity to for total intensity surface brightness at arcsec angular resolution is necessary (see Basu & Sur, 2021). Future observations with the SKA in Band 5a, covering the 4.6 to 8.5 GHz range, will play a crucial role in the quest of directly unravelling the magnetic field strength and structure in the ICM through polarized emission.
6.7 Modelling Mechanical heating by AGN
There is a pool of growing evidence, from both observations and simulations, that heating by the central AGN plays a role in the evolution of galaxy clusters and hence in the formation of the large-scale structural formation (Nath & Roychowdhury, 2002; Roychowdhury et al., 2005; Guo & Oh, 2008; Gaspari et al., 2011; Chaudhuri et al., 2012, 2013; Prasad et al., 2015; Iqbal et al., 2017b). This idea gets support from the fact that about 70% of galaxy clusters host central AGN. The ultra-steep spectrum radio bubbles (AGN remnants) in X-ray detected cavities found in the ICM is a direct proof of AGN energy being injected into ICM. Moreover, the mechanical power of the radio jets is found to be much larger than the synchrotron power (Cavagnolo et al., 2010; Godfrey & Shabala, 2013), implying even weak radio sources could produce enough mechanical power to significantly affect the ICM properties up to large radii and prevent gas from cooling. The feedback physics is driven by non-thermal electrons, directly or indirectly, and hence diffuse radio emissions in clusters are correlated to feedback mechanisms.
By comparing the observed entropy profiles with theoretically expected entropy profiles, based on non-radiative simulations, Chaudhuri et al. (2012, 2013); Iqbal et al. (2017a) were able to estimate the energy deposition profiles in the ICM. Chaudhuri et al. (2013) found an excess mean energy per particle to be around keV up to . Using the NRAO/VLA Sky Survey source catalogue, Chaudhuri et al. (2013) found that the total radio luminosity at 1.4 GHz of the central source(s) correlates with feedback energy, albeit with different normalization for cool-core and non-cool-core clusters. Iqbal et al. (2017a, b) estimated energy deposition profiles in galaxy clusters up to the cluster virial radius. Their results conclusively rule out any pre-heating of the ICM, but agreed with the earlier findings of Chaudhuri et al. (2013). In another work, Iqbal et al. (2018) using Chandra X-ray and VLA/GMRT radio data in the cluster inner regions found a significant correlation between the BCG radio luminosity () and cluster bulk properties. In the left panel in Fig. 10, we show the median non-gravitational feedback energy as a function of radius for the ACCEPT Cavagnolo et al. (2009) sub-sample and the REXCESS Böhringer et al. (2007); Pratt et al. (2010) sample, as estimated in Iqbal et al. (2018). The profiles are centrally peaked and decrease with radius. The right panel, in Fig. 10, shows the correlation between the BCG radio luminosity and X-ray luminosity as estimated in Iqbal et al. (2018). These results suggest that AGN play a dominant role in heating the ICM and that also AGN feedback is intricately linked with cluster radio emission.
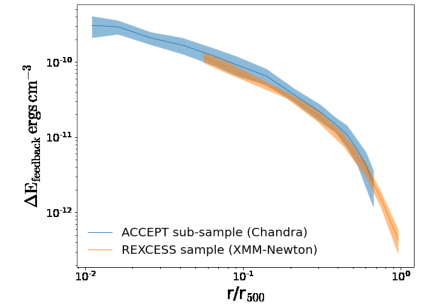
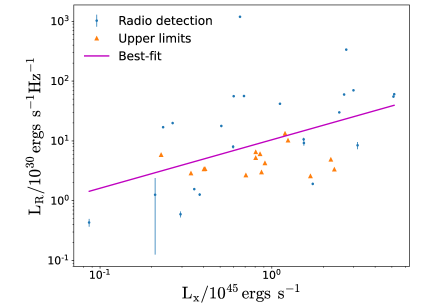
There are currently three main AGN feedback mechanisms (models) which can be explored without resorting to complex hydro-dynamical simulations: (i) the acoustic model (Fabian et al., 2003; Fabian et al., 2005), (ii) the effervescent model (Ruszkowski & Begelman, 2002; Roychowdhury et al., 2004) and (iii) the cosmic-ray model (Guo & Oh, 2008; Fujita & Ohira, 2011). In the acoustic model, the dissipation of energy into the ICM is due to sound waves induced by the central AGN activity while in the effervescent model, the AGN injects non-thermal electrons filled buoyant bubbles into the ICM which then heat the ambient medium by doing work. The cosmic-ray model assumes that cosmic rays are injected by the AGN, which can then heat the cluster core by amplifying Alfvén waves (Guo & Oh, 2008; Fujita & Ohira, 2011). Although all the models assume the central AGN to be the main source of feedback energy, they are radically different with regard to the physics of dissipation of energy into the ICM. All the three models, in principle, can be constrained by studying the mechanical jet power and radio luminosity () scaling relations (Cavagnolo et al., 2010; Godfrey & Shabala, 2013) and the thermal properties of the ICM using X-rays and radio measurements. Unfortunately, with current X-ray and radio observations, it is not possible to differentiate unambiguously between these models (Iqbal et al., 2022). However, upcoming high-quality data from large surveys with uGMRT & SKA (in radio), CMB-S4 (in mm) and Athena (in X-rays) will provide us new insights on AGN feedback of the ICM up to .
7 Updated taxonomy of cluster radio sources
As discussed earlier in section 3.1, historically the cluster radio sources were classified broadly into radio halos, relics and mini-halos mostly based on their physical characteristics (Ensslin et al., 1998a; Giovannini et al., 1999; Feretti & Giovannini, 2008; Feretti et al., 2012). However, with the improved sensitivity and wide spectral coverage of telescopes in recent years, a variety of extended low-brightness features have been commonly detected in clusters, slowly blurring the lines between radio galaxies and diffuse cluster radio sources. Many of these sources are morphologically similar to well known cluster radio sources but sharply differing in their spectral properties, especially in steepness and curvature. This has necessitated the inclusion of revived AGN fossil plasma sources, phoenices, and GReET together as a new class of cluster radio sources, making the overall classification scheme a very complex one (van Weeren et al., 2019), a mixture of multiple parameters such as location, morphology, spectra etc.
Nevertheless, it is evident that, where radio halos, mini-halos and peripheral relics are in general detected with a power-law spectrum, AGN relics or fossil plasma sources, phoenices etc. exhibit a curved spectrum. As per our current understanding and the suggested theoretical models (see Sec. 6), while, the power-law spectrum favours an in-situ particle acceleration mechanism, spectral curvature due to the ageing of electrons indicates the dying or revival of synchrotron emitting electrons. Therefore, the major factors that determine the energy distribution and the appearance, are the initial electron energy spectrum (steepness) and the dynamics of the cluster medium that drives the particle (re-)acceleration engines.
Since a substantial number of cluster radio sources are now available with their spectral information in wider frequency bands and the list is only expected to grow in future, we propose here a novel idea for classifying these sources based on their origin, specifically on the type of source (injection) electrons and cluster dynamics. This would in future help us to rationalize the classification and the nomenclature of a large variety of diffuse radio sources being observed. In this proposed taxonomy, we call a type of source as (i) Active cluster radio source if the sources show a power-law spectrum with no obvious spectral curvature. Since the power-law spectrum is the characteristics of freshly accelerated non-thermal particles, it indicates the presence of in-situ and active particle acceleration engines in these sources, such as usual radio-halos, relics and mini-halos. The sources will be called as the (ii) Dying cluster radio sources, if they are of ultra-steep spectrum nature with spectral curvature and age Myr with no obvious particle acceleration engine found in the system. AGN relics, ultra-steep radio halos with spectral curvature etc. would fall in this group. And a third one is defined as the (iii) Revived cluster radio sources, in case the emission comes from the revival of fossil non-thermal electrons, where cluster shock or turbulence is involved. However, they act as the revival engine rather than an accelerating engine and keep the curved spectrum nature of the injected fossil or aged electrons, intact. The basic feature of these sources are an ultra-steep spectrum, spectral curvature and a spectral age of usually beyond Myr, such as radio phoenices, revived ultra-steep sources by turbulence, revived buoyant radio bubbles etc.
While the existing classification scheme would remain relevant for immediate categorization of the overall cluster radio sources, our proposed taxonomy would help in classifying them further into more fundamental level. Such a classification would not be host-specific, rather would be applicable to a wider variety of radio emissions in various large scale structures. However, it should be noted that the classification always evolve in time with the availability of more data and as our understanding of the systems progressively improves.
8 On the role of uGMRT and expectations with the SKA
For a complete understanding of the physics of the ICM and the interplay between the galaxies and the ICM, it is going to be important to make deep continuum observations, in particular focussing on polarization and spectral line studies, of these components across a wide range of frequency bands. Recent galaxy cluster surveys such as LoTSS at 144 MHz and MGCLS at 1283 MHz (Sec. 2) have resulted in numerous discoveries of diffuse radio emission from galaxy clusters. The uGMRT, given its full coverage of the LOFAR sky, in addition to a significant overlap with the MeerKAT sky, is well suited for providing follow-up observations, in the frequency range of 150–1400 MHz, for obtaining spectra of such diffuse radio sources. Polarization studies at sub-GHz frequencies are challenging, but will be of interest to study sources that have ultra-steep spectra. The uGMRT bands 4 and 3 are being tested to make polarization measurements (Silpa et al., 2021) and will be of interest to study magnetic fields in sources such as radio relics and phoenices.
The Jy level sensitivity, that the SKA will achieve, will transform our understanding of the statistical properties of large scale structures, like galaxy clusters down to and beyond z 1. This has been limited until now due to the sensitivity and resolution constraints imposed by current generation instruments (Cassano et al., 2015b). It will also help us to probe the distant Universe via cluster gravitational lensing, particularly at radio wavelengths where the number of known radio-emitting lensed galaxies (a few mJy, up to Jy level) are scarce from z1 (McKean et al. 2015, Sec. 2.1.8 by Pandey-Pommier et al. in Acero et al. 2017 and Pandey-Pommier et al. SKA Users case, pvt. communication).
Deep continuum imaging of galaxies belonging to clusters is also necessary to study the effect of ICM on galaxies and vice versa. SKA continuum surveys will provide unprecedented sensitivities to study cluster fields in depth. Continuum imaging at 0.2–0.6 arcsec, and 3 Jy/beam sensitivity on clusters along with spectral line (HI) surveys of lensed galaxies at SKA LOW (0.05–0.35 GHz), SKA1-MID Band 1 (0.35-1.05) 2 (0.95-1.76) frequencies will not only help to discover the intra-cluster filaments at lower redshifts z 0.1 and investigate the matter distribution within clusters up to z 1, but also may discover a new population of background star-forming galaxies up to (0 z 6) via imaging. Further, for higher redshift lensed galaxies, (z 5) continuum imaging and spectral line observations, in Band 5 (4.6 -15.3 GHz) with 0.05–0.1 arcsec and 0.3Jy level sensitivity, will provide insights into the cold molecular gas reservoirs (CO, HCN, HCO+, etc.) (Carilli & Walter, 2013) that trace the sites of ongoing star formation. Additionally, the deep HI and continuum imaging provided with the uGMRT in Band 5 (1.4 GHz) with 2.5 Jy/beam sensitivity and 2.3 arcsec resolution will help us trace the impact of the extreme cluster environment on the atomic gas (HI) reservoirs, and also disentangle the HI emission from the cluster central regions and the filaments (Pandey-Pommier et al. SKA Users case, pvt. communication).
9 Summary and Conclusions
Radio observations of galaxy clusters are direct probes of a variety of phenomena on scales ranging from galaxies to the large scale structures. Diffuse radio sources found in galaxy clusters represent signatures of synchrotron emission delineating the magnetic fields in a cluster-scale system, along with the presence of relativistic electrons in the ICM. These sources have low surface brightness ( at GHz), steep spectra ( with ), and extend up to several tens of arcminutes (in low redshift sources). Thus low frequency telescopes with good sensitivity to extended structures, with low rms noise, are essential for these studies.
In this work we have reviewed the current understanding of this field using current radio observations, along with theoretical models and simulations, and outline the priorities for upcoming and already operational radio telescopes. We summarize as follows:
-
1.
The detailed scientific study of physical phenomena in galaxy groups and clusters require radio observations with high resolution (reaching sub-kpc scales) and with good sensitivity to extended structures (few arcminutes to a degree). Thus, large telescopes such as the VLA, WSRT and GMRT have played an important role in the past several decades in these studies. The Upgraded GMRT, LOFAR and MeerKAT have recently become operational, and are providing new insights on the physics of the galaxy clusters and beyond. The SKA is a next generation radio telescope which will further revolutionize the field.
-
2.
Radio surveys targeting galaxy clusters in the past two decades have thrown light on the statistics of occurrence of diffuse radio emission in clusters. Currently, several all-sky surveys, such as those with the LOFAR, are regularly generating numerous new discoveries that need detailed follow-up to uncover their nature and origin.
-
3.
Diffuse radio emission from clusters of galaxies is broadly classified into radio halos, relics and mini-halos. There are other diffuse filamentary extended radio sources found in galaxy clusters that result from activities or mergers of radio galaxies. The interaction between the cluster ICM and the radio sources can lead to radio sources being revived. Radio phoenices, turbulence-revived sources and buoyant radio bubbles are sources in this category.
-
4.
The focus of radio surveys is shifting to low mass clusters and groups where the state of the magnetic field and extent of the generation of cosmic rays is poorly known.
-
5.
At the other extreme of spatial extent, superclusters of galaxies which can stretch beyond 10-100 Mpc belong to a scale where the origin and nature of magnetic fields are poorly known. The detection of synchrotron-emitting radio bridges between pairs of clusters indicate that substantial magnetic fields do exist on such scales, and the dense environment of superclusters may host large scale radio sources that can provide the direct detection of such magnetic fields. Currently, both superclusters and binary clusters are being surveyed in the radio bands.
-
6.
Theoretical models have proposed mechanisms that explain the origin and nature of diffuse radio sources to a large extent, though there are unsolved challenges. The Diffusive Shock Acceleration model falls short of explaining the observed radio relics unless the seed relativistic electron population is included. Several variants of the turbulent reacceleration model, such as using compressible and incompressible turbulence, Alfvén modes and fast modes, have been proposed for explaining radio halos. Efforts are ongoing to numerically solve the Fokker-Planck equation to follow the reacceleration of every particle in a typical simulation box. However, overcoming numerical limitations and obtaining predictions specific to a variety of merger scenarios will be needed.
-
7.
Recent numerical simulations of magnetic fields show intermittent morphological signatures, arranged in folds, in contrast to Gaussian field distributions that are typically considered in the literature. Cosmological simulations are reaching unprecedented resolution scales (current down to a few kpc), though more needs to be done to capture the fluctuation dynamo and resolution scales of the order of dissipation scales. Simulations of observations show that polarization observations at 4 GHz and above could potentially be used to find the driving scales of turbulence.
-
8.
By studying the radio sources in the central galaxies in clusters and groups, constraints can be obtained on the mechanical heating of the cluster cores by AGN. This will lead to the understanding of the physics of the interaction of the thermal and non-thermal plasma in the ICM, and the accretion processes associated with the supermassive black holes at the cores of the brightest cluster and group galaxies.
-
9.
The Upgraded GMRT with its wide frequency coverage will play a major role as a follow-up instrument for the newly discovered radio sources with LOFAR and MeerKAT, paving the way for SKA.
-
10.
With the advent of SKA, significant progress in understanding the open issues regarding the origin and nature of magnetic fields and cosmic rays on the scales of clusters and beyond is expected.
Acknowledgements
S. Paul wants to thank the DST INSPIRE Faculty Scheme (code: IF-12/PH-44) for funding his research group. R. Kale acknowledges the support of the Department of Atomic Energy, Government of India, under project no. 12-R&D-TFR-5.02-0700. S. Sur acknowledges computing time awarded the CDAC National Param supercomputing facility, India, under the grant ‘Hydromagnetic-Turbulence-PR’ and the use of the High Performance Computing (HPC) resources made available by the Computer Centre of the Indian Institute of Astrophysics. S. Sur further thanks the Science and Engineering Research Board (SERB) of the Department of Science & Technology (DST), Government of India, for support through research grant ECR/2017/001535. A. Basu acknowledges the computing facility and support provided at the Thüringer Landessternwarte, Tautenburg, Germany. The work of A. Iqbal was supported by CNES, France. MP acknowledges the support of CEFIPRA foundation under the project 6504-3. MR acknowledges financial support from Ministry of Science and Technology of Taiwan (MOST 109-2112-M-007-037-MY3).
References
- Acero et al. (2017) Acero F., et al., 2017, arXiv e-prints, p. arXiv:1712.06950
- Adam et al. (2021) Adam R., Goksu H., Brown S., Rudnick L., Ferrari C., 2021, aap, 648, A60
- Akamatsu & Kawahara (2013) Akamatsu H., Kawahara H., 2013, pasj, 65, 16
- Araya-Melo et al. (2012) Araya-Melo P. A., Aragón-Calvo M. A., Brüggen M., Hoeft M., 2012, mnras, 423, 2325
- Bagchi et al. (2002) Bagchi J., Enßlin T. A., Miniati F., Stalin C. S., Singh M., Raychaudhury S., Humeshkar N. B., 2002, na, 7, 249
- Bagchi et al. (2011) Bagchi J., et al., 2011, apjl, 736, L8
- Bagchi et al. (2017) Bagchi J., Sankhyayan S., Sarkar P., Raychaudhury S., Jacob J., Dabhade P., 2017, apj, 844, 25
- Baghmanyan et al. (2022) Baghmanyan V., Zargaryan D., Aharonian F., Yang R., Casanova S., Mackey J., 2022, mnras, 516, 562
- Bahcall & Soneira (1984) Bahcall N. A., Soneira R. M., 1984, apj, 277, 27
- Basu (2012) Basu K., 2012, mnras, 421, L112
- Basu & Sur (2021) Basu A., Sur S., 2021, Galaxies, 9, 62
- Basu et al. (2016a) Basu K., Erler J., Sommer M., Vazza F., Eckert D., 2016a, Galaxies, 4, 73
- Basu et al. (2016b) Basu K., Vazza F., Erler J., Sommer M., 2016b, aap, 591, A142
- Basu et al. (2019) Basu A., Fletcher A., Mao S. A., Burkhart B., Beck R., Schnitzeler D., 2019, Galaxies, 7, 89
- Beresnyak & Miniati (2016) Beresnyak A., Miniati F., 2016, apj, 817, 127
- Bhat & Subramanian (2013) Bhat P., Subramanian K., 2013, mnras, 429, 2469
- Bhatnagar et al. (2008) Bhatnagar S., Cornwell T. J., Golap K., Uson J. M., 2008, aap, 487, 419
- Biava et al. (2021) Biava N., et al., 2021, aap, 650, A170
- Birkinshaw (1999) Birkinshaw M., 1999, physrep, 310, 97
- Bîrzan et al. (2020) Bîrzan L., et al., 2020, mnras, 496, 2613
- Blandford & Eichler (1987) Blandford R., Eichler D., 1987, physrep, 154, 1
- Blanton (2004) Blanton E. L., 2004, in Reiprich T., Kempner J., Soker N., eds, The Riddle of Cooling Flows in Galaxies and Clusters of galaxies. p. 181 (arXiv:astro-ph/0402342)
- Blasi & Colafrancesco (1999) Blasi P., Colafrancesco S., 1999, Nuclear Physics B Proceedings Supplements, 70, 495
- Blasi et al. (2007) Blasi P., Gabici S., Brunetti G., 2007, International Journal of Modern Physics A, 22, 681
- Blundell et al. (2006) Blundell K. M., Fabian A. C., Crawford C. S., Erlund M. C., Celotti A., 2006, apjl, 644, L13
- Böhringer et al. (2007) Böhringer H., et al., 2007, aap, 469, 363
- Böhringer et al. (2016) Böhringer H., Chon G., Kronberg P. P., 2016, aap, 596, A22
- Bonafede et al. (2009a) Bonafede A., Feretti L., Govoni F., Murgia M., Giovannini G., Dolag K., Taylor G. B., 2009a, in Revista Mexicana de Astronomia y Astrofisica Conference Series. pp CD303–CD307
- Bonafede et al. (2009b) Bonafede A., et al., 2009b, aap, 503, 707
- Bonafede et al. (2010) Bonafede A., Feretti L., Murgia M., Govoni F., Giovannini G., Dallacasa D., Dolag K., Taylor G. B., 2010, aap, 513, A30
- Bonafede et al. (2015) Bonafede A., et al., 2015, mnras, 454, 3391
- Bonafede et al. (2017) Bonafede A., et al., 2017, mnras, 470, 3465
- Botteon et al. (2016) Botteon A., Gastaldello F., Brunetti G., Dallacasa D., 2016, mnras, 460, L84
- Botteon et al. (2018) Botteon A., et al., 2018, Monthly Notices of the Royal Astronomical Society, 478, 885
- Botteon et al. (2019) Botteon A., et al., 2019, aap, 630, A77
- Botteon et al. (2020a) Botteon A., et al., 2020a, mnras, 499, L11
- Botteon et al. (2020b) Botteon A., Brunetti G., Ryu D., Roh S., 2020b, aap, 634, A64
- Botteon et al. (2021) Botteon A., et al., 2021, apjl, 914, L29
- Botteon et al. (2022) Botteon A., et al., 2022, aap, 660, A78
- Braun et al. (2019) Braun R., Bonaldi A., Bourke T., Keane E., Wagg J., 2019, arXiv e-prints, p. arXiv:1912.12699
- Bravi et al. (2016) Bravi L., Gitti M., Brunetti G., 2016, mnras, 455, L41
- Breen et al. (1994) Breen J., Raychaudhury S., Forman W., Jones C., 1994, apj, 424, 59
- Brienza et al. (2016) Brienza M., et al., 2016, aap, 585, A29
- Brienza et al. (2021) Brienza M., et al., 2021, Nature Astronomy, 5, 1261
- Brienza et al. (2022) Brienza M., et al., 2022, aap, 661, A92
- Brüggen & Vazza (2020) Brüggen M., Vazza F., 2020, mnras, 493, 2306
- Brüggen et al. (2018) Brüggen M., et al., 2018, mnras, 477, 3461
- Brunetti & Blasi (2005) Brunetti G., Blasi P., 2005, mnras, 363, 1173
- Brunetti & Jones (2014) Brunetti G., Jones T. W., 2014, International Journal of Modern Physics D, 23, 1430007
- Brunetti & Lazarian (2007) Brunetti G., Lazarian A., 2007, mnras, 378, 245
- Brunetti & Lazarian (2011a) Brunetti G., Lazarian A., 2011a, mnras, 410, 127
- Brunetti & Lazarian (2011b) Brunetti G., Lazarian A., 2011b, mnras, 412, 817
- Brunetti & Vazza (2020) Brunetti G., Vazza F., 2020, Physical Review Letters, 124, 051101
- Brunetti et al. (2004) Brunetti G., Blasi P., Cassano R., Gabici S., 2004, mnras, 350, 1174
- Brunetti et al. (2017) Brunetti G., Zimmer S., Zandanel F., 2017, mnras, 472, 1506
- Buote (2001) Buote D. A., 2001, apjl, 553, L15
- Burns et al. (1987) Burns J. O., Hanisch R. J., White R. A., Nelson E. R., Morrisette K. A., Moody J. W., 1987, aj, 94, 587
- Carilli & Walter (2013) Carilli C. L., Walter F., 2013, araa, 51, 105
- Cassano et al. (2007) Cassano R., Brunetti G., Setti G., Govoni F., Dolag K., 2007, mnras, 378, 1565
- Cassano et al. (2010) Cassano R., Ettori S., Giacintucci S., Brunetti G., Markevitch M., Venturi T., Gitti M., 2010, apjl, 721, L82
- Cassano et al. (2013) Cassano R., et al., 2013, apj, 777, 141
- Cassano et al. (2015a) Cassano R., et al., 2015a, in Advancing Astrophysics with the Square Kilometre Array (AASKA14). p. 73 (arXiv:1412.5940)
- Cassano et al. (2015b) Cassano R., et al., 2015b, in Advancing Astrophysics with the Square Kilometre Array (AASKA14). p. 73 (arXiv:1412.5940)
- Cautun et al. (2014) Cautun M., van de Weygaert R., Jones B. J. T., Frenk C. S., 2014, mnras, 441, 2923
- Cavagnolo et al. (2009) Cavagnolo K. W., Donahue M., Voit G. M., Sun M., 2009, ApJS, 182, 12
- Cavagnolo et al. (2010) Cavagnolo K. W., McNamara B. R., Nulsen P. E. J., Carilli C. L., Jones C., Bîrzan L., 2010, apj, 720, 1066
- Cen & Ostriker (1999) Cen R., Ostriker J. P., 1999, apj, 514, 1
- Chatterjee et al. (2022) Chatterjee S., Rahaman M., Datta A., Raja R., 2022, AJ, 164, 83
- Chaudhuri et al. (2012) Chaudhuri A., Nath B. B., Majumdar S., 2012, ApJ, 759, 87
- Chaudhuri et al. (2013) Chaudhuri A., Majumdar S., Nath B. B., 2013, ApJ, 776, 84
- Churazov et al. (2002) Churazov E., Sunyaev R., Forman W., Böhringer H., 2002, mnras, 332, 729
- Churazov et al. (2013) Churazov E., Ruszkowski M., Schekochihin A., 2013, mnras, 436, 526
- Clarke et al. (2001) Clarke T. E., Kronberg P. P., Böhringer H., 2001, apjl, 547, L111
- Clarke et al. (2005) Clarke T. E., Sarazin C. L., Blanton E. L., Neumann D. M., Kassim N. E., 2005, apj, 625, 748
- Colafrancesco et al. (2003) Colafrancesco S., Marchegiani P., Palladino E., 2003, aap, 397, 27
- Cornwell et al. (2008) Cornwell T. J., Golap K., Bhatnagar S., 2008, IEEE Journal of Selected Topics in Signal Processing, 2, 647
- Cuciti et al. (2018) Cuciti V., Brunetti G., van Weeren R., Bonafede A., Dallacasa D., Cassano R., Venturi T., Kale R., 2018, aap, 609, A61
- Cuciti et al. (2021a) Cuciti V., et al., 2021a, aap, 647, A50
- Cuciti et al. (2021b) Cuciti V., et al., 2021b, aap, 647, A51
- David et al. (2009) David L. P., Jones C., Forman W., Nulsen P., Vrtilek J., O’Sullivan E., Giacintucci S., Raychaudhury S., 2009, apj, 705, 624
- Day et al. (1991) Day C. S. R., Fabian A. C., Edge A. C., Raychaudhury S., 1991, mnras, 252, 394
- Dennison (1980) Dennison B., 1980, apjl, 239, L93
- Deo & Kale (2017) Deo D. K., Kale R., 2017, Experimental Astronomy, 44, 165
- Di Gennaro et al. (2021a) Di Gennaro G., et al., 2021a, Nature Astronomy, 5, 268
- Di Gennaro et al. (2021b) Di Gennaro G., et al., 2021b, aap, 654, A166
- Dolag & Enßlin (2000) Dolag K., Enßlin T. A., 2000, aap, 362, 151
- Domínguez-Fernández et al. (2019) Domínguez-Fernández P., Vazza F., Brüggen M., Brunetti G., 2019, mnras, 486, 623
- Dominguez-Fernandez et al. (2021) Dominguez-Fernandez P., Bruggen M., Vazza F., Banda-Barragan W. E., Rajpurohit K., Mignone A., Mukherjee D., Vaidya B., 2021, mnras, 500, 795
- Dong & Stone (2009) Dong R., Stone J. M., 2009, apj, 704, 1309
- Donnert & Brunetti (2014) Donnert J., Brunetti G., 2014, mnras, 443, 3564
- Donnert et al. (2009) Donnert J., Dolag K., Lesch H., Müller E., 2009, mnras, 392, 1008
- Donnert et al. (2010a) Donnert J., Dolag K., Brunetti G., Cassano R., Bonafede A., 2010a, mnras, 401, 47
- Donnert et al. (2010b) Donnert J., Dolag K., Cassano R., Brunetti G., 2010b, mnras, 407, 1565
- Donnert et al. (2013) Donnert J., Dolag K., Brunetti G., Cassano R., 2013, mnras, 429, 3564
- Drury (1983) Drury L. O., 1983, Reports on Progress in Physics, 46, 973
- Dubois et al. (2012) Dubois Y., Devriendt J., Slyz A., Teyssier R., 2012, mnras, 420, 2662
- Duchesne et al. (2021) Duchesne S. W., Johnston-Hollitt M., Bartalucci I., 2021, pasa, 38, e053
- Duchesne et al. (2022) Duchesne S. W., Johnston-Hollitt M., Riseley C. J., Bartalucci I., Keel S. R., 2022, mnras, 511, 3525
- Dwarakanath & Kale (2009) Dwarakanath K. S., Kale R., 2009, apjl, 698, L163
- Dwarakanath et al. (2018) Dwarakanath K. S., Parekh V., Kale R., George L. T., 2018, mnras, 477, 957
- Eckert et al. (2016) Eckert D., Jauzac M., Vazza F., Owers M. S., Kneib J. P., Tchernin C., Intema H., Knowles K., 2016, mnras, 461, 1302
- Enßlin & Brüggen (2002) Enßlin T. A., Brüggen M., 2002, mnras, 331, 1011
- Enßlin & Gopal-Krishna (2001) Enßlin T. A., Gopal-Krishna 2001, aap, 366, 26
- Enßlin, T. A. & Gopal-Krishna (2001) Enßlin, T. A. Gopal-Krishna 2001, A&A, 366, 26
- Ensslin et al. (1998a) Ensslin T. A., Biermann P. L., Klein U., Kohle S., 1998a, aap, 332, 395
- Ensslin et al. (1998b) Ensslin T. A., Biermann P. L., Klein U., Kohle S., 1998b, aap, 332, 395
- Enßlin et al. (2011) Enßlin T., Pfrommer C., Miniati F., Subramanian K., 2011, aap, 527, A99
- Fabian et al. (2000) Fabian A. C., et al., 2000, mnras, 318, L65
- Fabian et al. (2002) Fabian A. C., Celotti A., Blundell K. M., Kassim N. E., Perley R. A., 2002, mnras, 331, 369
- Fabian et al. (2003) Fabian A. C., Sanders J. S., Allen S. W., Crawford C. S., Iwasawa K., Johnstone R. M., Schmidt R. W., Taylor G. B., 2003, MNRAS, 344, L43
- Fabian et al. (2005) Fabian A. C., Reynolds C. S., Taylor G. B., Dunn R. J. H., 2005, MNRAS, 363, 891
- Fang & Linden (2016) Fang K., Linden T., 2016, jcap, 2016, 004
- Federrath et al. (2008) Federrath C., Klessen R. S., Schmidt W., 2008, apjl, 688, L79
- Federrath et al. (2011) Federrath C., Chabrier G., Schober J., Banerjee R., Klessen R. S., Schleicher D. R. G., 2011, Physical Review Letters, 107, 114504
- Federrath et al. (2021) Federrath C., Klessen R. S., Iapichino L., Beattie J. R., 2021, Nature Astronomy, 5, 365
- Feretti & Giovannini (2008) Feretti L., Giovannini G., 2008, in Plionis M., López-Cruz O., Hughes D., eds, , Vol. 740, A Pan-Chromatic View of Clusters of Galaxies and the Large-Scale Structure. p. 24, doi:10.1007/978-1-4020-6941-3_5
- Feretti et al. (2012) Feretti L., Giovannini G., Govoni F., Murgia M., 2012, aapr, 20, 54
- Ferrari et al. (2008) Ferrari C., Govoni F., Schindler S., Bykov A. M., Rephaeli Y., 2008, ssr, 134, 93
- Freeland & Wilcots (2011) Freeland E., Wilcots E., 2011, apj, 738, 145
- Fujita & Ohira (2011) Fujita Y., Ohira Y., 2011, ApJ, 738, 182
- Fujita et al. (2003) Fujita Y., Takizawa M., Sarazin C. L., 2003, apj, 584, 190
- Fujita et al. (2008) Fujita Y., Tawa N., Hayashida K., Takizawa M., Matsumoto H., Okabe N., Reiprich T. H., 2008, pasj, 60, S343
- Gardini (2007) Gardini A., 2007, aap, 464, 143
- Gaspari et al. (2011) Gaspari M., Brighenti F., D’Ercole A., Melioli C., 2011, MNRAS, 415, 1549
- Ghirardini et al. (2021) Ghirardini V., et al., 2021, aap, 647, A4
- Giacintucci et al. (2011) Giacintucci S., et al., 2011, apj, 732, 95
- Giacintucci et al. (2012) Giacintucci S., et al., 2012, apj, 755, 172
- Giacintucci et al. (2014) Giacintucci S., Markevitch M., Venturi T., Clarke T. E., Cassano R., Mazzotta P., 2014, apj, 781, 9
- Giacintucci et al. (2017) Giacintucci S., Markevitch M., Cassano R., Venturi T., Clarke T. E., Brunetti G., 2017, apj, 841, 71
- Gilmour et al. (2009) Gilmour R., Best P., Almaini O., 2009, mnras, 392, 1509
- Giovannini & Feretti (2000) Giovannini G., Feretti L., 2000, na, 5, 335
- Giovannini et al. (1999) Giovannini G., Tordi M., Feretti L., 1999, na, 4, 141
- Giovannini et al. (2009) Giovannini G., Bonafede A., Feretti L., Govoni F., Murgia M., Ferrari F., Monti G., 2009, aap, 507, 1257
- Girardi et al. (2016) Girardi M., et al., 2016, mnras, 456, 2829
- Gitti et al. (2010) Gitti M., O’Sullivan E., Giacintucci S., David L. P., Vrtilek J., Raychaudhury S., Nulsen P. E. J., 2010, apj, 714, 758
- Gitti et al. (2018) Gitti M., Brunetti G., Cassano R., Ettori S., 2018, aap, 617, A11
- Godfrey & Shabala (2013) Godfrey L. E. H., Shabala S. S., 2013, apj, 767, 12
- Govoni et al. (2005) Govoni F., Murgia M., Feretti L., Giovannini G., Dallacasa D., Taylor G. B., 2005, aap, 430, L5
- Govoni et al. (2013) Govoni F., Murgia M., Xu H., Li H., Norman M. L., Feretti L., Giovannini G., Vacca V., 2013, aap, 554, A102
- Govoni et al. (2019) Govoni F., et al., 2019, Science, 364, 981
- Guo & Oh (2008) Guo F., Oh S. P., 2008, MNRAS, 384, 251
- Gupta et al. (2017) Gupta Y., et al., 2017, Current Science, 113, 707
- Haugen et al. (2004) Haugen N. E., Brandenburg A., Dobler W., 2004, pre, 70, 016308
- Heinz et al. (2002) Heinz S., Choi Y.-Y., Reynolds C. S., Begelman M. C., 2002, apjl, 569, L79
- Hoang et al. (2017) Hoang D. N., et al., 2017, mnras, 471, 1107
- Hoang et al. (2019) Hoang D. N., et al., 2019, aap, 622, A21
- Hoang et al. (2022) Hoang D. N., et al., 2022, arXiv e-prints, p. arXiv:2206.04666
- Hodgson et al. (2021) Hodgson T., Bartalucci I., Johnston-Hollitt M., McKinley B., Vazza F., Wittor D., 2021, apj, 909, 198
- Hoeft & Brüggen (2007) Hoeft M., Brüggen M., 2007, mnras, 375, 77
- Hoeft et al. (2008) Hoeft M., Brüggen M., Yepes G., Gottlöber S., Schwope A., 2008, mnras, 391, 1511
- Hoeft et al. (2011) Hoeft M., Nuza S. E., Gottlöber S., van Weeren R. J., Röttgering H. J. A., Brüggen M., 2011, Journal of Astrophysics and Astronomy, 32, 509
- Hofmann et al. (2017) Hofmann F., et al., 2017, aap, 606, A118
- Iapichino (2011) Iapichino L., 2011, memsai, 82, 605
- Iapichino et al. (2010) Iapichino L., Maier A., Schmidt W., Niemeyer J. C., 2010, in Alimi J.-M., Fuözfa A., eds, American Institute of Physics Conference Series Vol. 1241, Invisible Universe. pp 928–934 (arXiv:0911.2629), doi:10.1063/1.3462735
- Ignesti et al. (2020) Ignesti A., Brunetti G., Gitti M., Giacintucci S., 2020, aap, 640, A37
- Intema, H. T. et al. (2009) Intema, H. T. van der Tol, S. Cotton, W. D. Cohen, A. S. van Bemmel, I. M. Röttgering, H. J. A. 2009, A&A, 501, 1185
- Intema, H. T. et al. (2017) Intema, H. T. Jagannathan, P. Mooley, K. P. Frail, D. A. 2017, A&A, 598, A78
- Iqbal et al. (2017a) Iqbal A., Majumdar S., Nath B. B., Ettori S., Eckert D., Malik M. A., 2017a, MNRAS, 465, L99
- Iqbal et al. (2017b) Iqbal A., Majumdar S., Nath B. B., Ettori S., Eckert D., Malik M. A., 2017b, MNRAS, 472, 713
- Iqbal et al. (2018) Iqbal A., Kale R., Nath B. B., Majumdar S., 2018, MNRAS, 480, L68
- Iqbal et al. (2022) Iqbal A., Majumdar S., Nath B. B., Roychowdhury S., 2022, arXiv e-prints, p. arXiv:2203.13340
- John et al. (2019) John R. S., Paul S., Iapichino L., Mannheim K., Kumar H., 2019, mnras, 488, 1301
- Jones & Ellison (1991) Jones F. C., Ellison D. C., 1991, ssr, 58, 259
- Józsa et al. (2020) Józsa G. I. G., et al., 2020, in Pizzo R., Deul E. R., Mol J. D., de Plaa J., Verkouter H., eds, Astronomical Society of the Pacific Conference Series Vol. 527, Astronomical Data Analysis Software and Systems XXIX. p. 635 (arXiv:2006.02955)
- Kaiser (1986) Kaiser N., 1986, Monthly Notices of the Royal Astronomical Society, 222, 323
- Kale & Dwarakanath (2012) Kale R., Dwarakanath K. S., 2012, apj, 744, 46
- Kale & Ishwara-Chandra (2021) Kale R., Ishwara-Chandra C. H., 2021, Experimental Astronomy, 51, 95
- Kale et al. (2012) Kale R., Dwarakanath K. S., Bagchi J., Paul S., 2012, mnras, 426, 1204
- Kale et al. (2013) Kale R., Venturi T., Giacintucci S., Dallacasa D., Cassano R., Brunetti G., Macario G., Athreya R., 2013, aap, 557, A99
- Kale et al. (2015a) Kale R., et al., 2015a, aap, 579, A92
- Kale et al. (2015b) Kale R., Venturi T., Cassano R., Giacintucci S., Bardelli S., Dallacasa D., Zucca E., 2015b, aap, 581, A23
- Kale et al. (2016) Kale R., et al., 2016, Journal of Astrophysics and Astronomy, 37, 31
- Kale et al. (2017) Kale R., Wik D. R., Giacintucci S., Venturi T., Brunetti G., Cassano R., Dallacasa D., de Gasperin F., 2017, mnras, 472, 940
- Kale et al. (2018) Kale R., Parekh V., Dwarakanath K. S., 2018, mnras, 480, 5352
- Kale et al. (2019) Kale R., Shende K. M., Parekh V., 2019, mnras, 486, L80
- Kang (2011) Kang H., 2011, Journal of Korean Astronomical Society, 44, 49
- Kang (2012) Kang H., 2012, Journal of Korean Astronomical Society, 45, 127
- Kang & Ryu (2011) Kang H., Ryu D., 2011, apj, 734, 18
- Kang & Ryu (2016) Kang H., Ryu D., 2016, apj, 823, 13
- Kang et al. (2014) Kang H., Petrosian V., Ryu D., Jones T. W., 2014, apj, 788, 142
- Kazantsev (1968) Kazantsev A. P., 1968, Soviet Journal of Experimental and Theoretical Physics, 26, 1031
- Kempner et al. (2004) Kempner J. C., Blanton E. L., Clarke T. E., Enßlin T. A., Johnston-Hollitt M., Rudnick L., 2004, in Reiprich T., Kempner J., Soker N., eds, The Riddle of Cooling Flows in Galaxies and Clusters of galaxies. p. 335 (arXiv:astro-ph/0310263)
- Kenyon et al. (2018) Kenyon J. S., Smirnov O. M., Grobler T. L., Perkins S. J., 2018, mnras, 478, 2399
- Keshet & Loeb (2010) Keshet U., Loeb A., 2010, apj, 722, 737
- Keshet et al. (2004) Keshet U., Waxman E., Loeb A., 2004, apj, 617, 281
- Kierdorf et al. (2017) Kierdorf M., Beck R., Hoeft M., Klein U., van Weeren R. J., Forman W. R., Jones C., 2017, aap, 600, A18
- Kim et al. (1989) Kim K.-T., Kronberg P., Giovannini G., Venturi T., 1989, Nature, 341, 720
- Knowles et al. (2019) Knowles K., et al., 2019, mnras, 486, 1332
- Knowles et al. (2022) Knowles K., et al., 2022, aap, 657, A56
- Kolokythas et al. (2022) Kolokythas K., Vaddi S., O’Sullivan E., Loubser I., Babul A., Raychaudhury S., Lagos P., Jarrett T. H., 2022, mnras, 510, 4191
- Kronberg (1994) Kronberg P. P., 1994, Reports on Progress in Physics, 57, 325
- Lal (2020) Lal D. V., 2020, apjs, 250, 22
- Large et al. (1959) Large M. I., Mathewson D. S., Haslam C. G. T., 1959, nat, 183, 1663
- Li et al. (2019) Li F., Gu Y.-Z., Yuan Q.-R., Bao M., He Z.-C., Bian W.-H., 2019, mnras, 484, 3806
- Liivamägi et al. (2012) Liivamägi L. J., Tempel E., Saar E., 2012, aap, 539, A80
- Locatelli et al. (2018) Locatelli N., Vazza F., Domínguez-Fernández P., 2018, Galaxies, 6, 128
- Locatelli et al. (2021) Locatelli N., Vazza F., Bonafede A., Banfi S., Bernardi G., Gheller C., Botteon A., Shimwell T., 2021, aap, 652, A80
- Lovisari et al. (2015) Lovisari L., Reiprich T. H., Schellenberger G., 2015, aap, 573, A118
- Lovisari et al. (2021) Lovisari L., Ettori S., Gaspari M., Giles P. A., 2021, Universe, 7, 139
- Mahajan et al. (2011) Mahajan S., Haines C. P., Raychaudhury S., 2011, mnras, 412, 1098
- Mahajan et al. (2012) Mahajan S., Raychaudhury S., Pimbblet K. A., 2012, mnras, 427, 1252
- Maier et al. (2009) Maier A., Iapichino L., Schmidt W., Niemeyer J. C., 2009, apj, 707, 40
- Malkov & Drury (2001) Malkov M. A., Drury L. O., 2001, Reports on Progress in Physics, 64, 429
- Malu et al. (2016) Malu S., Datta A., Sandhu P., 2016, apss, 361, 255
- Malu et al. (2017) Malu S., Datta A., Colafrancesco S., Marchegiani P., Subrahmanyan R., Narasimha D., Wieringa M. H., 2017, Scientific Reports, 7, 16918
- Mandal et al. (2019) Mandal S., et al., 2019, aap, 622, A22
- Mandal et al. (2020) Mandal S., et al., 2020, aap, 634, A4
- Marinacci et al. (2018) Marinacci F., et al., 2018, mnras, 480, 5113
- Markevitch & Vikhlinin (2007) Markevitch M., Vikhlinin A., 2007, physrep, 443, 1
- McKean et al. (2015) McKean J., et al., 2015, in Advancing Astrophysics with the Square Kilometre Array (AASKA14). p. 84 (arXiv:1502.03362)
- McMullin et al. (2007) McMullin J. P., Waters B., Schiebel D., Young W., Golap K., 2007, in Shaw R. A., Hill F., Bell D. J., eds, Astronomical Society of the Pacific Conference Series Vol. 376, Astronomical Data Analysis Software and Systems XVI. p. 127
- McNamara et al. (2000) McNamara B. R., et al., 2000, apjl, 534, L135
- Miniati (2015) Miniati F., 2015, apj, 800, 60
- Miniati et al. (2000) Miniati F., Ryu D., Kang H., Jones T. W., Cen R., Ostriker J. P., 2000, apj, 542, 608
- Molnar (2016) Molnar S., 2016, Frontiers in Astronomy and Space Sciences, 2, 7
- Morandi & Sun (2016) Morandi A., Sun M., 2016, mnras, 457, 3266
- Murgia et al. (2004) Murgia M., Govoni F., Feretti L., Giovannini G., Dallacasa D., Fanti R., Taylor G. B., Dolag K., 2004, aap, 424, 429
- Murgia et al. (2010) Murgia M., Govoni F., Feretti L., Giovannini G., 2010, Astronomy & Astrophysics, 509, A86
- Murgia et al. (2011) Murgia M., et al., 2011, aap, 526, A148
- Nath & Roychowdhury (2002) Nath B. B., Roychowdhury S., 2002, MNRAS, 333, 145
- Nikiel-Wroczyński et al. (2019) Nikiel-Wroczyński B., et al., 2019, aap, 622, A23
- Norman & Bryan (1999) Norman M. L., Bryan G. L., 1999, in Röser H.-J., Meisenheimer K., eds, Lecture Notes in Physics, Berlin Springer Verlag Vol. 530, The Radio Galaxy Messier 87. p. 106 (arXiv:astro-ph/9802335), doi:10.1007/BFb0106425
- Nuza et al. (2012) Nuza S. E., Hoeft M., van Weeren R. J., Gottlöber S., Yepes G., 2012, mnras, 420, 2006
- Nuza et al. (2017) Nuza S. E., Gelszinnis J., Hoeft M., Yepes G., 2017, mnras, 470, 240
- O’Shea et al. (2004) O’Shea B. W., Bryan G., Bordner J., Norman M. L., Abel T., Harkness R., Kritsuk A., 2004, arXiv e-prints, pp astro–ph/0403044
- O’Sullivan et al. (2011a) O’Sullivan E., Giacintucci S., David L. P., Vrtilek J. M., Raychaudhury S., 2011a, mnras, 411, 1833
- O’Sullivan et al. (2011b) O’Sullivan E., Giacintucci S., David L. P., Gitti M., Vrtilek J. M., Raychaudhury S., Ponman T. J., 2011b, apj, 735, 11
- Offringa & Smirnov (2017) Offringa A. R., Smirnov O., 2017, MNRAS, 471, 301
- Offringa et al. (2010) Offringa A. R., de Bruyn A. G., Biehl M., Zaroubi S., Bernardi G., Pandey V. N., 2010, mnras, 405, 155
- Offringa et al. (2012) Offringa A. R., de Bruyn A. G., Zaroubi S., 2012, mnras, 422, 563
- Offringa et al. (2014) Offringa A. R., McKinley B., Hurley-Walker et al., 2014, MNRAS, 444, 606
- Ogiya et al. (2018) Ogiya G., Biernacki P., Hahn O., Teyssier R., 2018, arXiv e-prints, p. arXiv:1802.02177
- Oozeer et al. (2021) Oozeer N., Rudnick L., Bietenholz M. F., Venturi T., Knowles K., Kolokythas K., Mhlahlo N., 2021, Galaxies, 9, 102
- Osinga et al. (2021) Osinga E., et al., 2021, aap, 648, A11
- Pakmor et al. (2016) Pakmor R., Pfrommer C., Simpson C. M., Springel V., 2016, apjl, 824, L30
- Pandge et al. (2019) Pandge M. B., Sonkamble S. S., Parekh V., Dabhade P., Parmar A., Patil M. K., Raychaudhury S., 2019, apj, 870, 62
- Pandge et al. (2021) Pandge M. B., Sebastian B., Seth R., Raychaudhury S., 2021, mnras, 504, 1644
- Parekh et al. (2017a) Parekh V., Dwarakanath K. S., Kale R., Intema H., 2017a, mnras, 464, 2752
- Parekh et al. (2017b) Parekh V., Durret F., Padmanabh P., Pandge M. B., 2017b, mnras, 470, 3742
- Parekh et al. (2019) Parekh V., Laganá T. F., Thorat K., van der Heyden K., Iqbal A., Durret F., 2019, mnras, p. 2668
- Parekh et al. (2020) Parekh V., et al., 2020, mnras, 499, 404
- Parekh et al. (2021) Parekh V., Kincaid R., Hugo B., Ramaila A., Oozeer N., 2021, Galaxies, 9, 90
- Parekh et al. (2022) Parekh V., et al., 2022, mnras, 509, 3086
- Paul et al. (2011) Paul S., Iapichino L., Miniati F., Bagchi J., Mannheim K., 2011, apj, 726, 17
- Paul et al. (2017) Paul S., John R. S., Gupta P., Kumar H., 2017, mnras, 471, 2
- Paul et al. (2018) Paul S., Gupta P., John R. S., Pubjabi V., 2018, arXiv e-prints, p. arXiv:1803.10764
- Paul et al. (2019) Paul S., Salunkhe S., Datta A., Intema H. T., 2019, mnras, 489, 446
- Paul et al. (2020) Paul S., Salunkhe S., Sonkamble S., Gupta P., Mroczkowski T., Raychaudhury S., 2020, aap, 633, A59
- Paul et al. (2021) Paul S., Gupta P., Salunkhe S., Bhagat S., Sonkamble S., Hiray M., Dabhade P., Raychaudhury S., 2021, mnras, 506, 5389
- Pfrommer & Enßlin (2004a) Pfrommer C., Enßlin T. A., 2004a, mnras, 352, 76
- Pfrommer & Enßlin (2004b) Pfrommer C., Enßlin T. A., 2004b, aap, 413, 17
- Pfrommer et al. (2006) Pfrommer C., Springel V., Enßlin T. A., Jubelgas M., 2006, mnras, 367, 113
- Pimbblet et al. (2004) Pimbblet K. A., Drinkwater M. J., Hawkrigg M. C., 2004, mnras, 354, L61
- Pinzke et al. (2013) Pinzke A., Oh S. P., Pfrommer C., 2013, mnras, 435, 1061
- Pizzo et al. (2011) Pizzo R. F., de Bruyn A. G., Bernardi G., Brentjens M. A., 2011, aap, 525, A104
- Planck Collaboration et al. (2017) Planck Collaboration et al., 2017, VizieR Online Data Catalog, pp J/A+A/594/A27
- Popesso et al. (2004) Popesso P., Böhringer H., Brinkmann J., Voges W., York D. G., 2004, aap, 423, 449
- Porter & Raychaudhury (2005) Porter S. C., Raychaudhury S., 2005, mnras, 364, 1387
- Porter et al. (2015) Porter D. H., Jones T. W., Ryu D., 2015, apj, 810, 93
- Postman et al. (1988) Postman M., Geller M. J., Huchra J. P., 1988, aj, 95, 267
- Prasad et al. (2015) Prasad D., Sharma P., Babul A., 2015, ApJ, 811, 108
- Pratt et al. (2010) Pratt G. W., et al., 2010, A&A, 511, A85
- Quici et al. (2021) Quici B., et al., 2021, pasa, 38, e008
- Rahaman et al. (2021) Rahaman M., Raja R., Datta A., Burns J. O., Alden B., Rapetti D., 2021, mnras, 505, 480
- Rahaman et al. (2022) Rahaman M., Raja R., Datta A., Burns J. O., Rapetti D., 2022, mnras, 515, 2245
- Raja et al. (2020a) Raja R., et al., 2020a, mnras, 493, L28
- Raja et al. (2020b) Raja R., et al., 2020b, apj, 889, 128
- Raja et al. (2021) Raja R., Rahaman M., Datta A., van Weeren R. J., Intema H. T., Paul S., 2021, mnras, 500, 2236
- Rajpurohit et al. (2021a) Rajpurohit K., et al., 2021a, aap, 646, A135
- Rajpurohit et al. (2021b) Rajpurohit K., et al., 2021b, aap, 654, A41
- Rajpurohit et al. (2022) Rajpurohit K., et al., 2022, aap, 657, A2
- Rau & Cornwell (2011) Rau U., Cornwell T. J., 2011, aap, 532, A71
- Raychaudhury (1989) Raychaudhury S., 1989, nat, 342, 251
- Raychaudhury et al. (1991) Raychaudhury S., Fabian A. C., Edge A. C., Jones C., Forman W., 1991, mnras, 248, 101
- Reynolds et al. (2005) Reynolds C. S., McKernan B., Fabian A. C., Stone J. M., Vernaleo J. C., 2005, mnras, 357, 242
- Richard-Laferrière et al. (2020) Richard-Laferrière A., et al., 2020, mnras, 499, 2934
- Roettiger et al. (1999) Roettiger K., Stone J. M., Burns J. O., 1999, apj, 518, 594
- Roncarelli et al. (2018) Roncarelli M., et al., 2018, aap, 618, A39
- Roychowdhury et al. (2004) Roychowdhury S., Ruszkowski M., Nath B. B., Begelman M. C., 2004, ApJ, 615, 681
- Roychowdhury et al. (2005) Roychowdhury S., Ruszkowski M., Nath B. B., 2005, ApJ, 634, 90
- Rudnick & Blundell (2004) Rudnick L., Blundell K. M., 2004, in Reiprich T., Kempner J., Soker N., eds, The Riddle of Cooling Flows in Galaxies and Clusters of galaxies. p. 153
- Russell et al. (2019) Russell H. R., et al., 2019, mnras, 490, 3025
- Ruszkowski & Begelman (2002) Ruszkowski M., Begelman M. C., 2002, ApJ, 581, 223
- Rybicki & Lightman (1986) Rybicki G. B., Lightman A. P., 1986, Radiative Processes in Astrophysics
- Ryu et al. (2003) Ryu D., Kang H., Hallman E., Jones T. W., 2003, apj, 593, 599
- Ryu et al. (2008) Ryu D., Kang H., Cho J., Das S., 2008, Science, 320, 909
- Ryu et al. (2010) Ryu D., Kang H., Cho J., 2010, in Pogorelov N. V., Audit E., Zank G. P., eds, Astronomical Society of the Pacific Conference Series Vol. 429, Numerical Modeling of Space Plasma Flows, Astronum-2009. p. 39
- Salunkhe et al. (2022) Salunkhe S., Paul S., Krishna G., Sonkamble S., Bhagat S., 2022, aap, 664, A186
- Sarazin (1986) Sarazin C. L., 1986, Rev. Mod. Phys., 58, 1
- Sarazin (2002) Sarazin C. L., 2002, in Feretti L., Gioia I. M., Giovannini G., eds, Astrophysics and Space Science Library Vol. 272, Merging Processes in Galaxy Clusters. pp 1–38 (arXiv:astro-ph/0105418), doi:10.1007/0-306-48096-4_1
- Savini et al. (2018) Savini F., et al., 2018, mnras, 478, 2234
- Savini et al. (2019) Savini F., et al., 2019, aap, 622, A24
- Saxton et al. (2001) Saxton C. J., Sutherland R. S., Bicknell G. V., 2001, apj, 563, 103
- Schekochihin et al. (2004) Schekochihin A. A., Cowley S. C., Taylor S. F., Maron J. L., McWilliams J. C., 2004, apj, 612, 276
- Schellenberger et al. (2017) Schellenberger G., Vrtilek J. M., David L., O’Sullivan E., Giacintucci S., Johnston-Hollitt M., Duchesne S. W., Raychaudhury S., 2017, apj, 845, 84
- Schellenberger et al. (2022) Schellenberger G., et al., 2022, apj, 925, 91
- Schlickeiser et al. (1987) Schlickeiser R., Sievers A., Thiemann H., 1987, aap, 182, 21
- Schmidt et al. (2009) Schmidt W., Federrath C., Hupp M., Kern S., Niemeyer J. C., 2009, aap, 494, 127
- Schulz et al. (2020) Schulz R., Dijkema T. J., Molenaar G., 2020, Apercal: Pipeline for the Westerbork Synthesis Radio Telescope Apertif upgrade (ascl:2002.010)
- Seta & Federrath (2021) Seta A., Federrath C., 2021, Physical Review Fluids, 6, 103701
- Seta et al. (2020) Seta A., Bushby P. J., Shukurov A., Wood T. S., 2020, Physical Review Fluids, 5, 043702
- Seth & Raychaudhury (2020) Seth R., Raychaudhury S., 2020, mnras, 497, 466
- Shimwell et al. (2019) Shimwell T. W., et al., 2019, aap, 622, A1
- Shimwell et al. (2022) Shimwell T. W., et al., 2022, aap, 659, A1
- Sijbring (1993) Sijbring L. G., 1993, PhD thesis, University of Groningen, Netherlands
- Silpa et al. (2021) Silpa S., Kharb P., Harrison C. M., Ho L. C., Jarvis M. E., Ishwara-Chandra C. H., Sebastian B., 2021, mnras, 507, 991
- Skillman et al. (2008) Skillman S. W., O’Shea B. W., Hallman E. J., Burns J. O., Norman M. L., 2008, apj, 689, 1063
- Skillman et al. (2011) Skillman S. W., Hallman E. J., O’Shea B. W., Burns J. O., Smith B. D., Turk M. J., 2011, apj, 735, 96
- Slee et al. (2001) Slee O. B., Roy A. L., Murgia M., Andernach H., Ehle M., 2001, aj, 122, 1172
- Sommer & Basu (2014) Sommer M. W., Basu K., 2014, mnras, 437, 2163
- Springel et al. (2006) Springel V., Frenk C. S., White S. D. M., 2006, nat, 440, 1137
- Stroe et al. (2014a) Stroe A., et al., 2014a, mnras, 441, L41
- Stroe et al. (2014b) Stroe A., Harwood J. J., Hardcastle M. J., Röttgering H. J. A., 2014b, mnras, 445, 1213
- Stroe et al. (2016) Stroe A., et al., 2016, MNRAS, 455, 2402
- Su et al. (2017) Su Y., Nulsen P. E. J., Kraft R. P., Forman W. R., Jones C., Irwin J. A., Randall S. W., Churazov E., 2017, apj, 847, 94
- Subramanian et al. (2006) Subramanian K., Shukurov A., Haugen N. E. L., 2006, mnras, 366, 1437
- Sur (2019) Sur S., 2019, mnras, 488, 3439
- Sur et al. (2018) Sur S., Bhat P., Subramanian K., 2018, mnras, 475, L72
- Sur et al. (2021) Sur S., Basu A., Subramanian K., 2021, mnras, 501, 3332
- Swarup et al. (1991) Swarup G., Ananthakrishnan S., Kapahi V. K., Rao A. P., Subrahmanya C. R., Kulkarni V. K., 1991, Current Science, 60, 95
- Sweijen et al. (2022) Sweijen F., et al., 2022, Nature Astronomy, 6, 350
- Tarenghi et al. (1979) Tarenghi M., Tifft W. G., Chincarini G., Rood H. J., Thompson L. A., 1979, apj, 234, 793
- Tasse (2014) Tasse C., 2014, arXiv e-prints, p. arXiv:1410.8706
- Tasse et al. (2018) Tasse C., et al., 2018, aap, 611, A87
- Tempel et al. (2014) Tempel E., Stoica R. S., Martínez V. J., Liivamägi L. J., Castellan G., Saar E., 2014, mnras, 438, 3465
- Tripp et al. (2000) Tripp T. M., Savage B. D., Jenkins E. B., 2000, apjl, 534, L1
- Tully et al. (2014) Tully R. B., Courtois H., Hoffman Y., Pomarède D., 2014, nat, 513, 71
- Vacca et al. (2018) Vacca V., et al., 2018, mnras, 479, 776
- Valdarnini (2011) Valdarnini R., 2011, aap, 526, A158
- Vazza (2010) Vazza F., 2010, in Galaxy Clusters: Observations, Physics and Cosmology. p. 24
- Vazza et al. (2006) Vazza F., Tormen G., Cassano R., Brunetti G., Dolag K., 2006, mnras, 369, L14
- Vazza et al. (2009a) Vazza F., Brunetti G., Gheller C., 2009a, mnras, 395, 1333
- Vazza et al. (2009b) Vazza F., Brunetti G., Kritsuk A., Wagner R., Gheller C., Norman M., 2009b, aap, 504, 33
- Vazza et al. (2011) Vazza F., Brunetti G., Gheller C., Brunino R., Brüggen M., 2011, aap, 529, A17
- Vazza et al. (2012a) Vazza F., Brüggen M., Gheller C., Brunetti G., 2012a, mnras, 421, 3375
- Vazza et al. (2012b) Vazza F., Roediger E., Brüggen M., 2012b, aap, 544, A103
- Vazza et al. (2015) Vazza F., Ferrari C., Brüggen M., Bonafede A., Gheller C., Wang P., 2015, aap, 580, A119
- Vazza et al. (2017) Vazza F., Jones T. W., Brüggen M., Brunetti G., Gheller C., Porter D., Ryu D., 2017, mnras, 464, 210
- Vazza et al. (2018) Vazza F., Brunetti G., Brüggen M., Bonafede A., 2018, mnras, 474, 1672
- Vazza et al. (2021a) Vazza F., et al., 2021a, Galaxies, 9, 109
- Vazza et al. (2021b) Vazza F., Wittor D., Brunetti G., Brüggen M., 2021b, aap, 653, A23
- Venturi et al. (2007a) Venturi T., Giacintucci S., Brunetti G., Cassano R., Bardelli S., Dallacasa D., Setti G., 2007a, aap, 463, 937
- Venturi et al. (2007b) Venturi T., Giacintucci S., Brunetti G., Cassano R., Bardelli S., Dallacasa D., Setti G., 2007b, aap, 463, 937
- Venturi et al. (2008a) Venturi T., Giacintucci S., Dallacasa D., Cassano R., Brunetti G., Bardelli S., Setti G., 2008a, aap, 484, 327
- Venturi et al. (2008b) Venturi T., Giacintucci S., Dallacasa D., Cassano R., Brunetti G., Bardelli S., Setti G., 2008b, aap, 484, 327
- Venturi et al. (2013) Venturi T., Giacintucci S., Dallacasa D., Cassano R., Brunetti G., Macario G., Athreya R., 2013, aap, 551, A24
- Venturi et al. (2017) Venturi T., et al., 2017, aap, 603, A125
- Venturi et al. (2022) Venturi T., et al., 2022, aap, 660, A81
- Vernstrom et al. (2017) Vernstrom T., Gaensler B. M., Brown S., Lenc E., Norris R. P., 2017, MNRAS, 467, 4914
- Vikhlinin et al. (2006) Vikhlinin A., Kravtsov A., Forman W., Jones C., Markevitch M., Murray S. S., Van Speybroeck L., 2006, apj, 640, 691
- Völk & Atoyan (1999) Völk H. J., Atoyan A. M., 1999, Astroparticle Physics, 11, 73
- Wiener et al. (2017) Wiener J., Pfrommer C., Peng Oh S., 2017, mnras, 467, 906
- Wilber et al. (2019) Wilber A., et al., 2019, aap, 622, A25
- Wilber et al. (2020) Wilber A. G., Johnston-Hollitt M., Duchesne S. W., Tasse C., Akamatsu H., Intema H., Hodgson T., 2020, pasa, 37, e040
- Wilcots (2004) Wilcots E., 2004, nar, 48, 1281
- Willson (1970) Willson M. A. G., 1970, mnras, 151, 1
- Wittor et al. (2019) Wittor D., Hoeft M., Vazza F., Brüggen M., Domínguez-Fernández P., 2019, mnras, 490, 3987
- Wittor et al. (2021a) Wittor D., Hoeft M., Brüggen M., 2021a, arXiv e-prints, p. arXiv:2112.00023
- Wittor et al. (2021b) Wittor D., Ettori S., Vazza F., Rajpurohit K., Hoeft M., Domínguez-Fernández P., 2021b, mnras, 506, 396
- Xu et al. (2012) Xu H., et al., 2012, apj, 759, 40
- Yan & Lazarian (2002) Yan H., Lazarian A., 2002, prl, 89, 281102
- Yan & Lazarian (2004) Yan H., Lazarian A., 2004, apj, 614, 757
- Yan et al. (2008) Yan H., Lazarian A., Petrosian V., 2008, apj, 684, 1461
- Zeldovich et al. (1990) Zeldovich Y. B., Ruzmaikin A. A., Sokoloff D. D., 1990, The almighty chance, doi:10.1142/0862.
- da Costa et al. (1986) da Costa L. N., Numes M. A., Pellegrini P. S., Willmer C., Chincarini G., Cowan J. J., 1986, aj, 91, 6
- de Gasperin et al. (2014) de Gasperin F., van Weeren R. J., Brüggen M., Vazza F., Bonafede A., Intema H. T., 2014, mnras, 444, 3130
- de Gasperin et al. (2017a) de Gasperin F., et al., 2017a, Science Advances, 3, e1701634
- de Gasperin et al. (2017b) de Gasperin F., et al., 2017b, aap, 597, A15
- de Gasperin et al. (2022) de Gasperin F., et al., 2022, aap, 659, A146
- de Graaff et al. (2019) de Graaff A., Cai Y.-C., Heymans C., Peacock J. A., 2019, aap, 624, A48
- de Lapparent et al. (1988) de Lapparent V., Geller M. J., Huchra J. P., 1988, apj, 332, 44
- Šlaus et al. (2020) Šlaus B., et al., 2020, aap, 638, A46
- van Haarlem et al. (2013) van Haarlem M. P., et al., 2013, Astronomy & astrophysics, 556, A2
- van Weeren et al. (2009) van Weeren R. J., et al., 2009, aap, 506, 1083
- van Weeren et al. (2010a) van Weeren R. J., Röttgering H. J. A., Brüggen M., Hoeft M., 2010a, Science, 330, 347
- van Weeren et al. (2010b) van Weeren R. J., Röttgering H. J. A., Brüggen M., Hoeft M., 2010b, Science, 330, 347
- van Weeren et al. (2014) van Weeren R. J., et al., 2014, apjl, 786, L17
- van Weeren et al. (2016) van Weeren R. J., et al., 2016, apj, 818, 204
- van Weeren et al. (2019) van Weeren R. J., de Gasperin F., Akamatsu H., Brüggen M., Feretti L., Kang H., Stroe A., Zandanel F., 2019, ssr, 215, 16
- van Weeren et al. (2021) van Weeren R. J., et al., 2021, aap, 651, A115
- van de Weygaert & Bond (2008) van de Weygaert R., Bond J. R., 2008, in Plionis M., López-Cruz O., Hughes D., eds, , Vol. 740, A Pan-Chromatic View of Clusters of Galaxies and the Large-Scale Structure. p. 335, doi:10.1007/978-1-4020-6941-3_10