Thunderstorm nowcasting with deep learning:
a multi-hazard data fusion model
Abstract
Predictions of thunderstorm-related hazards are needed in several sectors, including first responders, infrastructure management and aviation. To address this need, we present a deep learning model that can be adapted to different hazard types. The model can utilize multiple data sources; we use data from weather radar, lightning detection, satellite visible/infrared imagery, numerical weather prediction and digital elevation models. We demonstrate the ability of the model to predict lightning, hail and heavy precipitation probabilistically on a 1 km resolution grid, with a temporal resolution of 5 min and lead times up to 60 min. Shapley values quantify the importance of the different data sources, showing that the weather radar products are the most important predictors for all three hazard types.
Geophysical Research Letters
Federal Office of Meteorology and Climatology MeteoSwiss, Locarno-Monti, Switzerland
Jussi Leinonenjussi.leinonen@meteoswiss.ch
We present a deep learning model for nowcasting thunderstorm hazards, and demonstrate it for lightning, hail and heavy precipitation.
The model can provide probabilistic warnings of these hazards on a two-dimensional grid.
We analyze the importance of the different data sources used in the model using explainable artificial intelligence methods.
Plain Language Summary
Thunderstorms are hazardous to both people and property through various extreme weather phenomena. Predicting these hazards allows individual people, infrastructure managers and emergency services to take action in advance. To serve their needs, we use a model based on an artificial intelligence (AI) to predict the probability of the hazards occurring at a given time and place during the next 60 minutes. The model uses multiple sources of weather observations and predictions to construct the predictions, and can be adapted to function also when some of these sources are unavailable, increasing its reliability. We show that the model can predict the occurrence of lightning, hail and heavy precipitation, detecting and predicting the motion of thunderstorms as well as whether they are increasing or decreasing in severity. We use explainable AI methods to determine how much each of the data sources contributes to the predictions, showing that weather radar observations are the most important source of predictors.
1 Introduction
Thunderstorms frequently endanger lives and cause damage to property through several distinct physical processes. Lightning are directly hazardous to humans, igniting fires and disrupting electric infrastructure and aviation [Holle (\APACyear2014), Holle (\APACyear2016)]. The heavy rain frequently produced by these storms can cause flash floods and trigger landslides [Smith \BOthers. (\APACyear1996), Davis (\APACyear2001)]. Thunderstorms also often produce hail, which can damage buildings, vehicles, crops and forests and is particularly dangerous to flying aircraft [Hohl \BOthers. (\APACyear2002), Battaglia \BOthers. (\APACyear2019)]. They are furthermore frequently associated with strong, gusty wind [Kelly \BOthers. (\APACyear1985), Dotzek (\APACyear2003), Allen \BBA Allen (\APACyear2016)]. Thunderstorms are relatively compact objects that develop rapidly, and consequently, the effects of these hazards are sudden and highly localized. Timely, accurate and actionable short-term predictions of them are needed to issue early warnings to the general population, emergency services and infrastructure operators.
Numerical weather prediction (NWP) can forecast thunderstorm occurrence and their typical intensity level in a wider area, but have difficulty predicting the exact time and location where thunderstorms will appear [Sun \BOthers. (\APACyear2014)]. On the very short term of minutes to a few hours, one can instead use nowcasting: statistical prediction using the latest observational data. In contrast to NWP models that take hours to run, nowcasting models are typically designed to produce a prediction in seconds, making them suitable for time-critical short-term warning systems. The advantages of the two approaches can also be combined in a seamless forecast. As nowcasting systems tend to be accurate on the short term but lose predictive power faster than NWP models, seamless forecasts typically use nowcasting on the short term, NWP forecasts on the long term, and a combination of the two in between [Nerini (\APACyear2019), Nerini \BOthers. (\APACyear2019)].
In the recent years, deep learning (DL) has been increasingly adopted in thunderstorm nowcasting algorithms [Zhou \BOthers. (\APACyear2020), Geng \BOthers. (\APACyear2021), Pan \BOthers. (\APACyear2021), Cuomo \BBA Chandrasekar (\APACyear2022)]. \citeALeinonen2022Lightning (henceforth LHG2022) introduced a method based on recurrent-convolutional DL to produce grid-based nowcasts of lightning occurrence at temporal resolution over using data from multiple sources. The developed network architecture was generalizable and had potential for adaptation to nowcast other hazards. Here, we generalize the architecture and methodology to nowcast different thunderstorm hazards with the same network architecture. We demonstrate the following capabilities:
-
1.
Predicting multiple hazards — namely, hail and heavy precipitation in addition to lightning — using the same network structure trained with different target variables.
-
2.
Training the network with a probabilistic rather than deterministic target.
-
3.
Providing warnings for multiple threshold levels at once.
-
4.
Producing warnings based on accumulation over a period longer than the native temporal resolution of the DL model.
Similarly to \citeALeinonen2021DataSources, we also investigate how the different data sources contribute to predicting the various hazards and how these contributions vary with increasing nowcast lead time.
2 Data
To train the DL model, we used the dataset of \citeALeinonen2022Weights. Below, we summarize the contents and processing of the dataset. For further details, we direct the reader to the description in LHG2022.
2.1 Data sources and processing
We trained the model to combine information from five different sources of data:
- Weather radar
-
observations were collected from the Swiss operational network [Germann \BOthers. (\APACyear2016), Germann \BOthers. (\APACyear2022)]. These data include radar-measured information about the precipitation rate and the vertical structure of the radar reflectivity, such as echo top heights and the vertically integrated liquid water content, at horizontal resolution.
- Geostationary satellite
-
imagery was obtained from the Spinning Enhanced Visible and InfraRed Imager [<]SEVIRI;¿Schmid2000SEVIRI on the MeteoSat Second Generation 3 (MSG-3) satellite. We used the radiances and brightness temperatures from the visible and infrared (IR) bands; the native resolution of these in the study area is approximately for the high-resolution visible (HRV) band and for the others. The bands that consist mostly of reflected solar radiation were normalized with the function , where is the solar zenith angle; these bands are unavailable at night. Furthermore, we used the Nowcasting Satellite Application Facility (NWCSAF) cloud top height, cloud top temperature, cloud optical thickness and cloud top phase products [Derrien \BBA Le Gléau (\APACyear2005), Hamann \BOthers. (\APACyear2014), Le Gléau (\APACyear2016)].
- Lightning detection
-
measurements were collected by the European Cooperation for Lightning Detection (EUCLID) network of lightning antennas [Schulz \BOthers. (\APACyear2016), Poelman \BOthers. (\APACyear2016)] and delivered by Météorage. The original data consist of locations and various properties of lightning strikes. We aggregated these into maps of lightning density and current density, as well as binary occurrence maps used in lightning prediction.
- NWP
-
forecasts originated from the Consortium for Small Scale Modelling (COSMO) model [Baldauf \BOthers. (\APACyear2011)] used operationally at MeteoSwiss. We selected various COSMO outputs relevant to thunderstorms, such as the convective available potential energy (CAPE).
- Digital elevation model
-
(DEM) data were from the Advanced Spaceborne Thermal Emission and Reflection Radiometer (ASTER) global DEM [Abrams \BOthers. (\APACyear2020)] used to model topography in COSMO.
2.2 Spatiotemporal characteristics
The data were collected from an area centered on Switzerland and containing all Swiss territory as well as surrounding regions, in the east–west direction and north–south (see Supporting Fig. S1). The study area is based on the range of the Swiss operational radar network. The region is characterized by highly variable topography, ranging from flat plains to mountains over high. The activity of thunderstorms in the region is among the highest in Europe and they regularly cause large property losses, injuries and even deaths [Hilker \BOthers. (\APACyear2009), Ozturk \BOthers. (\APACyear2018), Taszarek \BOthers. (\APACyear2019), Feldmann \BOthers. (\APACyear2021), Kopp \BOthers. (\APACyear2022)].
The data collection period ranged from April to September of 2020. In order to avoid training the model with too many nonconvective cases, we downselected the data to prioritize locations and times near convective activity: For every region where the radar-derived rain rate exceeded , we included a box of spatially and temporally in the dataset. Approximately different training samples can be generated from the data, although there is considerable overlap between these; see LHG2022 for more details on the sampling. of the data were used for validation, another for testing, and the rest for training; to minimize correlation between the subsets, each day in the time period was assigned entirely to only one of them.
The data were processed to temporal resolution, the native resolution of the radar and satellite datasets. The lightning data were aggregated to resolution. The NWP forecasts are provided at a temporal resolution of and were interpolated linearly to steps. We used spatial resolution for the radar, lightning, DEM and HRV, and for the remaining variables.
2.3 Target variables
In this study, we generalized the DL model of LHG2022 to predict hail and heavy precipitation in addition to lightning. In order to keep our findings compatible with LHG2022, we define lightning occurrence identically: as a binary variable that is set to if lightning occurred within of the grid point within the last , and otherwise.
Direct measurements of hail are only available from individual stations, but occurrence of hail is well indicated by the difference of the radar echo top height and the freezing level height [Waldvogel \BOthers. (\APACyear1979), Foote \BOthers. (\APACyear2005), Barras \BOthers. (\APACyear2019)]. For hail, our target variable is the Probability of Hail (POH) product from the weather radar data. This uses the formula of \citeAFoote2005Hail for the probability of hail occurrence. We preserve the probabilistic nature of the POH and define our target as a continuous value in the range .
For heavy precipitation, we derive the target from CombiPrecip [Sideris, Gabella, Erdin\BCBL \BBA Germann (\APACyear2014), Sideris, Gabella, Sassi\BCBL \BBA Germann (\APACyear2014)], which combines radar and raingauge observations to obtain a more accurate and unbiased estimate of precipitation than that of radar alone. As our motivation is to develop a model for issuing short-term warnings of extreme weather, we treat precipitation prediction as a multiclass classification problem, where the model outputs the probabilities of being between pre-defined threshold levels. We chose thresholds of , , and aggregated over at each grid point, motivated by the warning levels used by MeteoSwiss forecasters. Recognizing that there is inherent uncertainty in the CombiPrecip estimate, we treat it probabilistically and assign probabilities to each class as
| (1) |
(with ) where is a lognormal probability distribution function. Since CombiPrecip is designed to eliminate systematic biases in the precipitation measurement, we interpret the CombiPrecip estimate as the expected value . To derive the variance, we analyzed a collection of raingauge measurements collocated with CombiPrecip such that the raingauge used for comparison was omitted from the CombiPrecip analysis. Using the method of \citeACiach1999RadarError to separate the error due to the lack of raingauge representativeness from that due to uncertainty in the radar measurement, we approximate the standard deviation as
| (2) |
Given and , the parameters of can be computed. We used this probabilistic treatment of precipitation to improve the ability of the model to capture extreme events since, for example, a value of gives a nonzero probability also of precipitation exceeding . Since most damages caused by rain are due to accumulation of rainwater over times longer than our resolution of , we predict the -h accumulated precipitation rather than that at each time step.
3 Methods
3.1 Neural network
LHG2022 described a recurrent-convolutional DL model for predicting lightning occurrence (see Supporting Fig. S2), based on the model [Leinonen (\APACyear2021\APACexlab\BCnt1), Leinonen (\APACyear2021\APACexlab\BCnt2)] used in the Weather4cast 2021 competition [Herruzo \BOthers. (\APACyear2021)] where it outperformed competing architectures such as U-Nets and transformer architectures. We adopt this architecture for each hazard, inheriting the best-performing hyperparameters from LHG2022. The model is built slightly differently for each combination of input data sources, such that only the parts of the model necessary for those inputs are included.
The main architectural change to the DL model in this study is that the prediction of heavy precipitation only uses the last time step of the final layer, which is trained to predict the entire -h accumulation. Furthermore, in contrast to LHG2022 we did not perform model ensembling [Ganaie \BOthers. (\APACyear2022)] due to the required computational cost.
For lightning, we utilize focal loss [Lin \BOthers. (\APACyear2017)] with focusing parameter as the training loss function, so that our results are comparable with LHG2022 where this loss was also adopted. The hail and precipitation targets are defined probabilistically and it is not clear how the focal loss generalizes to such cases. Thus, we use cross entropy (CE) loss, which also performed well in LHG2022 and can be straightforwardly defined for probabilistic targets as:
| (3) |
where is the predicted probability, is the target probability and the sum is over the possible classes . In the case of hail, there are two classes (hail or no hail), while with precipitation, there are four classes as defined by Eq. (1).
Training all combinations of targets and data sources takes approximately one month on eight Nvidia V100 GPUs. For each target and data source combination, we used the same model architecture and hyperparameters. Ideally, these should be tuned separately for each case to optimize performance, but this would require training each model many times, which would be infeasible with the available resources.
3.2 Analysis
We assign a value for the importance of each data source for predicting a hazard, thus making the prediction more explainable, using the Shapley value, introduced by \citeAShapley1951 and described in detail by e.g. \citeA[chapter 9.5]Molnar2022Shapley. It describes the contribution of a given predictor (or, in our case, a data source) to improving a metric. Given predictors, the Shapley value of a predictor for improving the metric is
| (4) |
where the sum is taken over predictor combinations that do not contain . Thus, is a weighted average of marginal contributions , that is, improvements in the metric resulting from adding the predictor to a set of predictors that did not previously contain it. Consequently, has the same units as . The weights are determined using game theory to satisfy multiple properties desirable for a fair interpretation of the value of each predictor:
-
1.
The sum of the Shapley values of all predictors is equal to the improvement in the metric given by the complete set of predictors.
-
2.
Two predictors that contribute equally have equal Shapley values.
-
3.
A predictor that does not change the metric has a Shapley value of .
-
4.
The Shapley value of a predictor for an average of multiple models is the average of the Shapley values of that predictor for the individual models.
Determining the Shapley values using Eq. 4 requires the computation of for each subset , including the empty set. Since we consider the five data sources described in Sect. 2.1, we need to train the model times, and therefore can compute the Shapley values directly without resorting to approximations, which become necessary for larger numbers of predictors.
4 Results and discussion
4.1 Prediction
Examples of the prediction of lightning, hail and heavy precipitation are shown in Fig. 1. The example of lightning prediction in Fig. 1a shows a case where the location of lightning activity in relatively slowly moving thunderstorms is forecast by the model for the 60-min period. A more extensive discussion of similar cases can be found in LHG2022.

b) As (a), but showing the observed and predicted POH instead of lightning. The HRV is not shown as the case occurs at night.
c) As (a) and (b), but showing the probability of accumulated precipitation in the next 60 minutes exceeding . Consequently, only one future time step is shown.
An example of the prediction of hail is shown in Fig. 1b. The model predicts the imminent occurrence of hail on the top half of the image even though the past time steps contain very few pixels with nonzero POH on the top half. Compared to the lightning prediction, the shorter time scale of the predictability of hail is apparent in this example, as the predicted location of the hail becomes very diffuse at the time step. Nevertheless, the model appears able to distinguish wider areas with a general risk of hail from those where hail is very unlikely (e.g. on the top left).
Figure 1c shows a case of the prediction of heavy precipitation. Since we predict the total accumulation of precipitation during the next , we only show a single prediction instead of multiple time steps. As described in Sect. 2.3, the probability of precipitation is predicted in four classes. For the purposes of visualization, we sum the probabilities of the last three classes to visualize the probability of . Also in this case, we see that the model predicts the location of the heaviest precipitation by assigning high probabilities of exceeding to those areas where the observation shows that this is actually the case.
Over the entire test dataset, we achieve the following pixelwise critical success indices (CSI) when the warning threshold is selected to give optimal CSI:
-
•
Lightning: (), (), (), ()
-
•
Hail: (), (), (), ()
-
•
Rain ( accumulation): (), (), ()
In agreement with the example cases, hail and precipitation are more challenging to predict than lightning. This is explained by time scales of the different variables: The correlation time scales of the variables are for lightning, for hail and for . The longer time scale of lightning is at least partially due to the smoothing caused by the “within in the last ” definition, in contrast to the precipitation and hail that are predicted pixelwise. We have included further metrics and an autocorrelation plot in the Supporting Information to support this analysis. The confusion matrices for all models are available in \citeALeinonen2022Pretrained.
4.2 Data source importance
Figure 2 shows the loss over the test dataset for lightning, hail and precipitation prediction. In the losses for lightning (Fig. 2a), one can see the importance of the radar observations from the leftmost two columns, and the importance of the lightning observations from the first, second, fourth and sixth rows, which correspond to combinations of data sources where lightning observations are included. Satellite observations are less powerful predictors than those from radar, but can still perform well, especially when supported by lightning observations. The model based only on NWP forecasts has considerable skill over the ignorant model on its own, but it does not seem to add much to the skill of the models that make use of observational data. The benefits from the DEM appear to be minimal at best.
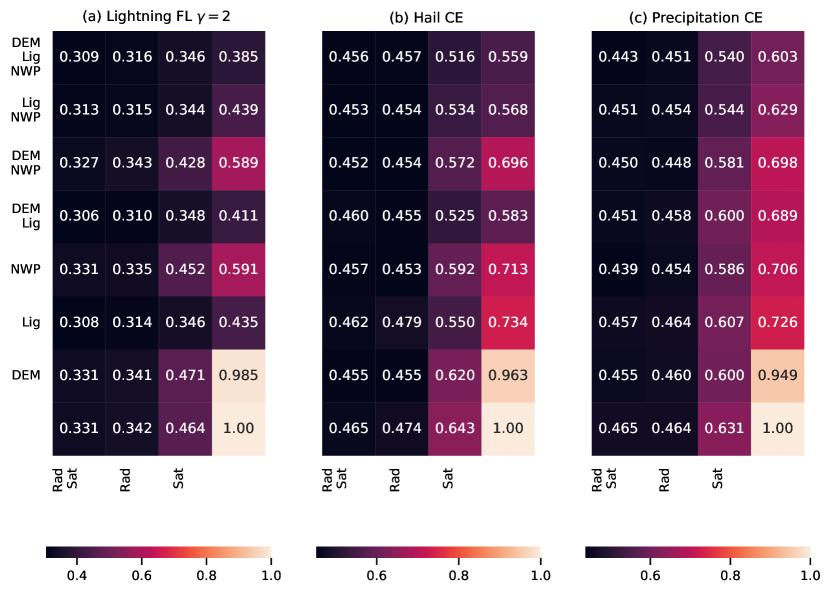
The pattern of losses for hail (Fig. 2b) is similar to that for lightning, except the radar observations are more dominant. In fact, all models using the radar data perform substantially better than any of the models without them. The lightning observations are less useful for hail than for predicting lightning itself, but still beneficial especially when radar is not available. The satellite observations achieve reasonable skill when complemented by other observations, but do not have a major impact if radar data are already available. Meanwhile, the NWP data yield small but consistent improvements to the loss, as does the DEM, which is somewhat more helpful for predicting hail than lightning.
The results for heavy precipitation are shown in Fig. 2c. The relative benefit of radar data is somewhat higher than in the case of hail, while that of lightning data is slightly smaller. Otherwise, the patterns are very similar to those for hail.
4.3 Shapley values
In Fig. 3, we show the Shapley values as quantitative indicators of the total importance of each data source, and also plot them against the forecast lead time, allowing us to assess how the importance of each data source changes.
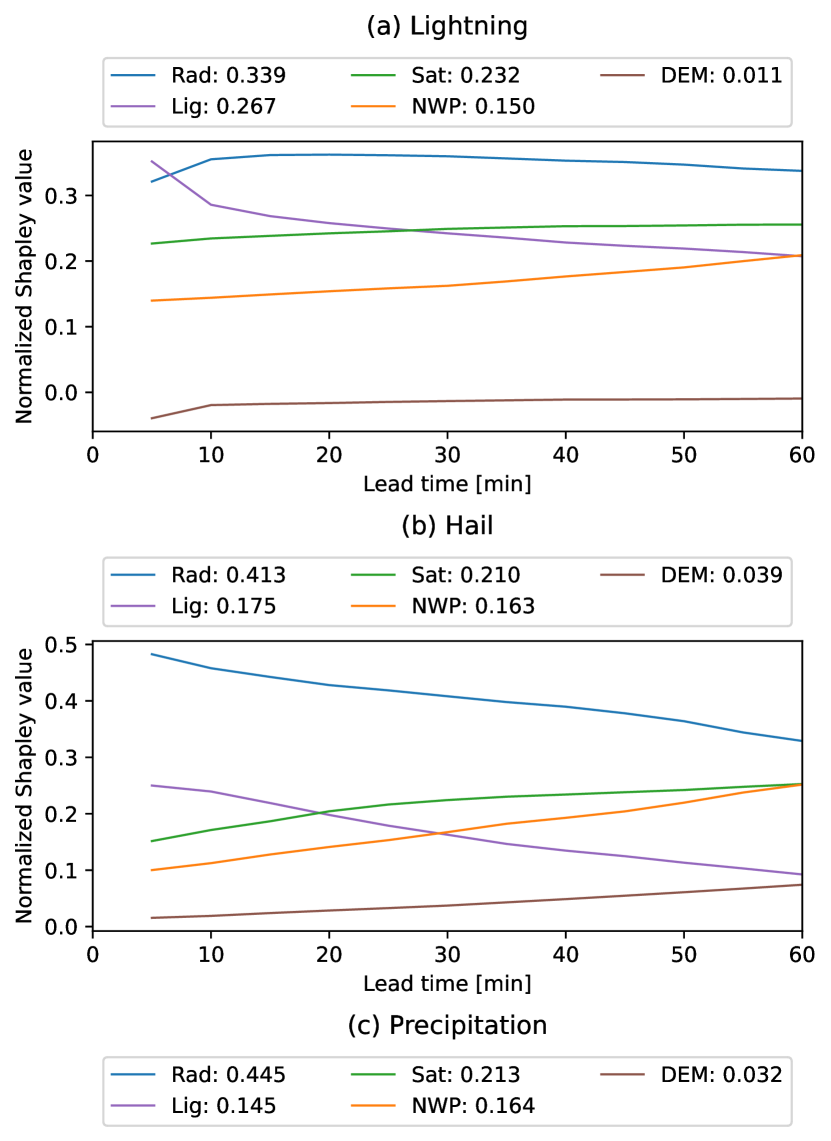
The Shapley values for lightning prediction (Fig. 3a) agree with our qualitative assessment in Sect. 4.2. Radar is the most important source, followed by the lightning and satellite data. NWP is less important but nevertheless clearly beneficial. The importance of the DEM is minimal; it is even computed as slightly negative for the first time step, but a closer inspection of the data suggests that this is because a few models using the DEM have coincidentally converged to somewhat worse results due to the stochastic nature of the DL optimization process. The lightning data drop sharply in importance at first; this is because at the first prediction step, the observation directly provides lightning occurrence for the first of the averaging interval. Then, a more gradual decline in the importance of the lightning data follows. The drop in the lightning importance is compensated at first by increase in the relative importance of the radar, which then turns into a slight decline around lead time. The importance of satellite and NWP data instead display a positive trend, eventually passing the lightning data.
For hail (Fig. 3b), the Shapley values have a similar pattern to those of lightning prediction, with the radar considered even more important than for lightning prediction. Satellite and lightning observations are of similar importance when considered over the whole time period, but they display clearly opposite trends. The importance of the lightning data is second only to radar at short lead times, but declines rapidly; this may be connected to the known “lightning jump” phenomenon [Williams \BOthers. (\APACyear1999), Schultz \BOthers. (\APACyear2009), Farnell \BOthers. (\APACyear2017)] where a sudden increase in lightning precedes hail by –. Meanwhile, the relative importance of satellite imagery increases over time. This, along with the similar result for lightning prediction, indicates that satellite visible/IR observations have predictive power over longer timescales than radar observations. NWP data provide a similar benefit as for lightning and, as expected, increase in importance over time. The DEM importance is small but more notable than for lightning.
5 Discussion and conclusions
In this paper, we have demonstrated a deep learning model architecture that can use a combination of many data sources to predict various hazards from thunderstorms. The model produces probabilistic predictions, allowing end users to choose thresholds for issuing warnings and taking protective action, adapting the threshold to their tolerance for missed events and false alarms. In this work, we considered warnings for lightning, hail and heavy precipitation. The hazard probabilities are produced at a resolution of / . Lightning occurrence is considered as a binary event, while hail prediction is trained with the radar-derived probability of hail as the target variable. Meanwhile, heavy precipitation is predicted using probabilities of four classes and aggregated into 60-min accumulated precipitation. We chose these different approaches for different hazards in order to demonstrate the flexibility of the model, which can be adapted to the users’ needs with minor changes to the training procedure.
Of the three hazard types considered, lightning predictions are the most accurate. Hail predictions have lower accuracy and are not recommended to be used at long lead times at single-pixel scales due to the low prediction accuracy, but they can still indicate the probable occurrence of hail somewhere in a wider area, as demonstrated in Supporting Fig. S10. Precipitation predictions are qualitatively different from the others because they are given for the 60-min accumulation, but their accuracy can be summarized as being between the hail and lightning predictions.
The data source importance analysis shows that the ground-based radar data are the most important predictor for all three hazards considered, and may be sufficient on their own to make accurate predictions in many applications, especially for heavy precipitation. Lightning detection is important for predicting lightning, but also useful for predicting hail (especially at short lead times) and precipitation. Satellite data are beneficial for all three targets; while they have a lower predictive capability than radar, they retain their predictive power over longer timescales, especially in the case of predicting hail. Geostationary satellite data are also available almost everywhere on Earth, allowing predictions to be made when radar observations are unavailable due to lack of installed radars or temporary outages. Indeed, the good performance of the combination of satellite imagery and lightning data at predicting lightning occurrence (Lig+Sat in Fig. 2a) suggests that high-performance lightning nowcasting is feasible globally using the latest generation of geostationary weather satellites, e.g. GOES-R series or MeteoSat Third Generation, which have both a visible/IR imager and a lightning mapper. The NWP data are useful for all three targets and, as expected, their relative importance increases at longer lead times. Meanwhile, the DEM data improve the prediction marginally but consistently. The ability of the model to use different combinations of data sources not only improves prediction accuracy, but also increases the resilience of the model in operational use: A model trained with a different combination of data sources can be substituted if some of the data sources are unavailable or delayed.
We recommend later studies to investigate whether the forecast can be improved, particularly at longer lead times, with model architecture improvements but also inputs that better constrain the state of the atmosphere, such as 3D data, polarimetric radar, higher-resolution satellite observations, and data from rapid-update NWP models with complex microphysics. It would be ideal to predict strong winds caused by thunderstorms as well. Unfortunately, we lack a clear “ground truth” variable giving the surface wind everywhere on the grid. Wind is measured at weather stations, but these are not very representative especially in thunderstorm conditions. Meanwhile, Doppler radar measurements indicate wind speed, but these are taken hundreds of meters to kilometers above the surface where the biggest impacts occur. Thus, we expect that training DL models for this purpose will require a novel approach.
The lightning predictions are somewhat robust up to at least , but with the hail predictions, the model loses accuracy more quickly after the first . Even short warning times still allow many preventive interventions: For example, members of the public who receive warnings through smartphones can seek cover and protect vulnerable property, and automated protection systems such as automatically-raised window blinds can activate. However, even delays of a few minutes may significantly impede the ability to act on such warnings. While the model itself can be executed in a few seconds even without GPU hardware, it is important to host the model and the accompanying data and warning system in a low-latency environment. We expect that in operational use the model will be run by meteorological services who already have such infrastructure in place, and then distributed to the end users.
6 Open Research
The preprocessed training, validation and testing datasets created for this study are available for noncommercial use at https://doi.org/10.5281/zenodo.6802292 [Leinonen, Hamann\BCBL \BBA Germann (\APACyear2022\APACexlab\BCnt1)]. The results, pretrained models and additional data needed to train the hail and lightning models can be found at https://doi.org/10.5281/zenodo.7157986 [Leinonen \BOthers. (\APACyear2023)]. The DL and analysis code used in this study can be found at https://github.com/MeteoSwiss/c4dl-multi. The original data from EUCLID lightning network are proprietary and cannot be made available in raw form. The original data from the Swiss radar network and the COSMO NWP model can be made available for research purposes on request. The MSG SEVIRI Rapid Scan radiances are available to EUMETSAT members and participating organizations at the EUMETSAT Data Store (https://data.eumetsat.int/). The NWCSAF products can be created from these data using the publicly available NWCSAF software available at https://www.nwcsaf.org/. The ASTER DEM can be obtained from https://doi.org/10.5067/ASTER/ASTGTM.003 [NASA/METI/AIST/Japan Spacesystems and U.S./Japan ASTER Science Team (\APACyear2019)].
Acknowledgements.
JL was supported by the fellowship “Seamless Artificially Intelligent Thunderstorm Nowcasts” from the European Organisation for the Exploitation of Meteorological Satellites (EUMETSAT). The hosting institution of this fellowship is MeteoSwiss in Switzerland.References
- Abrams \BOthers. (\APACyear2020) \APACinsertmetastarAbrams2020ASTERV3{APACrefauthors}Abrams, M., Crippen, R.\BCBL \BBA Fujisada, H. \APACrefYearMonthDay2020. \BBOQ\APACrefatitleASTER Global Digital Elevation Model (GDEM) and ASTER Global Water Body Dataset (ASTWBD) ASTER global digital elevation model (GDEM) and ASTER global water body dataset (ASTWBD).\BBCQ \APACjournalVolNumPagesRemote Sens.121156. {APACrefDOI} 10.3390/rs12071156 \PrintBackRefs\CurrentBib
- Allen \BBA Allen (\APACyear2016) \APACinsertmetastarAllen2016ThunderstormsAustralia{APACrefauthors}Allen, J\BPBIT.\BCBT \BBA Allen, E\BPBIR. \APACrefYearMonthDay2016. \BBOQ\APACrefatitleA review of severe thunderstorms in Australia A review of severe thunderstorms in Australia.\BBCQ \APACjournalVolNumPagesAtmos. Res.178–179347–366. {APACrefDOI} 10.1016/j.atmosres.2016.03.011 \PrintBackRefs\CurrentBib
- Baldauf \BOthers. (\APACyear2011) \APACinsertmetastarBaldauf2011COSMO{APACrefauthors}Baldauf, M., Seifert, A., Förstner, J., Majewski, D., Raschendorfer, M.\BCBL \BBA Reinhardt, T. \APACrefYearMonthDay2011. \BBOQ\APACrefatitleOperational Convective-Scale Numerical Weather Prediction with the COSMO Model: Description and Sensitivities Operational convective-scale numerical weather prediction with the COSMO model: Description and sensitivities.\BBCQ \APACjournalVolNumPagesMon. Wea. Rev.139123887–3905. {APACrefDOI} 10.1175/MWR-D-10-05013.1 \PrintBackRefs\CurrentBib
- Barras \BOthers. (\APACyear2019) \APACinsertmetastarBarras2019Hail{APACrefauthors}Barras, H., Hering, A., Martynov, A., Noti, P\BHBIA., Germann, U.\BCBL \BBA Martius, O. \APACrefYearMonthDay2019. \BBOQ\APACrefatitleExperiences with 50,000 Crowdsourced Hail Reports in Switzerland Experiences with 50,000 crowdsourced hail reports in switzerland.\BBCQ \APACjournalVolNumPagesBull. Amer. Meteor. Soc.10081429–1440. {APACrefDOI} 10.1175/BAMS-D-18-0090.1 \PrintBackRefs\CurrentBib
- Battaglia \BOthers. (\APACyear2019) \APACinsertmetastarBattaglia2019HailDamage{APACrefauthors}Battaglia, M., Lee, C., Thomason, W., Fike, J.\BCBL \BBA Sadeghpour, A. \APACrefYearMonthDay2019. \BBOQ\APACrefatitleHail Damage Impacts on Corn Productivity: A Review Hail damage impacts on corn productivity: A review.\BBCQ \APACjournalVolNumPagesCrop Sci.5911–14. {APACrefDOI} 10.2135/cropsci2018.04.0285 \PrintBackRefs\CurrentBib
- Ciach \BBA Krajewski (\APACyear1999) \APACinsertmetastarCiach1999RadarError{APACrefauthors}Ciach, G\BPBIJ.\BCBT \BBA Krajewski, W\BPBIF. \APACrefYearMonthDay1999. \BBOQ\APACrefatitleOn the estimation of radar rainfall error variance On the estimation of radar rainfall error variance.\BBCQ \APACjournalVolNumPagesAdv. Water Resour.226585–595. {APACrefDOI} 10.1016/S0309-1708(98)00043-8 \PrintBackRefs\CurrentBib
- Cuomo \BBA Chandrasekar (\APACyear2022) \APACinsertmetastarCuomo2022StormNowcasting{APACrefauthors}Cuomo, J.\BCBT \BBA Chandrasekar, V. \APACrefYearMonthDay2022. \BBOQ\APACrefatitleDeveloping Deep Learning Models for Storm Nowcasting Developing deep learning models for storm nowcasting.\BBCQ \APACjournalVolNumPagesIEEE Trans. Geosci. Remote Sens.60. {APACrefDOI} 10.1109/TGRS.2021.3110180 \PrintBackRefs\CurrentBib
- Davis (\APACyear2001) \APACinsertmetastarDavis2001FlashFlood{APACrefauthors}Davis, R\BPBIS. \APACrefYearMonthDay2001. \BBOQ\APACrefatitleFlash Flood Forecast and Detection Methods Flash flood forecast and detection methods.\BBCQ \BIn C\BPBIA. Doswell (\BED), \APACrefbtitleSevere Convective Storms Severe convective storms (\BPGS 481–525). \APACaddressPublisherBoston, MA, USAAmerican Meteorological Society. {APACrefDOI} 10.1007/978-1-935704-06-5_12 \PrintBackRefs\CurrentBib
- Derrien \BBA Le Gléau (\APACyear2005) \APACinsertmetastarDerrien2005SeviriCloudMask{APACrefauthors}Derrien, M.\BCBT \BBA Le Gléau, H. \APACrefYearMonthDay2005. \BBOQ\APACrefatitleMSG/SEVIRI cloud mask and type from SAFNWC MSG/SEVIRI cloud mask and type from SAFNWC.\BBCQ \APACjournalVolNumPagesInt. J. Remote Sens.26214707–4732. {APACrefDOI} 10.1080/01431160500166128 \PrintBackRefs\CurrentBib
- Dotzek (\APACyear2003) \APACinsertmetastarDotzek2003{APACrefauthors}Dotzek, N. \APACrefYearMonthDay2003. \BBOQ\APACrefatitleAn updated estimate of tornado occurrence in Europe An updated estimate of tornado occurrence in Europe.\BBCQ \APACjournalVolNumPagesAtmos. Res.67–68153–161. {APACrefDOI} 10.1016/S0169-8095(03)00049-8 \PrintBackRefs\CurrentBib
- Farnell \BOthers. (\APACyear2017) \APACinsertmetastarFarnell2017Lightning{APACrefauthors}Farnell, C., Rigo, T.\BCBL \BBA Pineda, N. \APACrefYearMonthDay2017. \BBOQ\APACrefatitleLightning jump as a nowcast predictor: Application to severe weather events in Catalonia Lightning jump as a nowcast predictor: Application to severe weather events in Catalonia.\BBCQ \APACjournalVolNumPagesAtmos. Res.183130–141. {APACrefDOI} 10.1016/j.atmosres.2016.08.021 \PrintBackRefs\CurrentBib
- Feldmann \BOthers. (\APACyear2021) \APACinsertmetastarFeldmann2021Mesocyclone{APACrefauthors}Feldmann, M., Germann, U., Gabella, M.\BCBL \BBA Berne, A. \APACrefYearMonthDay2021. \BBOQ\APACrefatitleA characterisation of Alpine mesocyclone occurrence A characterisation of Alpine mesocyclone occurrence.\BBCQ \APACjournalVolNumPagesWeather Clim. Dynam.241225–1244. {APACrefDOI} 10.5194/wcd-2-1225-2021 \PrintBackRefs\CurrentBib
- Foote \BOthers. (\APACyear2005) \APACinsertmetastarFoote2005Hail{APACrefauthors}Foote, G\BPBIB., Krauss, T\BPBIW.\BCBL \BBA Makitov, V. \APACrefYearMonthDay2005. \BBOQ\APACrefatitleHail metrics using conventional radar Hail metrics using conventional radar.\BBCQ \BIn \APACrefbtitleProc., 16th Conference on Planned and Inadvertent Weather Modification. Proc., 16th Conference on Planned and Inadvertent Weather Modification. \PrintBackRefs\CurrentBib
- Ganaie \BOthers. (\APACyear2022) \APACinsertmetastarGanaie2021Ensemble{APACrefauthors}Ganaie, M\BPBIA., Hu, M., Tanveer, M.\BCBL \BBA Suganthan, P\BPBIN. \APACrefYearMonthDay2022. \BBOQ\APACrefatitleEnsemble deep learning: A review Ensemble deep learning: A review.\BBCQ \APACjournalVolNumPagesEng. Appl. Artif. Intell.115105151. {APACrefDOI} 10.1016/j.engappai.2022.105151 \PrintBackRefs\CurrentBib
- Geng \BOthers. (\APACyear2021) \APACinsertmetastarGeng2021LightningForecast{APACrefauthors}Geng, Y\BHBIa., Li, Q., Lin, T., Yao, W., Xu, L., Zheng, D.\BDBLZhang, Y. \APACrefYearMonthDay2021. \BBOQ\APACrefatitleA deep learning framework for lightning forecasting with multi-source spatiotemporal data A deep learning framework for lightning forecasting with multi-source spatiotemporal data.\BBCQ \APACjournalVolNumPagesQuart. J. Roy. Meteor. Soc.1477414048–4062. {APACrefDOI} 10.1002/qj.4167 \PrintBackRefs\CurrentBib
- Germann \BOthers. (\APACyear2022) \APACinsertmetastarGermann2022RadarOrography{APACrefauthors}Germann, U., Boscacci, M., Clementi, L., Gabella, M., Hering, A., Sartori, M.\BDBLCalpini, B. \APACrefYearMonthDay2022. \BBOQ\APACrefatitleWeather Radar in Complex Orography Weather radar in complex orography.\BBCQ \APACjournalVolNumPagesRemote Sens.143. {APACrefDOI} 10.3390/rs14030503 \PrintBackRefs\CurrentBib
- Germann \BOthers. (\APACyear2016) \APACinsertmetastarGermann2016SwissRadar{APACrefauthors}Germann, U., Boscacci, M., Gabella, M.\BCBL \BBA Schneebeli, M. \APACrefYearMonthDay2016. \BBOQ\APACrefatitleWeather radar in Switzerland Weather radar in Switzerland.\BBCQ \BIn S. Willemse \BBA M. Furger (\BEDS), \APACrefbtitleFrom weather observations to atmospheric and climate science in Switzerland: Celebrating 100 years of the Swiss Society for Meteorology From weather observations to atmospheric and climate science in Switzerland: Celebrating 100 years of the Swiss Society for Meteorology (\BCHAP 9). \APACaddressPublisherZürich, SwitzerlandVdf Hochschulverlag AG an der ETH Zürich. \PrintBackRefs\CurrentBib
- Hamann \BOthers. (\APACyear2014) \APACinsertmetastarHamann2014SEVIRICloudTop{APACrefauthors}Hamann, U., Walther, A., Baum, B., Bennartz, R., Bugliaro, L., Derrien, M.\BDBLWind, G. \APACrefYearMonthDay2014. \BBOQ\APACrefatitleRemote sensing of cloud top pressure/height from SEVIRI: analysis of ten current retrieval algorithms Remote sensing of cloud top pressure/height from SEVIRI: analysis of ten current retrieval algorithms.\BBCQ \APACjournalVolNumPagesAtmos. Meas. Tech.792839–2867. {APACrefDOI} 10.5194/amt-7-2839-2014 \PrintBackRefs\CurrentBib
- Herruzo \BOthers. (\APACyear2021) \APACinsertmetastarHerruzo2021Weather4cast{APACrefauthors}Herruzo, P., Gruca, A., Lliso, L., Calbet, X., Ripodas, P., Hochreiter, S.\BDBLKreil, D\BPBIP. \APACrefYearMonthDay2021. \BBOQ\APACrefatitleHigh-resolution multi-channel weather forecasting – First insights on transfer learning from the Weather4cast Competitions 2021 High-resolution multi-channel weather forecasting – first insights on transfer learning from the Weather4cast competitions 2021.\BBCQ \BIn \APACrefbtitle2021 IEEE International Conference on Big Data 2021 IEEE International Conference on Big Data (\BPGS 5750–5757). \APACaddressPublisherLos Alamitos, CA, USAIEEE Computer Society. {APACrefDOI} 10.1109/BigData52589.2021.9672063 \PrintBackRefs\CurrentBib
- Hilker \BOthers. (\APACyear2009) \APACinsertmetastarHilker2009FloodLandslide{APACrefauthors}Hilker, N., Badoux, A.\BCBL \BBA Hegg, C. \APACrefYearMonthDay2009. \BBOQ\APACrefatitleThe Swiss flood and landslide damage database 1972–2007 The Swiss flood and landslide damage database 1972–2007.\BBCQ \APACjournalVolNumPagesNat. Hazards Earth Syst. Sci.93913–925. {APACrefDOI} 10.5194/nhess-9-913-2009 \PrintBackRefs\CurrentBib
- Hohl \BOthers. (\APACyear2002) \APACinsertmetastarHohl2002Hailfall{APACrefauthors}Hohl, R., Schiesser, H\BHBIH.\BCBL \BBA Aller, D. \APACrefYearMonthDay2002. \BBOQ\APACrefatitleHailfall: the relationship between radar-derived hail kinetic energy and hail damage to buildings Hailfall: the relationship between radar-derived hail kinetic energy and hail damage to buildings.\BBCQ \APACjournalVolNumPagesAtmos. Res.633177–207. {APACrefDOI} https://doi.org/10.1016/S0169-8095(02)00059-5 \PrintBackRefs\CurrentBib
- Holle (\APACyear2014) \APACinsertmetastarHolle2014Lightning{APACrefauthors}Holle, R\BPBIL. \APACrefYearMonthDay2014. \BBOQ\APACrefatitleSome aspects of global lightning impacts Some aspects of global lightning impacts.\BBCQ \BIn \APACrefbtitle2014 International Conference on Lightning Protection (ICLP) 2014 international conference on lightning protection (ICLP) (\BPG 1390-1395). {APACrefDOI} 10.1109/ICLP.2014.6973348 \PrintBackRefs\CurrentBib
- Holle (\APACyear2016) \APACinsertmetastarHolle2016Lightning{APACrefauthors}Holle, R\BPBIL. \APACrefYearMonthDay2016. \BBOQ\APACrefatitleA Summary of Recent National-Scale Lightning Fatality Studies A summary of recent national-scale lightning fatality studies.\BBCQ \APACjournalVolNumPagesWeather Clim. Soc.8135–42. {APACrefDOI} 10.1175/WCAS-D-15-0032.1 \PrintBackRefs\CurrentBib
- Kelly \BOthers. (\APACyear1985) \APACinsertmetastarKelly1984NontornadicThunderstorm{APACrefauthors}Kelly, D\BPBIL., Schaefer, J\BPBIT.\BCBL \BBA Doswell, C\BPBIA. \APACrefYearMonthDay1985. \BBOQ\APACrefatitleClimatology of Nontornadic Severe Thunderstorm Events in the United States Climatology of nontornadic severe thunderstorm events in the United States.\BBCQ \APACjournalVolNumPagesMon. Wea. Rev.113111997–2014. {APACrefDOI} 10.1175/1520-0493(1985)113¡1997:CONSTE¿2.0.CO;2 \PrintBackRefs\CurrentBib
- Kopp \BOthers. (\APACyear2022) \APACinsertmetastarKopp2022Hailstorms{APACrefauthors}Kopp, J., Schröer, K., Schwierz, C., Hering, A., Germann, U.\BCBL \BBA Martius, O. \APACrefYearMonthDay2022. \BBOQ\APACrefatitleThe summer 2021 Switzerland hailstorms: weather situation, major impacts, and unique observational data The summer 2021 Switzerland hailstorms: weather situation, major impacts, and unique observational data.\BBCQ \APACjournalVolNumPagesWeather. \APACrefnoteAccepted, early online version available {APACrefDOI} 10.1002/wea.4306 \PrintBackRefs\CurrentBib
- Le Gléau (\APACyear2016) \APACinsertmetastarLeGleau2016CloudATB{APACrefauthors}Le Gléau, H. \APACrefYearMonthDay2016. \APACrefbtitleAlgorithm Theoretical Basis Document for the Cloud Product Processors of the NWC/GEO Algorithm theoretical basis document for the cloud product processors of the NWC/GEO \APACbVolEdTR\BTR \BNUM NWC/CDOP2/GEO/MFL/SCI/ATBD/Cloud. \APACaddressInstitutionNWC SAF. \PrintBackRefs\CurrentBib
- Leinonen (\APACyear2021\APACexlab\BCnt1) \APACinsertmetastarLeinonen2021Weather4castBigData{APACrefauthors}Leinonen, J. \APACrefYearMonthDay2021\BCnt1. \BBOQ\APACrefatitleImprovements to short-term weather prediction with recurrent-convolutional networks Improvements to short-term weather prediction with recurrent-convolutional networks.\BBCQ \BIn \APACrefbtitle2021 IEEE International Conference on Big Data 2021 IEEE International Conference on Big Data (\BPGS 5764–5769). {APACrefDOI} 10.1109/BigData52589.2021.9671869 \PrintBackRefs\CurrentBib
- Leinonen (\APACyear2021\APACexlab\BCnt2) \APACinsertmetastarLeinonen2021Weather4castStage1{APACrefauthors}Leinonen, J. \APACrefYearMonthDay2021\BCnt2. \BBOQ\APACrefatitleSpatiotemporal Weather Data Predictions with Shortcut Recurrent-Convolutional Networks: A Solution for the Weather4cast challenge Spatiotemporal weather data predictions with shortcut recurrent-convolutional networks: A solution for the Weather4cast challenge.\BBCQ \BIn G. Cong \BBA M. Ramanath (\BEDS), \APACrefbtitleProceedings of the CIKM 2021 Workshops. Proceedings of the CIKM 2021 Workshops. {APACrefURL} http://ceur-ws.org/Vol-3052/short15.pdf \PrintBackRefs\CurrentBib
- Leinonen, Hamann\BCBL \BBA Germann (\APACyear2022\APACexlab\BCnt1) \APACinsertmetastarLeinonen2022Weights{APACrefauthors}Leinonen, J., Hamann, U.\BCBL \BBA Germann, U. \APACrefYearMonthDay2022\BCnt1. \APACrefbtitleData archive for “Seamless lightning nowcasting with recurrent-convolutional deep learning”. Data archive for “Seamless lightning nowcasting with recurrent-convolutional deep learning”. \APACaddressPublisherZenodo. {APACrefDOI} 10.5281/zenodo.6802292 \PrintBackRefs\CurrentBib
- Leinonen, Hamann\BCBL \BBA Germann (\APACyear2022\APACexlab\BCnt2) \APACinsertmetastarLeinonen2022Lightning{APACrefauthors}Leinonen, J., Hamann, U.\BCBL \BBA Germann, U. \APACrefYearMonthDay2022\BCnt2. \BBOQ\APACrefatitleSeamless Lightning Nowcasting with Recurrent-Convolutional Deep Learning Seamless lightning nowcasting with recurrent-convolutional deep learning.\BBCQ \APACjournalVolNumPagesArtif. Intell. Earth Syst.14e220043. {APACrefDOI} 10.1175/AIES-D-22-0043.1 \PrintBackRefs\CurrentBib
- Leinonen, Hamann, Germann\BCBL \BBA Mecikalski (\APACyear2022) \APACinsertmetastarLeinonen2021DataSources{APACrefauthors}Leinonen, J., Hamann, U., Germann, U.\BCBL \BBA Mecikalski, J\BPBIR. \APACrefYearMonthDay2022. \BBOQ\APACrefatitleNowcasting thunderstorm hazards using machine learning: the impact of data sources on performance Nowcasting thunderstorm hazards using machine learning: the impact of data sources on performance.\BBCQ \APACjournalVolNumPagesNat. Hazards Earth Syst. Sci.22577–597. {APACrefDOI} 10.5194/nhess-2021-171 \PrintBackRefs\CurrentBib
- Leinonen \BOthers. (\APACyear2023) \APACinsertmetastarLeinonen2022Pretrained{APACrefauthors}Leinonen, J., Hamann, U., Sideris, I\BPBIV.\BCBL \BBA Germann, U. \APACrefYearMonthDay2023. \APACrefbtitlePretrained models and results for “Thunderstorm nowcasting with deep learning: a multi-hazard data fusion model”. Pretrained models and results for “Thunderstorm nowcasting with deep learning: a multi-hazard data fusion model”. \APACaddressPublisherZenodo. {APACrefDOI} 10.5281/zenodo.7534916 \PrintBackRefs\CurrentBib
- Lin \BOthers. (\APACyear2017) \APACinsertmetastarLin2017FocalLoss{APACrefauthors}Lin, T\BHBIY., Goyal, P., Girshick, R., He, K.\BCBL \BBA Dollár, P. \APACrefYearMonthDay2017. \BBOQ\APACrefatitleFocal Loss for Dense Object Detection Focal loss for dense object detection.\BBCQ \BIn \APACrefbtitle2017 IEEE International Conference on Computer Vision (ICCV) 2017 IEEE International Conference on Computer Vision (ICCV) (\BPGS 2999–3007). {APACrefDOI} 10.1109/ICCV.2017.324 \PrintBackRefs\CurrentBib
- Molnar (\APACyear2022) \APACinsertmetastarMolnar2022Shapley{APACrefauthors}Molnar, C. \APACrefYear2022. \APACrefbtitleInterpretable Machine Learning: A Guide For Making Black Box Models Explainable Interpretable machine learning: A guide for making black box models explainable (\PrintOrdinal2 \BEd). \APACaddressPublisherIndependently published. {APACrefURL} https://christophm.github.io/interpretable-ml-book/ \PrintBackRefs\CurrentBib
- NASA/METI/AIST/Japan Spacesystems and U.S./Japan ASTER Science Team (\APACyear2019) \APACinsertmetastarASTERGDEMV3Data{APACrefauthors}NASA/METI/AIST/Japan Spacesystems and U.S./Japan ASTER Science Team. \APACrefYearMonthDay2019. \APACrefbtitleASTER Global Digital Elevation Model V003. ASTER Global Digital Elevation Model V003. \APACaddressPublisherNASA EOSDIS Land Processes DAAC. {APACrefDOI} 10.5067/ASTER/ASTGTM.003 \PrintBackRefs\CurrentBib
- Nerini (\APACyear2019) \APACinsertmetastarNerini2019EnsembleNowcast{APACrefauthors}Nerini, D. \APACrefYear2019. \APACrefbtitleEnsemble precipitation nowcasting: limits to prediction, localization and seamless blending Ensemble precipitation nowcasting: limits to prediction, localization and seamless blending \APACtypeAddressSchool\BPhDETH Zurich. {APACrefDOI} 10.3929/ethz-b-000391932 \PrintBackRefs\CurrentBib
- Nerini \BOthers. (\APACyear2019) \APACinsertmetastarNerini2019KalmanNowcasts{APACrefauthors}Nerini, D., Foresti, L., Leuenberger, D., Robert, S.\BCBL \BBA Germann, U. \APACrefYearMonthDay2019. \BBOQ\APACrefatitleA Reduced-Space Ensemble Kalman Filter Approach for Flow-Dependent Integration of Radar Extrapolation Nowcasts and NWP Precipitation Ensembles A reduced-space ensemble Kalman filter approach for flow-dependent integration of radar extrapolation nowcasts and NWP precipitation ensembles.\BBCQ \APACjournalVolNumPagesMon. Wea. Rev.1473987–1006. {APACrefDOI} 10.1175/MWR-D-18-0258.1 \PrintBackRefs\CurrentBib
- Ozturk \BOthers. (\APACyear2018) \APACinsertmetastarOzturk2018FlashFloods{APACrefauthors}Ozturk, U., Wendi, D., Crisologo, I., Riemer, A., Agarwal, A., Vogel, K.\BDBLKorup, O. \APACrefYearMonthDay2018. \BBOQ\APACrefatitleRare flash floods and debris flows in southern Germany Rare flash floods and debris flows in southern Germany.\BBCQ \APACjournalVolNumPagesSci. Total Environ.626941–952. {APACrefDOI} https://doi.org/10.1016/j.scitotenv.2018.01.172 \PrintBackRefs\CurrentBib
- Pan \BOthers. (\APACyear2021) \APACinsertmetastarPan2021DLConvective{APACrefauthors}Pan, X., Lu, Y., Zhao, K., Huang, H., Wang, M.\BCBL \BBA Chen, H. \APACrefYearMonthDay2021. \BBOQ\APACrefatitleImproving Nowcasting of Convective Development by Incorporating Polarimetric Radar Variables Into a Deep-Learning Model Improving nowcasting of convective development by incorporating polarimetric radar variables into a deep-learning model.\BBCQ \APACjournalVolNumPagesGeophys. Res. Lett.4821e2021GL095302. {APACrefDOI} https://doi.org/10.1029/2021GL095302 \PrintBackRefs\CurrentBib
- Poelman \BOthers. (\APACyear2016) \APACinsertmetastarPoelman2016EUCLID{APACrefauthors}Poelman, D\BPBIR., Schulz, W., Diendorfer, G.\BCBL \BBA Bernardi, M. \APACrefYearMonthDay2016. \BBOQ\APACrefatitleThe European lightning location system EUCLID – Part 2: Observations The European lightning location system EUCLID – Part 2: Observations.\BBCQ \APACjournalVolNumPagesNat. Hazards Earth Syst. Sci.162607–616. {APACrefDOI} 10.5194/nhess-16-607-2016 \PrintBackRefs\CurrentBib
- Schmid (\APACyear2000) \APACinsertmetastarSchmid2000SEVIRI{APACrefauthors}Schmid, J. \APACrefYearMonthDay2000. \BBOQ\APACrefatitleThe SEVIRI instrument The SEVIRI instrument.\BBCQ \BIn \APACrefbtitleProceedings of the 2000 EUMETSAT Meteorological Satellite Data Users’ Conference, Bologna, Italy. Proceedings of the 2000 EUMETSAT Meteorological Satellite Data Users’ Conference, Bologna, Italy. \PrintBackRefs\CurrentBib
- Schultz \BOthers. (\APACyear2009) \APACinsertmetastarSchultz2009Lightning{APACrefauthors}Schultz, C\BPBIJ., Petersen, W\BPBIA.\BCBL \BBA Carey, L\BPBID. \APACrefYearMonthDay2009. \BBOQ\APACrefatitlePreliminary Development and Evaluation of Lightning Jump Algorithms for the Real-Time Detection of Severe Weather Preliminary development and evaluation of lightning jump algorithms for the real-time detection of severe weather.\BBCQ \APACjournalVolNumPagesJ. Appl. Meteor. Climatol.48122543–2563. {APACrefDOI} 10.1175/2009JAMC2237.1 \PrintBackRefs\CurrentBib
- Schulz \BOthers. (\APACyear2016) \APACinsertmetastarSchulz2016EUCLID{APACrefauthors}Schulz, W., Diendorfer, G., Pedeboy, S.\BCBL \BBA Poelman, D\BPBIR. \APACrefYearMonthDay2016. \BBOQ\APACrefatitleThe European lightning location system EUCLID – Part 1: Performance analysis and validation The European lightning location system EUCLID – Part 1: Performance analysis and validation.\BBCQ \APACjournalVolNumPagesNat. Hazards Earth Syst. Sci.162595–605. {APACrefDOI} 10.5194/nhess-16-595-2016 \PrintBackRefs\CurrentBib
- Shapley (\APACyear1951) \APACinsertmetastarShapley1951{APACrefauthors}Shapley, L\BPBIS. \APACrefYearMonthDay1951. \APACrefbtitleNotes on the n-Person Game – II: The Value of an n-Person Game Notes on the n-person game – II: The value of an n-person game \APACbVolEdTR\BTR \BNUM RM-670. \APACaddressInstitutionThe RAND Corporation. {APACrefURL} https://www.rand.org/content/dam/rand/pubs/research_memoranda/2008/RM670.pdf \PrintBackRefs\CurrentBib
- Sideris, Gabella, Erdin\BCBL \BBA Germann (\APACyear2014) \APACinsertmetastarSideris2014CombiPrecip{APACrefauthors}Sideris, I\BPBIV., Gabella, M., Erdin, R.\BCBL \BBA Germann, U. \APACrefYearMonthDay2014. \BBOQ\APACrefatitleReal-time radar-rain-gauge merging using spatio-temporal co-kriging with external drift in the alpine terrain of Switzerland Real-time radar-rain-gauge merging using spatio-temporal co-kriging with external drift in the alpine terrain of Switzerland.\BBCQ \APACjournalVolNumPagesQuart. J. Roy. Meteor. Soc.1401097–-1111. {APACrefDOI} 10.1002/qj.2188 \PrintBackRefs\CurrentBib
- Sideris, Gabella, Sassi\BCBL \BBA Germann (\APACyear2014) \APACinsertmetastarSideris2014CombiPrecipExperience{APACrefauthors}Sideris, I\BPBIV., Gabella, M., Sassi, M.\BCBL \BBA Germann, U. \APACrefYearMonthDay2014. \BBOQ\APACrefatitleThe CombiPrecip experience: development and operation of a real-time radar-raingauge combination scheme in Switzerland The CombiPrecip experience: development and operation of a real-time radar-raingauge combination scheme in Switzerland.\BBCQ \BIn \APACrefbtitleProceedings of 2014 International Weather Radar and Hydrology Symposium. Proceedings of 2014 International Weather Radar and Hydrology Symposium. \PrintBackRefs\CurrentBib
- Smith \BOthers. (\APACyear1996) \APACinsertmetastarSmith1996RapidanStorm{APACrefauthors}Smith, J\BPBIA., Baeck, M\BPBIL., Steiner, M.\BCBL \BBA Miller, A\BPBIJ. \APACrefYearMonthDay1996. \BBOQ\APACrefatitleCatastrophic rainfall from an upslope thunderstorm in the central Appalachians: The Rapidan Storm of June 27, 1995 Catastrophic rainfall from an upslope thunderstorm in the central Appalachians: The Rapidan Storm of June 27, 1995.\BBCQ \APACjournalVolNumPagesWater Resour. Res32103099–3113. {APACrefDOI} https://doi.org/10.1029/96WR02107 \PrintBackRefs\CurrentBib
- Sun \BOthers. (\APACyear2014) \APACinsertmetastarSun2014NWPPrecip{APACrefauthors}Sun, J., Xue, M., Wilson, J\BPBIW., Zawadzki, I., Ballard, S\BPBIP., Onvlee-Hooimeyer, J.\BDBLPinto, J. \APACrefYearMonthDay2014. \BBOQ\APACrefatitleUse of NWP for Nowcasting Convective Precipitation: Recent Progress and Challenges Use of NWP for nowcasting convective precipitation: Recent progress and challenges.\BBCQ \APACjournalVolNumPagesBull. Amer. Meteor. Soc.953409–426. {APACrefDOI} 10.1175/BAMS-D-11-00263.1 \PrintBackRefs\CurrentBib
- Taszarek \BOthers. (\APACyear2019) \APACinsertmetastarTaszarek2019ThunderstormClimatology{APACrefauthors}Taszarek, M., Allen, J., Púčik, T., Groenemeijer, P., Czernecki, B., Kolendowicz, L.\BDBLSchulz, W. \APACrefYearMonthDay2019. \BBOQ\APACrefatitleA Climatology of Thunderstorms across Europe from a Synthesis of Multiple Data Sources A climatology of thunderstorms across Europe from a synthesis of multiple data sources.\BBCQ \APACjournalVolNumPagesJ. Climate3261813–1837. {APACrefDOI} 10.1175/JCLI-D-18-0372.1 \PrintBackRefs\CurrentBib
- Waldvogel \BOthers. (\APACyear1979) \APACinsertmetastarWaldvogel1979POH{APACrefauthors}Waldvogel, A., Federer, B.\BCBL \BBA Grimm, P. \APACrefYearMonthDay1979. \BBOQ\APACrefatitleCriteria for the Detection of Hail Cells Criteria for the detection of hail cells.\BBCQ \APACjournalVolNumPagesJ. Appl. Meteor.18121521–1525. {APACrefDOI} 10.1175/1520-0450(1979)018¡1521:CFTDOH¿2.0.CO;2 \PrintBackRefs\CurrentBib
- Williams \BOthers. (\APACyear1999) \APACinsertmetastarWilliams1999Lightning{APACrefauthors}Williams, E., Boldi, B., Matlin, A., Weber, M., Hodanish, S., Sharp, D.\BDBLBuechler, D. \APACrefYearMonthDay1999. \BBOQ\APACrefatitleThe behavior of total lightning activity in severe Florida thunderstorms The behavior of total lightning activity in severe Florida thunderstorms.\BBCQ \APACjournalVolNumPagesAtmos. Res.513245–265. {APACrefDOI} 10.1016/S0169-8095(99)00011-3 \PrintBackRefs\CurrentBib
- Zhou \BOthers. (\APACyear2020) \APACinsertmetastarZhou2020LightningDL{APACrefauthors}Zhou, K., Zheng, Y., Dong, W.\BCBL \BBA Wang, T. \APACrefYearMonthDay2020. \BBOQ\APACrefatitleA Deep Learning Network for Cloud-to-Ground Lightning Nowcasting with Multisource Data A deep learning network for cloud-to-ground lightning nowcasting with multisource data.\BBCQ \APACjournalVolNumPagesJ. Appl. Meteor. Climatol.375927–942. {APACrefDOI} 10.1175/JTECH-D-19-0146.1 \PrintBackRefs\CurrentBib