Prognostic relevance of gene-expression signatures
Cancer prognosis can be regarded as estimating the risk of future outcomes from multiple variables. In prognostic signatures, these variables represent expressions of genes that are summed up to calculate a risk score. However, it is a natural phenomenon in living systems that the whole is more than the sum of its parts. We hypothesize that the prognostic power of signatures is fundamentally limited without incorporating emergent effects. Convergent evidence from a set of unprecedented size (10,000 signatures) implicates a maximum prognostic power. We show that a signature can correctly discriminate patients’ prognoses in no more than 80% of the time. Using a simple simulation, we show that more than 50% of the potentially available information is still missing at this value.
Introduction
Clinicians assimilate a variety of data from the clinical history, pathological characteristics, and molecular biomarkers to guide decision-making. Especially biomarkers have increased clinicians’ prognostic capabilities over the last decade (?). Such biomarkers represent measurable molecular characteristics that can be used to classify patients into subgroups: predictive biomarkers divide individuals into subgroups based on the likelihood a patient responds to a drug, and prognostic biomarkers divide individuals into subgroups based on a patient’s risk for a clinical endpoint such as death or metastasis (?). Especially in breast cancer, biomarkers have exhibited great promise and provided some of the most successful examples of translating knowledge from genomic studies to clinical applications (?).
A striking example of this translation are the so-called gene-expression signatures: biomarkers that are based solely on genes or combined groups of genes. Advancement in signature development was enhanced with the advent of high-throughput technologies (?) as well as with the simplicity of constructing a signature: most of the prognostic signatures have been constructed by simply summing up and normalizing weighted expression values of genes or groups of genes to produce a risk score, in a statistical process known as the Cox proportional hazards model (?). This simplicity has been recognized by the medical community (?), and several prognostic signatures have been clinically validated, resulting in the development of commercial tests such as EndoPredict®, MammaPrint©, Oncotype DX®, or Prosigna®.
Despite considerable interest and effort, a growing number of signatures proposed for clinical risk assessment has largely failed to surpass the performance of standard clinical characteristics (?, ?), such as the Nottingham Prognostic Index (?) used in breast cancer, which combines the size and grade of the tumor as well as the number of nearby invaded lymph nodes. Current research has noticed slow progress in developing useful signatures relating it to inconsistent results (?), poor study design (?), improper validation (?), and the finding that even a random set of genes can be prognostic (?), as well as to the finding that the most prognostic signatures lack any biological meaning with respect to disease etiology (?).
For the same reasons, however, one can assume that gene-expression signatures lack fundamental information which cannot be captured by reducing the connections between the biology and systemic disease to a single set of genes. Such lack of fundamental information suggests to consider cancer as an emergent phenomenon which has irreducible properties that cannot be explained by a bottom up approach as the sum of its molecular changes. In fact, several theoretical studies, simulations, and experimental observations point towards the dominant role of the (host) system over the cell in dictating the behavior of cells in cancer progression (?, ?, ?, ?, ?). Thus, we hypothesize that a lack of such fundamental information in gene-expression signatures leads to an inherent limit of their prognostic power.
Here, we perform a comprehensive analysis of prognostic signatures in breast cancer patients, determining their current limits and estimating the potential maximum prognostic power. To quantify the prognostic power, we measure the concordance index which is a measure of how well patients with different prognoses can be discriminated. Three different approaches for selecting genes are considered to explore a wide range of different gene signatures: random sampling, since it addresses the finding that even random signatures can be prognostic; collecting genes from signatures reported in the literature, because it addresses expert knowledge and functionally related genes; and selecting genes using the state-of-the-art machine learning methods, since ensemble algorithms such as random forests can detect nonlinear relations between genes (Materials and Methods). These selections are performed on 8 established breast cancer data bases, which provide expression values quantified with different methods such as reverse transcription-PCR or DNA microarrays (Materials and Methods, Datasets). Based on these selections, we develop signatures with 9 different machine learning models.
This work provides clinicians and researches – to the best of our knowledge – with the largest examination of the prognostic utility of gene-expression signatures (10,000 signatures). Our results illustrate that it is unlikely to find a gene-expression signature which would perfectly order patients’ survival times in more than 80% of the time; and 50% of potential information is still hidden for such signature.
Study design
The concept of maximum prognostic power demands at least three assumptions to be satisfied. First, it is independent on the number of patients on which the prognosis is based, i.e. prognosis cannot be improved by simply collecting more data. Second, it is independent on the selection method of variables, i.e. of genes, on which the prognosis is based. Last, it is independent on the prognostic model, i.e. on the procedure or algorithm which implements the prediction of survival.
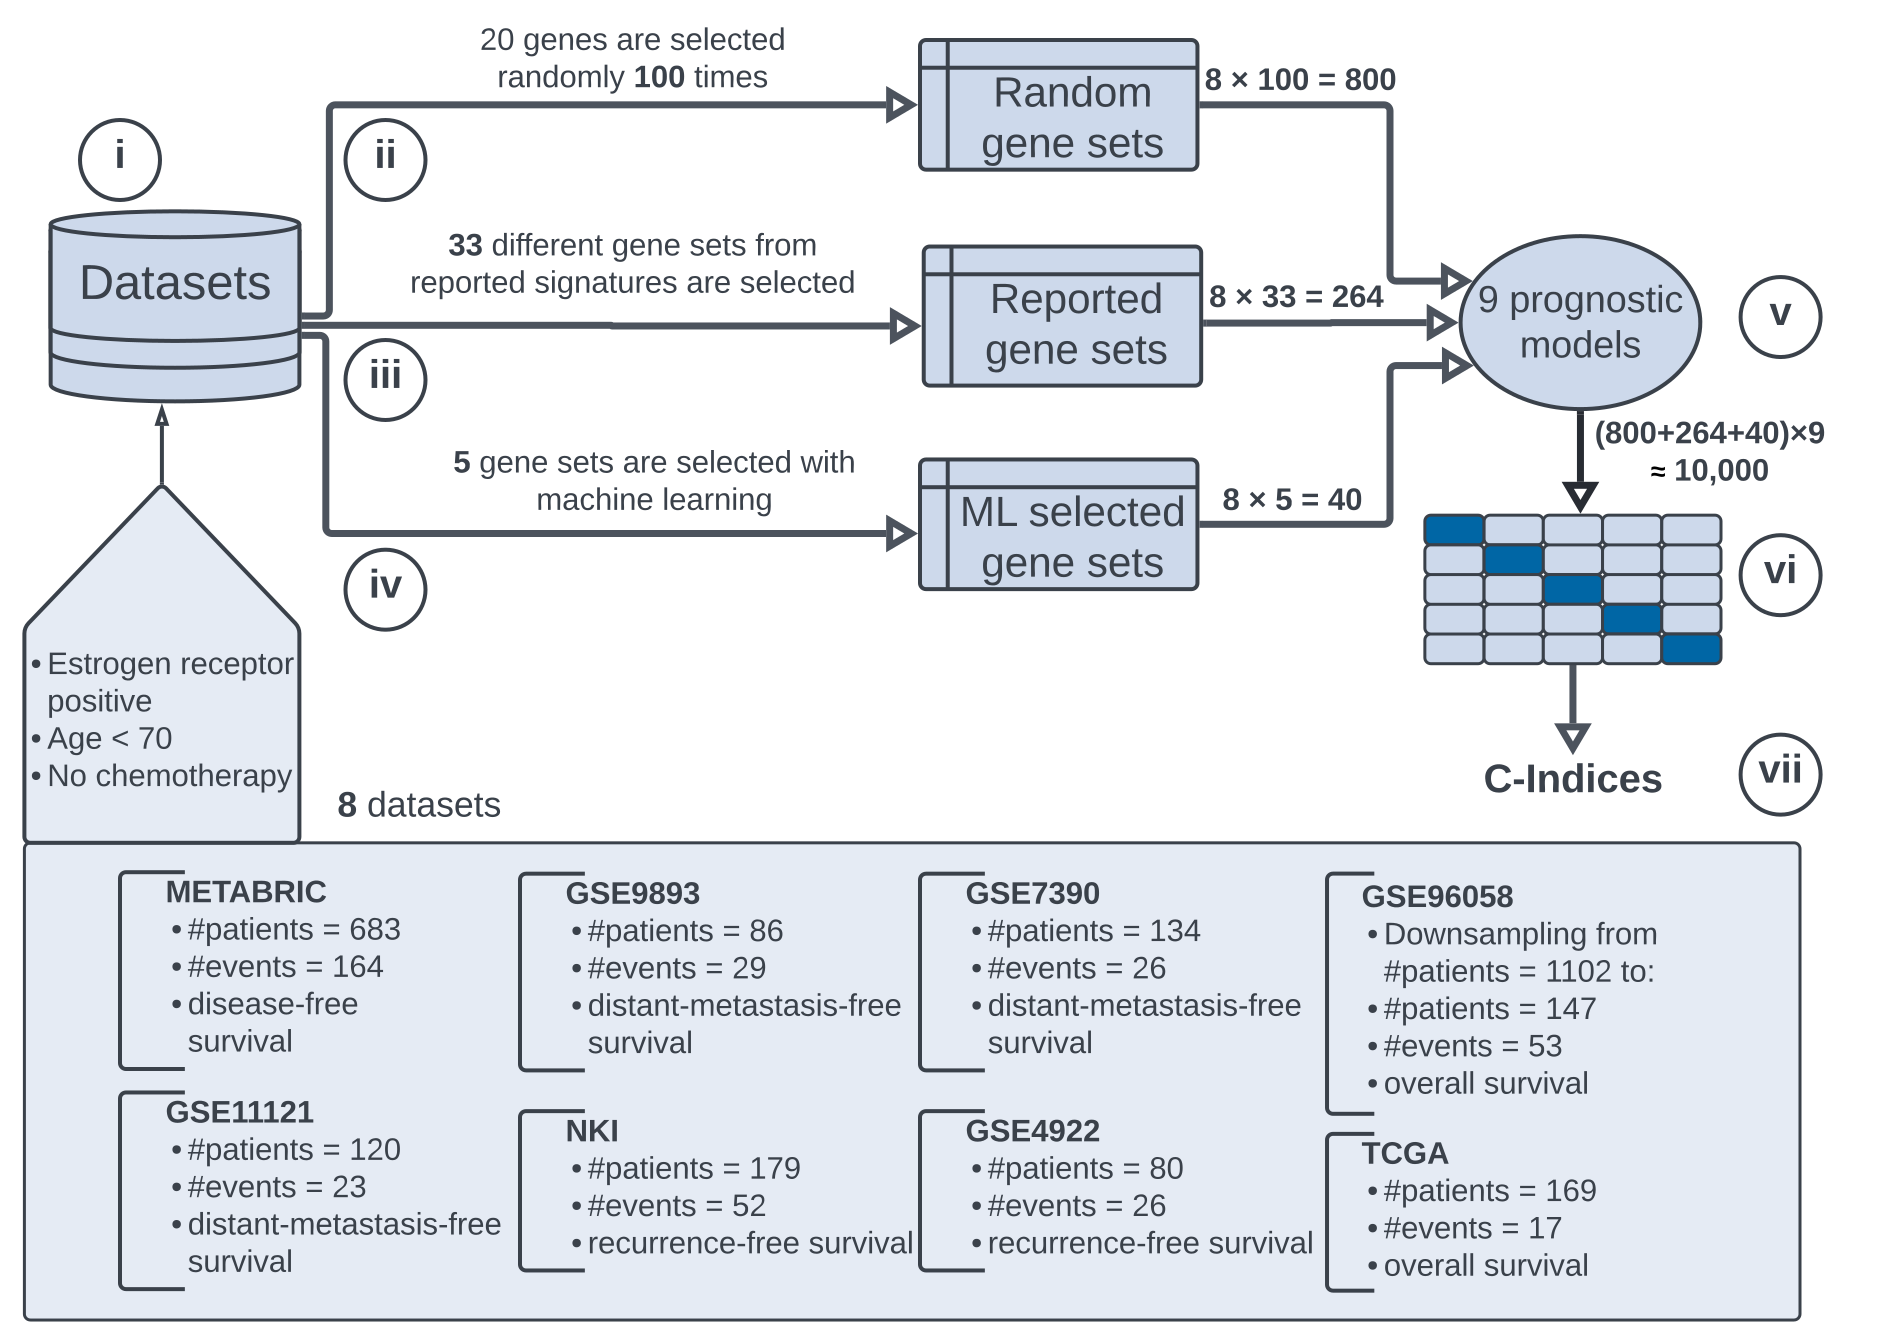
To provide an estimation of maximum prognostic power which attempts to justify these assumptions, we perform a 7-step analysis summarized in Fig. 1:
-
i
Datasets, i.e. expression values and patient’s information about survival, are collected from 8 different sources. Stemming from different sources, these datasets vary in the number of patients and statistical properties such as primary end-point (Materials and Methods), which guarantees that dependency on the number of patients can be examined.
-
ii
We select 100 gene sets – a gene set is a list of genes that is used for prognosis – at random in each dataset, resulting in gene sets. We have determined the optimal number of randomly selected genes in a gene set to be approximately 20 (Supplementary Random Signature Size), which confirms the finding of Chou et. al. (Fig. 4 in (?)), who found that 20 genes is optimal by using neural networks. The sampling of random signatures is based on recent studies that emphasize the role of random selections in prognosis (?, ?, ?), whereby random signatures outperform published and known signatures. Goh et.al (?) termed this phenomenon as random signature superiority and related it to the fact that random genes are inseparably correlated with proliferation genes, including genes involved in cell cycle, cell death, contact-based growth inhibition, and so forth.
-
iii
Several gene-expression signatures have been reported in the literature and associated with clinical outcome, so that they are expected to provide higher prognostic power than random signatures. We curate 33 gene sets from gene signatures reported in previous studies (?) such as OncotypeDx, EndoPredict, MammaPrint, or ProSigna, resulting in gene sets. These gene sets are described in detail in SI Appendix, Supplementary Reported Gene Selections.
-
iv
Gene sets are chosen with one standard selection method (UM, univariable model) that detects linear relations between genes; and 4 machine learning methods that are based on so-called random forests which can detect non-linearity between genes (Materials and Methods), resulting in gene sets.
-
v
Prognostic models for each gene set are developed (Materials and Methods). A prognostic model provides a statistical function that aims to predict the time from a fixed time point to an event, such as the time from surgery to death, by modeling the relation between one or more variables (genes) and a response (event). The inherent aspect of prognostic modeling is the presence of censored data. For example, a censoring occurs if a patient is lost to followup or the event does not occur within the study duration. We use 9 prognostic models that can handle censored data, resulting in overall gene expression signatures. The Cox proportional hazards model (?) is employed, since it is the most common method for analyzing censored data (?). However, this model detects only linear effects between variables. In order to detect non-linear effects we use 8 machine learning models based on random forests and so-called gradient boosting machines (?, ?) (Materials and Methods).
-
vi
Each prognostic model is evaluated using the 5-fold-cross-validation, since it can be applied to datasets of different sizes (?). The -fold-cross-validation is a resampling method that divides data into sets (folds) of approximately equal size (?). The model is trained on folds and the remaining fold is used as test set for computing the prognostic power. This procedure is repeated times while a different fold is chosen each time as the test set.
-
vii
The median concordance index, also called C-index (?), is computed. The C-index describes the ability of a prognostic model to separate patients with good and poor outcomes (Materials and Methods). C-index of 0.5 denotes a completely random prognosis and a value of 1.0 implies that one can perfectly order the predicted temporal survival probabilities of patients: a patient with a higher survival time would get a higher probability than a patient with a shorter survival time. A C-index = 0 describes the perfect anti-concordance, where the predicted survival probabilities are inversely proportional to the survival times. In his seminal work, Harrell (?) provides the interpretation of the C-index as the percentage of patients that can be correctly ordered. For instance, a value of 0.7 indicates that one can correctly order patients’ prognoses 70% of all cases.
Steps ii-iv guarantee that the dependency on the selection method can be examined; and step v verifies that the maximum prognostic power is not confounded by a prognostic model.
Random signature superiority in breast cancer
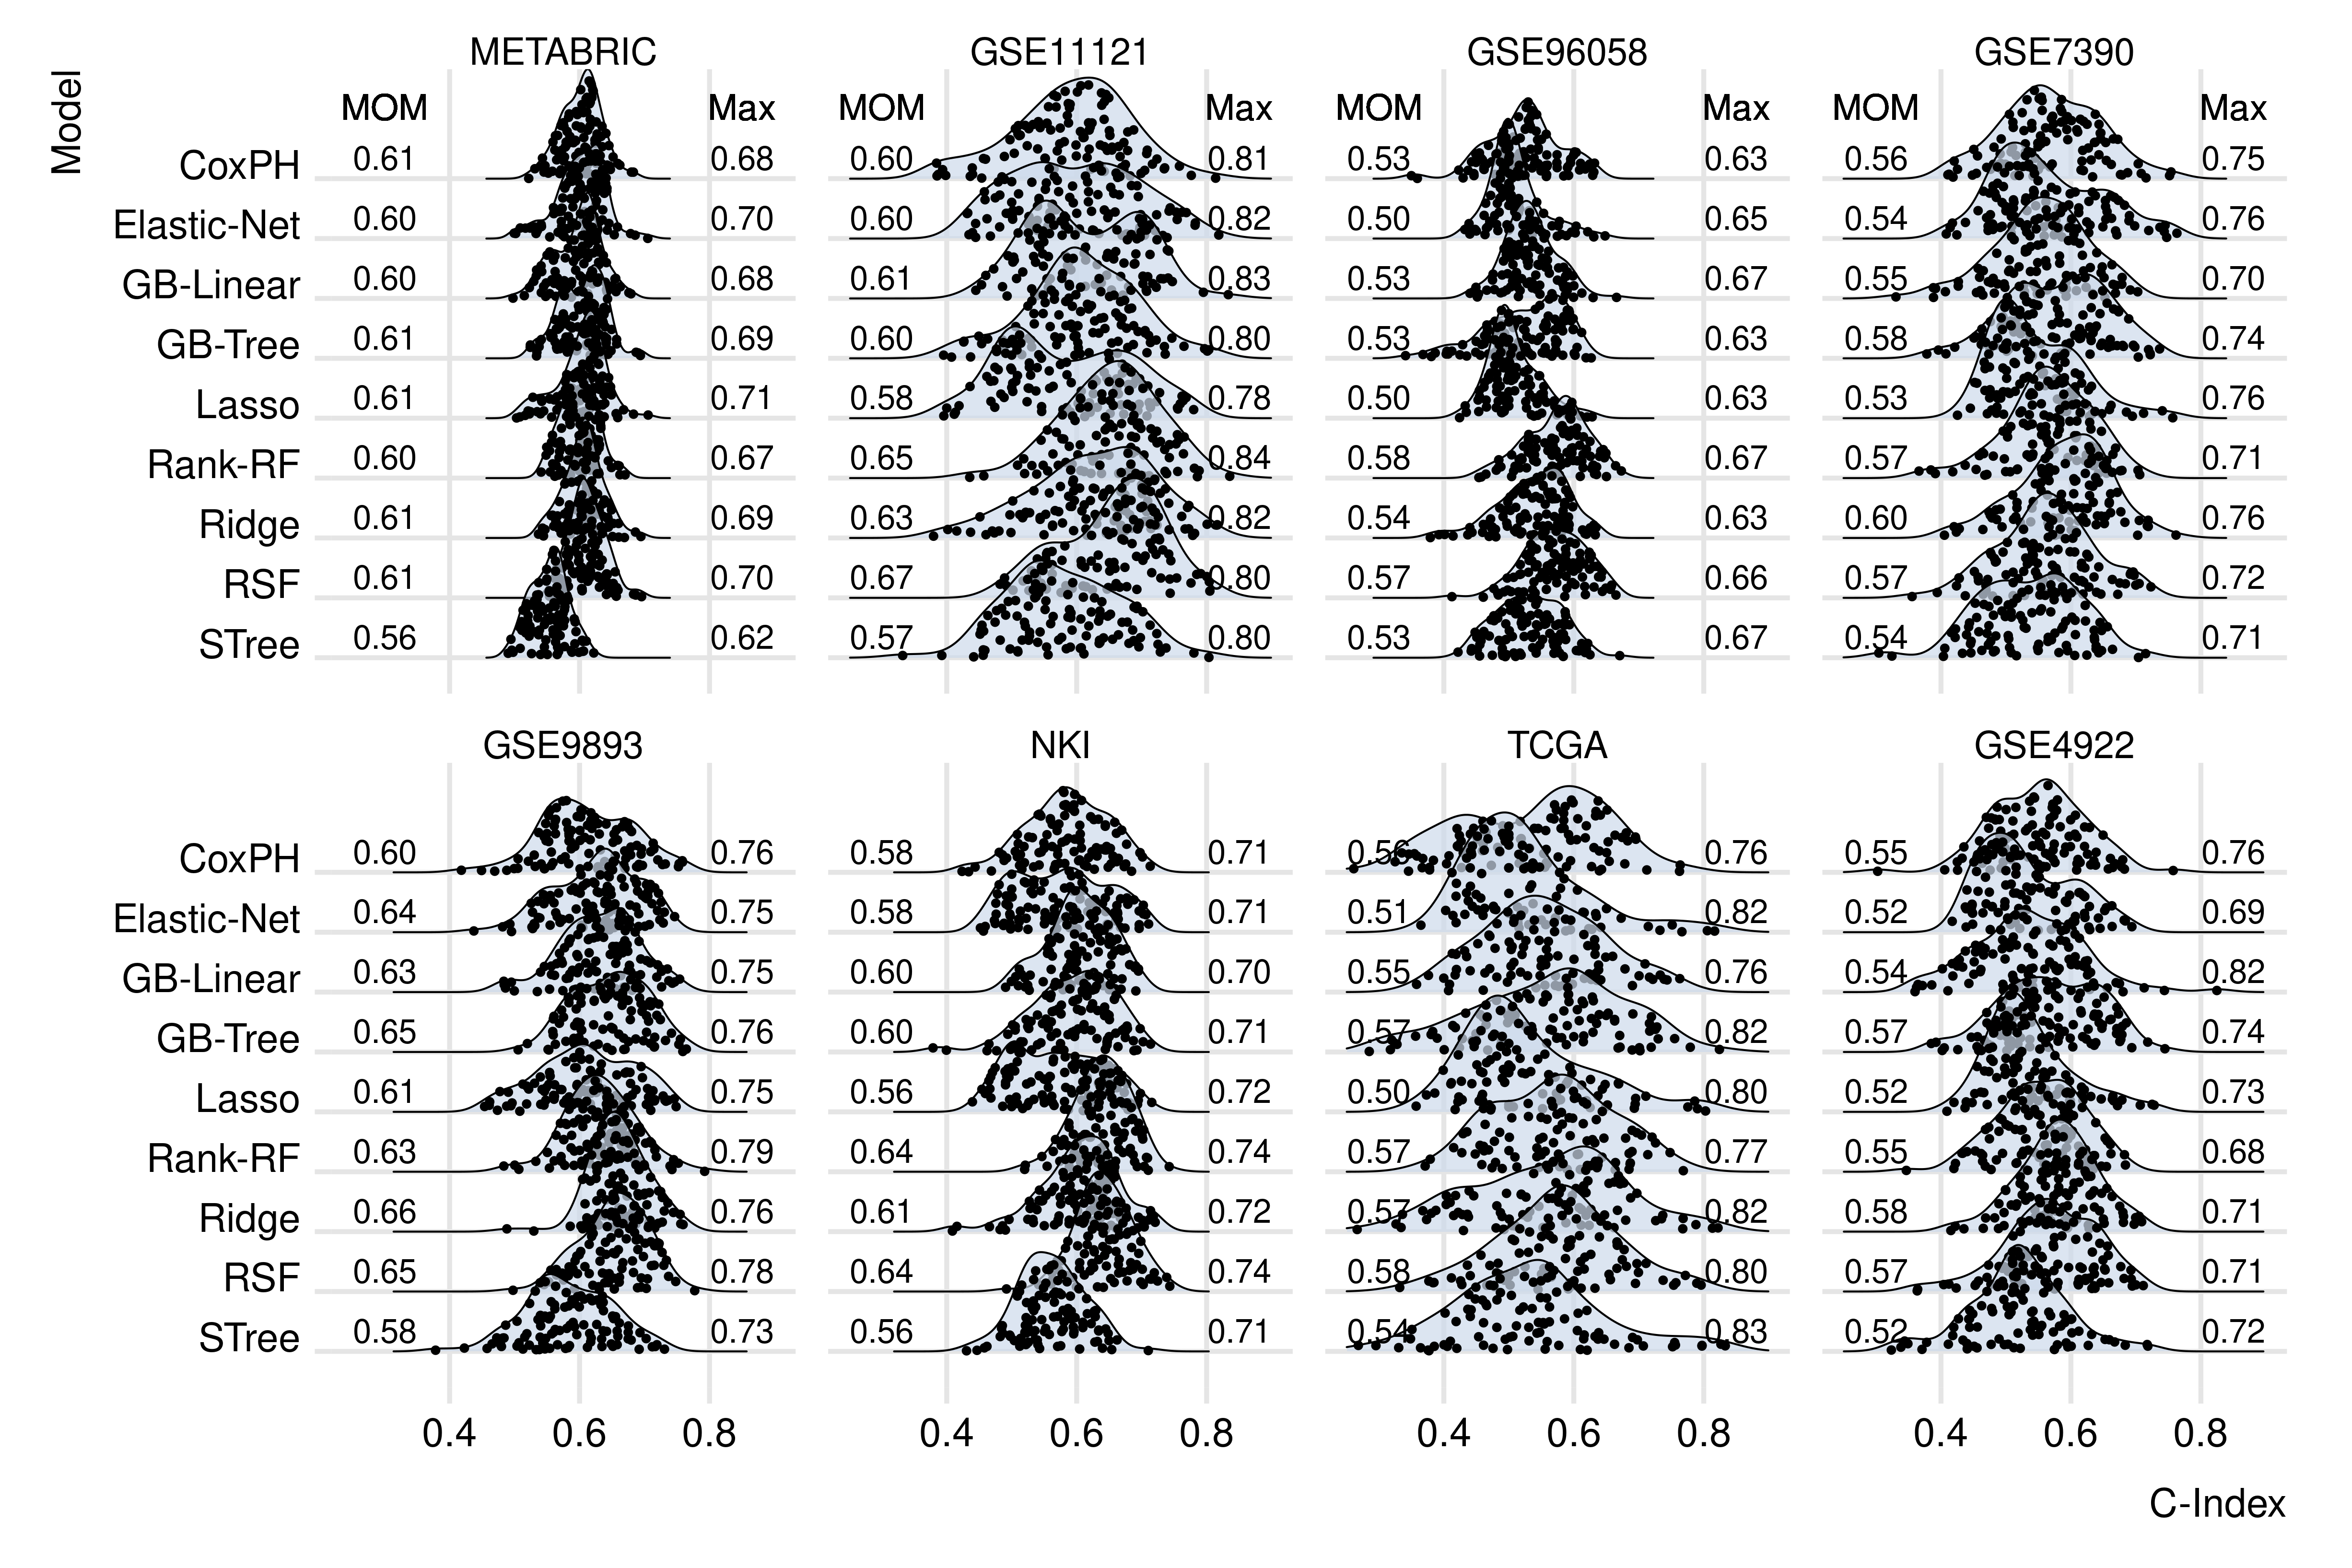
We evaluated the prognostic power of gene-expression signatures generated at random, since the so-called random signature superiority (RSS) is a known but still an underexplored area (?). In order to select a gene set, 20 genes were sampled at random in each dataset. We selected 100 gene sets, developed a prognostic model, and measured the corresponding C-index for each gene set. Fig. 2 shows the resulting C-indices.
Here, each data point represents the median C-index computed by the 5-fold cross-validation and based on a single random gene set. Each row corresponds to a machine learning prognostic model used to compute the risk score. There are 9 prognostic models of 100 random gene sets in each of 8 datasets, resulting in overall data points. On the left and on the right sides of each ridge plot, the median of the sample medians (MOM) and the maximum C-index (MAX) are shown, respectively. The median of the sample medians denotes the median value of medians per prognostic model and can be interpreted as the center of the distribution. Additionally, Fig. 2 shows the density plots, which approximate the distributions of the C-indices.
A critical question is whether random signatures are suited to test a potential maximum prognostic power, i.e. whether RSS applies to these data. The signature size is one of the major factors influencing RSS (?). Thus, to investigate how frequently RSS occurs, we calculated the number of random signatures performing above the C-index of the reported 26-gene signature (which has roughly the same size as random signatures, see Supplementary Reported Gene Selections) for each prognostic model and averaged this value over all datasets. We found (Supplementary Random Signature Superiority) that more than 60% of random signatures outperform the aforementioned reported signature in 4 of 8 datasets, exactly 49% in one dataset, and less than 22% in the remaining 3 datasets. Averaging across datasets, 44% of random signatures outperform the aforementioned reported signature. These results demonstrate that RSS is strongly present in the context of breast cancer gene expression. Consequently, they can be used to test if gene-expression signatures exhibit a maximum prognostic power.
Next, we examined whether the prognostic power can be increased by collecting a larger number of patients. As shown in Fig. 2 the center of the distribution and the variability of C-indices differ across the datasets. For this, we investigated whether the MOM and the median absolute deviation (MAD) correlates with the number of patients as well as with the event rate in a dataset. The event rate is the ratio of the number of events to the number of patients and represent a clinically relevant quantity, since prognostic quantities can vary by event rate (?). These dependencies are plotted in Supplementary Dataset Dependency for each prognostic model along with the correlation coefficients and their p-values. As can be inspected there, the MOM and MAD seem to be uncorrelated with both the number of patients and with the event rate. Thus, our data demonstrate that the overall prognostic power cannot be increased by collecting a larger number of patients.
Fig. 2 shows also that the best performing prognostic model is different in each dataset. Consequently, the values of maximum prognostic power are essentially unaffected by the choice of a prognostic model.
The points above demonstrate that random signatures can be used to compute the maximum prognostic power. Although the overall highest C-index is 0.84 (GSE11121, Rank-RF), Fig. 2 illustrates that the maximum prognostic power seems to be around the C-index of 0.8 for all models in all datasets.
Maximum prognostic power of current signatures
More than 30 different gene-expression signatures have been reported so far (?). These signatures are expected to outperform random signatures, since they have been associated with clinical outcomes in the original studies.
We adopted the approach described in (?), whose authors searched PubMed for breast cancer signatures or classifiers and collected the gene lists from the original publications. The majority of the corresponding gene sets (28 gene sets) has been used for prognosis, the rest 5 gene sets have been utilized for prediction, i.e. to predict response to a drug. We used these gene lists and the procedure described in Supplementary Reported Gene Selections to select the corresponding gene sets in each dataset.
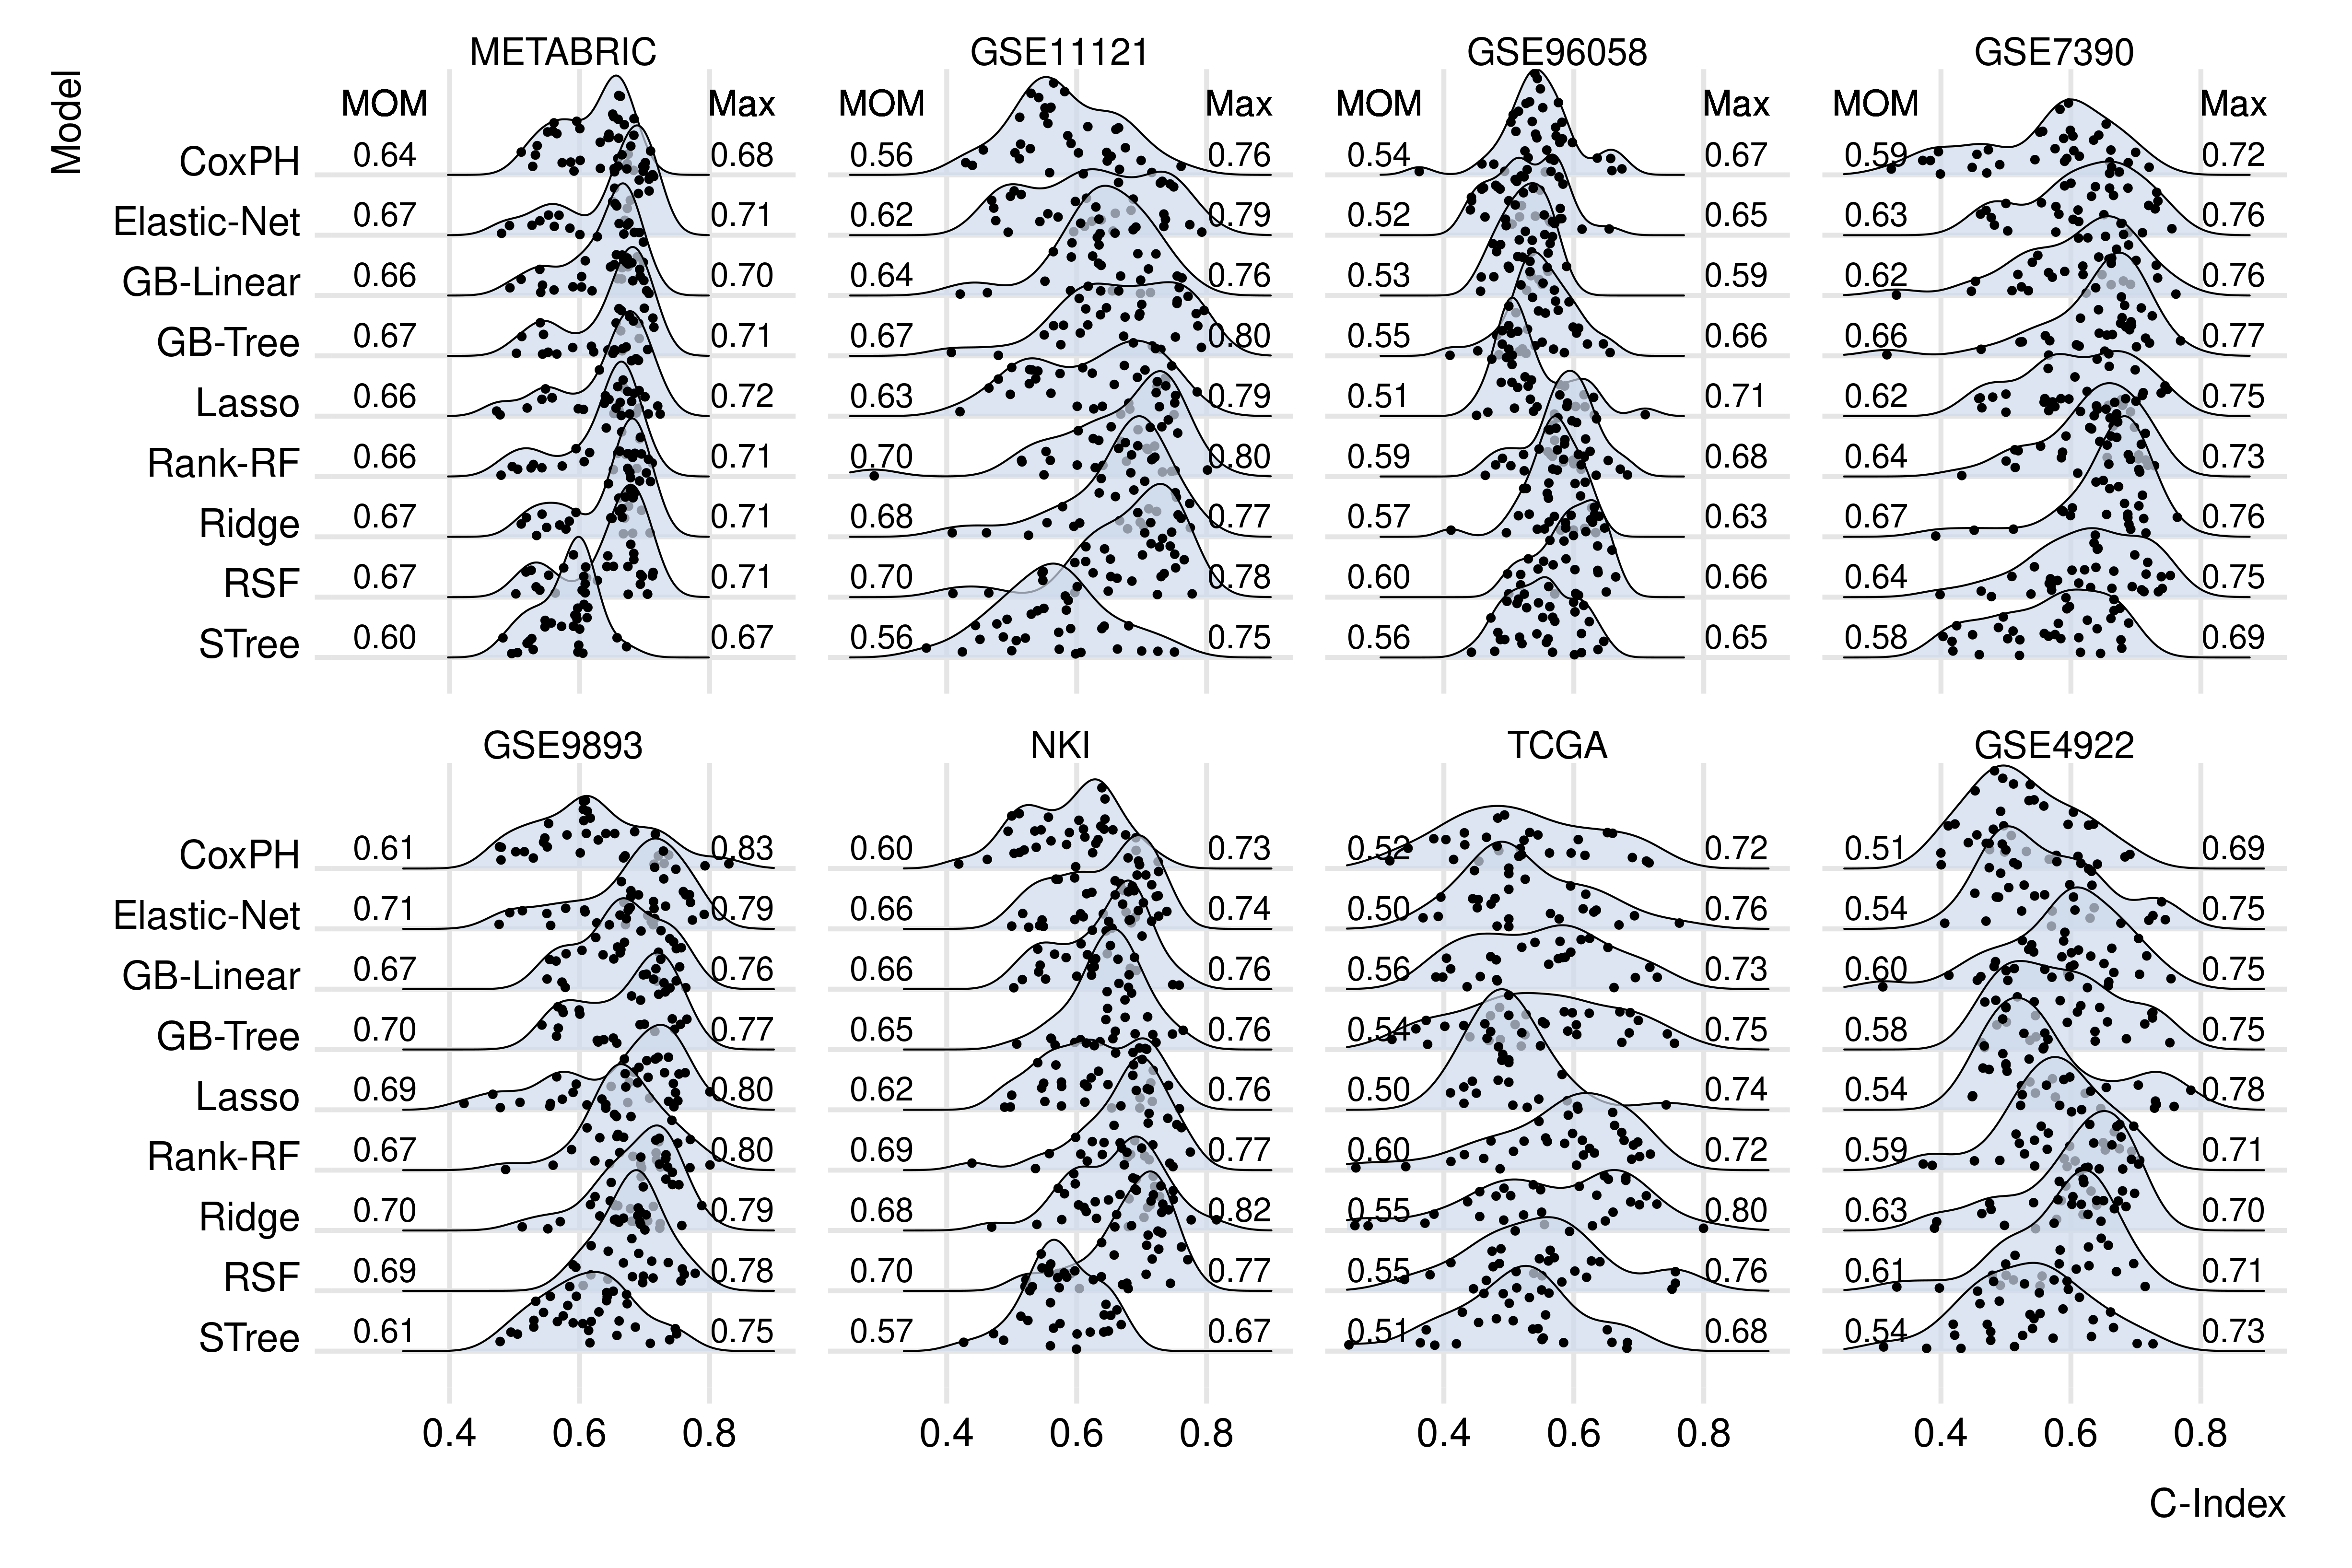
As can be seen in Fig. 3 , the C-indices are higher compared with the C-indices of random signatures. To quantify these differences, we show the distributions in form of the violin plots – i.e. box plots showing probability distributions – for each model and each dataset in Supplementary Comparison Random And Reported Signatures, and compare the distribution by using the Wilcoxon rank sum test, since the data are not normally distributed. As can be seen, reported signatures tend indeed to have higher C-indices than random signatures, although the level of statistical significance varies across models and datasets.
As already noted for random signatures, the center of the distribution and variability of C-indices differ across the datasets. Similarly, we investigated whether the prognostic power depends on the number of patients and the event rate in a dataset for the reported signatures. As can be seen in the Supplementary Dataset Dependency, the MOM and MAD are uncorrelated with both the number of patients and with the event rate for reported signatures as well. Thus, these results suggest that the overall prognostic power cannot be increased by collecting a larger number of patients.
Similar to the results above, Fig. 3 reveals that reported gene-expression signatures show an upper C-index limit around 0.8 across all prognostic models and datasets; although the highest C-index here is 0.82 (NKI, Ridge).
Maximum prognostic power of machine learning based gene-expression signatures
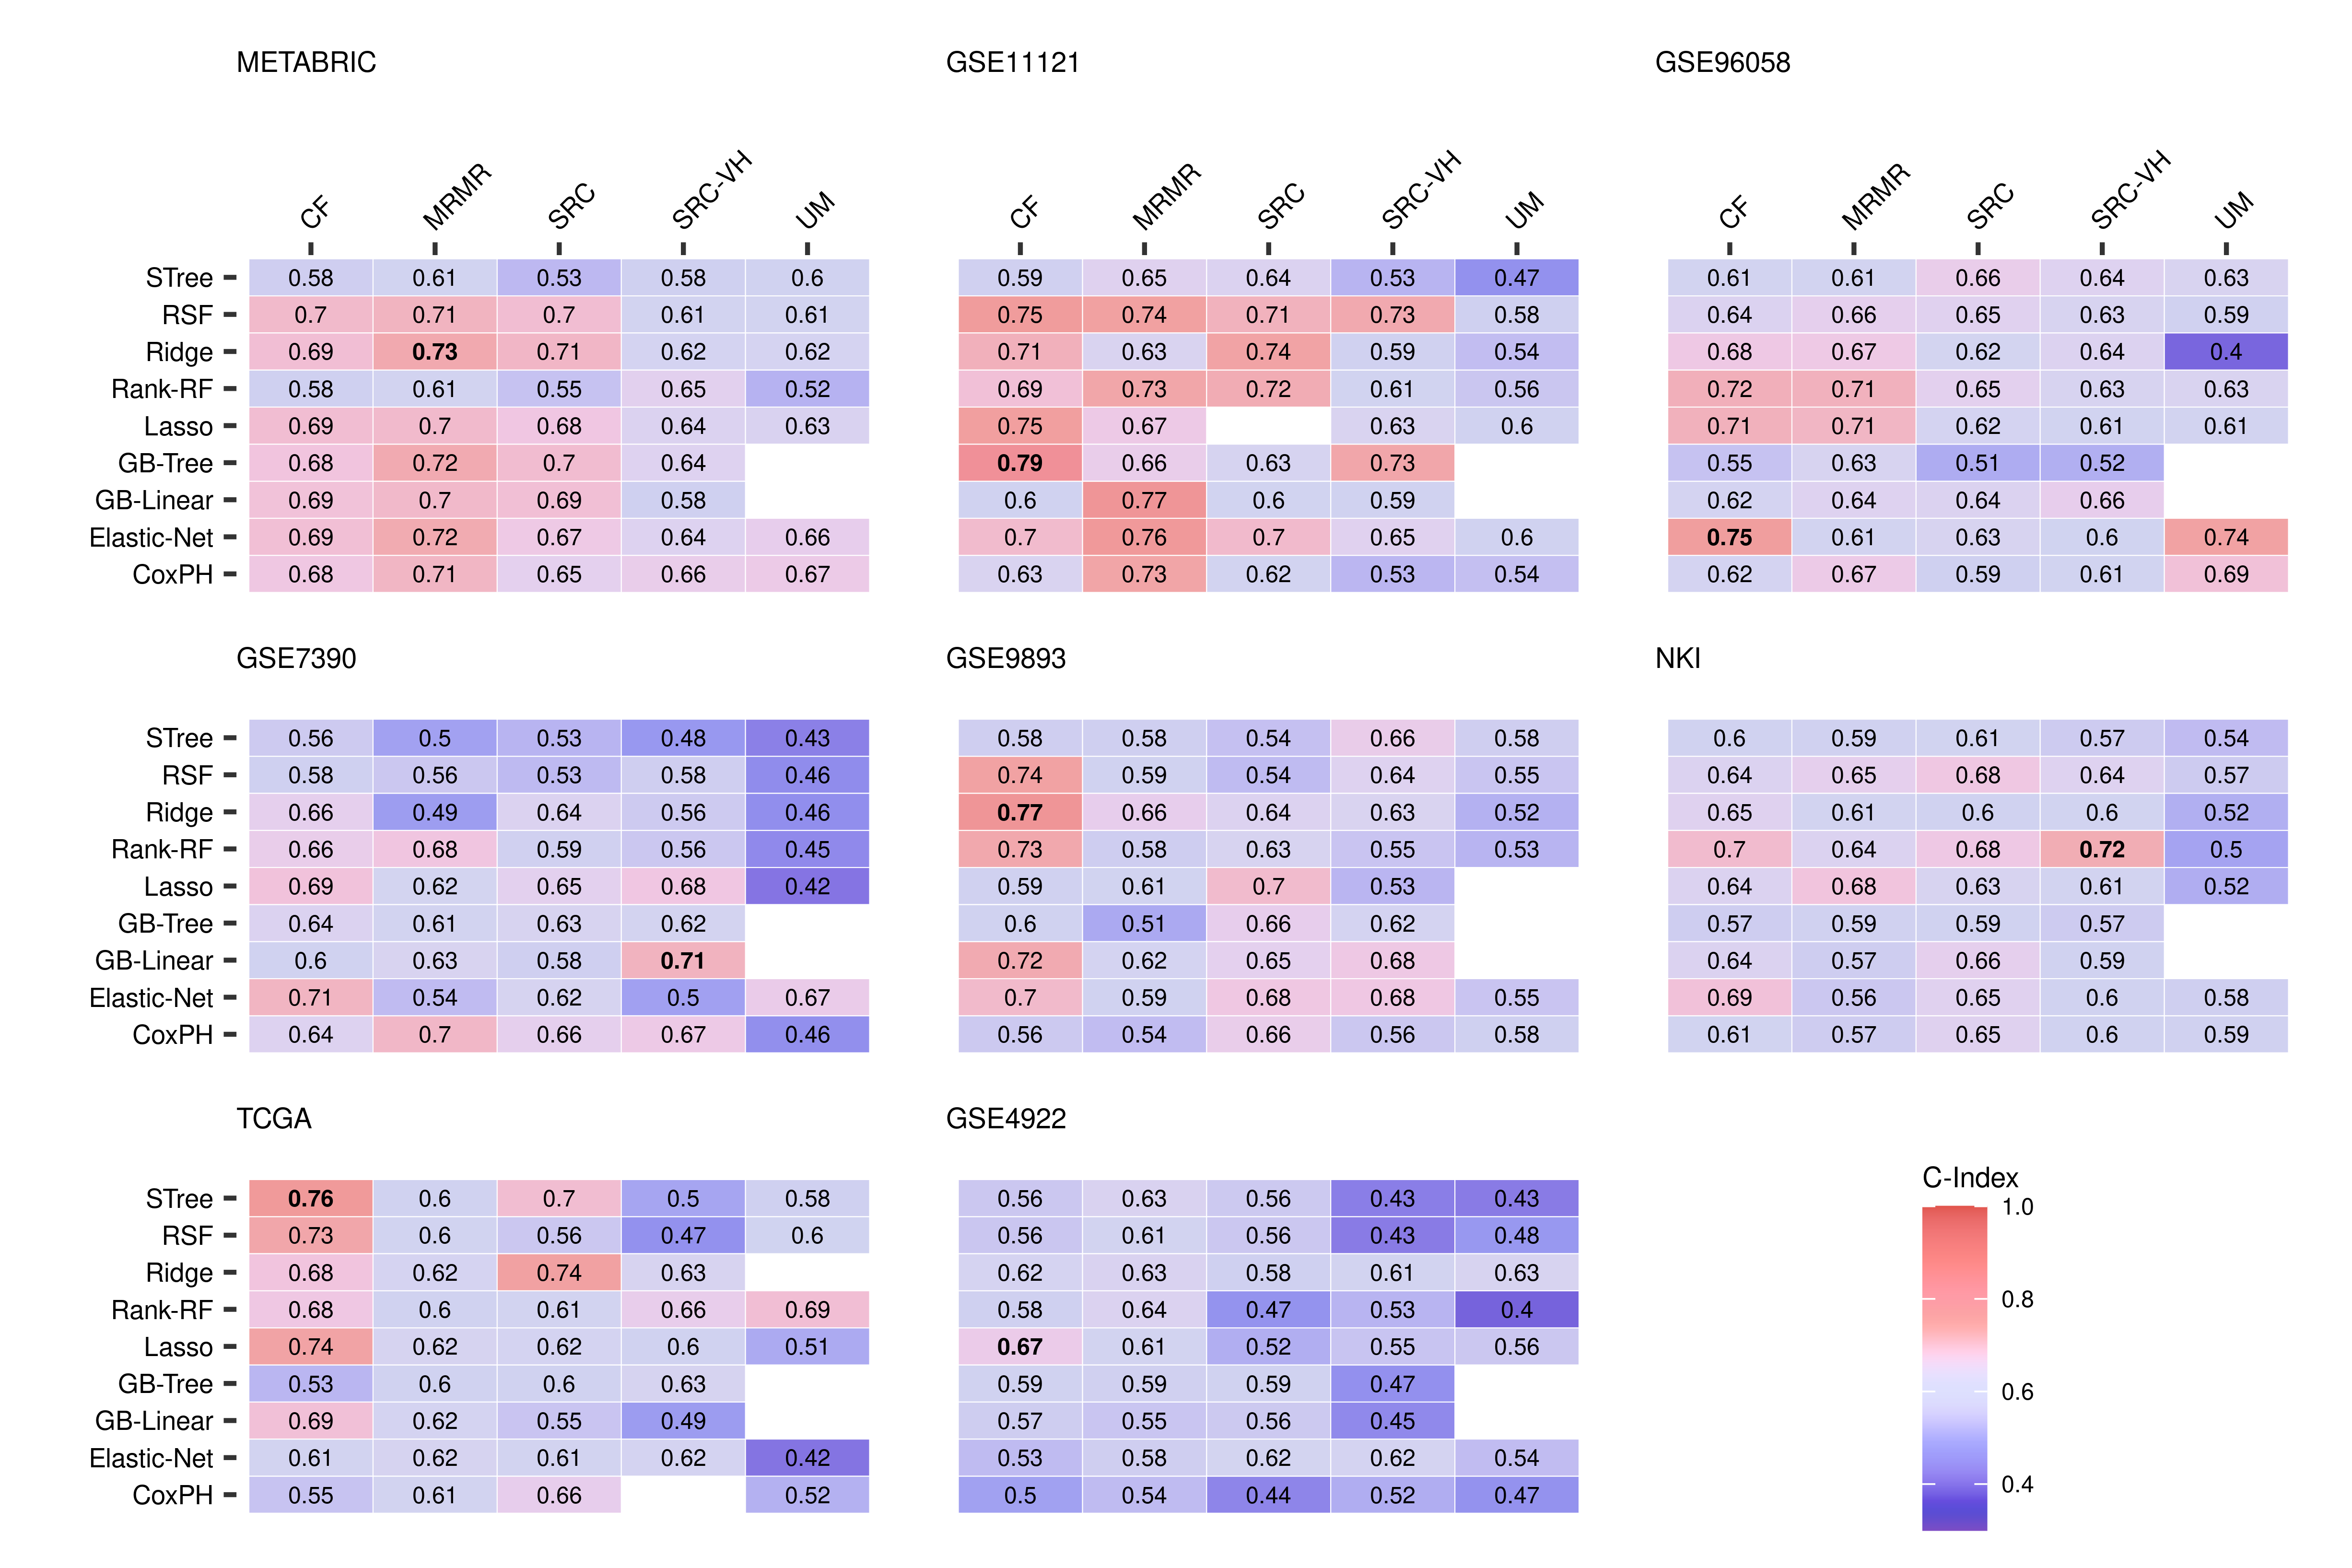
Machine learning has the potential to improve prognostic power, since algorithms such as Random Forests have the inherent ability to accommodate interactions between genes (?). For this reason, we applied 5 state-of-the-art machine learning selection models including Random Survival Forests with variable importance (SRC), with variable hunting (SRC-VH), Minimum Redundancy Maximum Relevance filter (MRMR), and Conditional Variable Importance for Random Forests (CF). The univariable model (UM) serves as baseline model, since it selects only one variable used for prediction of survival (Material and Methods).
The results are given in Fig. 4 in the form of heatmaps that show the C-indices for each combination of machine learning prognostic models (rows) and gene selection methods (columns) for all datasets.
As can be clearly seen, there is not a single prognostic model that outperforms other models. Also, there is not a single selection method that clearly outperforms all others. Both results indicate that there is no gold standard signature that can provide substantially higher prognostic power, and against which other signatures can be benchmarked.
However, it must be emphasized that we do not aim to find the best machine learning model nor the best selection method, but rather to see whether these results approach an universal prognostic limit.
As already noted for random and reported signatures, we investigated whether the prognostic power dependents on the number of patients and the event rate in a dataset. Supplementary Dataset Dependency shows that the MOM and MAD seem to be uncorrelated with both the number of patients and with the event rate, suggesting that the overall prognostic power cannot be increased by collecting more data.
Finally, the highest C-index across all datasets is 0.79 (GB-Tree, GSE11121), which repeatedly substantiates the existence of a prognostic limit.
Inherent prognostic limit of gene-expression signatures
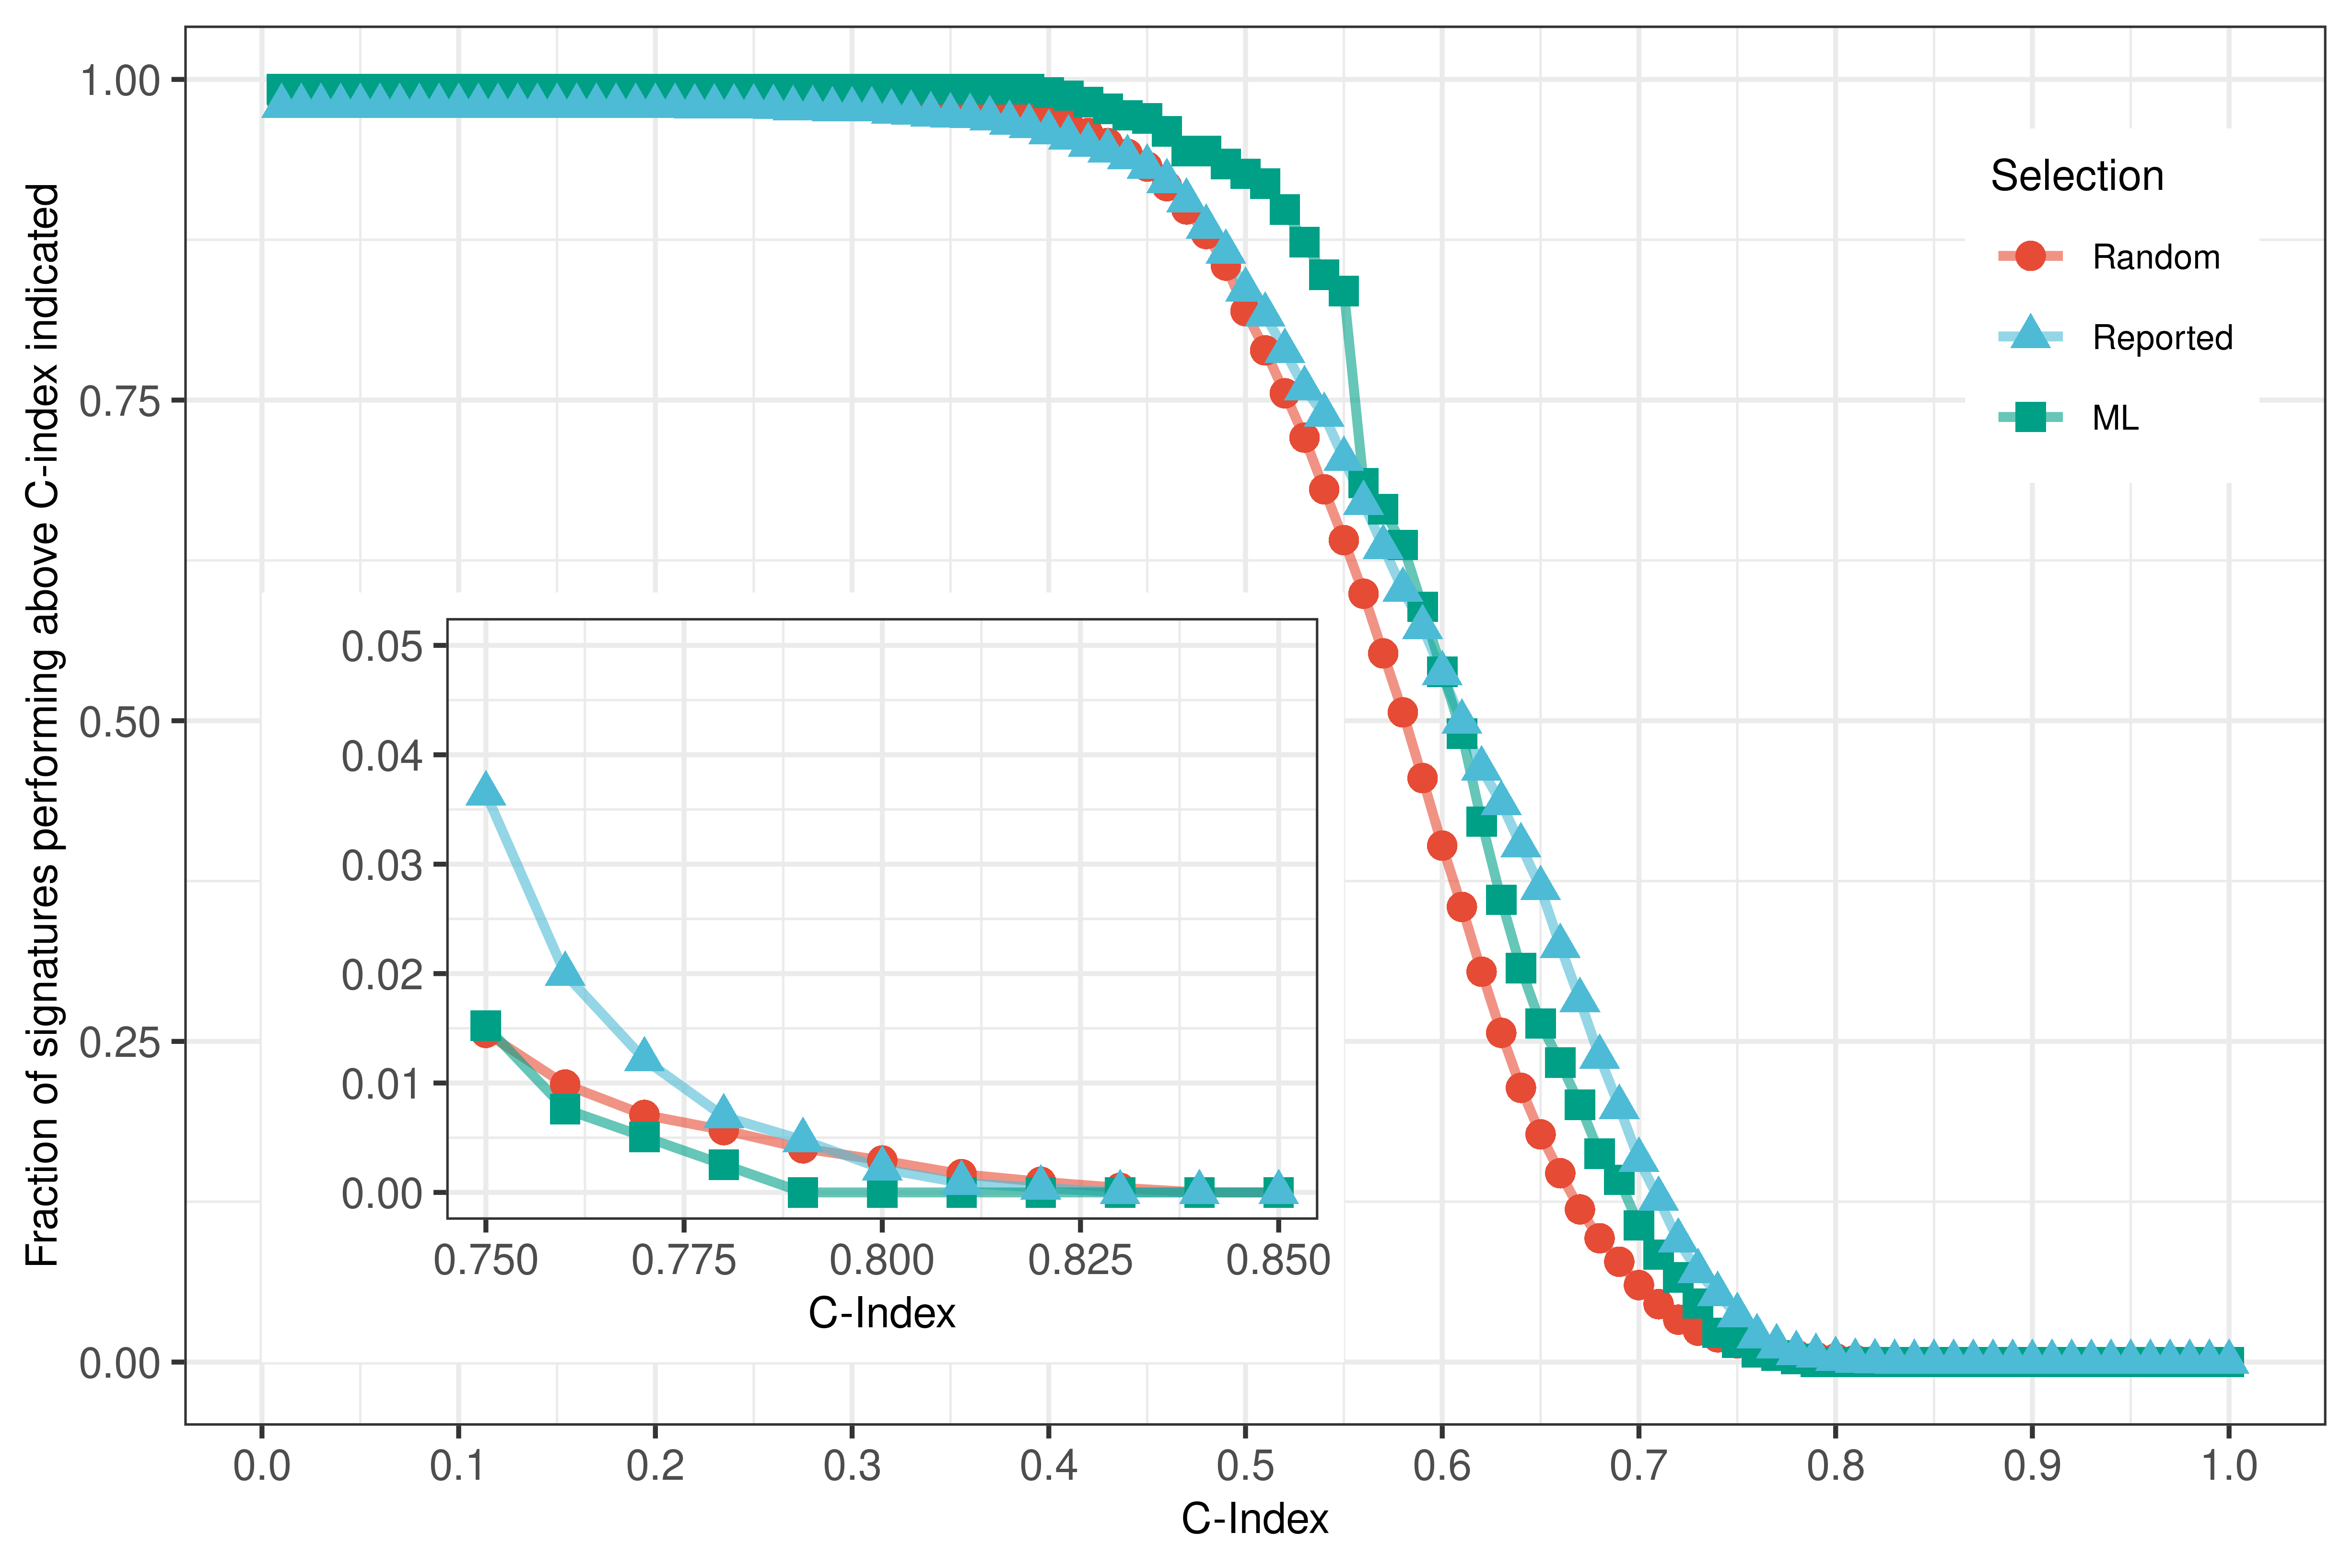
To summarize our results concerning the prognostic power, we plot in Fig. 5 the percentage of the signatures in all datasets that performs above the C-index indicated on the x-axis.
The figure shows that almost all signatures perform above the C-index of 0.3. Between this value and 0.4 the fraction of signatures starts to steadily decrease, and a sharp decline is observed in the range 0.4-0.8. The center of this range is roughly at 0.6 and more than 50% of signatures perform above this value.
The number of gene sets exceeding the value of 0.8 is almost 0. The values around 0.8 deserve special attention and are plotted in detail in the inset of Fig. 5. From this inspection, we see that the fraction drops below 1% at the C-index of 0.775 for all gene sets, vanishing at 0.825. Thus, we estimate the inherent prognostic limit to lie around the C-index 0.8. We used 8 datasets, 100 random, 33 reported, and 5 machine learning based signatures, evaluated by 9 prognostic models, resulting in overall signatures. In light of these findings, it seems unlikely to find a gene-expression signature that performs above this limit.
Missing information in current prognosis
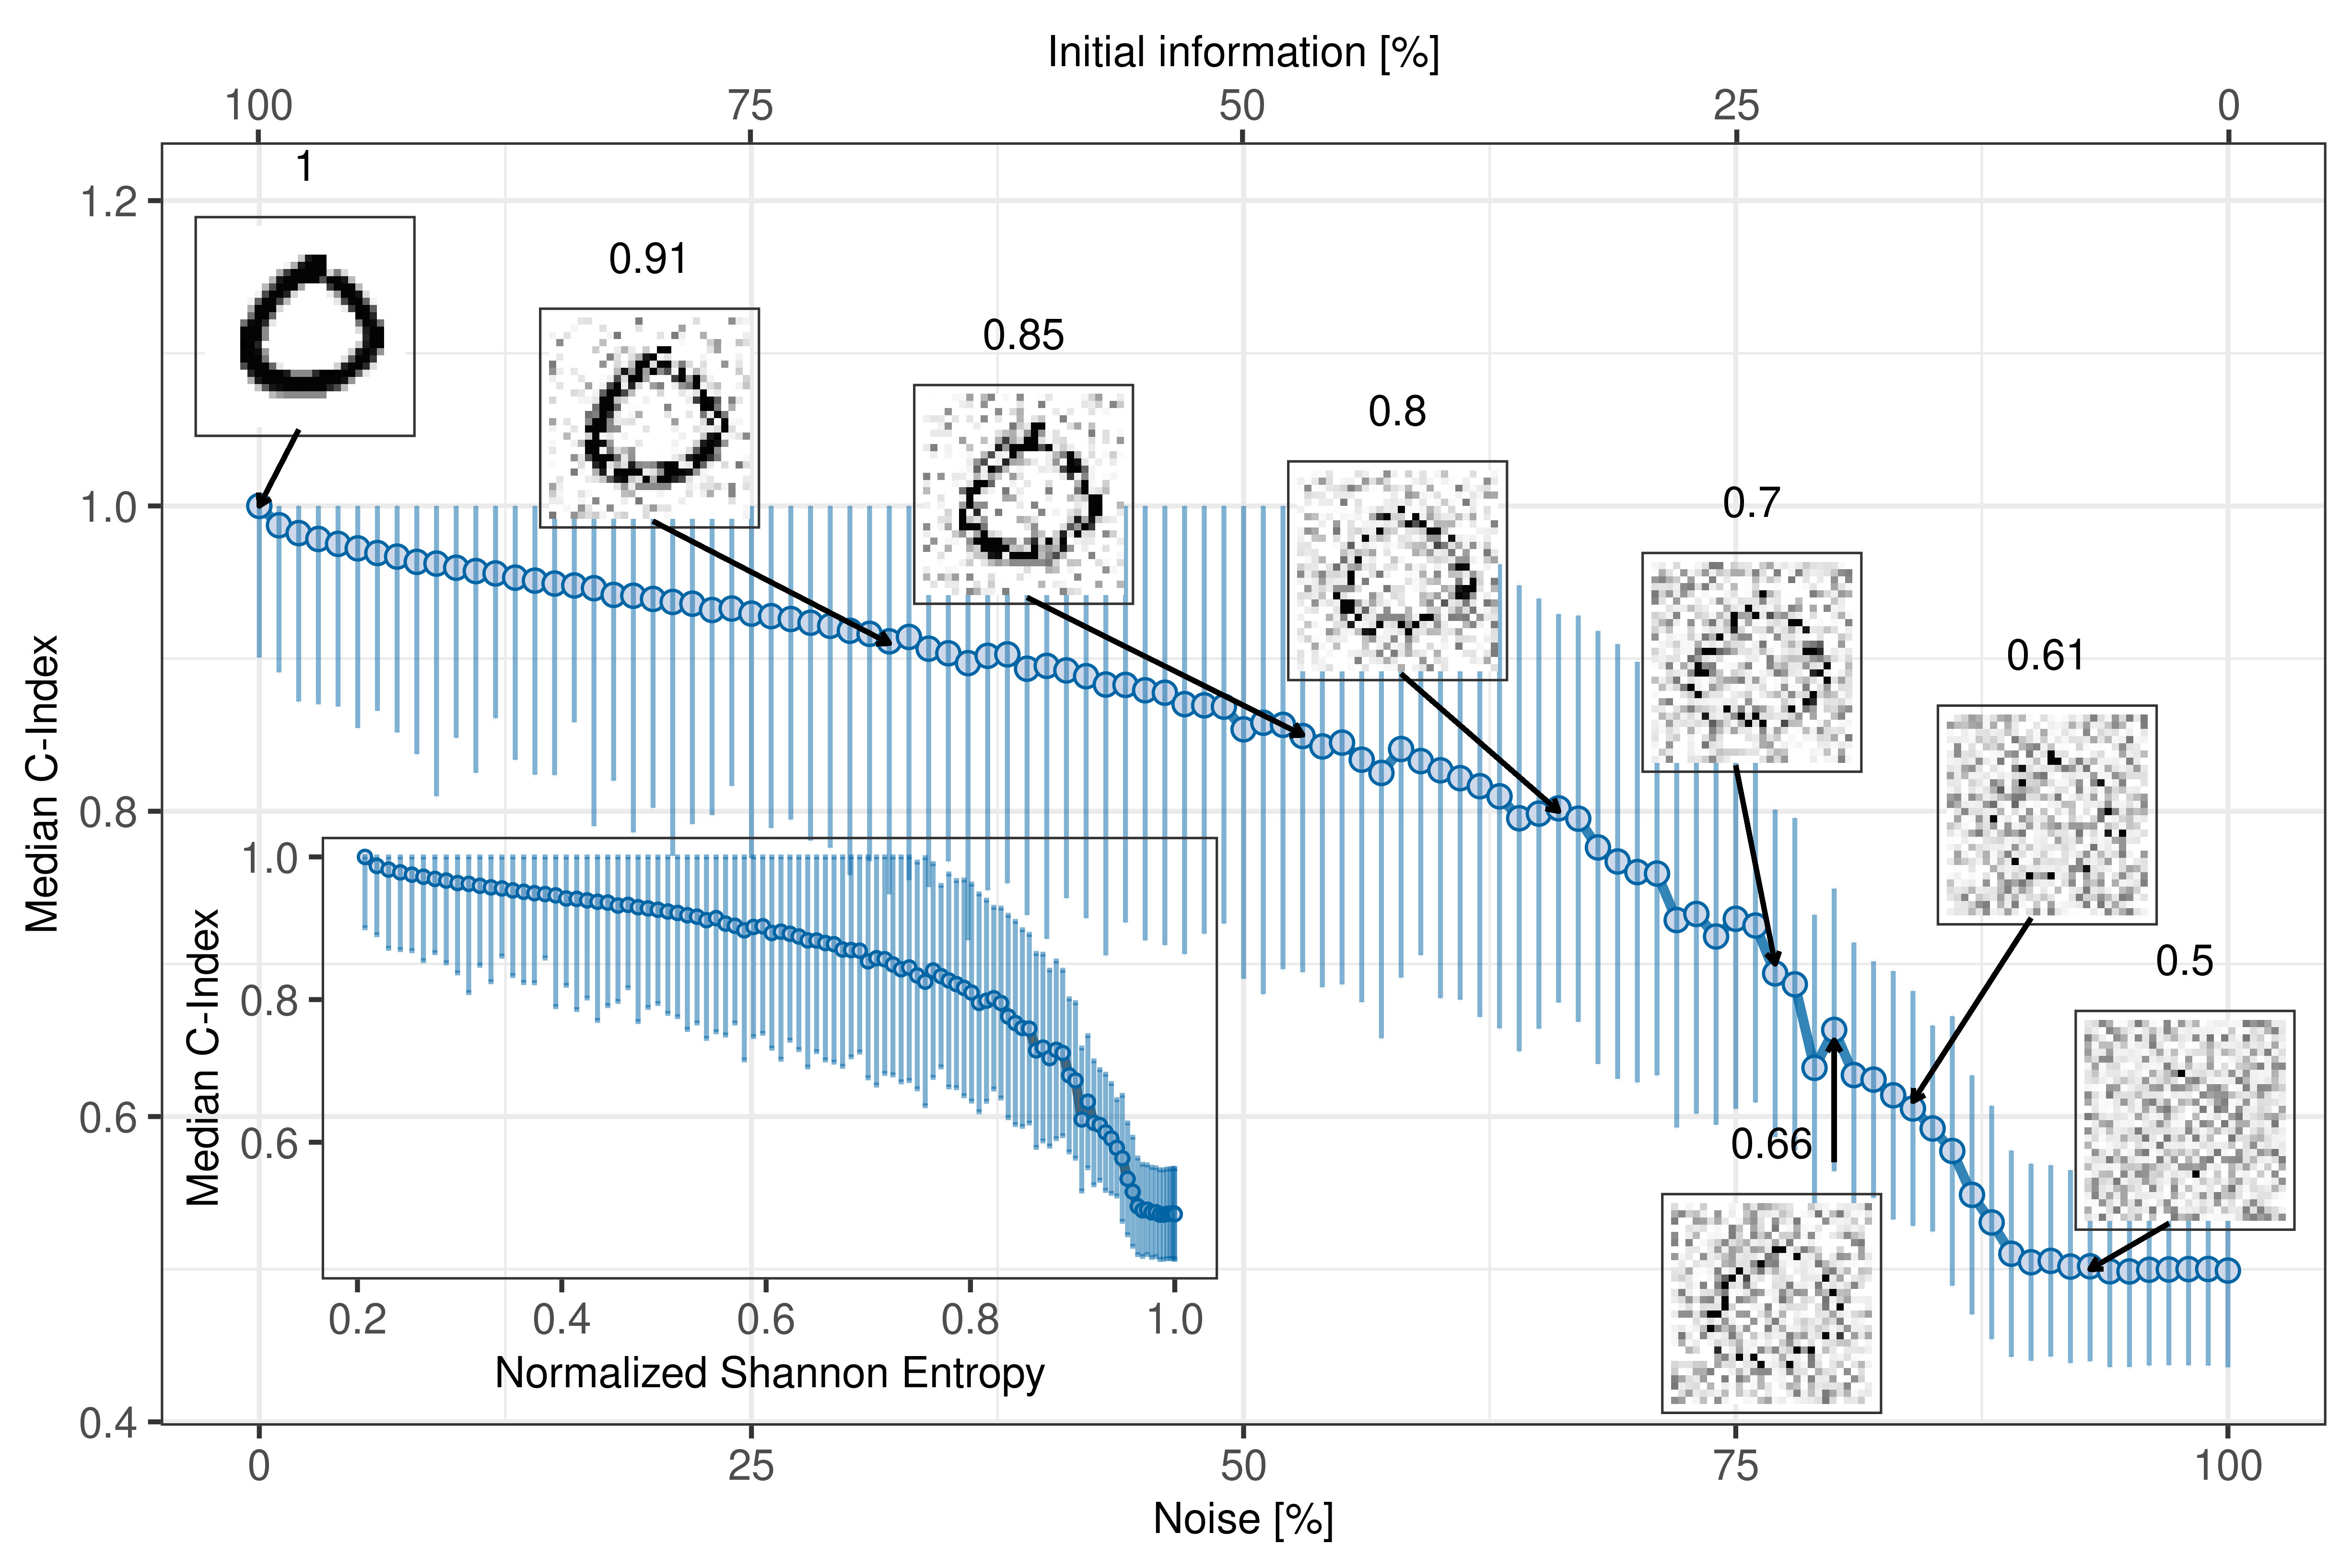
To quantify and visualize how much information is missing at a specific C-index, we simulated survival times based on the MNIST data (?) (Materials and Methods, Evaluation of the missing information), which are 70,000 handwritten pixel images of digits ranging from 0-9. Hereby, we assigned a survival time to each handwritten digit. We define the initial amount of information of an image as . In order to reduce the initial amount of information, we added different amounts of noise ranging from 0% to 100% to the images and computed the C-index at each amount of noise. This process was repeated 100 times, from which the median C-index was calculated. The results are shown in Fig. 6.
As can bee seen, prognosis based on images with 100% noise and with no noise have correctly the C-indices of 0.5 and 1.0, respectively. Common C-indices reported in the literature range from 0.7 to 0.8 (Materials and Methods). Interestingly, we see that 75% of the initial information is missing in the middle of this range (C-index=0.75). From a more practical perspective, one could argue that a C-index of 0.7 is sufficient for prognosis, since one identifies the correct digit from a simple visual inspection. However, more than 60% of initial information is missing at this C-index. Even at the C-index of 0.8 more than 50% of initial information is missing.
An alternative but standard way to look at information gain is the Normalized Shannon entropy (?), depicted in the inset of Fig. 6: , where is the number of occurrences of the intensity level divided by the number of bins ( pixels for a MNIST image), denotes the number of intensity levels (which is 256 for a gray-scale MNIST image), and is the maximum entropy value.
Thus, can be interpreted as the amount of randomness in an image . For example, = 0 implies that we know in advance that . Consequently, all pixels will have the same value. A value of 0.2 – shown as starting value in the inset of Fig. 6 – means that we are 20% uncertain about the information value of the image. On the other hand, a Shannon entropy of 1.0 implies that we 100% uncertain about the information content of an image.
The inset of Fig. 6 shows the dependency of the median C-index on the normalized Shannon entropy. Here, following the direction of decreasing entropy, it is apparent that the C-index increases drastically from 0.5 to roughly 0.8, meaning that in this range the C-index can be largely increased by small amounts of information. In contrast, the C-index rises only steadily above the value of 0.8, hitting a performance plateau, which implies that a prognostic model requires more information gain in order to reach a higher prognostic performance.
Discussion
This study presents two key results. First, we show that a maximum prognostic power exists and is inherent to gene-expression signatures. We have found a maximum prognostic power as high as 0.8 in terms of the concordance index, meaning that one can correctly order patients’ prognoses in no more than 80% of the time. This result is based on investigating the prognostic power of 10,000 gene-expression signatures developed with different methods and tested on different established breast cancer databases.
While the question of maximum prognostic power has not been previously addressed, these findings are compatible with what is known about the limits of predictability in cancer. For example, the review of Lipinski et.al. (?) outlines the role of stochastic factors in cancer evolution that fundamentally limit the predictability and development of more accurate prediction algorithms. Other works (?, ?, ?) also recognized a theoretical limit on predictability in cancer evolution. However, not a single study has provided an empirical estimation so far, which is of practical relevance in clinical prognosis.
There are also differences in C-indices between datasets, as observed in Fig.s 2 and 3, which may be related to the inter-platform and inter-cohort variability. However, a more probable explanation may be the difference in event types used for prognosis. More specifically, the prediction of disease-free, distant-metastasis-free, and recurrence-free survival is more specific than the prediction of the overall survival, which may include events that are not related to the disease. The Supplementary Event Type provides conclusive support for this explanation, where box plots of median C-indices are shown across datasets, indicating that both datasets – where the overall survival is used for the prognosis – exhibit the lowest performances.
One may assume that the prognostic power of gene-expression signatures would increase by collecting a larger number of patients. However, our results demonstrate that the maximum prognostic power is independent on the number of patients. One could also argue that the sample sizes – the largest dataset contains patients – are not sufficient to proof this. For this reason, we combined the 8 datasets into one large dataset resulting in 2500 patients, resampled the data with different sample sizes ranging from 800 to 2500 patients, and measured the median of the sample medians of 1000 random signatures at each sample size (Supplementary Combined Dataset). As can be seen there, the performance does not increase with larger sample sizes (). Moreover, the authors of (?) provide evidence that prognostic power cannot be increased with more data, although they measured the classification error of prognostic models instead of the concordance index. This points toward that not random noise hinders a better prediction, but that not all information is available.
The second key result of this study is the amount of information that is missing in gene signatures to provide a prognosis with a concordance above 80%. Quantitatively, it can be inferred from our interpretation of the concordance index in Fig. 6, that at a maximal C-index of 0.8, there are still 50% of missing information. This result suggests that we are currently still quite far from harnessing all information required for an optimal prognosis.
If a significant lack of prognostic information exists, what factors have the potential to improve prognosis?
As can be seen on our results, models based on a single variable (univariable models) show the lowest prognostic power. Thus, it is unlikely that a single gene-expression, clinical or histological variable will capture the missing information and determine prognosis with high prognostic power. The continued refinement of prognostic models that incorporate many complementary factors may allow for more accurate predictions of outcome. For instance, we have recently shown that the prognostic power can be substantially improved by simply combining gene expressions and clinical information into a hybrid model (?), although the same prognostic limitation may apply to other variables such as clinical and histological parameters. Similarly, multiple studies in cancer prognosis have recently emphasized a hybrid approach as well (?, ?, ?, ?).
Moreover, studies on gene-expression signatures have focused on defining molecular determinants within the tumor environment (?). However, host factors such as immune response, dietary variables, or hormone milieu may have profound effects on cell proliferation, invasion, and metastasis. Consequently, models that combine so-called tumor factors and host factors could allow to harness the missing information and substantially enhance the prognostic power.
However, combining complementary factors may not be sufficient and raises the question as to whether complementary combinations can capture the potential missing information. There are more complex relations, which cannot be clarified by a simple summation of orthogonal factors. We used machine learning models that can detect complex, non-linear effects between genes. However, we cannot be certain that these effects were indeed detected. In this context, such complementary factors may be other emergent effects that are not very sensitive to gene expression changes. For example, the migration of cancer cells through dense tissues is strongly dependent on the biomechanical interactions of the cancer cells with the host tissue (?), which at best only indirectly by mechanobiology depend on the cancer cells’ gene expression. We have recently introduced the so-called cancer cell unjamming as a simple biomechanical cell motility marker that describes the squeezing of migrating cells in dense tissue (https://doi.org/10.21203/rs.3.rs-1435523/v1). The unjamming within primary tumors as an emergent physical phenomenon is part of the metastatic cascade, and is complementary to the current prognosis, since no other marker reliably accounts for cell motility (?). From a clinical perspective there is an urgent need to precisely stratify patients with special attention on the question of whether any adjuvant measure after surgery is indicated. In current clinical practice, this is done on the basis of the histological tumor type, grade, and stage, and in addition under consideration of the results of an immunohistochemical workup as well as the determination of molecular biomarkers including gene expression profiles. Our approach could, after careful clinical validation, have an immediate impact by adding a new dimension, i.e. a morphological surrogate marker for motility, to the assessment of the prognosis of an individual breast cancer patient. And since this all would be done on a standard H&E stained slide, except for the software no further investment would be necessary.
Several commercially available gene-expression signatures are frequently used in the clinic not only for prognosis, but also to guide the decision whether a patient would benefit from adjuvant chemotherapy, i.e. to decide whether one can spare a potentially toxic treatment to a patient for whom it is not likely to be beneficial (?). Our results demonstrate that a prognosis based on gene-expression signatures alone is lacking 50% of the potential information and is thus fundamentally limited. However, it can be substantially improved by other relevant patient information, since more than the half of information is left to be revealed.
References
- 1. F. Andre, et al., Nature Reviews Clinical Oncology 8, 171 (2011).
- 2. A. Nicolini, P. Ferrari, M. J. Duffy, Seminars in cancer biology (Elsevier, 2018), vol. 52, pp. 56–73.
- 3. F. Chibon, European Journal of Cancer 49, 2000 (2013).
- 4. N. R. Latha, et al., Critical Reviews in Oncology/Hematology 151, 102964 (2020).
- 5. D. R. Cox, D. Oakes, Analysis of survival data (Chapman and Hall/CRC, 2018).
- 6. G. Poste, Nature 469, 156 (2011).
- 7. A.-S. Wegscheider, B. Ulm, K. Friedrichs, C. Lindner, A. Niendorf, Cancers 13, 3799 (2021).
- 8. J. Haybittle, et al., British journal of cancer 45, 361 (1982).
- 9. S. Koscielny, Science Translational Medicine 2, 1 (2010).
- 10. S. Michiels, S. Koscielny, C. Hill, Lancet 365, 488 (2005).
- 11. R. Simon, Journal of Clinical Oncology 23, 7332 (2005).
- 12. D. Venet, J. E. Dumont, V. Detours, PLoS Computational Biology 7 (2011).
- 13. K. Manjang, et al., Scientific Reports 11, 1 (2021).
- 14. M. H. Barcellos-Hoff, Radiation and Environmental Biophysics 47, 33 (2008).
- 15. H. Ducasse, et al., Evolutionary Applications 8, 527 (2015).
- 16. A. M. Soto, C. Sonnenschein, Journal of Biosciences 30, 103 (2005).
- 17. W. K. Chang, C. Carmona-Fontaine, J. B. Xavier, Interface Focus 3 (2013).
- 18. R. A. Gatenby, B. R. Frieden, Cancer Research 62, 3675 (2002).
- 19. H.-L. Chou, et al., BMC bioinformatics 14, 1 (2013).
- 20. W. W. B. Goh, L. Wong, Drug Discovery Today 23, 1818 (2018).
- 21. D. Tschodu, et al., PLoS ONE 17, 1 (2022).
- 22. S. Huang, L. Murphy, W. Xu, BMC Cancer 18, 1 (2018).
- 23. D. R. Cox, Journal of the Royal Statistical Society: Series B (Methodological) 34, 187 (1972).
- 24. Y. Freund, R. E. Schapire, Journal of computer and system sciences 55, 119 (1997).
- 25. J. Friedman, T. Hastie, R. Tibshirani, The annals of statistics 28, 337 (2000).
- 26. R. R. Picard, R. D. Cook, Journal of the American Statistical Association 79, 575 (1984).
- 27. T. Hastie, R. Tibshirani, J. H. Friedman, J. H. Friedman, The elements of statistical learning: data mining, inference, and prediction, vol. 2 (Springer, 2009).
- 28. F. E. Harrell, R. M. Califf, D. B. Pryor, K. L. Lee, R. A. Rosati, JAMA: The Journal of the American Medical Association 247, 2543 (1982).
- 29. N. R. Cook, Diagnostic and Prognostic Research 2, 1 (2018).
- 30. M. Fernández-Delgado, E. Cernadas, S. Barro, D. Amorim, Journal of Machine Learning Research 15, 3133 (2014).
- 31. Y. Lecun, L. Bottou, Y. Bengio, P. Ha, Proceedings of the IEEE pp. 1–46 (1998).
- 32. C. E. Shannon, The Bell system technical journal 27, 379 (1948).
- 33. K. A. Lipinski, et al., Trends in Cancer 2, 49 (2016).
- 34. J. P. Stegemann, Tissue Engineering 23, 1 (2007).
- 35. R. A. Burrell, N. McGranahan, J. Bartek, C. Swanton, Nature 501, 338 (2013).
- 36. Z. D. Blount, R. E. Lenski, J. B. Losos, Science 362 (2018).
- 37. M. R. Yousefi, L. A. Dalton, 3rd IEEE EMBS International Conference on Biomedical and Health Informatics, BHI 2016 pp. 537–540 (2016).
- 38. G. Montavon, W. Samek, K.-R. Müller, Digital signal processing 73, 1 (2018).
- 39. L. Kumar, R. Greiner, PLoS ONE 14, 1 (2019).
- 40. E. Christodoulou, et al., Journal of clinical epidemiology 110, 12 (2019).
- 41. V. Popovici, et al., BMC Bioinformatics 17, 1 (2016).
- 42. P. Gallins, E. Saghapour, Y. H. Zhou, Frontiers in Genetics 11, 1 (2020).
- 43. J. Hao, S. C. Kosaraju, N. Z. Tsaku, D. H. Song, M. Kang, Pacific Symposium on Biocomputing 25, 355 (2020).
- 44. L. Schneider, et al., European Journal of Cancer 160, 80 (2022).
- 45. T. Karn, L. Pusztai, A. Rody, U. Holtrich, S. Becker, Current cancer drug targets 15, 652 (2015).
- 46. S. Grosser, et al., Physical Review X 11, 011033 (2021).
- 47. T. S. Gerashchenko, et al., Journal of clinical medicine 8, 1092 (2019).
- 48. R. Varnier, et al., Cancers 13, 4840 (2021).
Acknowledgments
We thank Bernhard Ulm and Dr. med. Benjamin Wolf for valuable feedback. Author contributions: Conceptualization: D.T., J.L., P.G., A.N., and J.A.K. Methodology: D.T., J.L., P.G., Software: D.T. Formal analysis: D.T. Data Curation: D.T. Writing – original draft preparation: D.T. Writing –review and editing: D.T., J.L., A.S.W., A.N., and J.A.K. Supervision: A.N., and J.A.K. Project administration: A.N., and J.A.K. Competing interests: The authors declare no competing interests. Data and Materials availability: All datasets – except METABRIC – are available in the NCBI Gene Expression Omnibus: https://www.ncbi.nlm.nih.gov/geo/. METABRIC data are available from the METABRIC Institutional Data Access/Ethics Committee (contact via metabric[at]cruk[dot]cam[dot]ac[dot]uk) for researchers who meet the criteria for access to confidential data. The data underlying the results presented in this study are available from https://ega-archive.org/dacs/EGAC00001000484. Code scripts to download, prepare, and analyze data are deposited in a Github repository: https://github.com/DiTscho/LimitOfPrognosis. Funding: This work was supported by the European Research Council (ERC 741350/HoldCancerBack, https://cordis.europa.eu/project/id/741350/de), the DeutscheForschungsgemeinschaft (DFG KA 1116/17-1 and INST 268/296-1 FUGG, https://www.dfg.de/), and the National Science Foundation (NSF-PHY1607416, https://www.nsf.gov/awardsearch/showAward?AWD_ID=1607416).
Supplementary Materials:
Materials and Methods
Supplementary Data
Supplementary Reported Gene Selections
Supplementary Machine Learning Models
Supplementary Gene Selection Methods
Supplementary Random Signature Size
Supplementary Random Signature Superiority
Supplementary Difference Between Selection Methods
Supplementary Dataset Dependency
Supplementary Combined Dataset
Supplementary Event Type
Figs. S1 to S8
Tables S1 to S5