2022
[1]\fnmSara \surMalvar
[1]\orgnameMicrosoft Research, \orgaddress\streetMicrosoft Building 99, 15010 NE 36th St 2, \cityRedmond, \postcode09805, \stateWa, \countryUSA 2]\orgnameBrown University, \orgaddress\cityProvidence, \postcode02912, \stateRI, \countryUSA
Machine learning can guide experimental approaches for protein digestibility estimations
Abstract
Food protein digestibility and bioavailability are critical aspects in addressing human nutritional demands, particularly when seeking sustainable alternatives to animal-based proteins. In this study, we propose a machine learning approach to predict the true ileal digestibility coefficient of food items. The model makes use of a unique curated dataset that combines nutritional information from different foods with FASTA sequences of some of their protein families. We extracted the biochemical properties of the proteins and combined these properties with embeddings from a Transformer-based protein Language Model (pLM). In addition, we used SHAP to identify features that contribute most to the model prediction and provide interpretability. This first AI-based model for predicting food protein digestibility has an accuracy of 90% compared to existing experimental techniques. With this accuracy, our model can eliminate the need for lengthy in-vivo or in-vitro experiments, making the process of creating new foods faster, cheaper, and more ethical.
keywords:
DIAAS, protein digestibility, AI, ML interpretability1 Introduction
The increase in the world population and the need for more nutritious food will increase the demand for animal-based foods by nearly 70%, particularly from ruminant meat world_bank_world_2007 . Closing this food gap will intensify the pressure on land usage and contribute to an increase in greenhouse gas (GHG) emissions henchion_future_2017 . Due to such environmental concerns, transitioning towards more sustainable diets and exploring alternative protein sources have been at the forefront of 21st century research nadathur_sustainable_2017 .
Although plant proteins have already been associated with lowering the risk of type 2 diabetes, cardiovascular diseases, hypertension, obesity, metabolic syndrome and all-cause mortality in prospective cohort studies yokoyama_vegetarian_2014 ; satija_plant-based_2016 ; dinu_vegetarian_2017 ; kim_plantbased_2019 , there is still a long way to go in terms of texture, flavor, and bioavailability. A common concern among consumers is recognizing which foods are good protein sources and whether proteins from plants are of as good quality as those from animal-derived foods. The interaction between animal and plant proteins is being comprehensively investigated to develop balanced mixtures of animal and vegetable proteins. These studies involve determining and understanding protein structure-function relations, optimizing the use of the components of the product, improving the quality, reducing costs, and finding new protein applications.
Protein quality is defined by the essential amino acid composition of the protein, as well as the bioavailability and digestibility of its constituent amino acids. Over the last few decades, tremendous effort has been made to develop methodologies for measuring protein quality. The Food and Agriculture Organization of the United Nations (FAO) currently advises evaluating protein quality in human diets using Digestible Indispensable Amino Acid Score (DIAAS) values, which are measured through human or pig ileal digesta fao_dietary_2013 . Unlike older methods such as Protein Digestibility Corrected Amino Acid Score (PDCAAS) values, DIAAS values are obtained by multiplying the digestibility of each essential AA by its concentration in the protein and then comparing the results to a scoring system rutherfurd_protein_2015 . This digestion process can also be simulated in-vitro. In this case, the digestibility is measured by monitoring the amount of soluble proteins, changes in digesta pH (reflecting protein hydrolysis), or the level of increase in the nitrogen not incorporated in protein structures (i.e., nonprotein nitrogen) karlund_harnessing_2020 . Although in-vitro analysis can be cheaper and easier than the methods to predict the outcome of in-vivo digestibility, the complexity of in-vivo digestibility has not been realized fully in an in-vitro model bohn_correlation_2018 . In addition, working with animals can be time consuming, costly and one could face ethical barriers.
Currently, an important goal for food manufacturers is to replicate the flavor profiles, texture, and bioavailability of a meat replacement. This approach has traditionally been quite repetitious, with hundreds of alternative protein source formulations eventually narrowed down to the most comparable profile. In this work, we aim to provide a solution to accelerate this process at a reduced cost through the use of an AI model for protein digestibility prediction. Our contributions are as follows:
-
1.
Dataset creation We combine nutritional information such as dietary fiber content, fat, and vitamins of various foods with the FASTA sequences of their protein families. We use these sequences for a feature extraction step that aims to identify protein structural characteristics. The extracted structural features and the nutritional information formed the basis of our dataset used to predict the DIAAS value. The feature vector for each food consists of their structural and nutritional characteristics, amino acid composition and some categorical variables related to the food type. To our knowledge, this is the first attempt to associate these disparate features and use them in a machine learning (ML) model.
-
2.
Interpretability We select the features with higher predictive power, and, consequently, facilitate the model’s interpretability. Selecting these features enhanced the model’s performance due to dimensionality reduction. Exploring model interpretability is an important step to guide new experiments and new food design processes, as it gives insight on how protein engineering can be used to change protein’s structural information to increase a food’s digestibility. Similarly, it can guide how we can add/remove salts, decrease dietary fiber content and manipulate the nutritional information to achieve higher bioavailability. In addition to that, we were able to confirm some important proved correlations between food nutrients and protein digestibility.
-
3.
ML modeling We developed an alternative ML-based approach to predict the DIAAS score that avoids in-vivo and in-vitro testing, is cost-effective, and fast. With a 90% accuracy compared to experimental approaches, our model can be used to guide experimental approaches by testing new protein sources in a faster, cheaper, and ethical manner. Our ML model targets true ileal digestibility coefficient of each indispensable amino acid, which allows us to calculate DIAAS for each food item, considering the reference values.
2 Results
2.1 Dataset curation
To be able to train a model that can predict digestibility, it is necessary to obtain training data. To our knowledge, there was no public ground truth data available at this point, especially for DIAAS, as it has been proposed more recently. Thus, a complete database was developed for this analysis using the following original data:
-
•
First, a database containing ileal amino acid digestibility values for more than 180 food items along with the associated DIAAS values in cases where adequate information was reported to derive this score molly_muleya_ileal_2021 was used. This data was obtained from over 30 references presented in supplementary table 2. This feature is defined as our target variable.
-
•
Nutritional information for foods such as fat, potassium and sodium content was obtained from data from the FoodData Central of the United States Department of Agriculture (USDA) us_department_of_agriculture_usda_agricultural_research_service_nutrient_data_usda_nodate and Food Data from the National Food Institute in the Technical University of Denmark FRIDA . For each food item in the database, the features presented in supplementary tables 3 and 4 were also added.
-
•
In order to capture additional protein features, the FASTA sequence of at least two of the most abundant proteins from different protein families of each food item were added to the dataset. Then, their physio-chemical and biochemical properties were generated using Protlearn dorfer_protlearn_nodate and added to the database. These features are shown in section 5.8 of the Supplementary Material.
2.2 Baseline models
First, 12 baseline regressors were trained on all 1671 features of 189 food items. The R2 values and RMSE of the 12 models is shown in section 5.4 of the Supplementary Material. The 3 top-performing models were based on boosting and bagging techniques applied to decision trees: LightGBM, XGBoost and Random Forest. The target variable was defined as the true ileal digestibility coefficient of each indispensable amino acid, as further detailed in Methods. As reported in section 5.4 of the Supplementary Material, we found that the Random Forest, XGBoost, and LightGBM models predicted the ileal digestibility coefficient with a validation of 0.83, 0.87, and 0.88 respectively.
2.3 Feature selection and SHAP values
The second step of many ML methods is the feature extraction, the aim of which is to get the most effective features from the obtained raw segment. This problem was approached as a feature selection or dimensionality reduction method, which is pervasive in all domains of application of machine learning and data mining. To understand the importance of the features in the model and provide some explainability, a sensitivity based method called SHAP guyon_advances_2017 was used for feature importance evaluation lundberg_unified_2017 (see Methods). First, we determined the importance of the features using SHAP. Then, we used Principal Component Analysis noauthor_principal_2002 and determined that the top 20 features explained above 95% of the model variance. Therefore, we selected these features for our model, as shown in figure 1. The color represents the feature value, where red indicates high and blue indicates low. It is noticeable that some of the SHAP-selected features presented as important are known in the literature for their direct effect on digestibility. For instance, Mongeau mongeau_relationship_1989 shows that the true protein digestibility in rats was negatively correlated with the total food fiber level. Likewise, the type of limiting amino acid is directly associated with the true ileal digestibility of that amino acid. Salts like magnesium and manganese are also associated with a lower rate of protein digestibility, disrupting the enzymatic process kaspchak_effect_2019 ; geboes_magnesium_2002 .
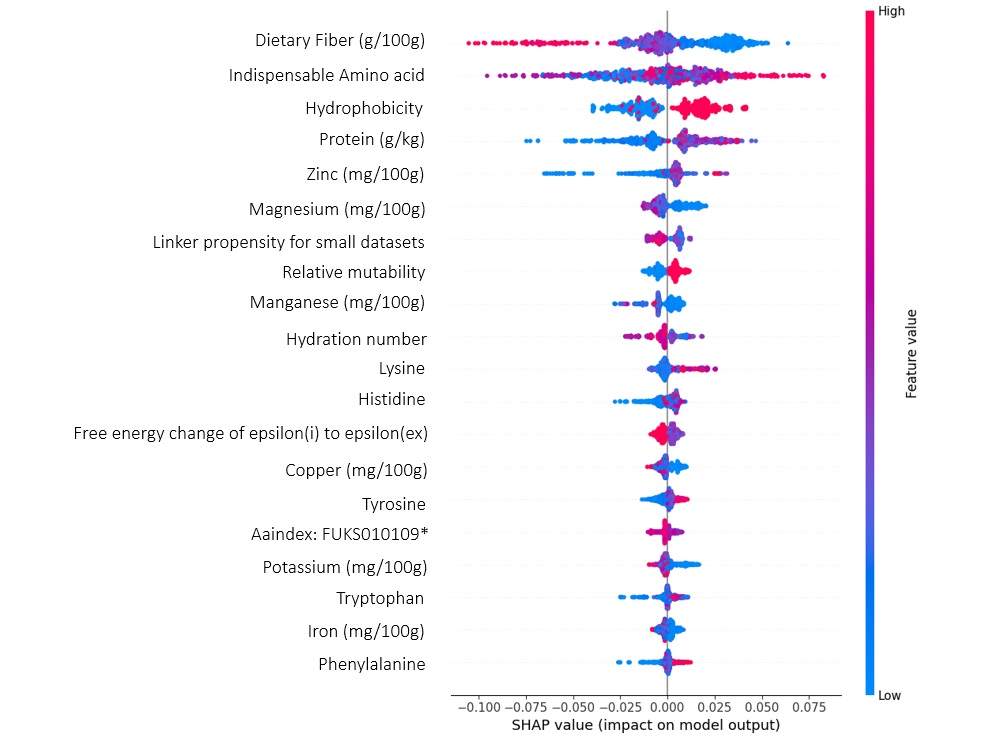
Protein digestibility is also found to be positively correlated with surface hydrophobicity of proteins through a study on heat-induced protein unfolding tang_heat-induced_2022 . Hydrophobic groups are normally buried within protein structure. However, the unfolding of proteins exposes hydrophobic residues to the surface, increasing overall surface hydrophobicity and providing easier access for digestive enzymes to hydrolyze the protein tang_heat-induced_2022 . Our model found other features associated with surface hydrophobicity, such as hydration number and linker propensity, to also confirm this correlation. For example, the hydration number indicates how likely a water molecule is to bind to a solute as compared to other water molecules zavitsas_opinions_2016 , implying that the hydration number is inversely linked to hydrophobicity and therefore to protein digestibility too sagawa_are_2014 . Similarly, linker propensity, or a tendency of a protein to have high numbers of linkers, can be linked to hydrophilicity since preferred linker amino acids have been established to be mostly hydrophilic sagawa_are_2014 .
Several minerals have also been shown to impact digestibility in accordance with our Shapley value results. For instance, Pallauf and Kirchgessner demonstrate that zinc deficiency has a negative effect on nutrient digestibility in weaned male rats pallauf_einflus_1976 . Salts containing potassium, such as Potassium thiocyanate, were shown to be trypsin inhibitors, which are in turn known to reduce the digestion and absorption of dietary proteins shikimi_modes_1979 aviles-gaxiola_inactivation_2018 . Additionally, specific amino acids have been established as having an impact on protein digestibility. Amino acids such as lysine and histidine have been demonstrated to have a positive impact on food intake and metabolism baruffol_l-lysine_2014 moro_histidine_2020 . For example, L-lysine delayed intestinal transit in rats baruffol_l-lysine_2014 , potentially increasing ileal protein absorption by increasing the time the protein resided in the small intestine zhao_protein_1996 . Other amino acids, such as Tryptophan and phenylalanine, have been shown to modulate gut microbiota and the secretion of digestive enzymes taleb_tryptophan_2019 guo_phenylalanine_2018 , likely increasing the amount of protein absorption.
2.4 Protein embeddings from language model
It is known that protein structure helps in understanding function. To be able to understand how the structure of proteins modify the digestibility of proteins, we used a language model approach. Here, we assume that the protein sequence is a series of tokens, or characters, such as a text corpus. Protein sequences are inherently similar to natural languages: amino acids arrange in a multitude of combinations to form structures that carry function, the same way as letters form words and sentences, which carry meaning ferruz_controllable_2022 .
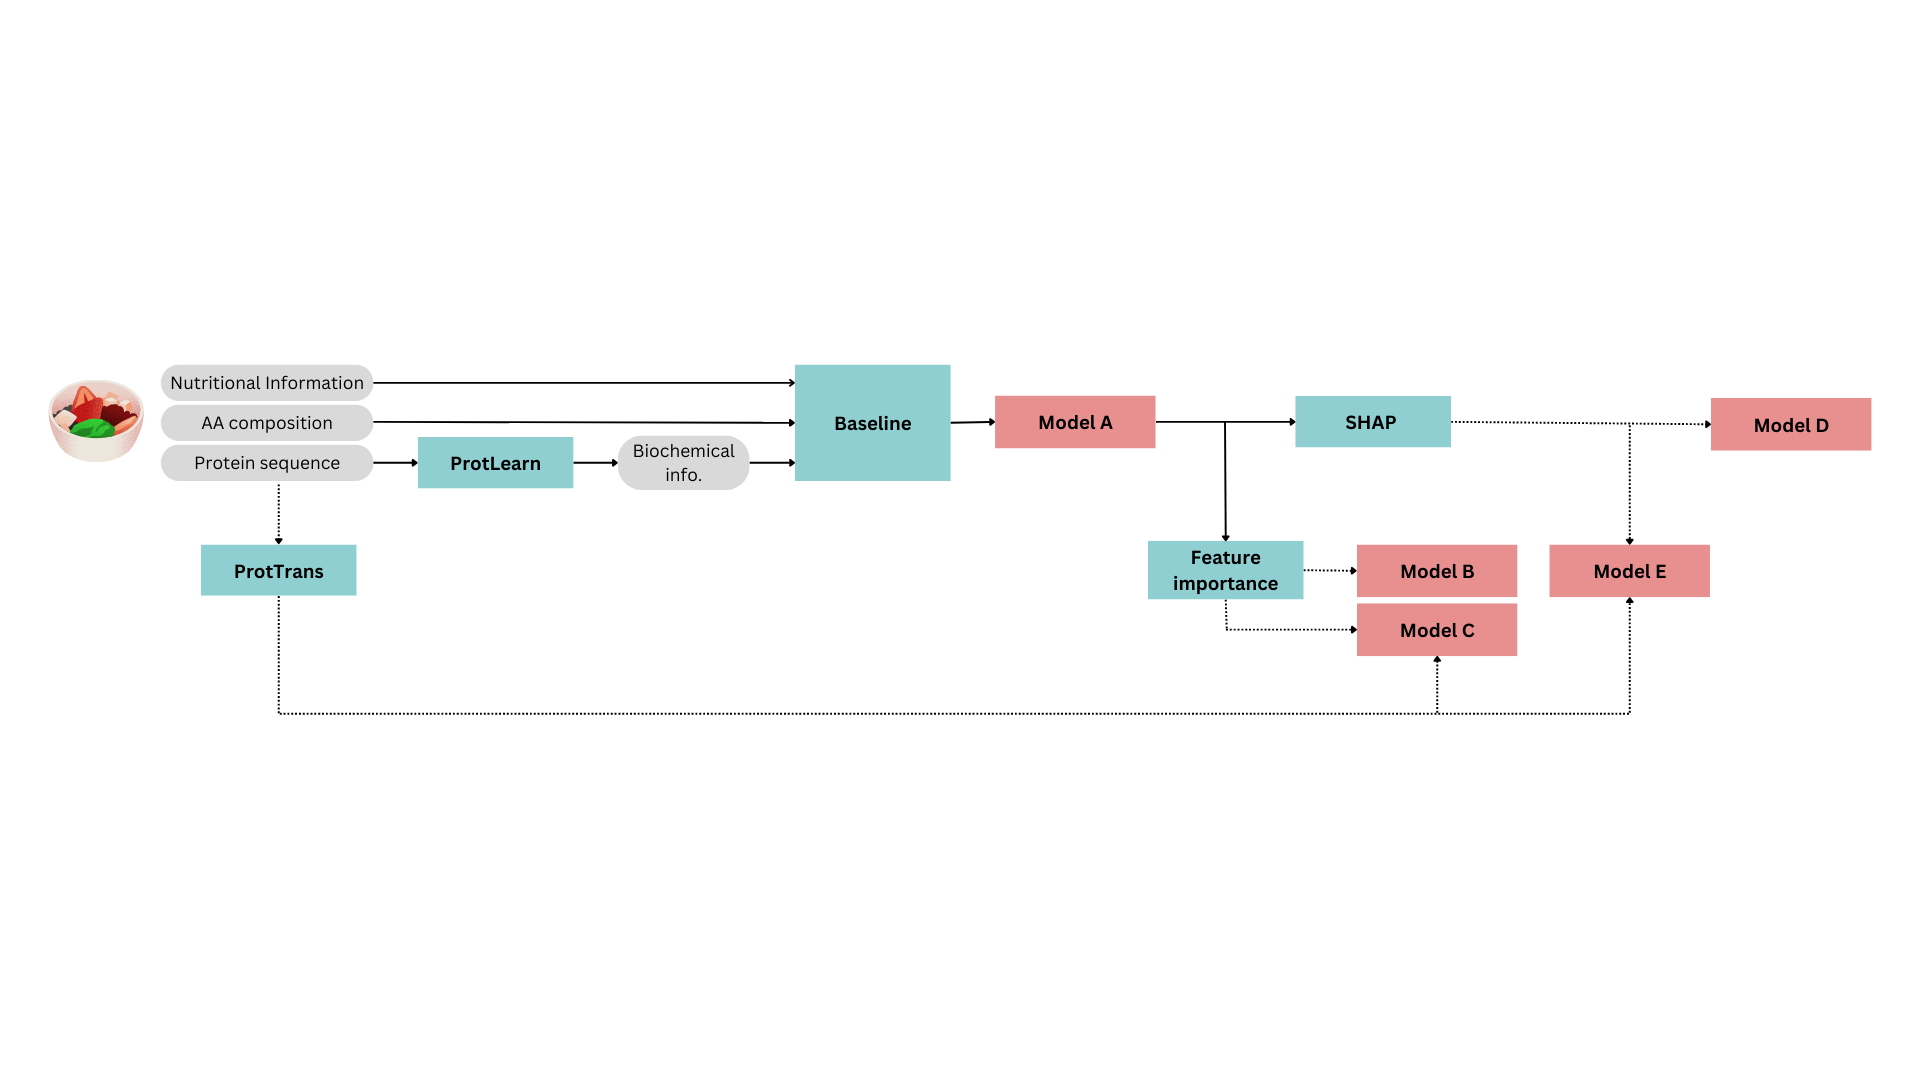
To make the model more robust, we extracted embeddings from the protein sequences using ProtTrans, a language model trained with UniRef50 and BFD100 elnaggar_prottrans_2022 and added these embeddings to the final dataset. The final architecture of our method is shown in figure 2.

2.5 Model results
When creating this unique machine learning model, we used several concepts that contribute to the overall model performance. In the ablation study, we try to identify the influence of each of these innovations separately. Details of the ablation study can be found on section 5.6 of the Supplementary Material.
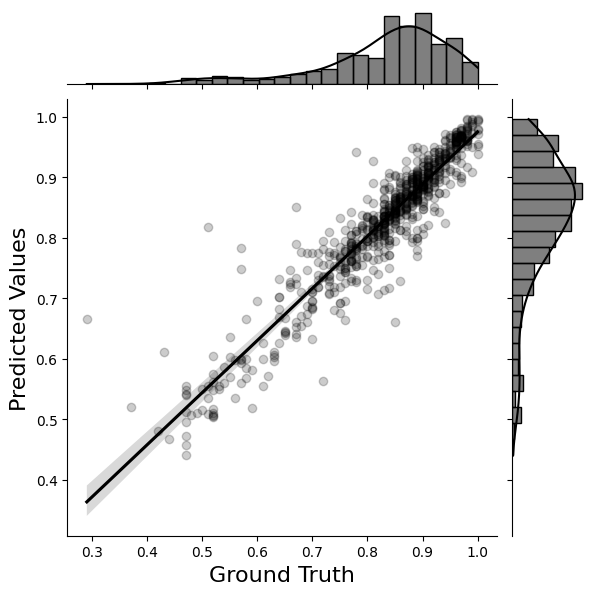
The results of the ablation study are shown in table 1, which shows the R2 of each model. We see that the SHAP method performed better than solely using feature importance from the LGBM model. Additionally, adding the ProtTrans embeddings also increases the model’s R2. The R2 of the final model is shown in figure 3. The sensitivity analysis done for each group of variables is also shown in section 5.7 of the Supplementary Material.
| Model | Description | R² | ||
| Model A | Baseline LGBM | 0.87730 | ||
| Model B |
|
0.89256 | ||
| Model C |
|
0.90003 | ||
| Model D | After SHAP selection | 0.89901 | ||
| Model E |
|
0.90165 |
3 Discussion
We propose an approach that allows us to predict the true ileal digestibility coefficient for each indispensable amino acid in a food, a value normally determined experimentally using in-vivo or in-vitro methods. Our data-science based method enabled us to estimate this value with 90% R2 accuracy. Not only is our proposed method novel in approximating the ileal digestibility coefficient of foods, as it is solely computational, but is also able to capture established relationships through its features and model output. Additionally, there are many potential downstream applications of our approach.
For instance, the approach itself can help accelerate the production of alternative protein products. Food scientists can use this approach to evaluate a large number of promising target proteins computationally and decrease the size of their experimental matrices. This methodology can also help predicting DIAAS for complex food matrices or for scenarios where in-vivo and in-vitro options cannot be used. In addition to the potential to streamline experimentation, our methodology’s interpretability could incite scientists to propose new scientific experiments to better understand how protein structure is related to digestibility. We were able to capture some of these structure-activity relationships using the 20 most important features generated by Shapley value analysis. Our model’s interpretability could guide in-vivo experiments to better identify the direct relationship of these other variables with digestibility, reducing the array of possible experimental combinations when investigating these relationships. As new primary data is collected and becomes available, it is important perform regular re-trainings on our model to improve its explanatory power.
This highlights one of the fundamental challenges of our approach and the basis for our future research: the size of our curated dataset. As more data becomes available, we can retrain the model to capture less frequent patterns that are specific to local contexts, foods, and proteins. ML techniques often do not make assumptions on the exact functional form of the model and attempt to learn the model form directly from the data, such that it maximizes prediction accuracy. To do so, they take into account linear and non-linear correlations between the data, but do not take into account cause and effect relationships. In this situation, this means that the model learns patterns in the data based on the most commonly observed relationships across protein families. Therefore, with a dataset with items ranging from processed foods to raw foods and meat analogues to animal products, more variability would be added and a generalizable model can be obtained.
Much of the ground truth data used in this study was experimentally determined using the grown pig model, which is a valid animal model for this purpose moughan_piglet_1992 ; deglaire_animal_2012 . However, it has been established that food particle size impacts ileal digestibility values in pigs, with a decrease in particle size increasing apparent ileal digestibility flis_effect_2014 . This might introduce variance into the model, as the ileal digestibility values in our dataset were obtained from different experiments; there is likely limited consistency in food particle size across these experiments.
Another avenue for future research is to add features related to food processing. For instance, it is known that heat treatments applied to food can alter AA digestibility and bioavailability levels when compared to the same, untreated food hodgkinson_determination_2020 ; rutherfurd_application_1997 ; almeida_amino_2013 ; sa_food_2020 . Other values which we have not featurized are antinutritional factors, whose presence are known to decrease protein digestibility. For instance, tannins or polyphenols produce denaturation of proteins, and protease inhibitors can inhibit trypsin, pepsin, and other proteases in the gut, preventing digestion and absorption of proteins and amino acids. The dataset also fails to consider farming practices, which also affect the protein content of plants and livestock. For example, fertilization regimes can promote nutrients transfer to grains and changes in protein content preet_antinutrients_2000 ; yan_quantifying_2022 . Animal husbandry and nutrition also impact growth, productivity and protein content of animal products zhang_effect_2019 ; coulon_variations_1991 ; tyasi_assessing_2015 .
Overall, our model could be enriched with features that represent a food’s structural information, antinutrients, processing, and the farming practices employed when it was growing. However, obtaining these data for a large number of food items is challenging. This demonstrates the strong need for a unified database that contains such information, more experiments to create ground truth values, and the need to iterate over our existing methodology to make it more robust once new data becomes available. In the meantime, using this purely computational, ethical, and affordable model can enable scientists to reduce the size of their experimental food matrices during protein digestibility experiments, especially in the development of new foods.
4 Methods
4.1 Dataset creation details
The final dataset obtained was created using the original 300 food items present on Muleya and Salter dataset molly_muleya_ileal_2021 . In cases where digestibility information was missing for some amino acids, an average value based on the reported amino acid data was assigned - average values are indicated in the dataset. Total amino acid and protein composition was obtained from the same source. Values were expressed in g/kg and recalculation was done in cases where the units reported in the reference were different. Digestible indispensable amino acids were calculated by multiplying the digestibility coefficient with the corresponding indispensable amino acid composition expressed in g/kg. Finally, digestible indispensable amino acids were expressed as mg/g protein by dividing the digestible indispensable amino acid composition with the total protein and converting to mg. DIAAS values were calculated for all age groups using the FAO recommended reference patterns. DIAAS values for some foods are missing due to insufficient information being reported in some cases.
The nutritional information for foods was obtained from the FoodData Central of the United States Department of Agriculture (USDA) us_department_of_agriculture_usda_agricultural_research_service_nutrient_data_usda_nodate . FoodData Central is an integrated data system that provides expanded nutrient profile data and links to related agricultural and experimental research. For each food item in the database, the features presented in tables 3 and 4 were added.
In order to capture additional protein features, their physio-chemical and biochemical properties were added to the database. For this, the amino acid FASTA sequence for each protein was first collected from UniProt bateman_uniprot_2021 or from the NCBI ncbi_national_nodate protein database. For this, we selected up to three protein families of the food items, such as albumins, caseins and globulins, when present and Protlearn v2.1 dorfer_protlearn_nodate was then used to extract the features from the FASTA sequences. This led to a total of 1671 features that were added to the database for each protein. All features obtained from Protlearn are present in section 5.8 of the Supplementary Material.
Finally, the language model was used to obtain the embeddings of each protein family. The cleaned dataset was composed of almost 200 food items.
4.2 Baseline modeling approach
First, baseline regressors on all 1671 features of 189 food items were trained. The first 3 top-performing models were based on boosting and bagging techniques of decision trees. These models are also able to deal with high-dimensional data that may contain non-linear effects and many interactions between covariates, and can be used to rank the most important predictors to gain insight into the resulting prediction model. Hyperparameters of these three models were optimized using a combination of a randomized grid search technique and manual tuning using stratified 5-fold cross-validation on the training set. Using the optimized tree-based models, the validation R2 accuracy was calculated on a held-out test set.
4.3 SHAP
Interpretability of models in AI is central to the practical impact of AI on society. Thus it can be treated as a problem of attribution. Shapley values kuhn_17_1953 provide the unique attribution method satisfying a set of intuitive axioms, e.g. they capture all interactions between features and sum to the model prediction. Given our baseline predictive model, SHAP yields a vector of importance scores associated with the underlying features. The Shapley value was first introduced as an axiomatic characterisation of a fair distribution of a total surplus from all players, and it may be used in predictive models where each feature is treated as a participant in the underlying game. While the Shapley value technique is conceptually appealing, it is also computationally demanding: in general, each Shapley value assessment demands an exponential number of model evaluations.
Classic Shapley values calculated through SHAP can be considered optimal since, within a large class of approaches, they are the only way to measure feature importance while maintaining several natural properties from cooperative game theory lundberg_local_2020 . Shapley also observes the value as an index for assessing the power of participants in a game, in addition to a model that seeks to predict the distribution of resources in multi-feature interactions. The value, like a price index or other market indices, aggregates the strength of actors in their numerous cooperation opportunities using averages (or weighted averages in certain extensions). The Shapley value may also be thought of as a measure of the utility of players/features in a game/model. Several studies have used Shapley values and SHAP package to improve the interpretability of tree-based models lundberg_local_2020 ; lundberg_explainable_2018 .
4.4 ProtTrans
The goal of language modelling is to estimate the probability distribution of various linguistic units, e.g., words, sentences. After training the language model (LM), we can extract some information learned by the LMs, referred to as embeddings. This process indicates that when a language model better understands the sequence, it also better understands the structure.
Protein Language Models (pLMs) copy the concepts of Language Models from NLP by using tokens (words in NLP), i.e., amino acids from protein sequences, and treating entire proteins like sentences in LMs. In step 1, these pLMs are trained in a self-supervised manner, essentially learning to predict masked amino acids (tokens) in already known sequences.
ProtTrans elnaggar_prottrans_2022 is a 3B-parameter model that has an encoder and decoder architecture and allows us to extract 1024 embeddings for each protein sequence using the 1B-parameter encoder. Thus, 1024 embeddings were generated for each of the three protein families of each food item.
References
- (1) World Bank. World Development Report 2008: Agriculture for Development (The World Bank, 2007).
- (2) Henchion, M., Hayes, M., Mullen, A., Fenelon, M. & Tiwari, B. Future Protein Supply and Demand: Strategies and Factors Influencing a Sustainable Equilibrium. Foods 6, 53 (2017).
- (3) Nadathur, S. R., Wanasundara, J. P. D. & Scanlin, L. Sustainable protein sources (Academic Press in an imprint of Elsevier, Amsterdam, 2017).
- (4) Yokoyama, Y. et al. Vegetarian Diets and Blood Pressure: A Meta-analysis. JAMA Internal Medicine 174, 577 (2014).
- (5) Satija, A. et al. Plant-Based Dietary Patterns and Incidence of Type 2 Diabetes in US Men and Women: Results from Three Prospective Cohort Studies. PLOS Medicine 13, e1002039 (2016).
- (6) Dinu, M., Abbate, R., Gensini, G. F., Casini, A. & Sofi, F. Vegetarian, vegan diets and multiple health outcomes: A systematic review with meta-analysis of observational studies. Critical Reviews in Food Science and Nutrition 57, 3640–3649 (2017).
- (7) Kim, H. et al. Plant‐Based Diets Are Associated With a Lower Risk of Incident Cardiovascular Disease, Cardiovascular Disease Mortality, and All‐Cause Mortality in a General Population of Middle‐Aged Adults. Journal of the American Heart Association 8, e012865 (2019).
- (8) FAO. Dietary protein quality evaluation in human nutrition. Report of an FAQ Expert Consultation. FAO food and nutrition paper 92, 1–66 (2013).
- (9) Rutherfurd, S. M., Fanning, A. C., Miller, B. J. & Moughan, P. J. Protein digestibility-corrected amino acid scores and digestible indispensable amino acid scores differentially describe protein quality in growing male rats. The Journal of Nutrition 145, 372–379 (2015).
- (10) Kårlund, A. et al. Harnessing Microbes for Sustainable Development: Food Fermentation as a Tool for Improving the Nutritional Quality of Alternative Protein Sources. Nutrients 12, E1020 (2020).
- (11) Bohn, T. et al. Correlation between in vitro and in vivo data on food digestion. What can we predict with static in vitro digestion models? Critical Reviews in Food Science and Nutrition 58, 2239–2261 (2018).
- (12) Muleya, M. & Salter, A. Ileal amino acid digestibility and DIAAS values of world foods (2021). https://data.mendeley.com/datasets/gz3cx7d5f4/1.
- (13) US Department of Agriculture (USDA), N. D., Agricultural Research Service. USDA National Nutrient Database for Standard Reference, Legacy. http://www.ars.usda.gov/nutrientdata.
- (14) National Food Institute, T. U. o. D. Fooda data. https://frida.fooddata.dk/?lang=en.
- (15) Dorfer, T. Protlearn Package. https://github.com/tadorfer/protlearn.
- (16) Guyon, I. et al. Advances in Neural Information Processing Systems. In 30: Annual Conference on Neural Information Processing System (Long Beach, CA, USA, 2017).
- (17) Lundberg, S. & Lee, S.-I. A Unified Approach to Interpreting Model Predictions (2017). URL http://arxiv.org/abs/1705.07874. ArXiv:1705.07874 [cs, stat].
- (18) Jolliffe, I. T. Principal Component Analysis. Springer Series in Statistics (Springer-Verlag, New York, 2002). URL http://link.springer.com/10.1007/b98835.
- (19) Mongeau, R., Sarwar, G., Peace, R. W. & Brassard, R. Relationship between dietary fiber levels and protein digestibility in selected foods as determined in rats. Plant Foods for Human Nutrition (Dordrecht, Netherlands) 39, 45–51 (1989).
- (20) Kaspchak, E., Goedert, A. C., Igarashi-Mafra, L. & Mafra, M. R. Effect of divalent cations on bovine serum albumin (BSA) and tannic acid interaction and its influence on turbidity and in vitro protein digestibility. International Journal of Biological Macromolecules 136, 486–492 (2019).
- (21) Geboes, K. P. et al. Magnesium chloride slows gastric emptying, but does not affect digestive functions. Aliment Pharmacol Ther 16, 1571–1577 (2002).
- (22) Tang, J., Wichers, H. J. & Hettinga, K. A. Heat-induced unfolding facilitates plant protein digestibility during in vitro static infant digestion. Food Chemistry 375, 131878 (2022).
- (23) Zavitsas, A. A. Some opinions of an innocent bystander regarding the Hofmeister series. Current Opinion in Colloid & Interface Science 23, 72–81 (2016).
- (24) Sagawa, N. & Shikata, T. Are all polar molecules hydrophilic? Hydration numbers of nitro compounds and nitriles in aqueous solution. Physical chemistry chemical physics 16, 13262–13270 (2014).
- (25) Pallauf, J. & Kirchgessner, M. Einfluß mangelnder Zinkversorgung auf Verdaulichkeit und Verwertung von Nährstoffen. Archiv für Tierernaehrung 26, 457–473 (1976).
- (26) Shikimi, T., Kobayashi, T. & Hattori, K. Modes of inhibition of activities of trypsin and chymotrypsin by potassium thiocyanate. Enzyme 24, 348–352 (1979).
- (27) Avilés-Gaxiola, S., Chuck-Hernández, C. & Serna Saldívar, S. O. Inactivation Methods of Trypsin Inhibitor in Legumes: A Review. Journal of Food Science 83, 17–29 (2018).
- (28) Baruffol, C. et al. L-lysine dose dependently delays gastric emptying and increases intestinal fluid volume in humans and rats. Neurogastroenterology & Motility 26, 999–1009 (2014).
- (29) Moro, J., Tomé, D., Schmidely, P., Demersay, T.-C. & Azzout-Marniche, D. Histidine: A Systematic Review on Metabolism and Physiological Effects in Human and Different Animal Species. Nutrients 12, E1414 (2020).
- (30) Zhao, X. T., Miller, R. H., McCamish, M. A., Wang, L. & Lin, H. C. Protein absorption depends on load-dependent inhibition of intestinal transit in dogs. The American Journal of Clinical Nutrition 64, 319–323 (1996).
- (31) Taleb, S. Tryptophan Dietary Impacts Gut Barrier and Metabolic Diseases. Frontiers in Immunology 10, 2113 (2019).
- (32) Guo, L. et al. Phenylalanine regulates initiation of digestive enzyme mRNA translation in pancreatic acinar cells and tissue segments in dairy calves. Bioscience Reports 38, BSR20171189 (2018).
- (33) Ferruz, N. & Höcker, B. Controllable protein design with language models. Nature Machine Intelligence 4, 521–532 (2022).
- (34) ProtTrans: Toward Understanding the Language of Life Through Self-Supervised Learning 44, 7112–7127 (2022).
- (35) Moughan, P. J., Birtles, M. J., Cranwell, P. D., Smith, W. C. & Pedraza, M. The piglet as a model animal for studying aspects of digestion and absorption in milk-fed human infants. World Review of Nutrition and Dietetics 67, 40–113 (1992).
- (36) Deglaire, A. & Moughan, P. J. Animal models for determining amino acid digestibility in humans - a review. The British Journal of Nutrition 108 Suppl 2, S273–281 (2012).
- (37) Flis, M., Sobotka, W. & Purwin, C. Effect of feed structure on nutrient digestibility, growth performance, and gastrointestinal tract of pigs – A Review. Annals of Animal Science 14, 757–768 (2014).
- (38) Hodgkinson, S. M., Stein, H. H., de Vries, S., Hendriks, W. H. & Moughan, P. J. Determination of True Ileal Amino Acid Digestibility in the Growing Pig for Calculation of Digestible Indispensable Amino Acid Score (DIAAS). The Journal of Nutrition 150, 2621–2623 (2020).
- (39) Rutherfurd, S. M. & Moughan, P. J. Application of a New Method for Determining Digestible Reactive Lysine to Variably Heated Protein Sources. Journal of Agricultural and Food Chemistry 45, 1582–1586 (1997).
- (40) Almeida, F. N., Htoo, J. K., Thomson, J. & Stein, H. H. Amino acid digestibility of heat damaged distillers dried grains with solubles fed to pigs. Journal of Animal Science and Biotechnology 4, 44 (2013).
- (41) Sá, A. G. A., Moreno, Y. M. F. & Carciofi, B. A. M. Food processing for the improvement of plant proteins digestibility. Critical Reviews in Food Science and Nutrition 60, 3367–3386 (2020).
- (42) Preet, K. & Punia, D. Antinutrients and digestibility (in vitro) of soaked, dehulled and germinated cowpeas. Nutrition and Health 14, 109–117 (2000).
- (43) Yan, S. et al. Quantifying grain yield, protein, nutrient uptake and utilization of winter wheat under various drip fertigation regimes. Agricultural Water Management 261, 107380 (2022).
- (44) Zhang, J. et al. Effect of Different Tannin Sources on Nutrient Intake, Digestibility, Performance, Nitrogen Utilization, and Blood Parameters in Dairy Cows. Animals : an Open Access Journal from MDPI 9, 507 (2019).
- (45) Coulon, J. B. & Rémond, B. Variations in milk output and milk protein content in response to the level of energy supply to the dairy cow: A review. Livestock Production Science 29, 31–47 (1991).
- (46) Tyasi, T., Gxasheka, M. & Tlabela, C. Assessing the effect of nutrition on milk composition of dairy cows: A review. International Journal of Current Science 56–63 (2015).
- (47) Bateman, A. et al. UniProt: the universal protein knowledgebase in 2021. Nucleic Acids Research 49, D480–D489 (2021).
- (48) NCBI. National Center for Biotechnology Information (NCBI). https://www.ncbi.nlm.nih.gov/.
- (49) Shapley, L. S. 17. A Value for n-Person Games. In Kuhn, H. W. & Tucker, A. W. (eds.) Contributions to the Theory of Games (AM-28), Volume II, 307–318 (Princeton University Press, 1953).
- (50) Lundberg, S. M. et al. From Local Explanations to Global Understanding with Explainable AI for Trees. Nature machine intelligence 2, 56–67 (2020).
- (51) Lundberg, S. M. et al. Explainable machine-learning predictions for the prevention of hypoxaemia during surgery. Nature Biomedical Engineering 2, 749–760 (2018).
- (52) FAO. FAO Nutritional Studies No. 16. Protein Requirements (FAO, Rome, 1967).
- (53) EFSA. Scientific Opinion on Dietary Reference Values for protein. EFSA Journal (2012).
- (54) Trommelen, J., Tomé, D. & van Loon, L. J. Gut amino acid absorption in humans: Concepts and relevance for postprandial metabolism. Clinical Nutrition Open Science 36, 43–55 (2021).
- (55) Jahan-Mihan, A., Luhovyy, B. L., El Khoury, D. & Anderson, G. H. Dietary Proteins as Determinants of Metabolic and Physiologic Functions of the Gastrointestinal Tract. Nutrients 3, 574–603 (2011).
- (56) van der Wielen, N. et al. Presence of Unabsorbed Free Amino Acids at the End of the Small Intestine of Humans and Pigs: Potential Implications for Amino Acid Bioavailability. Current Developments in Nutrition 5, 530–530 (2021).
- (57) Adhikari, S., Schop, M., de Boer, I. J. M. & Huppertz, T. Protein Quality in Perspective: A Review of Protein Quality Metrics and Their Applications. Nutrients 14, 947 (2022).
- (58) Knight, J., Bayram-Weston, Z. & Nigam, Y. Gastrointestinal tract 6: the effects of gut microbiota on human health. Nursing Times 115, 46–50 (2019).
- (59) Huang, S., Wang, L. M., Sivendiran, T. & Bohrer, B. M. Review: Amino acid concentration of high protein food products and an overview of the current methods used to determine protein quality. Critical Reviews in Food Science and Nutrition 58, 2673–2678 (2018).
- (60) Shivakumar, N. et al. Protein Quality Assessment of Follow-up Formula for Young Children and Ready-to-Use Therapeutic Foods: Recommendations by the FAO Expert Working Group in 2017. The Journal of Nutrition 150, 195–201 (2020).
- (61) Gaudichon, C. & Calvez, J. Determinants of amino acid bioavailability from ingested protein in relation to gut health. Current Opinion in Clinical Nutrition & Metabolic Care 24, 55–61 (2021).
- (62) INRAE, CIRAD & AFZ. Feed tables. https://www.feedtables.com/.
- (63) Moughart, S., P. J. amd Gilani, Rutherfurd, S. M. & Tome, D. The assessment of amino acid digestibility in foods for humans and including a collation of published ileal amino acid digestibility data for human foods. Report of a Sub-Committee of the 2011 FAO Consultation on “Protein Quality Evaluation in Human Nutrition” (2011).
- (64) Kashyap, S. et al. Ileal digestibility of intrinsically labeled hen’s egg and meat protein determined with the dual stable isotope tracer method in indian adults. The American Journal of Clinical Nutrition 108, 1319–1327 (2019).
- (65) Shivakumar, N. et al. Protein-quality evaluation of complementary foods in indian children. The American Journal of Clinical Nutrition 109, 980–987 (2019).
- (66) Hodgkinson, S. M., Montoya, C. A., Scholten, P. T., Rutherfurd, S. M. & Moughan, P. J. Cooking conditions affect the true ileal digestible amino acid content and digestible indispensable amino acid score (diaas) of bovine meat as determined in pigs. The Journal of Nutrition 148, 1564–1569 (2018).
- (67) Bindari, Y. R., Laerke, H. N. & Nørgaard, J. V. Standardized ileal digestibility and digestible indispensable amino acid score of porcine and bovine hydrolyzates in pigs. Journal of the Science of Food and Agriculture 98, 2131–2137 (2018).
- (68) Cervantes-Pahm, S. K., Liu, Y. & Stein, H. H. Digestible indispensable amino acid score and digestible amino acids in eight cereal grains. The British Journal of Nutrition 111, 1663–1672 (2014).
- (69) Reynaud, Y. et al. True ileal amino acid digestibility and digestible indispensable amino acid scores (DIAASs) of plant-based protein foods. Food Chemistry 338, 128020 (2021).
- (70) Han, F., Moughan, P. J., Li, J. & Pang, S. Digestible indispensable amino acid scores (diaas) of six cooked chinese pulses. Nutrients 12, 1183–1186 (2020).
- (71) Calvez, J. et al. Very low ileal nitrogen and amino acid digestibility of zein compared to whey protein isolate in healthy volunteers. The American Journal of Clinical Nutrition 113, 70–82 (2021).
- (72) Tan, X. et al. Amino acid digestibility in housefly and black soldier fly prepupae by growing pigs. Animal Feed Science and Technology 263, 114446 (2020).
- (73) Park, C. S., Helmbrecht, A., Htoo, J. K. & Adeola, O. Comparison of amino acid digestibility in full-fat soybean, two soybean meals, and peanut flour between broiler chickens and growing pigs. Journal of Animal Science 95, 3110–3119 (2017).
- (74) Hugman, J. et al. Energy and amino acid digestibility of raw, steam-pelleted and extruded red lentil in growing pigs. Animal Feed Science and Technology 275, 114838 (2021).
- (75) Bailey, H. M. & Stein, H. H. Raw and roasted pistachio nuts (pistacia vera l.) are ‘good’ sources of protein based on their digestible indispensable amino acid score as determined in pigs. Journal of the Science of Food and Agriculture 100, 3878–3885 (2020).
- (76) Cho, K. H. et al. Effects of mealworm (Tenebrio molitor) larvae hydrolysate on nutrient ileal digestibility in growing pigs compared to those of defatted mealworm larvae meal, fermented poultry by-product, and hydrolyzed fish soluble. Asian-Australasian Journal of Animal Sciences 33, 490–500 (2020).
- (77) Yin, Y. L. et al. Evaluating standardized ileal digestibility of amino acids in growing pigs. Animal Feed Science and Technology 140, 385–401 (2008).
- (78) Kashyap, S. et al. True ileal digestibility of legumes determined by dual-isotope tracer method in Indian adults. The American Journal of Clinical Nutrition 110, 873–882 (2019).
- (79) Wang, J. P., Kim, J. D., Kim, J. E. & Kim, I. H. Amino acid digestibility of single cell protein from Corynebacterium ammoniagenes in growing pigs. Animal Feed Science and Technology 180, 111–114 (2013).
- (80) Zziwa, E., Laswai, G. H., Mgheni, D. M., Mtenga, L. A. & Ndikumana, J. Chemical composition and nutritional values of feed resources for ruminants. Eastern and Central Africa feed stuff table for ruminants 2013 (2013).
- (81) Oliveira, M. S. F., Wiltafsky, M. K., Lee, S. A., Kwon, W. B. & Stein, H. H. Concentrations of digestible and metabolizable energy and amino acid digestibility by growing pigs may be reduced by autoclaving soybean meal. Animal Feed Science and Technology 269, 114621 (2020).
- (82) Mathai, J. K., Liu, Y. & Stein, H. H. Values for digestible indispensable amino acid scores (DIAAS) for some dairy and plant proteins may better describe protein quality than values calculated using the concept for protein digestibility-corrected amino acid scores (PDCAAS). British Journal of Nutrition 117, 490–499 (2017).
- (83) Mariscal-Landin, G., Lebreton, Y. & Seve, B. Apparent and standardised true ileal digestibility of protein and amino acids from faba bean, lupin and pea, provided as whole seeds, dehulled or extruded in pig diets. Animal Feed Science and Technology 97, 183–198 (2002).
- (84) Guillin, F. M. et al. Real ileal amino acid digestibility of pea protein compared to casein in healthy humans: a randomized trial. The American Journal of Clinical Nutrition 115, 353–363 (2022).
- (85) Fanelli, N. S. et al. Diaas is greater in animal based burgers than in plant based burgers if determined in pigs. European Journal of Nutrition 61, 461–475 (2022).
- (86) Han, F., Moughan, P. J., Li, J., Stroebinger, N. & Pang, S. The Complementarity of Amino Acids in Cooked Pulse/Cereal Blends and Effects on DIAAS. Plants (Basel, Switzerland) 10, 1999 (2021).
- (87) Fanelli, N. S., Bailey, H. M., Guardiola, L. V. & Stein, H. H. Values for Digestible Indispensable Amino Acid Score (DIAAS) Determined in Pigs Are Greater for Milk Than for Breakfast Cereals, but DIAAS Values for Individual Ingredients Are Additive in Combined Meals. The Journal of Nutrition 151, 540–547 (2021).
- (88) Calderón de la Barca, A. M. et al. Pinto Bean Amino Acid Digestibility and Score in a Mexican Dish with Corn Tortilla and Guacamole, Evaluated in Adults Using a Dual-Tracer Isotopic Method. The Journal of Nutrition 151, 3151–3157 (2021).
- (89) Bailey, H. M., Mathai, J. K., Berg, E. P. & Stein, H. H. Pork Products Have Digestible Indispensable Amino Acid Scores (DIAAS) That Are Greater Than 100 When Determined in Pigs, but Processing Does Not Always Increase DIAAS. The Journal of Nutrition 150, 475–482 (2020).
- (90) Devi, S. et al. Amino Acid Digestibility of Extruded Chickpea and Yellow Pea Protein is High and Comparable in Moderately Stunted South Indian Children with Use of a Dual Stable Isotope Tracer Method. The Journal of Nutrition 150, 1178–1185 (2020).
- (91) Crosbie, M., Zhu, C., Shoveller, A. K. & Huber, L.-A. Standardized ileal digestible amino acids and net energy contents in full fat and defatted black soldier fly larvae meals ( Hermetia illucens) fed to growing pigs. Translational Animal Science 4 (2020).
- (92) Rodriguez, D. A., Lee, S. A., Jones, C. K., Htoo, J. K. & Stein, H. H. Digestibility of amino acids, fiber, and energy by growing pigs, and concentrations of digestible and metabolizable energy in yellow dent corn, hard red winter wheat, and sorghum may be influenced by extrusion. Animal Feed Science and Technology 4 (2020).
- (93) Breiman, L. Random Forests. Machine Learning 45, 5–32 (2001).
- (94) Chen, T. & Guestrin, C. XGBoost: A Scalable Tree Boosting System. In Proceedings of the 22nd ACM SIGKDD International Conference on Knowledge Discovery and Data Mining, 785–794 (2016). ArXiv:1603.02754 [cs].
- (95) Ke, G. et al. LightGBM: a highly efficient gradient boosting decision tree. In Proceedings of the 31st International Conference on Neural Information Processing Systems, NIPS’17, 3149–3157 (Curran Associates Inc., Red Hook, NY, USA, 2017).
- (96) Azevedo, R. A., Arruda, P., Turner, W. L. & Lea, P. J. The biosynthesis and metabolism of the aspartate derived amino acids in higher plants. Phytochemistry 46, 395–419 (1997).
- (97) Kohlmeier, M. Nutrient Metabolism (Academic Press, London, 2003).
- (98) He, J. et al. The effect of meat processing methods on changes in disulfide bonding and alteration of protein structures: impact on protein digestion products. RSC Advances 8, 17595–17605 (2018).
- (99) Knorr, D. Effect of recovery methods on yield, quality and functional properties of potato protein concentrates. Journal of Food Science 45, 1183–1186 (1980).
- (100) Saltelli, A. et al. Variance based sensitivity analysis of model output. design and estimator for the total sensitivity index. Computer Physics Communications 181, 259–270 (2010).
- (101) Usher, W. et al. Salib/Salib: Launch! (2016). https://zenodo.org/record/160164.
- (102) House, J. D., Hill, K., Neufeld, J., Franczyk, A. & Nosworthy, M. G. Determination of the protein quality of almonds (Prunus dulcis L.) as assessed by in vitro and in vivo methodologies. Food Science & Nutrition 7, 2932–2938 (2019).
- (103) AFZ, Ajinomoto Eurolysine, Aventis Animal Nutrition, INRA & ITCF. Amipig: ileal standardised digestibility of amino acids in feedstuffs for pigs (France, 2000).
- (104) GenomeNet. Aaindex ver.9.2 URL {https://www.genome.jp/aaindex/AAindex/list_of_indices}.
5 Supplementary Material
5.1 Protein quality and bioavailability definition
To define the pattern of human AA requirements, the FAO Committee on Protein Requirements fao_fao_1967 advised using a reference protein with an ideal AA composition.
The balance of AA across the small intestine (mouth to terminal ileum: ileal digestibility) or across the entire gut (mouth to anus: faecal digestibility) can provide a measure of the extent of digestion and absorption of food protein. Specifically, this balance is usually defined in terms of AA by the gastrointestinal tract for use by the body. Usually, the main interest of the analyses are the indispensable amino acids (IAAs), which cannot be synthesized by the human body and some dispensable amino acids (DAAs), such as arginine, cysteine, glutamine, glycine, proline and tyrosine, which can become conditionally indispensable for premature neonates efsa_scientific_2012 .
Protein digestion is a long, complex and multi-stage process. The onset is from the mechanical process of breaking down food in the mouth and the chemical process of breaking down the molecular structure by salivary amylase. In the gastric phase of digestion, the resulting product is mixed with low pH gastric acid containing the protease pepsin. This allows the formation of (poly)peptides. In the small intestine, the chyme is mixed with pancreatic proteases and peptidases, such as trypsin, chymotrypsin, and carboxypeptidase A trommelen_gut_2021 . Together with intestinal brush border enzymes, these enzymes hydrolyse the proteins and (poly)peptides into amino acids, di-, tri-, and oligopeptides jahan-mihan_dietary_2011 . The amino acids and di- and tripeptides that are produced can be taken up by the small intestinal mucosa and are typically thought to be almost completely absorbed by the terminal ileum at the end of the small intestine van_der_wielen_presence_2021 ; adhikari_protein_2022 . It is important to mention that this is a unique process that depends on the individual gut microbiota, which plays and active role in digestion knight_gastrointestinal_2019 .
Peptides not absorbed in the ileum travel to the large intestine. However, there is no evidence that there is absorption of them after the ileum, and the absorbed values are small, not exceeding 0.1% for whey protein in pigs van_der_wielen_presence_2021 . Many different methods for determining protein quality have been developed and utilized throughout the years. To quantify or characterize the protein quality of a protein supply, several approaches use distinct principles huang_review_2018 .
FAO shivakumar_protein_2020 suggested a ranking of different digesta based on representativeness to human digestibility for protein starts with human ileal digesta, followed by pig ileal digesta, rat ileal digesta, human feacal digesta, pig feacal digesta and rat feacal digesta. Some human experiments have been conducted to test the ileal digestibility of proteins, however the ileal digesta collection in animals is difficult gaudichon_determinants_2021 . Generally, pigs are used over humans because of the physiological similarity of their intestinal tract. Furthermore, there is a high correlation between ileal digesta from humans and pigs deglaire_animal_2012 .
5.2 References of DIAAS experiments
| Paper | Reference |
|---|---|
| INRAE-CIRAD-AFZ Feed tables | feedtables |
| The assessment of amino acid digestibility in foods for humans and including a collation of published ileal amino acid digestibility data for human foods | fao2011 |
| Ileal digestibility of intrinsically labelled hen’s egg and meat protein determined with the dual stable isotope tracer method in Indian adults | kashyapr_2019 |
| Protein quality evaluation of complementary foods in Indian children | shivakumar_2019 |
| Cooking conditions affect the true ileal digestible amino acid content and digestible indispensable amino acid score (DIAAS) of bovine meat as determined in pigs | hodgkinson_2018 |
| Standardized ileal digestibility and digestible indispensable amino acid score of porcine and bovine hydrolysates in pigs | bindari_2018 |
| Digestible indispensable amino acid score and digestible amino acids in eight cereal grains | cervantes-pahm_digestible_2014 |
| True ilea amino acid digestibility and digestible indispensable amino acid scores (DIAASs) of plant-based protein foods | reynaud_true_2021 |
| Digestible indispensable amino acid scores of six cooked chinese pulses | han2020 |
| Very low ileal nitrogen and amino acid digestibility of zein compared to whey protein isolate in healthy volunteers | calvez2021 |
| Amino acid digestibility in housefly and black soldier fly prepupae by growing pigs | tan_2020 |
| Comparison of amino acid digestibility in full-fat soybean, two soybean meals and peanut flour between broiler chickens and growing pigs | park_2017 |
| Energy and amino acid digestibility of raw, steam-pelleted and extruded red lentil in growing pigs | hugman_2021 |
| Raw and roasted pistachio nuts are good sources of protein based on their digestible indispensable amino acid score as determined in pigs | bailey2020 |
| Effects of mealworm larvae hydrolysate on nutrient ileal digestibility in growing pigs compared to those of defatted mealworm larvae meal, fermented poultry byproduct and hydrolysed fish soluble | cho_effects_2020 |
| Evaluating standardized ileal digestibility of amino acids in growing pigs | yin_evaluating_2008 |
| True ileal digestibility of legumes determined by dual-isotope tracer method in Indian adults | kashyap_true_2019 |
| Amino acid digestibility of single cell protein from Corynebacterium | wang_amino_2013 |
| Chemical composition and nutritional values of feedstuffs | zziwa_2013 |
| Concentrations of digestible and metabolizable energy and amino acid digestibility by growing pigs may be reduced by autoclaving soybean meal | oliveira_concentrations_2020 |
| Values for DIAAS for some diary and plant proteins may better describe protein quality than values calculated using the concept for PDCAAS | mathai_values_2017 |
| Apparent and standardized true ileal digestibility of protein and amino acids from faba bean, lupin and pea, provided as whole seeds, dehulled or extruded in pig diets | mariscal-landin_apparent_2002 |
| Real ileal amino acid digestibility of pea protein compared to casein in healthy humans, a randomized trial | guillin_real_2022 |
| DIAAS is greater in animal based burgers than in plant based burgers if determined in pigs | fanelli2022 |
| The complementarity of amino acids in cooked pulse/cereal blends and effects on DIAAS | han_complementarity_2021 |
| Values for DIAAS determined in pigs are greater for milk than for breakfast cereals, but DIAAS values for individual ingredients are additive in combined meals | fanelli_values_2021 |
| Pinto bean amino acid digestibility and score in a Mexican dish with corn tortilla and guacamole, evaluated in adults using a dual tracer isotopic method | calderondelabarca_pinto_2021 |
| Most meat products have DIAAS that are greater than 100, but processing may increase or reduce protein quality | bailey_pork_2020 |
| Amino Acid Digestibility of Extruded Chickpea and Yellow Pea Protein is High and Comparable in Moderately Stunted South Indian Children with Use of a Dual Stable Isotope Tracer Method | devi_amino_2020 |
| Standardized ileal digestible amino acids and net energy contents in full fat and defatted black soldier fly larvae meals (Hermetia illucens) fed to growing pigs | crosbie_2020 |
| Digestibility of amino acids, fiber, and energy by growing pigs, and concentrations of digestible and metabolizable energy in yellow dent corn, hard red winter wheat, and sorghum may be influenced by extrusion | rodriguez_2020 |
5.3 Features added to the dataset
| Feature | Unit |
|---|---|
| Protein | g/kg |
| Tryptophan (TRP) | g/kg |
| Threonine (THR) | g/kg |
| Isoleucine (ILE) | g/kg |
| Leucine (LEU) | g/kg |
| Lysine (LYS) | g/kg |
| Methionine (MET) | g/kg |
| Cysteine (CYS) | g/kg |
| Phenylaline (PHE) | g/kg |
| Tyrosine (TYR) | g/kg |
| Valine (VAL) | g/kg |
| Arginine (ARG) | g/kg |
| Histidine (HIS) | g/kg |
| Feature | Unit |
|---|---|
| Energy | kJ/100g |
| Dietary Fiber | g/100g |
| Fat | g/100g |
| Ash | g/100g |
| Total Sugar | g/100g |
| Calcium | mg/100g |
| Sodium | mg/100g |
| Manganese | mg/100g |
| Zinc | mg/100g |
| Copper | mg/100g |
| Iron | mg/100g |
| Selenium | ug/100g |
5.4 Baseline models accuracy
Random forest is an ensemble of decision trees created by using bootstrap samples of the training dataset and random selection in tree induction breiman_random_2001 . XGBoost is an ensemble approach with a gradient descent–boosted decision tree algorithm chen_xgboost_2016 . LightGBM is an improvement framework based on the gradient descent–boosted decision tree algorithm and is more powerful than the previous XGBoost with a fast training speed and less memory occupation ke_lightgbm_2017 .
| Model | R2 | RSME |
|---|---|---|
| LGBM | 0.88 | 0.04 |
| XGBoost | 0.87 | 0.04 |
| Random Forest | 0.82 | 0.05 |
| Gradient Boosting | 0.82 | 0.05 |
| Bagging | 0.81 | 0.05 |
| KNeighbors | 0.73 | 0.06 |
| Decision Tree | 0.72 | 0.06 |
| Nu Support Vector Regression | 0.70 | 0.07 |
| Linear Regression | 0.66 | 0.07 |
| Lasso model (with Lars) | 0.66 | 0.07 |
| SVR | 0.62 | 0.07 |
| Poisson | 0.49 | 0.09 |
5.5 Interpretability of feature impact for food item
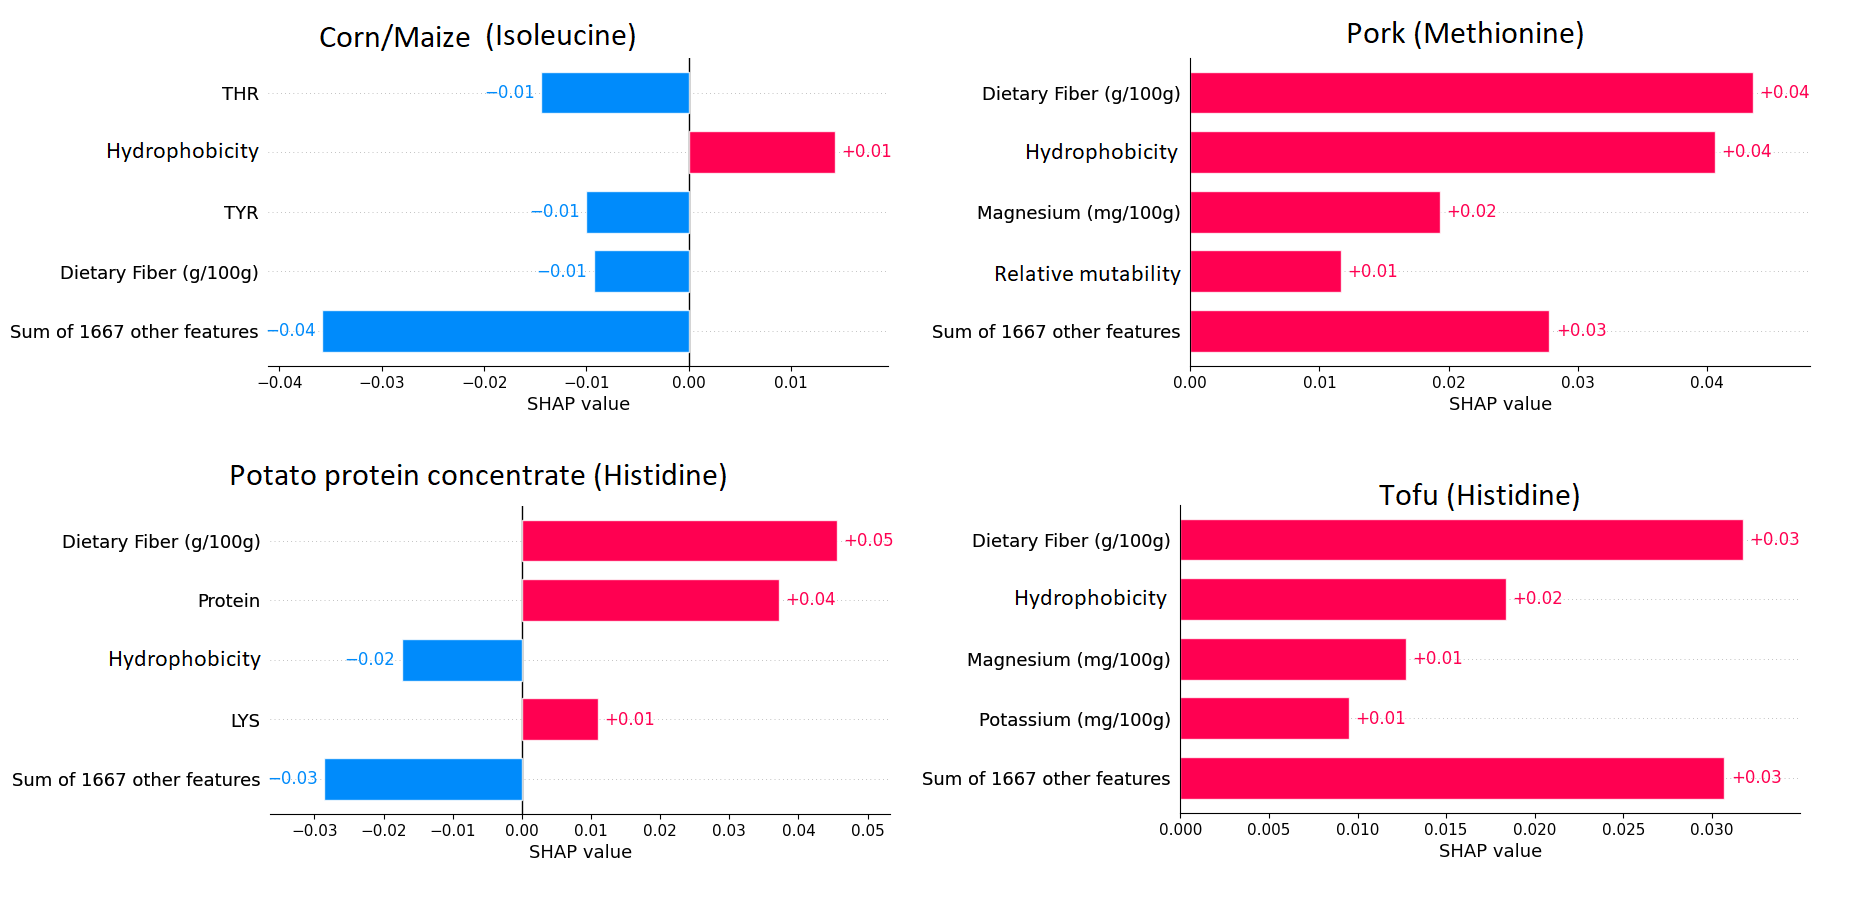
Using SHAP interaction values, we can decompose the impact of a feature on a specific sample, allowing for model interpretability. We selected three of the food items we predicted the true ileal digestibility and plot the contributions of each feature in the model for this specific sample, as shown in Supplementary figure 4.
It is known that maize protein quality is fairly poor because it contains very low amounts of the essential amino threonine (THR) azevedo_biosynthesis_1997 . Tyrosine values were also not reported in our dataset, mainly because it’s usually present in high amount on maize kohlmeier_nutrient_2003 . These and the dietary fiber content are negatively impacting the model. The hydrophobicity of the proteins of maize on the other hand, increase protein digestibility. It is known that an increase in protein hydrophobicity is directly related to protein unfolding and positively correlated with digestion he_effect_2018 ; tang_heat-induced_2022 . The same characteristic is observed on Pork. Thus, the small values of dietary fiber and magnesium of the food item also increased the protein digestibility.
For potato protein concentrate, the amount of total protein is directly associated with the protein digestibility. The low values of dietary fiber also impacted the model positively and potatoes are usually high on lysine knorr_effect_1980 . Tofu’s low levels of magnesium, potassium and dietary fiber increased the protein digestibility prediction. The original soy milk is heated during tofu’s production process, which might lead to protein unfolding and an increase in protein hydrophobicity as well.
Limiting amino acid predicted for food items
| Limiting amino acid | |||
|---|---|---|---|
| Food Item | DIAAS for Infants | DIAAS for Children | DIAAS for Adults |
| Corn/Maize | Tryptophan | Lysine | Lysine |
| Soybean protein concentrate | Leucine | Lysine | Valine |
| Potato protein concentrate | Tryptophan | Histidine | Histidine |
| Tofu | SAAs | SAAs | SAAs |
| Rye (Secale cereale L.) | Tryptophan | Lysine | Lysine |
| Pork (raw belly) | Tryptophan | Valine | Valine |
| Almond | Cysteine | Cysteine | Cysteine |
5.6 Ablation study
Figure 5 shows the inputs that the different models were created with. For each model, we used 2304 samples, determined by the true ileal digestibility of the 12 indispensable aminoacids of 192 food items. Model A, also known as the baseline model, was trained using the complete dataset composed of 10700 features, such as nutritional information, amino acid score, and biochemical information obtained through protein sequence. Model B was trained with 25 features after the selection of the 20 most important features using SHAP. For model C we used these same 20 features with the 3 families of 1024 embeddings obtained from the language model, resulting in 3097 features. Hyperparameters of all these models were optimized using a combination of a randomized grid search technique and manual tuning using stratified 5-fold cross-validation on the training set.
5.7 Sensitivity Analysis
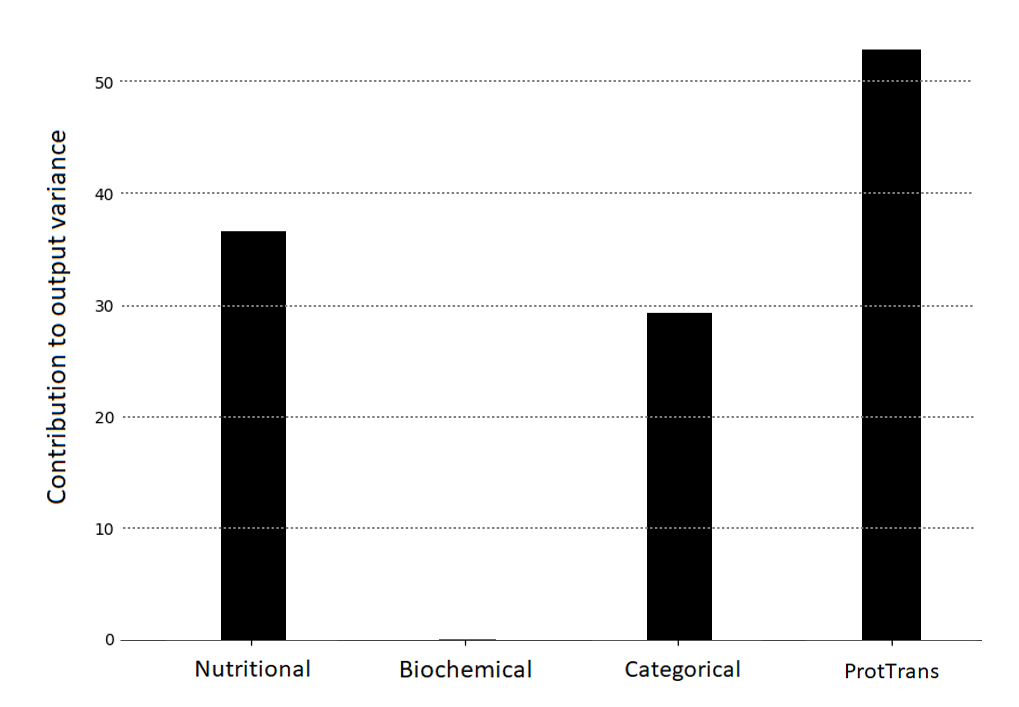
In this section, we report the results of sensitivity analysis to study how the uncertainty in the model output is explained by the different input features. We use a variance based sensitivity analysis method as described in SALTELLI2010259 . We used the SALib package salib for sensitivity analysis. Figure 6 illustrates the results of sensitivity analysis. We report the total order sensitivity effects that measure the variance in the output due to the first-order effects (by varying the input alone) and its interactions with other features. We observe that ProtTrans embeddings obtained by training on the protein sequences explained the maximum amount of variation (52%) in the digestibility coefficient, our output. The remaining variation was contributed to by the nutritional (36%), biochemical (0.04%) and categorical features that include the protein families, food group and indispensable amino acid related inputs (29%).
DIAAS value calculation
To calculate the DIAAS value obtained through the predicted true ileal digestibility coefficient of each amino acid, the following equation is used:
| (1) |
where IAAT is mg of digestible dietary IAA in 1 gram of the test protein and is the amount of mg of the same amino acid in 1 gram of the reference IAA. The digestible dietary content of each IAA is calculated as the content of each amino acid multiplied by their respective digestibility coefficient or true ileal digestibility score. The amount of each IAA in the reference protein is calculated by dividing the requirement for each IAA by the estimated average requirement. Thus, the DIAAS is determined by the most limiting IAA in the test protein in relation to its corresponding content in the reference protein.
Supplementary table 7 shows the DIAAS for infants, children and adults calculated for 7 different food items. The ground truth values were obtained through experiments and referenced on the table. These values were calculated out of the predicted true ileal digestibility values for each amino acid. The limiting amino acids of each food item for each DIAAS category is shown in Supplementary table 6. An example of the calculated values for almond is shown in figure 7.
To our knowledge, DIAAS has not been determined in almonds. However, PDCAAS values ranged from 44.3 to 47.8 house_determination_2019 . However, PDCAAS values were reported to be generally higher than a DIAAS values, especially for the poorer quality proteins. Therefore, having DIAAS values for as many food items as possible are of potential practical importance for populations in which dietary protein intake may be marginal rutherfurd_protein_2015 .
DIAAS value of food items
| Food Item | Origin | Reference | DIAAS for Infants | DIAAS for Children | DIAAS for Adults | |||
| Ground Truth | Predicted | Ground Truth | Predicted | Ground Truth | Predicted | |||
| Maize (yellow dent) | Train | cervantes-pahm_digestible_2014 | 27 | 29.91 | 40 | 39.65 | 48 | 47.09 |
| Soybean protein concentrate | Train | afz_amipig_2000 | 76 | 75.32 | 102 | 102.20 | 112 | 112.10 |
| Potato protein concentrate | Test | afz_amipig_2000 | 61 | 68.26 | 95 | 93.73 | 118 | 117.17 |
| Tofu | Test | reynaud_true_2021 | 62 | 65.92 | 75 | 80.57 | 88 | 94.58 |
| Rye (Secale cereale L.) | Test | cervantes-pahm_digestible_2014 | 41 | 40.69 | 50 | 51.85 | 60 | 61.57 |
| Pork (raw belly) | Test | bailey_pork_2020 | 69 | 66.76 | 110 | 109.92 | 119 | 118.16 |
| Almond | - | - | No data available | 31.00 | No data available | 37.00 | No data available | 44.00 |
5.8 Biological and physiochemical features extracted from Protlearn
The following table summarizes the features we extracted from the Protlearn package dorfer_protlearn_nodate . For each food item in our dataset, we collected 2 to 3 FASTA sequences of their most abundant protein families. By inputting each FASTA sequence into the Protlearn dorfer_protlearn_nodate package, we obtained several features of that chemically and physically characterized the component protein families of each food. The large majority of these extracted features are Amino Acid Indices, a set of 566 indices dorfer_protlearn_nodate aaindex1 that represent various physiochemical properties of amino acids. The indices for each protein sequence are calculated by averaging the index values for all of the individual amino acids in the sequence.
| Feature | Descriptor |
|---|---|
| Entropy | The Shannon entropy for the amino acid sequence |
| C | Fraction of carbon atoms |
| H | Fraction of hydrogen atoms |
| N | Fraction of nitrogen atoms |
| O | Fraction of oxygen atoms |
| S | Fraction of sulfur atoms |
| N | Fraction of nitrogen atoms |
| Total Bound | Total number of bonds |
| Single Bound | Number of single bonds |
| Double Bound | Number of double bonds |
| ANDN920101 | alpha-CH chemical shifts |
| ARGP820101 | Hydrophobicity index |
| ARGP820102 | Signal sequence helical potential |
| ARGP820103 | Membrane-buried preference parameters |
| BEGF750101 | Conformational parameter of inner helix |
| BEGF750102 | Conformational parameter of beta-structure |
| BEGF750103 | Conformational parameter of beta-turn |
| BHAR880101 | Average flexibility indices |
| BIGC670101 | Residue volume |
| BIOV880101 | Information value for accessibility; average fraction 35% |
| BIOV880102 | Information value for accessibility; average fraction 23% |
| BROC820101 | Retention coefficient in TFA |
| BROC820102 | Retention coefficient in HFBA |
| BULH740101 | Transfer free energy to surface |
| BULH740102 | Apparent partial specific volume |
| BUNA790101 | alpha-NH chemical shifts |
| BUNA790102 | alpha-CH chemical shifts |
| BUNA790103 | Spin-spin coupling constants 3JHalpha-NH |
| BURA740101 | Normalized frequency of alpha-helix |
| BURA740102 | Normalized frequency of extended structure |
| CHAM810101 | Steric parameter |
| CHAM820101 | Polarizability parameter |
| CHAM820102 | Free energy of solution in water, kcal/mole |
| CHAM830101 | The Chou-Fasman parameter of the coil conformation |
| CHAM830102 | A parameter defined from the residuals obtained from the best correlation of the Chou-Fasman parameter of beta-sheet |
| Feature | Descriptor |
|---|---|
| CHAM830103 | The number of atoms in the side chain labelled |
| CHAM830104 | The number of atoms in the side chain labelled |
| CHAM830105 | The number of atoms in the side chain labelled |
| CHAM830106 | The number of bonds in the longest chain |
| CHAM830107 | A parameter of charge transfer capability |
| CHAM830108 | A parameter of charge transfer donor capability |
| CHOC750101 | Average volume of buried residue |
| CHOC760101 | Residue accessible surface area in tripeptide |
| CHOC760102 | Residue accessible surface area in folded protein |
| CHOC760103 | Proportion of residues 95% buried |
| CHOC760104 | Proportion of residues 100% buried |
| CHOP780101 | Normalized frequency of beta-turn |
| CHOP780201 | Normalized frequency of alpha-helix |
| CHOP780202 | Normalized frequency of beta-sheet |
| CHOP780203 | Normalized frequency of beta-turn |
| CHOP780204 | Normalized frequency of N-terminal helix |
| CHOP780205 | Normalized frequency of C-terminal helix |
| CHOP780206 | Normalized frequency of N-terminal non helical region |
| CHOP780207 | Normalized frequency of C-terminal non helical region |
| CHOP780208 | Normalized frequency of N-terminal beta-sheet |
| CHOP780209 | Normalized frequency of C-terminal beta-sheet |
| CHOP780210 | Normalized frequency of N-terminal non beta region |
| CHOP780211 | Normalized frequency of C-terminal non beta region |
| CHOP780212 | Frequency of the 1st residue in turn |
| CHOP780213 | Frequency of the 2nd residue in turn |
| CHOP780214 | Frequency of the 3rd residue in turn |
| CHOP780215 | Frequency of the 4th residue in turn |
| CHOP780216 | Normalized frequency of the 2nd and 3rd residues in turn |
| CIDH920101 | Normalized hydrophobicity scales for alpha-proteins |
| CIDH920102 | Normalized hydrophobicity scales for beta-proteins |
| CIDH920103 | Normalized hydrophobicity scales for alpha+beta-proteins |
| CIDH920104 | Normalized hydrophobicity scales for alpha/beta-proteins |
| CIDH920105 | Normalized average hydrophobicity scales |
| COHE430101 | Partial specific volume |
| Feature | Descriptor |
|---|---|
| CIDH920104 | Normalized hydrophobicity scales for alpha/beta-proteins |
| CIDH920105 | Normalized average hydrophobicity scales |
| COHE430101 | Partial specific volume |
| CRAJ730101 | Normalized frequency of middle helix |
| CRAJ730102 | Normalized frequency of beta-sheet |
| CRAJ730103 | Normalized frequency of turn |
| DAWD720101 | Size |
| DAYM780101 | Amino acid composition |
| DAYM780201 | Relative mutability |
| DESM900101 | Membrane preference for cytochrome b: MPH89 |
| DESM900102 | Average membrane preference: AMP07 |
| EISD840101 | Consensus normalized hydrophobicity scale |
| EISD860101 | Solvation free energy |
| EISD860102 | Atom-based hydrophobic moment |
| EISD860103 | Direction of hydrophobic moment |
| FASG760101 | Molecular weight |
| FASG760102 | Melting point |
| FASG760103 | Optical rotation |
| FASG760104 | pK-N |
| FASG760105 | pK-C |
| FAUJ830101 | Hydrophobic parameter pi |
| FAUJ880101 | Graph shape index |
| FAUJ880102 | Smoothed upsilon steric parameter |
| FAUJ880103 | Normalized van der Waals volume |
| FAUJ880104 | STERIMOL length of the side chain |
| FAUJ880105 | STERIMOL minimum width of the side chain |
| FAUJ880106 | STERIMOL maximum width of the side chain |
| FAUJ880107 | N.m.r. chemical shift of alpha-carbon |
| FAUJ880108 | Localized electrical effect |
| FAUJ880109 | Number of hydrogen bond donors |
| FAUJ880110 | Number of full nonbonding orbitals |
| FAUJ880111 | Positive charge |
| FAUJ880112 | Negative charge |
| FAUJ880113 | pK-a(RCOOH) |
| FINA770101 | Helix-coil equilibrium constant |
| FINA910101 | Helix initiation parameter at position |
| FINA910102 | Helix initiation parameter at position ,, |
| FINA910103 | Helix termination parameter at position ,, |
| FINA910104 | Helix termination parameter at position |
| GARJ730101 | Partition coefficient |
| GEIM800101 | Alpha-helix indices |
| Feature | Descriptor |
|---|---|
| GEIM800102 | Alpha-helix indices for alpha-proteins |
| GEIM800103 | Alpha-helix indices for beta-proteins |
| GARJ730101 | Partition coefficient |
| GEIM800101 | Alpha-helix indices |
| GEIM800102 | Alpha-helix indices for alpha-proteins |
| GEIM800103 | Alpha-helix indices for beta-proteins |
| GEIM800104 | Alpha-helix indices for alpha/beta-proteins |
| GEIM800105 | Beta-strand indices |
| GEIM800106 | Beta-strand indices for beta-proteins |
| GEIM800107 | Beta-strand indices for alpha/beta-proteins |
| GEIM800108 | Aperiodic indices |
| GEIM800109 | Aperiodic indices for alpha-proteins |
| GEIM800110 | Aperiodic indices for beta-proteins |
| GEIM800111 | Aperiodic indices for alpha/beta-proteins |
| GOLD730101 | Hydrophobicity factor |
| GOLD730102 | Residue volume |
| GRAR740101 | Composition |
| GRAR740102 | Polarity |
| GRAR740103 | Volume |
| GUYH850101 | Partition energy |
| HOPA770101 | Hydration number |
| HOPT810101 | Hydrophilicity value |
| HUTJ700101 | Heat capacity |
| HUTJ700102 | Absolute entropy |
| HUTJ700103 | Entropy of formation |
| ISOY800101 | Normalized relative frequency of alpha-helix |
| ISOY800102 | Normalized relative frequency of extended structure |
| ISOY800103 | Normalized relative frequency of bend |
| ISOY800104 | Normalized relative frequency of bend R |
| ISOY800105 | Normalized relative frequency of bend S |
| ISOY800106 | Normalized relative frequency of helix end |
| ISOY800107 | Normalized relative frequency of double bend |
| ISOY800108 | Normalized relative frequency of coil |
| JANJ780101 | Average accessible surface area |
| JANJ780102 | Percentage of buried residues |
| JANJ780103 | Percentage of exposed residues |
| JANJ790101 | Ratio of buried and accessible molar fractions |
| JANJ790102 | Transfer free energy |
| JOND750101 | Hydrophobicity |
| JOND750102 | pK (-COOH) |
| JOND920101 | Relative frequency of occurrence |
| JOND920102 | Relative mutability |
| Feature | Descriptor |
|---|---|
| JUKT750101 | Amino acid distribution |
| JUNJ780101 | Sequence frequency |
| KANM800101 | Average relative probability of helix |
| KANM800102 | Average relative probability of beta-sheet |
| KANM800103 | Average relative probability of inner helix |
| KANM800104 | Average relative probability of inner beta-sheet |
| KARP850101 | Flexibility parameter for no rigid neighbors |
| KARP850102 | Flexibility parameter for one rigid neighbor |
| KARP850103 | Flexibility parameter for two rigid neighbors |
| KHAG800101 | The Kerr-constant increments |
| KLEP840101 | Net charge |
| KRIW710101 | Side chain interaction parameter |
| KRIW790101 | Side chain interaction parameter |
| KRIW790102 | Fraction of site occupied by water |
| KRIW790103 | Side chain volume |
| KYTJ820101 | Hydropathy index |
| LAWE840101 | Transfer free energy, CHP/water |
| LEVM760101 | Hydrophobic parameter |
| LEVM760102 | Distance between C-alpha and centroid of side chain |
| LEVM760103 | Side chain angle theta(AAR) |
| LEVM760104 | Side chain torsion angle phi(AAAR) |
| LEVM760105 | Radius of gyration of side chain |
| LEVM760106 | van der Waals parameter R0 |
| LEVM760107 | van der Waals parameter epsilon |
| LEVM780101 | Normalized frequency of alpha-helix, with weights |
| LEVM780102 | Normalized frequency of beta-sheet, with weights |
| LEVM780103 | Normalized frequency of reverse turn, with weights |
| LEVM780104 | Normalized frequency of alpha-helix, unweighted |
| LEVM780106 | Normalized frequency of reverse turn, unweighted |
| LEWP710101 | Frequency of occurrence in beta-bends |
| LIFS790101 | Conformational preference for all beta-strands |
| LIFS790102 | Conformational preference for parallel beta-strands |
| LIFS790103 | Conformational preference for antiparallel beta-strands |
| MANP780101 | Average surrounding hydrophobicity |
| MAXF760101 | Normalized frequency of alpha-helix |
| MAXF760102 | Normalized frequency of extended structure |
| MAXF760103 | Normalized frequency of zeta R |
| MAXF760104 | Normalized frequency of left-handed alpha-helix |
| MAXF760105 | Normalized frequency of zeta L |
| MAXF760106 | Normalized frequency of alpha region |
| MCMT640101 | Refractivity |
| MEEJ800101 | Retention coefficient in HPLC, pH7.4 |
| MEEJ800102 | Retention coefficient in HPLC, pH2.1 |
| Feature | Descriptor |
|---|---|
| MEEJ810101 | Retention coefficient in NaClO4 |
| MEEJ810102 | Retention coefficient in NaH2PO4 |
| MEIH800101 | Average reduced distance for C-alpha |
| MEIH800102 | Average reduced distance for side chain |
| MEIH800103 | Average side chain orientation angle |
| MIYS850101 | Effective partition energy |
| NAGK730101 | Normalized frequency of alpha-helix |
| NAGK730102 | Normalized frequency of bata-structure |
| NAGK730103 | Normalized frequency of coil |
| NAKH900101 | AA composition of total proteins |
| NAKH900102 | SD of AA composition of total proteins |
| NAKH900103 | AA composition of mt-proteins |
| NAKH900104 | Normalized composition of mt-proteins |
| NAKH900105 | AA composition of mt-proteins from animal |
| NAKH900106 | Normalized composition from animal |
| NAKH900107 | AA composition of mt-proteins from fungi and plant |
| NAKH900108 | Normalized composition from fungi and plant |
| NAKH900109 | AA composition of membrane proteins |
| NAKH900110 | Normalized composition of membrane proteins |
| NAKH900111 | Transmembrane regions of non-mt-proteins |
| NAKH900112 | Transmembrane regions of mt-proteins |
| NAKH900113 | Ratio of average and computed composition |
| NAKH920101 | AA composition of CYT of single-spanning proteins |
| NAKH920102 | AA composition of CYT2 of single-spanning proteins |
| NAKH920103 | AA composition of EXT of single-spanning proteins |
| NAKH920104 | AA composition of EXT2 of single-spanning proteins |
| NAKH920105 | AA composition of MEM of single-spanning proteins |
| NAKH920106 | AA composition of CYT of multi-spanning proteins |
| NAKH920107 | AA composition of EXT of multi-spanning proteins |
| NAKH920108 | AA composition of MEM of multi-spanning proteins |
| NISK800101 | 8 A contact number |
| NISK860101 | 14 A contact number |
| NOZY710101 | Transfer energy, organic solvent/water |
| OOBM770101 | Average non-bonded energy per atom |
| OOBM770102 | Short and medium range non-bonded energy per atom |
| OOBM770103 | Long range non-bonded energy per atom |
| OOBM770104 | Average non-bonded energy per residue |
| OOBM770105 | Short and medium range non-bonded energy per residue |
| OOBM850101 | Optimized beta-structure-coil equilibrium constant |
| OOBM850102 | Optimized propensity to form reverse turn |
| OOBM850103 | Optimized transfer energy parameter |
| Feature | Descriptor |
|---|---|
| OOBM850104 | Optimized average non-bonded energy per atom |
| OOBM850105 | Optimized side chain interaction parameter |
| PALJ810101 | Normalized frequency of alpha-helix from LG |
| PALJ810102 | Normalized frequency of alpha-helix from CF |
| PALJ810103 | Normalized frequency of beta-sheet from LG |
| PALJ810104 | Normalized frequency of beta-sheet from CF |
| PALJ810105 | Normalized frequency of turn from LG |
| PALJ810106 | Normalized frequency of turn from CF |
| PALJ810107 | Normalized frequency of alpha-helix in all-alpha class |
| PALJ810108 | Normalized frequency of alpha-helix in alpha+beta class |
| PALJ810109 | Normalized frequency of alpha-helix in alpha/beta class |
| PALJ810110 | Normalized frequency of beta-sheet in all-beta class |
| PALJ810111 | Normalized frequency of beta-sheet in alpha+beta class |
| PALJ810112 | Normalized frequency of beta-sheet in alpha/beta class |
| PALJ810113 | Normalized frequency of turn in all-alpha class |
| PALJ810114 | Normalized frequency of turn in all-beta class |
| PALJ810115 | Normalized frequency of turn in alpha+beta class |
| PALJ810116 | Normalized frequency of turn in alpha/beta class |
| PARJ860101 | HPLC parameter |
| PLIV810101 | Partition coefficient |
| PONP800101 | Surrounding hydrophobicity in folded form |
| PONP800102 | Average gain in surrounding hydrophobicity |
| PONP800103 | Average gain ratio in surrounding hydrophobicity |
| PONP800104 | Surrounding hydrophobicity in alpha-helix |
| PONP800105 | Surrounding hydrophobicity in beta-sheet |
| PONP800106 | Surrounding hydrophobicity in turn |
| PONP800107 | Accessibility reduction ratio |
| PONP800108 | Average number of surrounding residues |
| PRAM820101 | Intercept in regression analysis |
| PRAM820102 | Slope in regression analysis x 1.0E1 |
| PRAM820103 | Correlation coefficient in regression analysis |
| PRAM900101 | Hydrophobicity |
| PRAM900102 | Relative frequency in alpha-helix |
| PRAM900103 | Relative frequency in beta-sheet |
| PRAM900104 | Relative frequency in reverse-turn |
| PTIO830101 | Helix-coil equilibrium constant |
| Feature | Descriptor |
|---|---|
| PONP800103 | Average gain ratio in surrounding hydrophobicity |
| PONP800104 | Surrounding hydrophobicity in alpha-helix |
| PONP800105 | Surrounding hydrophobicity in beta-sheet |
| PONP800106 | Surrounding hydrophobicity in turn |
| PONP800107 | Accessibility reduction ratio |
| PONP800108 | Average number of surrounding residues |
| PRAM820101 | Intercept in regression analysis |
| PRAM820102 | Slope in regression analysis x 1.0E1 |
| PTIO830102 | Beta-coil equilibrium constant |
| QIAN880101 | Weights for alpha-helix at the window position of -6 |
| QIAN880102 | Weights for alpha-helix at the window position of -5 |
| QIAN880103 | Weights for alpha-helix at the window position of -4 |
| QIAN880104 | Weights for alpha-helix at the window position of -3 |
| QIAN880105 | Weights for alpha-helix at the window position of -2 |
| QIAN880106 | Weights for alpha-helix at the window position of -1 |
| QIAN880107 | Weights for alpha-helix at the window position of 0 |
| QIAN880108 | Weights for alpha-helix at the window position of 1 |
| QIAN880109 | Weights for alpha-helix at the window position of 2 |
| QIAN880110 | Weights for alpha-helix at the window position of 3 |
| QIAN880111 | Weights for alpha-helix at the window position of 4 |
| QIAN880112 | Weights for alpha-helix at the window position of 5 |
| QIAN880113 | Weights for alpha-helix at the window position of 6 |
| QIAN880114 | Weights for beta-sheet at the window position of -6 |
| QIAN880115 | Weights for beta-sheet at the window position of -5 |
| QIAN880116 | Weights for beta-sheet at the window position of -4 |
| QIAN880117 | Weights for beta-sheet at the window position of -3 |
| QIAN880118 | Weights for beta-sheet at the window position of -2 |
| QIAN880119 | Weights for beta-sheet at the window position of -1 |
| QIAN880120 | Weights for beta-sheet at the window position of 0 |
| QIAN880121 | Weights for beta-sheet at the window position of 1 |
| QIAN880122 | Weights for beta-sheet at the window position of 2 |
| QIAN880123 | Weights for beta-sheet at the window position of 3 |
| QIAN880124 | Weights for beta-sheet at the window position of 4 |
| QIAN880125 | Weights for beta-sheet at the window position of 5 |
| QIAN880126 | Weights for beta-sheet at the window position of 6 |
| QIAN880127 | Weights for coil at the window position of -6 |
| QIAN880128 | Weights for coil at the window position of -5 |
| QIAN880129 | Weights for coil at the window position of -4 |
| QIAN880130 | Weights for coil at the window position of -3 |
| QIAN880131 | Weights for coil at the window position of -2 |
| QIAN880132 | Weights for coil at the window position of -1 |
| QIAN880133 | Weights for coil at the window position of 0 |
| Feature | Descriptor |
|---|---|
| QIAN880134 | Weights for coil at the window position of 1 |
| QIAN880135 | Weights for coil at the window position of 2 |
| QIAN880136 | Weights for coil at the window position of 3 |
| QIAN880137 | Weights for coil at the window position of 4 |
| QIAN880138 | Weights for coil at the window position of 5 |
| QIAN880139 | Weights for coil at the window position of 6 |
| RACS770101 | Average reduced distance for C-alpha |
| RACS770102 | Average reduced distance for side chain |
| RACS770103 | Side chain orientational preference |
| RACS820101 | Average relative fractional occurrence in A0(i) |
| RACS820102 | Average relative fractional occurrence in AR(i) |
| RACS820103 | Average relative fractional occurrence in AL(i) |
| RACS820104 | Average relative fractional occurrence in EL(i) |
| RACS820105 | Average relative fractional occurrence in E0(i) |
| RACS820106 | Average relative fractional occurrence in ER(i) |
| RACS820107 | Average relative fractional occurrence in A0(i-1) |
| RACS820108 | Average relative fractional occurrence in AR(i-1) |
| RACS820109 | Average relative fractional occurrence in AL(i-1) |
| RACS820110 | Average relative fractional occurrence in EL(i-1) |
| RACS820111 | Average relative fractional occurrence in E0(i-1) |
| RACS820112 | Average relative fractional occurrence in ER(i-1) |
| RACS820113 | Value of theta(i) |
| RACS820114 | Value of theta(i-1) |
| RADA880101 | Transfer free energy from chx to wat |
| RADA880102 | Transfer free energy from oct to wat |
| RADA880103 | Transfer free energy from vap to chx |
| RADA880104 | Transfer free energy from chx to oct |
| RADA880105 | Transfer free energy from vap to oct |
| RADA880106 | Accessible surface area |
| RADA880107 | Energy transfer from out to in(95%buried) |
| RADA880108 | Mean polarity |
| RICJ880101 | Relative preference value at N” |
| RICJ880102 | Relative preference value at N’ |
| RICJ880103 | Relative preference value at N-cap |
| RICJ880104 | Relative preference value at N1 |
| RICJ880105 | Relative preference value at N2 |
| RICJ880106 | Relative preference value at N3 |
| RICJ880107 | Relative preference value at N4 |
| RICJ880108 | Relative preference value at N5 |
| RICJ880109 | Relative preference value at Mid |
| RICJ880110 | Relative preference value at C5 |
| RICJ880111 | Relative preference value at C4 |
| RICJ880112 | Relative preference value at C3 |
| Feature | Descriptor |
|---|---|
| RICJ880113 | Relative preference value at C2 |
| RICJ880114 | Relative preference value at C1 |
| RICJ880115 | Relative preference value at C-cap |
| RICJ880116 | Relative preference value at C’ |
| RICJ880117 | Relative preference value at C” |
| ROBB760101 | Information measure for alpha-helix |
| ROBB760102 | Information measure for N-terminal helix |
| ROBB760103 | Information measure for middle helix |
| ROBB760104 | Information measure for C-terminal helix |
| ROBB760105 | Information measure for extended |
| ROBB760106 | Information measure for pleated-sheet |
| ROBB760107 | Information measure for extended without H-bond |
| ROBB760108 | Information measure for turn |
| ROBB760109 | Information measure for N-terminal turn |
| ROBB760110 | Information measure for middle turn |
| ROBB760111 | Information measure for C-terminal turn |
| ROBB760112 | Information measure for coil |
| ROBB760113 | Information measure for loop |
| ROBB790101 | Hydration free energy |
| ROSG850101 | Mean area buried on transfer |
| ROSG850102 | Mean fractional area loss |
| ROSM880101 | Side chain hydropathy, uncorrected for solvation |
| ROSM880102 | Side chain hydropathy, corrected for solvation |
| ROSM880103 | Loss of Side chain hydropathy by helix formation |
| SIMZ760101 | Transfer free energy |
| SNEP660101 | Principal component I |
| SNEP660102 | Principal component II |
| SNEP660103 | Principal component III |
| SNEP660104 | Principal component IV |
| SUEM840101 | Zimm-Bragg parameter s at 20 C |
| SUEM840102 | Zimm-Bragg parameter sigma x 1.0E4 |
| SWER830101 | Optimal matching hydrophobicity |
| TANS770101 | Normalized frequency of alpha-helix |
| TANS770102 | Normalized frequency of isolated helix |
| TANS770103 | Normalized frequency of extended structure |
| TANS770104 | Normalized frequency of chain reversal R |
| TANS770105 | Normalized frequency of chain reversal S |
| TANS770106 | Normalized frequency of chain reversal D |
| TANS770107 | Normalized frequency of left-handed helix |
| TANS770108 | Normalized frequency of zeta R |
| TANS770109 | Normalized frequency of coil |
| TANS770110 | Normalized frequency of chain reversal |
| Feature | Descriptor |
|---|---|
| VASM830101 | Relative population of conformational state A |
| VASM830102 | Relative population of conformational state C |
| VASM830103 | Relative population of conformational state E |
| VELV850101 | Electron-ion interaction potential |
| VENT840101 | Bitterness |
| VHEG790101 | Transfer free energy to lipophilic phase |
| WARP780101 | Average interactions per side chain atom |
| WEBA780101 | RF value in high salt chromatography |
| WERD780101 | Propensity to be buried inside |
| WERD780102 | Free energy change of epsilon(i) to epsilon(ex) |
| WERD780103 | Free energy change of alpha(Ri) to alpha(Rh) |
| WERD780104 | Free energy change of epsilon(i) to alpha(Rh) |
| WOEC730101 | Polar requirement |
| WOLR810101 | Hydration potential |
| WOLS870101 | Principal property value z1 |
| WOLS870102 | Principal property value z2 |
| WOLS870103 | Principal property value z3 |
| YUTK870101 | Unfolding Gibbs energy in water, pH7.0 |
| YUTK870102 | Unfolding Gibbs energy in water, pH9.0 |
| YUTK870103 | Activation Gibbs energy of unfolding, pH7.0 |
| YUTK870104 | Activation Gibbs energy of unfolding, pH9.0 |
| ZASB820101 | Dependence of partition coefficient on ionic strength |
| ZIMJ680101 | Hydrophobicity |
| ZIMJ680102 | Bulkiness |
| ZIMJ680103 | Polarity |
| ZIMJ680104 | Isoelectric point |
| ZIMJ680105 | RF rank |
| AURR980101 | Normalized positional residue frequency at helix termini N4’ |
| AURR980102 | Normalized positional residue frequency at helix termini N”’ |
| AURR980103 | Normalized positional residue frequency at helix termini N” |
| AURR980104 | Normalized positional residue frequency at helix termini N’ |
| AURR980105 | Normalized positional residue frequency at helix termini Nc |
| AURR980106 | Normalized positional residue frequency at helix termini N1 |
| AURR980107 | Normalized positional residue frequency at helix termini N2 |
| AURR980108 | Normalized positional residue frequency at helix termini N3 |
| AURR980109 | Normalized positional residue frequency at helix termini N4 |
| Feature | Descriptor |
|---|---|
| AURR980110 | Normalized positional residue frequency at helix termini N5 |
| AURR980111 | Normalized positional residue frequency at helix termini C5 |
| AURR980112 | Normalized positional residue frequency at helix termini C4 |
| AURR980113 | Normalized positional residue frequency at helix termini C3 |
| AURR980114 | Normalized positional residue frequency at helix termini C2 |
| AURR980115 | Normalized positional residue frequency at helix termini C1 |
| AURR980116 | Normalized positional residue frequency at helix termini Cc |
| AURR980117 | Normalized positional residue frequency at helix termini C’ |
| AURR980118 | Normalized positional residue frequency at helix termini C” |
| AURR980119 | Normalized positional residue frequency at helix termini C”’ |
| AURR980120 | Normalized positional residue frequency at helix termini C4’ |
| ONEK900101 | Delta G values for the peptides extrapolated to 0 M urea |
| ONEK900102 | Helix formation parameters (delta delta G) |
| VINM940101 | Normalized flexibility parameters (B-values), average |
| VINM940102 | Normalized flexibility parameters (B-values) for each residue surrounded by none rigid neighbours |
| VINM940103 | Normalized flexibility parameters (B-values) for each residue surrounded by one rigid neighbours |
| VINM940104 | Normalized flexibility parameters (B-values) for each residue surrounded by two rigid neighbours |
| MUNV940101 | Free energy in alpha-helical conformation |
| MUNV940102 | Free energy in alpha-helical region |
| MUNV940103 | Free energy in beta-strand conformation |
| MUNV940104 | Free energy in beta-strand region |
| MUNV940105 | Free energy in beta-strand region |
| WIMW960101 | Free energies of transfer of AcWl-X-LL peptides from bilayer interface to water |
| KIMC930101 | Thermodynamic beta sheet propensity |
| MONM990101 | Turn propensity scale for transmembrane helices |
| BLAM930101 | Alpha helix propensity of position 44 in T4 lysozyme |
| Feature | Descriptor |
|---|---|
| PARS000101 | p-Values of mesophilic proteins based on the distributions of B values |
| PARS000102 | p-Values of thermophilic proteins based on the distributions of B values |
| KUMS000101 | Distribution of amino acid residues in the 18 non-redundant families of thermophilic proteins |
| KUMS000102 | Distribution of amino acid residues in the 18 non-redundant families of mesophilic proteins |
| KUMS000103 | Distribution of amino acid residues in the alpha-helices in thermophilic proteins |
| KUMS000104 | Distribution of amino acid residues in the alpha-helices in mesophilic proteins |
| TAKK010101 | Side-chain contribution to protein stability (kJ/mol) |
| FODM020101 | Propensity of amino acids within pi-helices |
| NADH010101 | Hydropathy scale based on self-information values in the two-state model (5% accessibility) |
| NADH010102 | Hydropathy scale based on self-information values in the two-state model (9% accessibility) |
| NADH010103 | Hydropathy scale based on self-information values in the two-state model (16% accessibility) |
| NADH010104 | Hydropathy scale based on self-information values in the two-state model (20% accessibility) |
| NADH010105 | Hydropathy scale based on self-information values in the two-state model (25% accessibility) |
| NADH010106 | Hydropathy scale based on self-information values in the two-state model (36% accessibility) |
| NADH010107 | Hydropathy scale based on self-information values in the two-state model (50% accessibility) |
| MONM990201 | Averaged turn propensities in a transmembrane helix |
| KOEP990101 | Alpha-helix propensity derived from designed sequences |
| KOEP990102 | Beta-sheet propensity derived from designed sequences |
| CEDJ970101 | Composition of amino acids in extracellular proteins (percent) |
| CEDJ970102 | Composition of amino acids in anchored proteins (percent) |
| CEDJ970103 | Composition of amino acids in membrane proteins (percent) |
| CEDJ970104 | Composition of amino acids in intracellular proteins (percent) |
| CEDJ970105 | Composition of amino acids in nuclear proteins (percent) |
| Feature | Descriptor |
|---|---|
| FUKS010101 | Surface composition of amino acids in intracellular proteins of thermophiles (percent) |
| FUKS010102 | Surface composition of amino acids in intracellular proteins of mesophiles (percent) |
| FUKS010103 | Surface composition of amino acids in extracellular proteins of mesophiles (percent) |
| FUKS010104 | Surface composition of amino acids in nuclear proteins (percent) |
| FUKS010105 | Interior composition of amino acids in intracellular proteins of thermophiles (percent) |
| FUKS010106 | Interior composition of amino acids in intracellular proteins of mesophiles (percent) |
| FUKS010107 | Interior composition of amino acids in extracellular proteins of mesophiles (percent) |
| FUKS010108 | Interior composition of amino acids in nuclear proteins (percent) |
| FUKS010109 | Entire chain composition of amino acids in intracellular proteins of thermophiles (percent) |
| FUKS010110 | Entire chain composition of amino acids in intracellular proteins of mesophiles (percent) |
| FUKS010111 | Entire chain composition of amino acids in extracellular proteins of mesophiles (percent) |
| FUKS010112 | Entire chain compositino of amino acids in nuclear proteins (percent) |
| MITS020101 | Amphiphilicity index |
| TSAJ990101 | Volumes including the crystallographic waters using the ProtOr |
| TSAJ990102 | Volumes not including the crystallographic waters using the ProtOr |
| COSI940101 | Electron-ion interaction potential values |
| PONP930101 | Hydrophobicity scales |
| WILM950101 | Hydrophobicity coefficient in RP-HPLC, C18 with 0.1%TFA/MeCN/H2O |
| WILM950102 | Hydrophobicity coefficient in RP-HPLC, C8 with 0.1%TFA/MeCN/H2O |
| WILM950103 | Hydrophobicity coefficient in RP-HPLC, C4 with 0.1%TFA/MeCN/H2O |
| WILM950104 | Hydrophobicity coefficient in RP-HPLC, C18 with 0.1%TFA/2-PrOH/MeCN/H2O |
| KUHL950101 | Hydrophilicity scale |
| GUOD860101 | Retention coefficient at pH 2 |
| JURD980101 | Modified Kyte-Doolittle hydrophobicity scale |
| Feature | Descriptor |
|---|---|
| BASU050101 | Interactivity scale obtained from the contact matrix |
| BASU050102 | Interactivity scale obtained by maximizing the mean of correlation coefficient over single-domain globular proteins |
| BASU050103 | Interactivity scale obtained by maximizing the mean of correlation coefficient over pairs of sequences sharing the TIM barrel fold |
| SUYM030101 | Linker propensity index |
| PUNT030101 | Knowledge-based membrane-propensity scale from 1D Helix in MPtopo databases |
| PUNT030102 | Knowledge-based membrane-propensity scale from 3D Helix in MPtopo databases |
| GEOR030101 | Linker propensity from all dataset |
| GEOR030102 | Linker propensity from 1-linker dataset |
| GEOR030103 | Linker propensity from 2-linker dataset |
| GEOR030104 | Linker propensity from 3-linker dataset |
| GEOR030105 | Linker propensity from small dataset (linker length is less than six residues) |
| GEOR030106 | Linker propensity from medium dataset (linker length is between six and 14 residues) |
| GEOR030107 | Linker propensity from long dataset (linker length is greater than 14 residues) |
| GEOR030108 | Linker propensity from helical (annotated by DSSP) dataset |
| GEOR030109 | Linker propensity from non-helical (annotated by DSSP) dataset |
| ZHOH040101 | The stability scale from the knowledge-based atom-atom potential |
| ZHOH040102 | The relative stability scale extracted from mutation experiments |
| ZHOH040103 | Buriability |
| BAEK050101 | Linker index |
| HARY940101 | Mean volumes of residues buried in protein interiors |
| PONJ960101 | Average volumes of residues |
| DIGM050101 | Hydrostatic pressure asymmetry index, PAI |
| WOLR790101 | Hydrophobicity index |
| OLSK800101 | Average internal preferences |
| KIDA850101 | Hydrophobicity-related index |
| GUYH850102 | Apparent partition energies calculated from Wertz-Scheraga index |
| GUYH850103 | Apparent partition energies calculated from Robson-Osguthorpe index |
| ) GUYH850104 | Apparent partition energies calculated from Janin index |
| Feature | Descriptor |
|---|---|
| GUYH850105 | Apparent partition energies calculated from Chothia index |
| JACR890101 | Weights from the IFH scale |
| COWR900101 | Hydrophobicity index, 3.0 pH |
| BLAS910101 | Scaled side chain hydrophobicity values |
| CASG920101 | Hydrophobicity scale from native protein structures |
| CORJ870101 | NNEIG index |
| CORJ870102 | SWEIG index |
| CORJ870103 | PRIFT index |
| CORJ870104 | PRILS index |
| CORJ870105 | ALTFT index |
| CORJ870106 | ALTLS index |
| CORJ870107 | TOTFT index |
| CORJ870108 | TOTLS index |
| MIYS990101 | Relative partition energies derived by the Bethe approximation |
| MIYS990102 | Optimized relative partition energies - method A |
| MIYS990103 | Optimized relative partition energies - method B |
| MIYS990104 | Optimized relative partition energies - method C |
| MIYS990105 | Optimized relative partition energies - method D |
| ENGD860101 | Hydrophobicity index |
| FASG890101 | Hydrophobicity index |
| KARS160101 | Number of vertices (order of the graph) |
| KARS160102 | Number of edges (size of the graph) |
| KARS160103 | Total weighted degree of the graph (obtained by adding all the weights of all the vertices) |
| KARS160104 | Weighted domination number |
| KARS160105 | Average eccentricity |
| KARS160106 | Radius (minimum eccentricity) |
| KARS160107 | Diameter (maximum eccentricity) |
| KARS160108 | Average weighted degree (total degree, divided by the number of vertices) |
| KARS160109 | Maximum eigenvalue of the weighted Laplacian matrix of the graph |
| KARS160110 | Minimum eigenvalue of the weighted Laplacian matrix of the graph |
| KARS160111 | Average eigenvalue of the Laplacian matrix of the the graph |
| KARS160112 | Second smallest eigenvalue of the Laplacian matrix of the graph |
| KARS160113 | Weighted domination number using the atomic number |
| Feature | Descriptor |
|---|---|
| KARS160114 | Average weighted eccentricity based on the the atomic number |
| KARS160115 | Weighted radius based on the atomic number (minimum eccentricity) |
| KARS160116 | Weighted diameter based on the atomic number (maximum eccentricity) |
| KARS160117 | Total weighted atomic number of the graph (obtained by summing all the atomic number of each of the vertices in the graph) |
| KARS160118 | Average weighted atomic number or degree based on atomic number in the graph |
| KARS160119 | Weighted maximum eigenvalue based on the atomic numbers |
| KARS160120 | Weighted minimum eigenvalue based on the atomic numbers |
| KARS160121 | Weighted average eigenvalue based on the atomic numbers |
| KARS160122 | Weighted second smallest eigenvalue of the weighted Laplacian matrix |