Learning in colloids: Synapse-like ZnO + DMSO colloid
Abstract
Colloids submitted to electrical stimuli exhibit a reconfiguration that could be used to store information and, potentially compute. We investigated learning, memorization, and time and stimulation’s voltage dependence of conductive network formation in a colloidal suspension of ZnO nanoparticles in DMSO. Relations between critical resistance and stimulation time were reconstructed. The critical voltage, i.e. the stimulation voltage necessary for dropping the resistance, was shown to decrease in response to an increase in stimulation time. We characterized a dispersion of conductive ZnO nanoparticles in the DMSO polymeric matrix using FESEM and UV–visible absorption spectrum.
keywords:
Neuromorphic device , Colloid , Memory devices , Artificial synapse , liquid computing , liquid robotics[uwe]organization=Unconventional Computing Laboratory, University of the West of England, Bristol, UK
[iit]organization=Center for Bioinspired Soft Robotics, Istituto Italiano di Tecnologia, Genova, Italy
1 Introduction
Massive parallel computations could be implemented using colloids since they have a wide range of unique properties. They are stable, meaning the particles remain suspended in the solution. Therefore, any particle can be addressed to access a memory cell in a colloid processor [1]. Moreover, colloid computers could be fault tolerant due to redundancy of the elementary processors-particles.
A most suitable candidate for colloid-based computers would be a colloid of conductive particle in insulating solution. In this paper we use zinc oxide particles suspended in a solution of polymer dimethyl sulfoxide. Polymers in their natural state (with some relevant exceptions) are insulating materials [2], and the modulation of their electrical conductivity, regardless of the application, requires blending with materials featuring electronic / ionic conductivity. For example fillers in the metallic state allow increased electronic conduction, and depending on their shape and aspect ratio, can create a complete network providing a preferential route for charge carriers. An example is given by silver nanoparticles / nanowires [3] that are frequently used as conductive fillers. The metallic state can be achieved to some extent also by carbon-based materials, allowing to keep a good balance towards the raw materials supply. Some examples: graphene, carbon fibres, carbon nanotubes that are compounded into a common polymer over a threshold concentration [4]. Such threshold is known as the critical concentration, above which percolation occurs (U) [5, 6, 7]. Percolation appears after a phase transition, where a dramatic change occurs at a single sharply defined parametric value as the concentration is modified continuously [8, 9]. Lowering a composite system’s percolation threshold looks to be an effective strategy to reduce the quantity of (precious) filler necessary to achieve appropriate conductivity and, as a result, avoid mechanical performance issues [10]. Attempts to employ alternative percolation models to describe conductive polymer composites have demonstrated that no single model can explain all of the different experimental results [11]. This discrepancy could be related to the fact that conductivity is highly dependent on the geometric parameters of the filler, the quality of their bonds, and the matrix-filler interaction [12, 6]. Until now, most research on the dynamic process of conductive network generation under an electric field has concentrated on composites containing conductive fillers like carbon black (CB), carbon fibres (CF), or carbon nanotubes (CNT) [13, 14]. Nevertheless, and we reach now a fundamental point about our research, there is no straightforward way to change conduction properties, once a composite material is formed and a physical form has been given. Having an easily tuneable material would enable us to create switches, memories and other sorts of devices fundamental for computing. Chemical reactions involving different oxidation states might also be exploited, triggered by high electric fields, nevertheless activation energies should be overcome and peculiar fabrication conditions be met, so that from the practical point of view, applications are not so easy [15, 16].
Nanofluids, or colloidal dispersion of nanoparticles in a liquid solvent, have received a lot of attention in recent years because of their prospective applications [17], encompassing intrinsic plasticity, self-adaptability and fault-tolerance [18, 19]. Even after long periods of storage, a stable colloid is expected to remain sediment-free. The size and density of the dispersed particles determine the settling behaviour of dispersions [20]. The liquid dispersion of nanopowders is a challenging process. The high surface area and surface energy of nanomaterials, which are responsible for their favourable effects, generate particle agglomeration, resulting in poor-quality dispersions.
Research on quantum-sized semiconductor particles has exploded in the last ten years, due to their fascinating novel optical and electrical capabilities [21]. ZnO is a semiconductor featuring a wide band gap and a large exciton binding energy of 60 meV at room temperature, being a potential choice for room-temperature UV lasers or other fascinating excited-state phenomena [22, 23]. ZnO is a versatile material with high electrical conductivity, visual transparency, photostability, and photocatalytic abilities [24, 25].
The percolation threshold for simple binary composites depends entirely on the aspect ratio of the filler, and ranges between approximately 10 % up to 70 %, as anticipated by classical percolation theory for a random system [26, 27]. After a percolation threshold is achieved, random resistor networks usually follow a power-law conductivity relationship:
where is the composite conductivity (S/cm), is the intrinsic conductivity of the filler, s is the power-law exponent (typically 1.6–2.0 in 3D), and Vc is the volume fraction of filler at the percolation threshold (near 0.15 for random fiber-based 3D systems) [28].
Von Neumann computer architecture (in which memory and the CPU are separated) only allows instructions to be carried out one at a time and sequentially, which restricts parallel operations [29]. The next generation of computing systems are anticipated to use synthetic synapses (which mimicking biological synapses) enabling information to be processed in parallel [30]. In principle, resistive switching and synaptic properties of learning colloids might be utilised to enable massively parallel computing [31].
The aim of the present study is to construct highly mobile ion-conductive pathways using ZnO nanoparticles in the DMSO solution. The free migration of ions is expected to provide high ionic conductivity. We study how, having a spherical symmetry filler and a 3D composite fluid, a tuneable percolation threshold can be achieved with low concentrations.
2 Methods
ZnO nanoparticles and DMSO were purchased from US research nanomaterials, Sodium Dodecyl Sulphate (SDS) and Sodium Hydroxide (NaOH) were purchased from Merck. De-Ionised Water (DIW) were prepared in the lab with Millipore de-ionised water generator device, model Essential, rated 15 Mohm cm.
Surfactant solution with a concentration of 0.22 wt% was prepared by adding SDS in DIW and stirred to get a homogeneous solution. 1 mg ZnO nanoparticles were added to DMSO with continuous stirring. Then 2 ml of SDS solution and 1 ml NaOH 10M added to the mixture under stirring. The concentration of resulting dispersion was maintained at 0.11 mg/ml. The resulted suspension was placed in an ultrasonic bath for 30 minutes. Then stirring process was continued for a few more hours to get a uniform dispersion of ZnO [20].
All electrical measurements were made with Fluke 88464A and Keithley 2400. Field emission scanning Electron Microscopy (FEI Quanta 650 FESEM) was also used to characterize the nanoparticle suspensions. The accelerating voltage was set to 10 kV in this study, and the working distance was set to around 5 mm. The images’ contrast and brightness were optimised so that particles could be easily distinguished from the background. Ultraviolet-visible (Uv-Vis.) spectrometer (Perkin Elmer Lambda XLS) was used to measure sample absorbance at room temperature.
3 Results and Discussions
3.1 Suspension structure
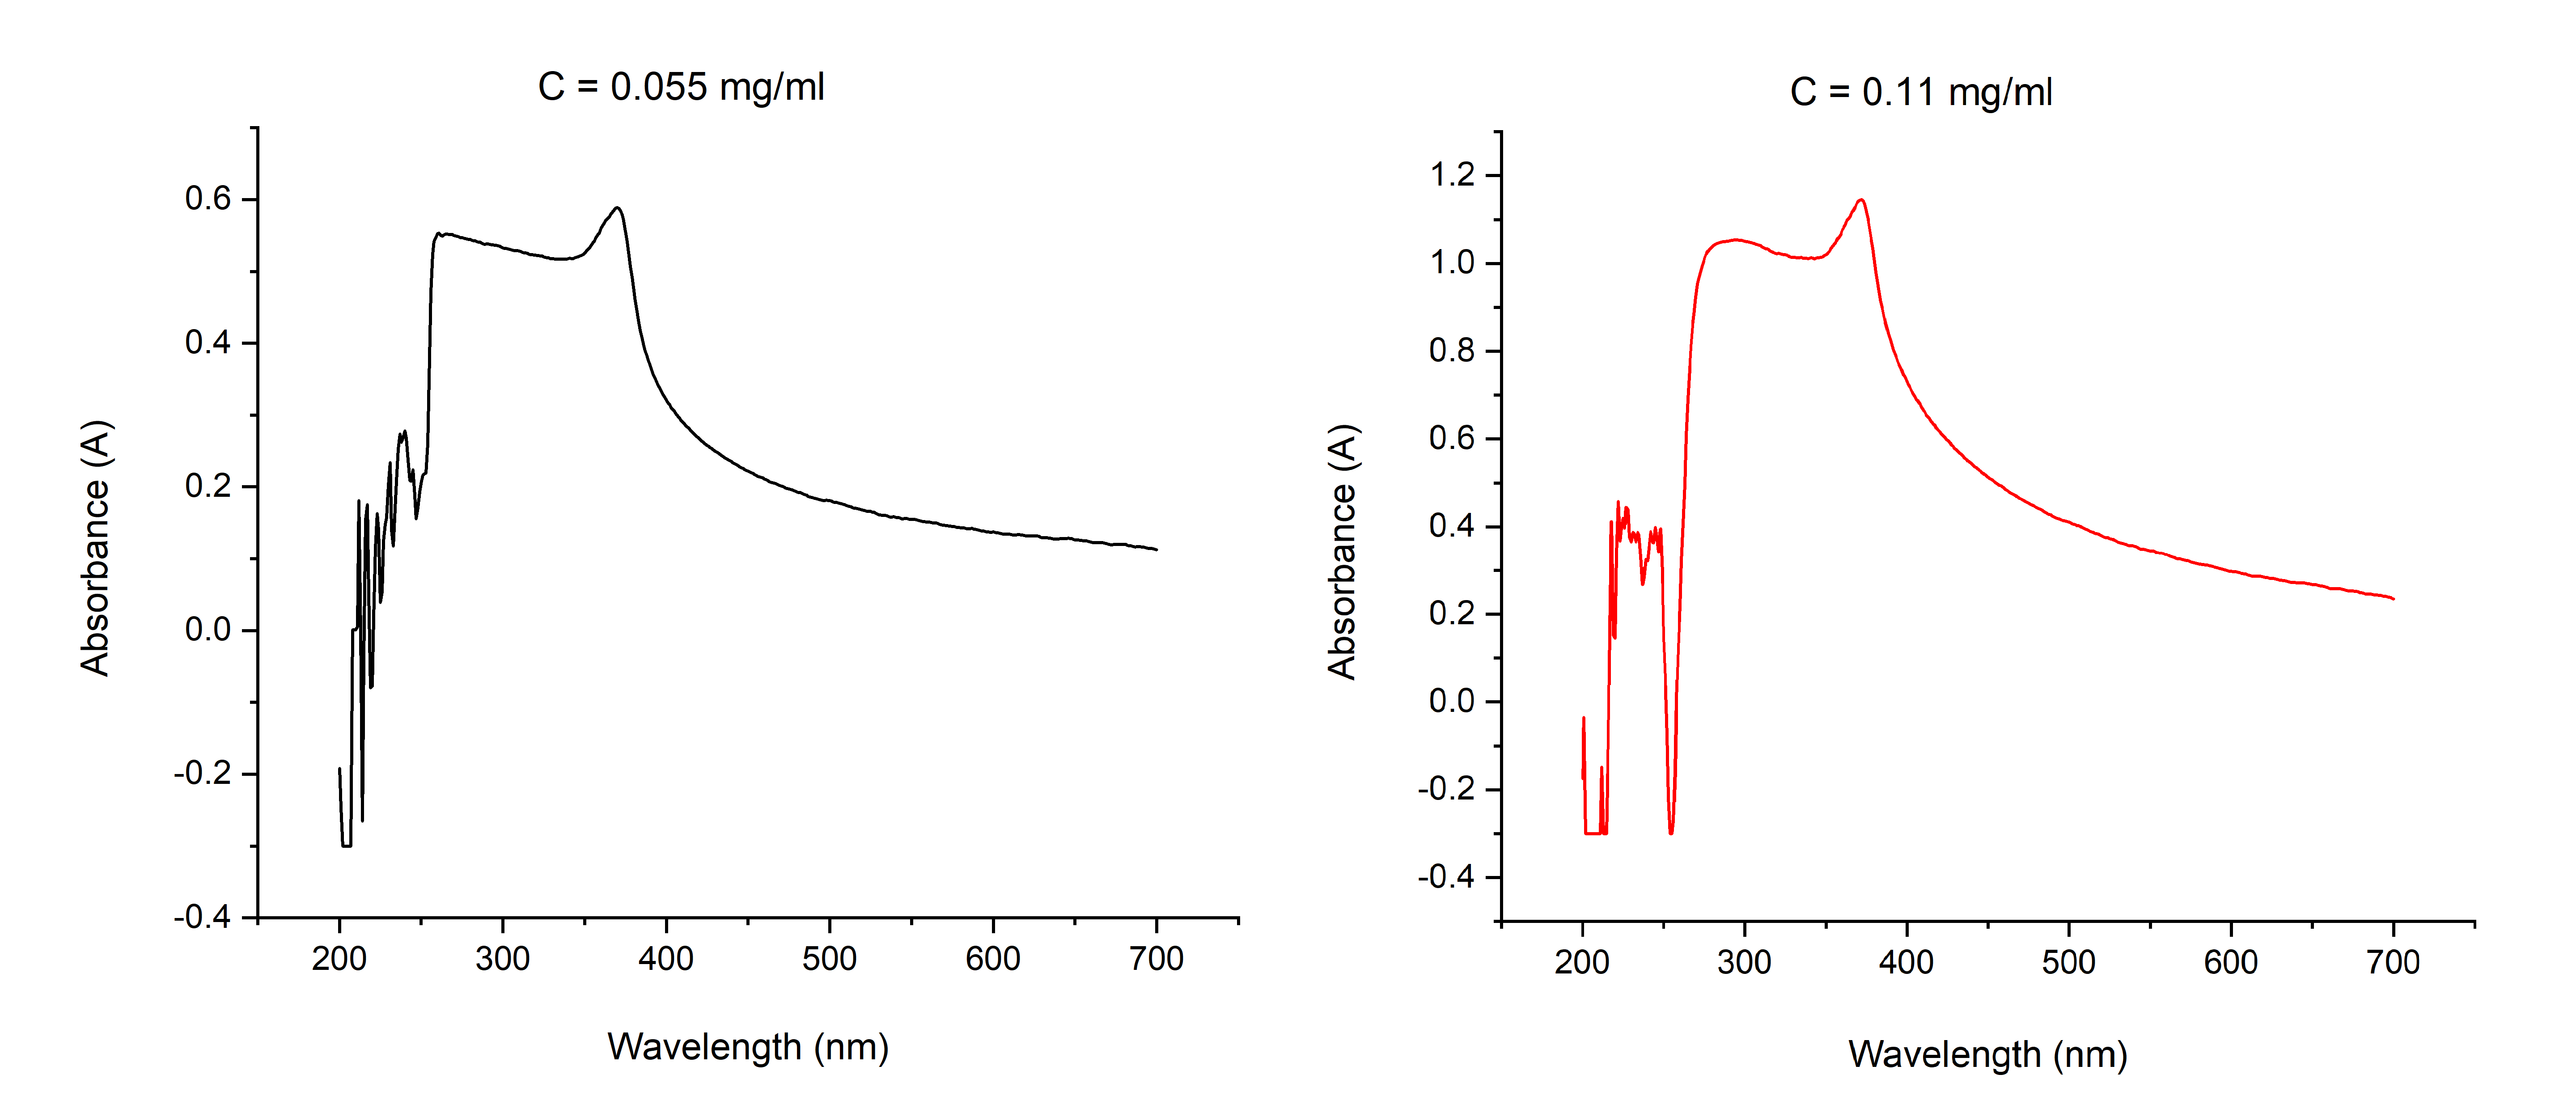
The UV–visible absorption spectrum of ZnO colloids, with different concentration, at room temperature is recorded in the wavelength range of 200–700 nm. Fig. 1 depicted resulted plots of UV–visible absorption spectrum. The spectra have peaks at 370 nm (colloid with concentration of 0.055 mg/ml) and 372 nm (colloid with concentration of 0.11 mg/ml). These absorption peaks at 370-372 nm are the characteristic peak for hexagonal ZnO nanoparticles [32]. In comparison to bulk ZnO (370 nm), there is a good agreement with previous reports [33, 34]. Calculation of the optical band gap was based on the below equation:
Where is the optical band gap, h is the Planck’s constant, c is the speed of light,and is the wavelength of maximum absorption. Here Optical band gap was calculated as 3.35 eV which matches well with previous reports [33, 35, 36].
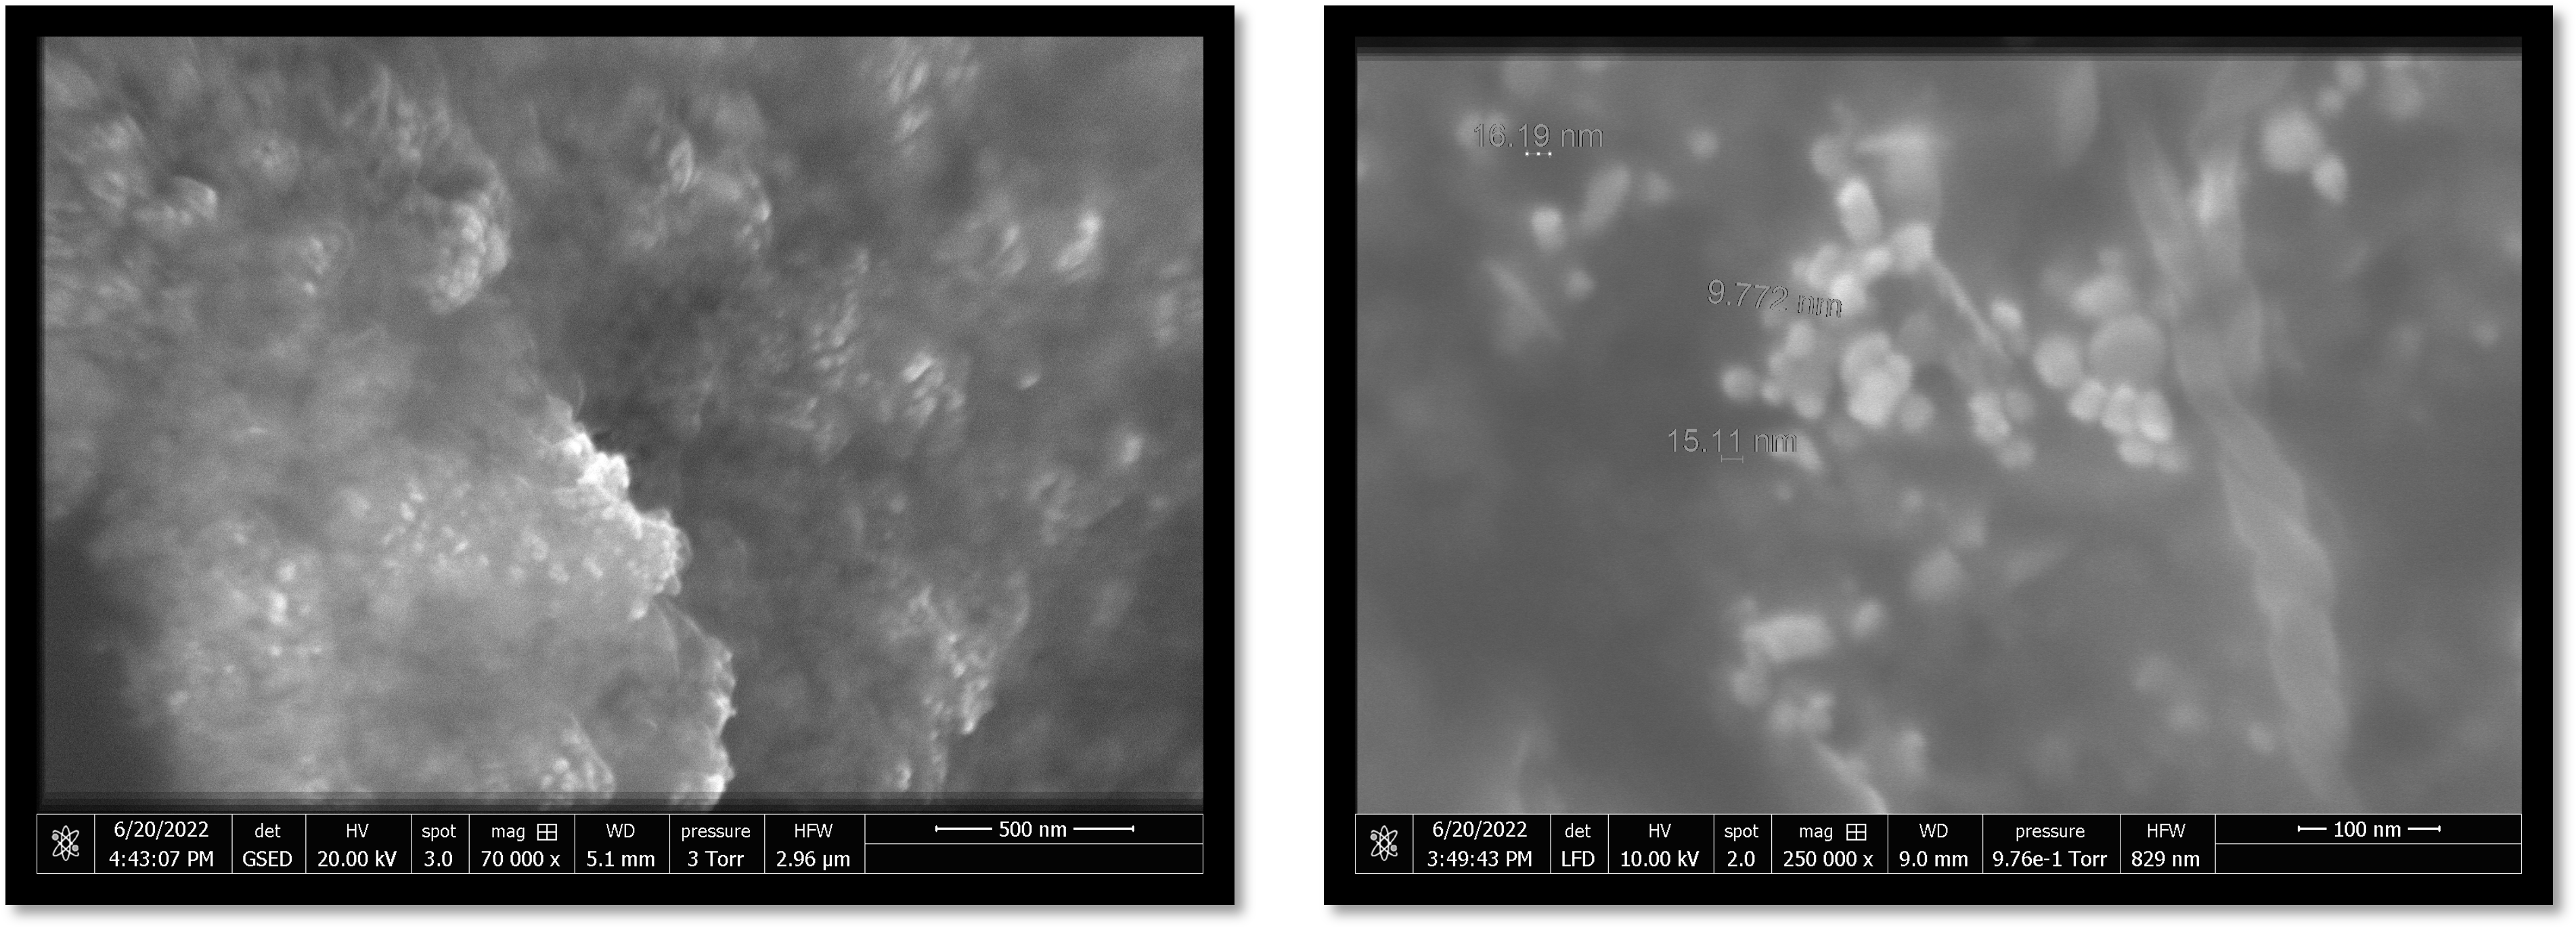
In order to study particles morphology and size by FESEM technique, a thin layer of ZnO colloid were prepared by drop casting a drop of ZnO particle suspension (0.11 mg/ml) on a Copper foil with a thickness of 100 m at room temperature.
FESEM results in Fig. 2 depict particle agglomeration during sample preparation.As a result of the surface tension of the solvent during evaporation, FESEM observation rarely reveals separated spheres, and most of the ZnO spheres are multilayered. Indeed, increased liquid surface tension would draw the nanoparticles closer together, causing them to re-aggregate during the drying process [37].
3.2 Suspension Conductivity
To study a formation of conductive network of nanoparticles we carried out DC stimulation of the suspension mixture with different parameters of the stimulation.
In the first step, DC stimulation versus time at the rate of 10 mV/s from , with Keithley, have been applied to the sample and current was measured. Results are shown in Figs. (3,a). The increase in voltage, resulting in a decrease in resistance. So the first step experiment is: 1) apply voltage growing from 0 to 40, 2) measure resistance, 3) Repeat.
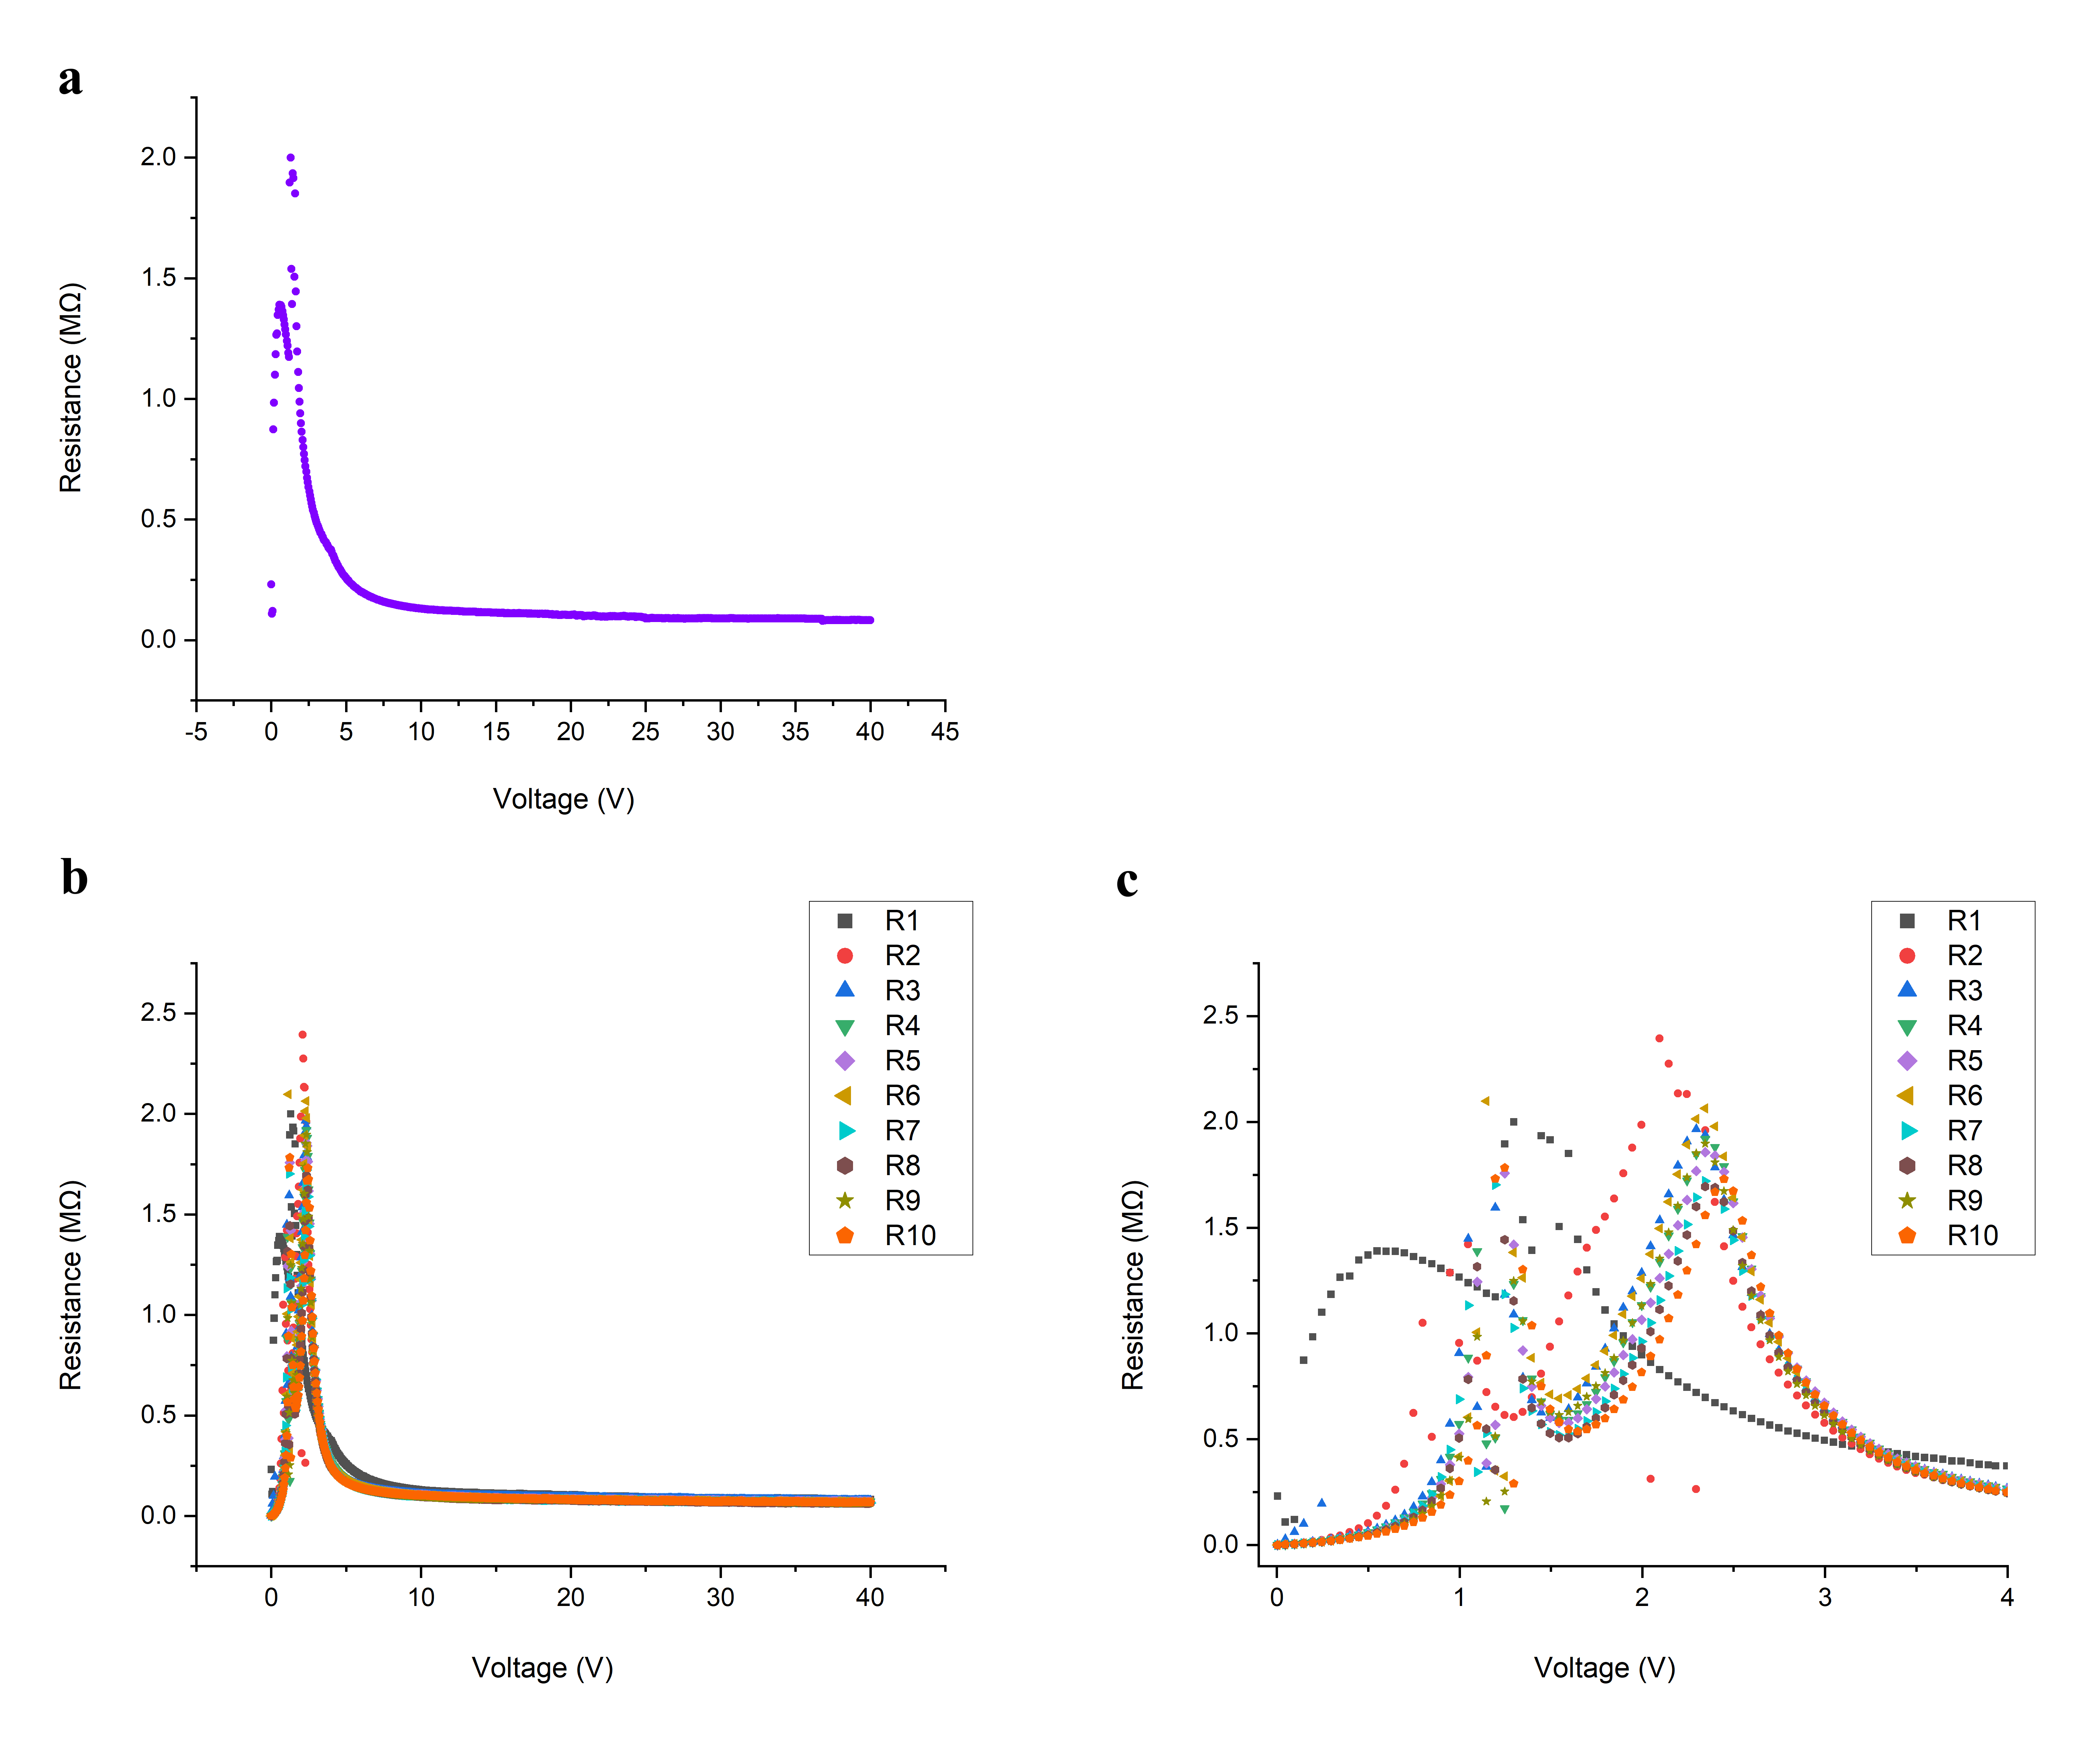
To check the repeatability of this result, DC stimulation has been applied from , with Keithley, to the sample for 10 times and then current was measured. All data are integrated in the Fig. 3(b,c). Figure (3b) shows the repeated measurement resistance of sample with stimulation till 40 V and figure (3c) shows the same plot with zoom on the first area of the curve. Just the first stimulation has a little different resistance curve in comparison with the other 9 stimulations, as it often occurs in similar systems such as resistive switching devices. An interesting feature is the presence of maximum resistance, found in the range of 2 to 2.5 V and then it drops down. As bubbling was observed during apply voltage, probably from 2 V till 3 V, bubbling accrues and misses the order of nanoparticles so R increases. Perhaps after 3 V, the voltage is enough strong to overcome bubbling turbulence and reorder nanoparticles again so R decreases again.
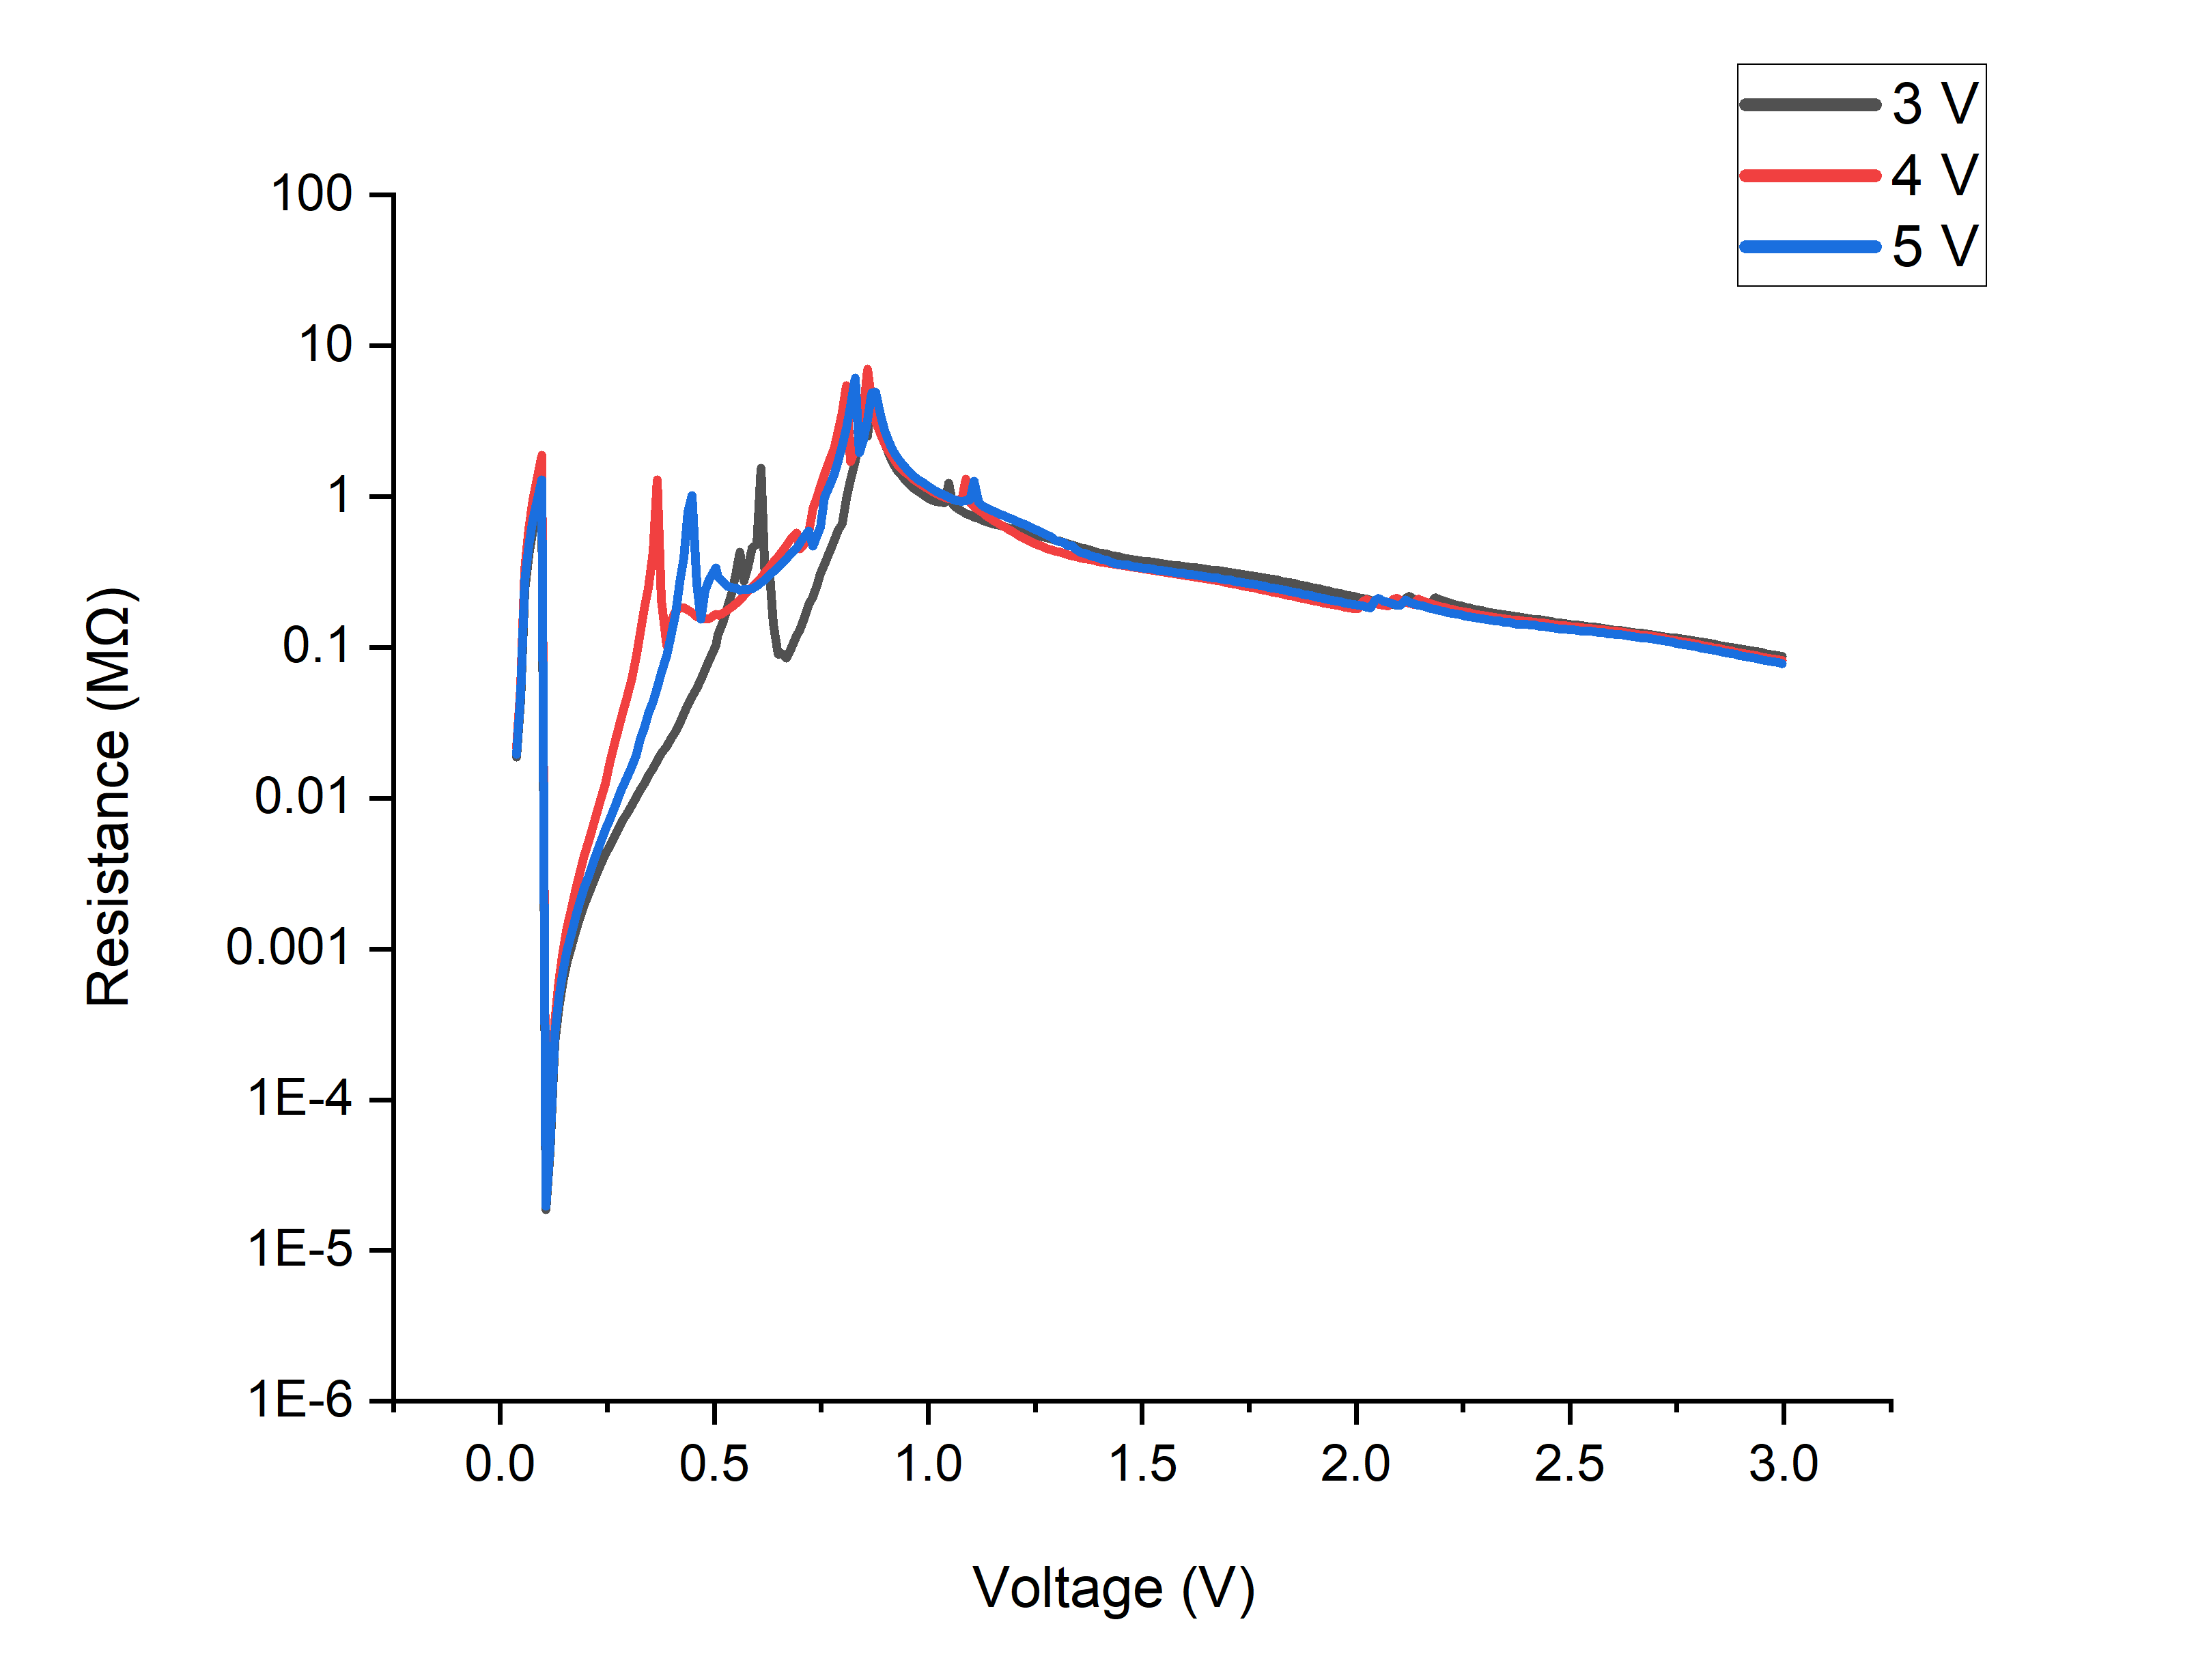
In the second step, the minimum stimulation voltage for a resistance to drop were investigated. In this regard, 5 V, 4 V and 3 V DC stimulation were applied to the sample and then the resistance was measured. Figs. 4 indicates the the resistance change during the voltage rising. In all three graphs, the resistance starts to drop down at a voltage of about 0.7V and it decreases from to .
For conductive particles filled polymer composites, the percolation hypothesis is commonly employed to describe the sharp change in electrical resistivity as a function of filler content [8]. However, in our case, the filler content has been fixed. To distinguish the link between electrical resistivity and stimulation voltage and during of stimulation, from the filler concentration dependence of percolation, we refer to the stimulation dependence of percolation process as ‘percolation time’. To discover the relation between duration of stimulation, critical voltage (a value of voltage at which the resistance starts to decrease) and resistance dropping point, the sample has been stimulated with several times and the resistance was measured in each step. All data are summarised in Tab. 1.
| Each stimulus duration (ms) | Time of dropping R (s) | Stimulation length (s) | Highest R M() | Critical voltage (V) | Critical resistance (M) |
| 1 | 1 | 10 | 1.21 | 1.55 | 1.21 |
| 10 | 5 | 13 | 1.38 | 1.45 | 1.38 |
| 100 | 8 | 22 | 1.37 | 1.40 | 1.37 |
| 1000 | 22 | 111 | 1.76 | 0.95 | 1.76 |
| 2000 | 29 | 211 | 2.83 | 0.65 | 2.83 |
| 3000 | 49 | 312 | 3.96 | 0.75 | 3.96 |
| 4000 | 63 | 412 | 3.18 | 0.75 | 3.18 |
Fig. (5-a) shows the relation between critical voltage with length of stimulation. Critical voltage decrease with increase in stimulation length. The equation and parameters of fitting its curve are summarized in the table 2.
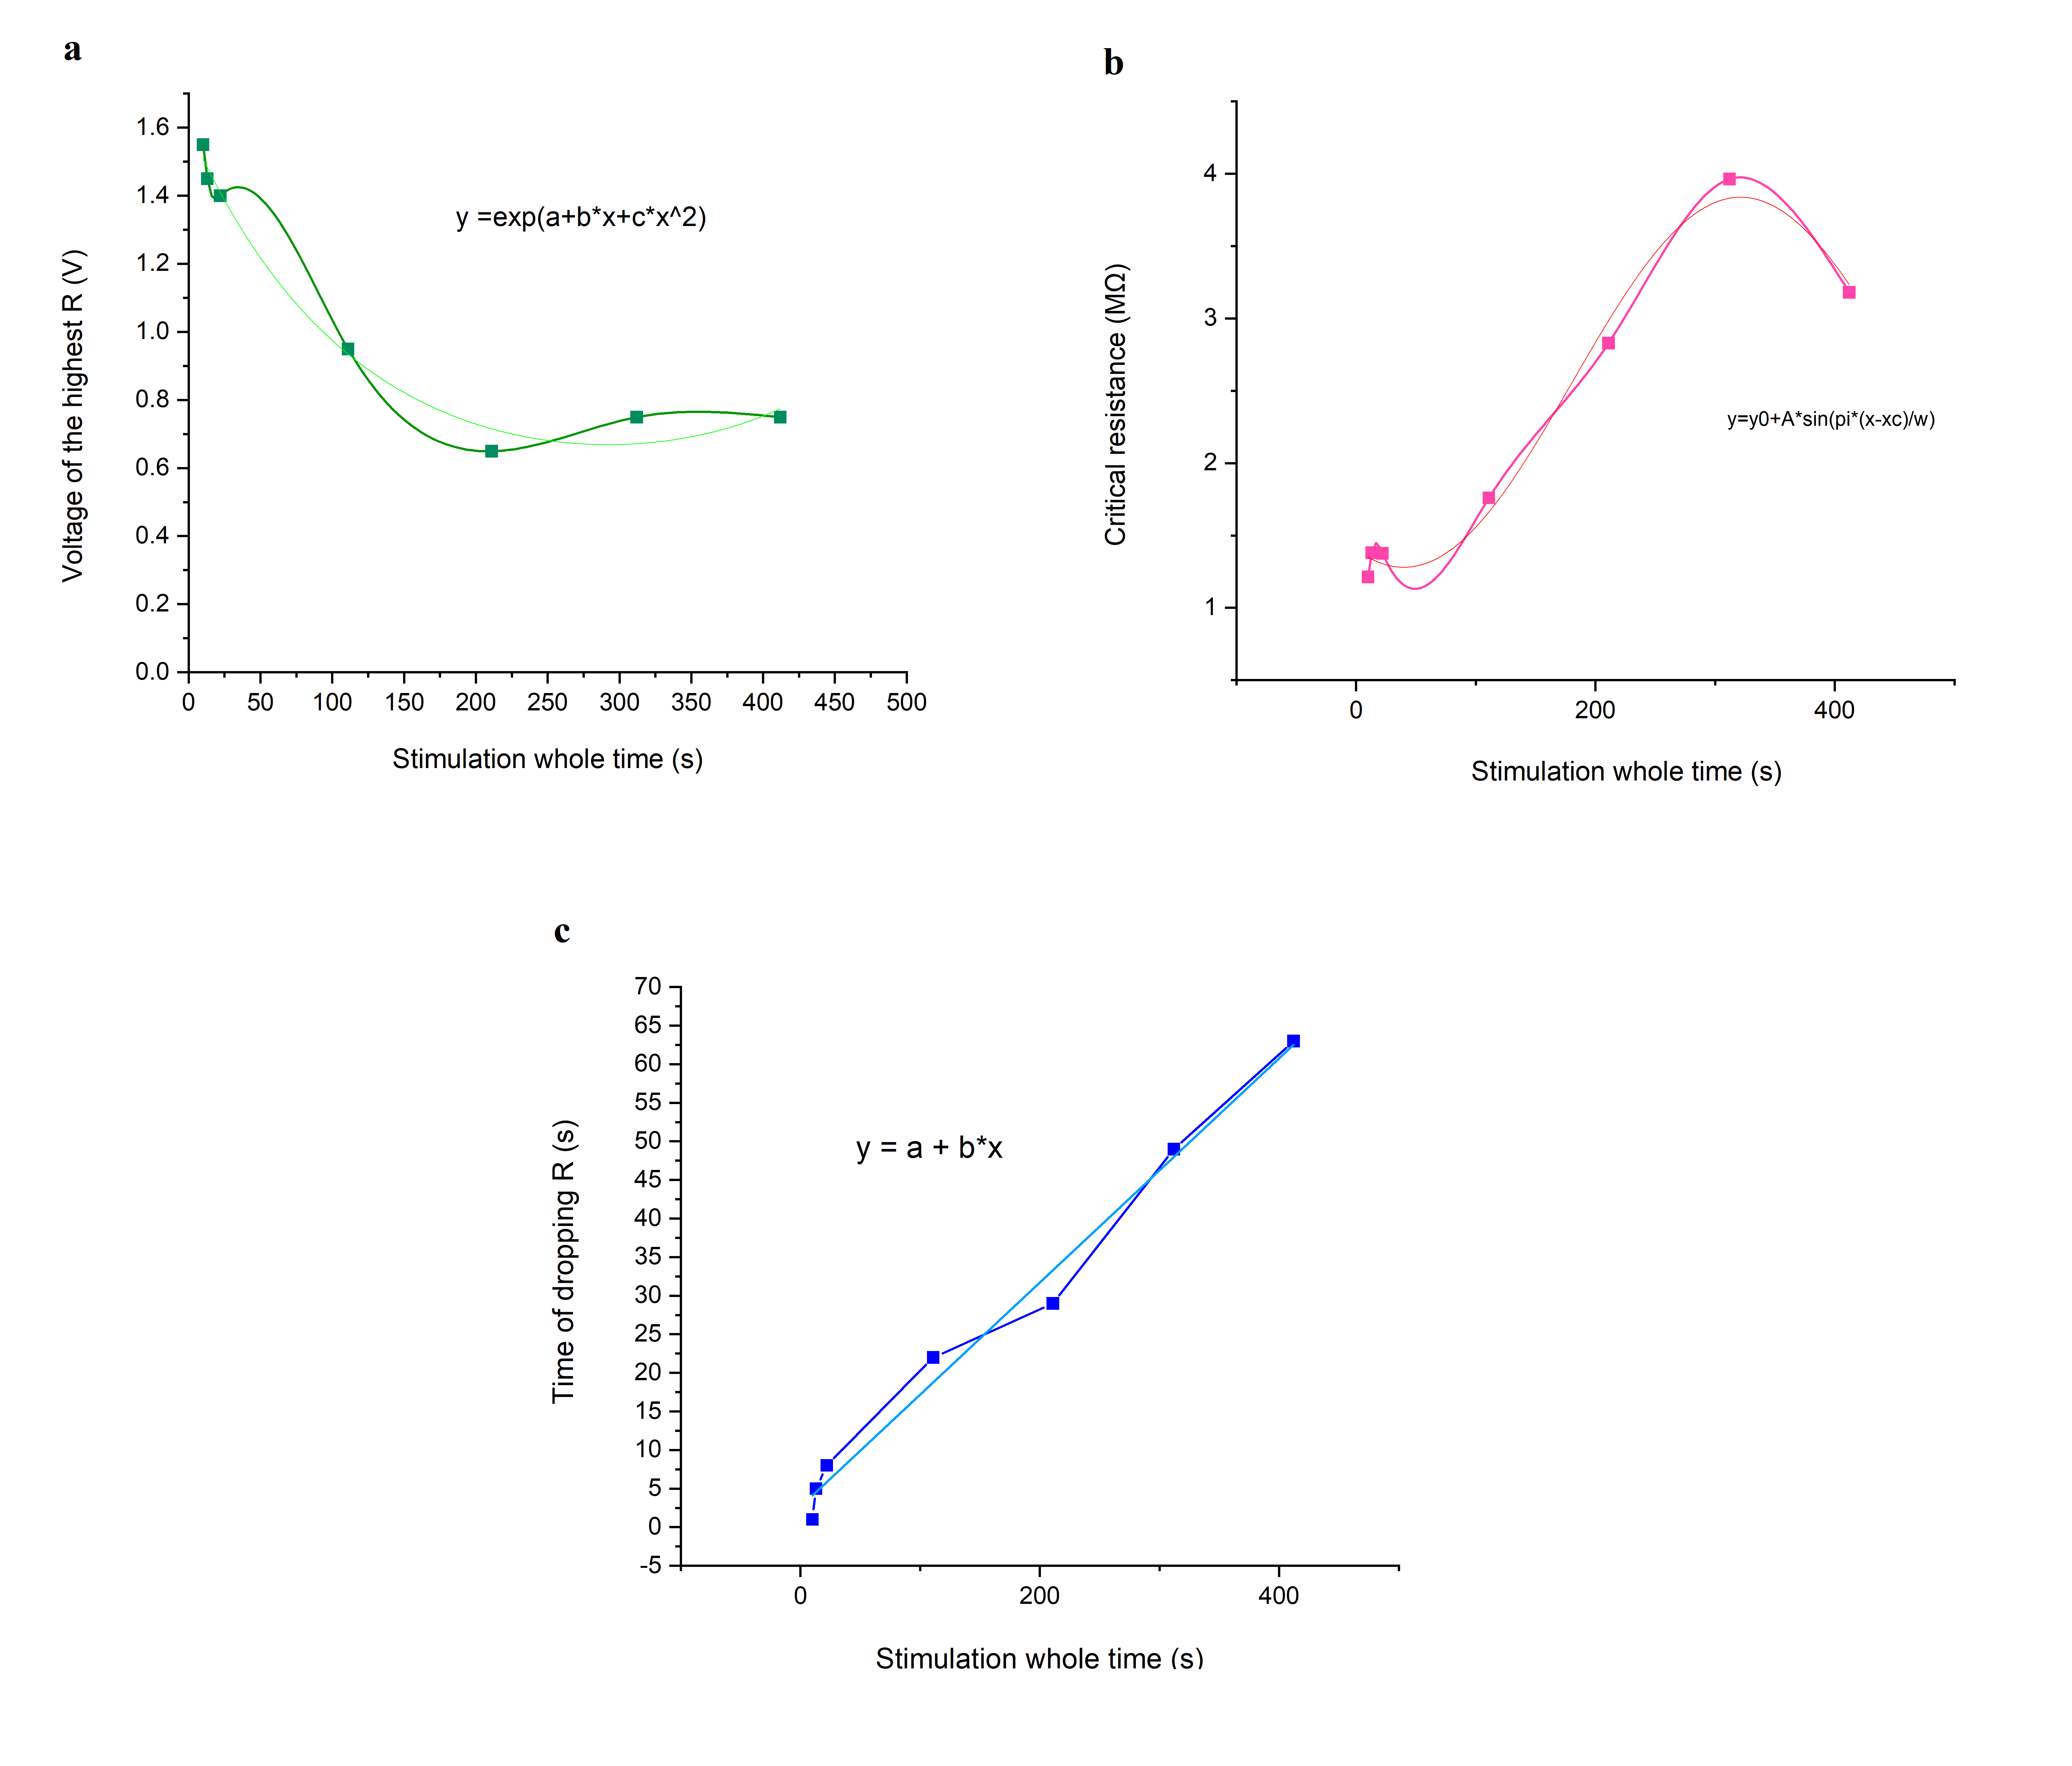
| Equation | parameter, | parameter, | parameter, c | R-Square (COD) |
|---|---|---|---|---|
| 0.470 ± 0.028 | -0.006 ± 6.61E-4 | 1.02E-5 ± 1.71E-6 | 0.98 |
| Equation | parameter, y | parameter, xc | parameter, W | parameter, A | R-Square (COD) |
|---|---|---|---|---|---|
| y=y+A sin(pi(x-xc)/w) | 2.56 ± 0.068 | 180.51 ± 8.33 | 281.40 ± 18.14 | 1.28 ± 0.092 | 0.99 |
Figure 5b shows the relation between critical resistance with length of stimulation. Critical resistance rises with increase in stimulation length till reaches the amount of 3.96 M and then with more enhancement in stimulation length, it falls again. The equation and parameters of fitting this curve are summarized in the Tab. 3.
| Equation | Intercept, a | slope, b | R-Square (COD) |
|---|---|---|---|
| y = a + bx | 2.64 ± 1.64 | 0.14 ± 0.008 | 0.99 |
The filled conductive colloid are discovered to be thermodynamically non-equilibrium systems, in which the conductive network generation is time dependent, leading to the development of a concept known as dynamic percolation [8]. In this research, the time of dropping resistance depends on the length of stimulation, linearly. This relation is shown in Fig. (5-c) and the fitting parameters are presented in Tab. 4.
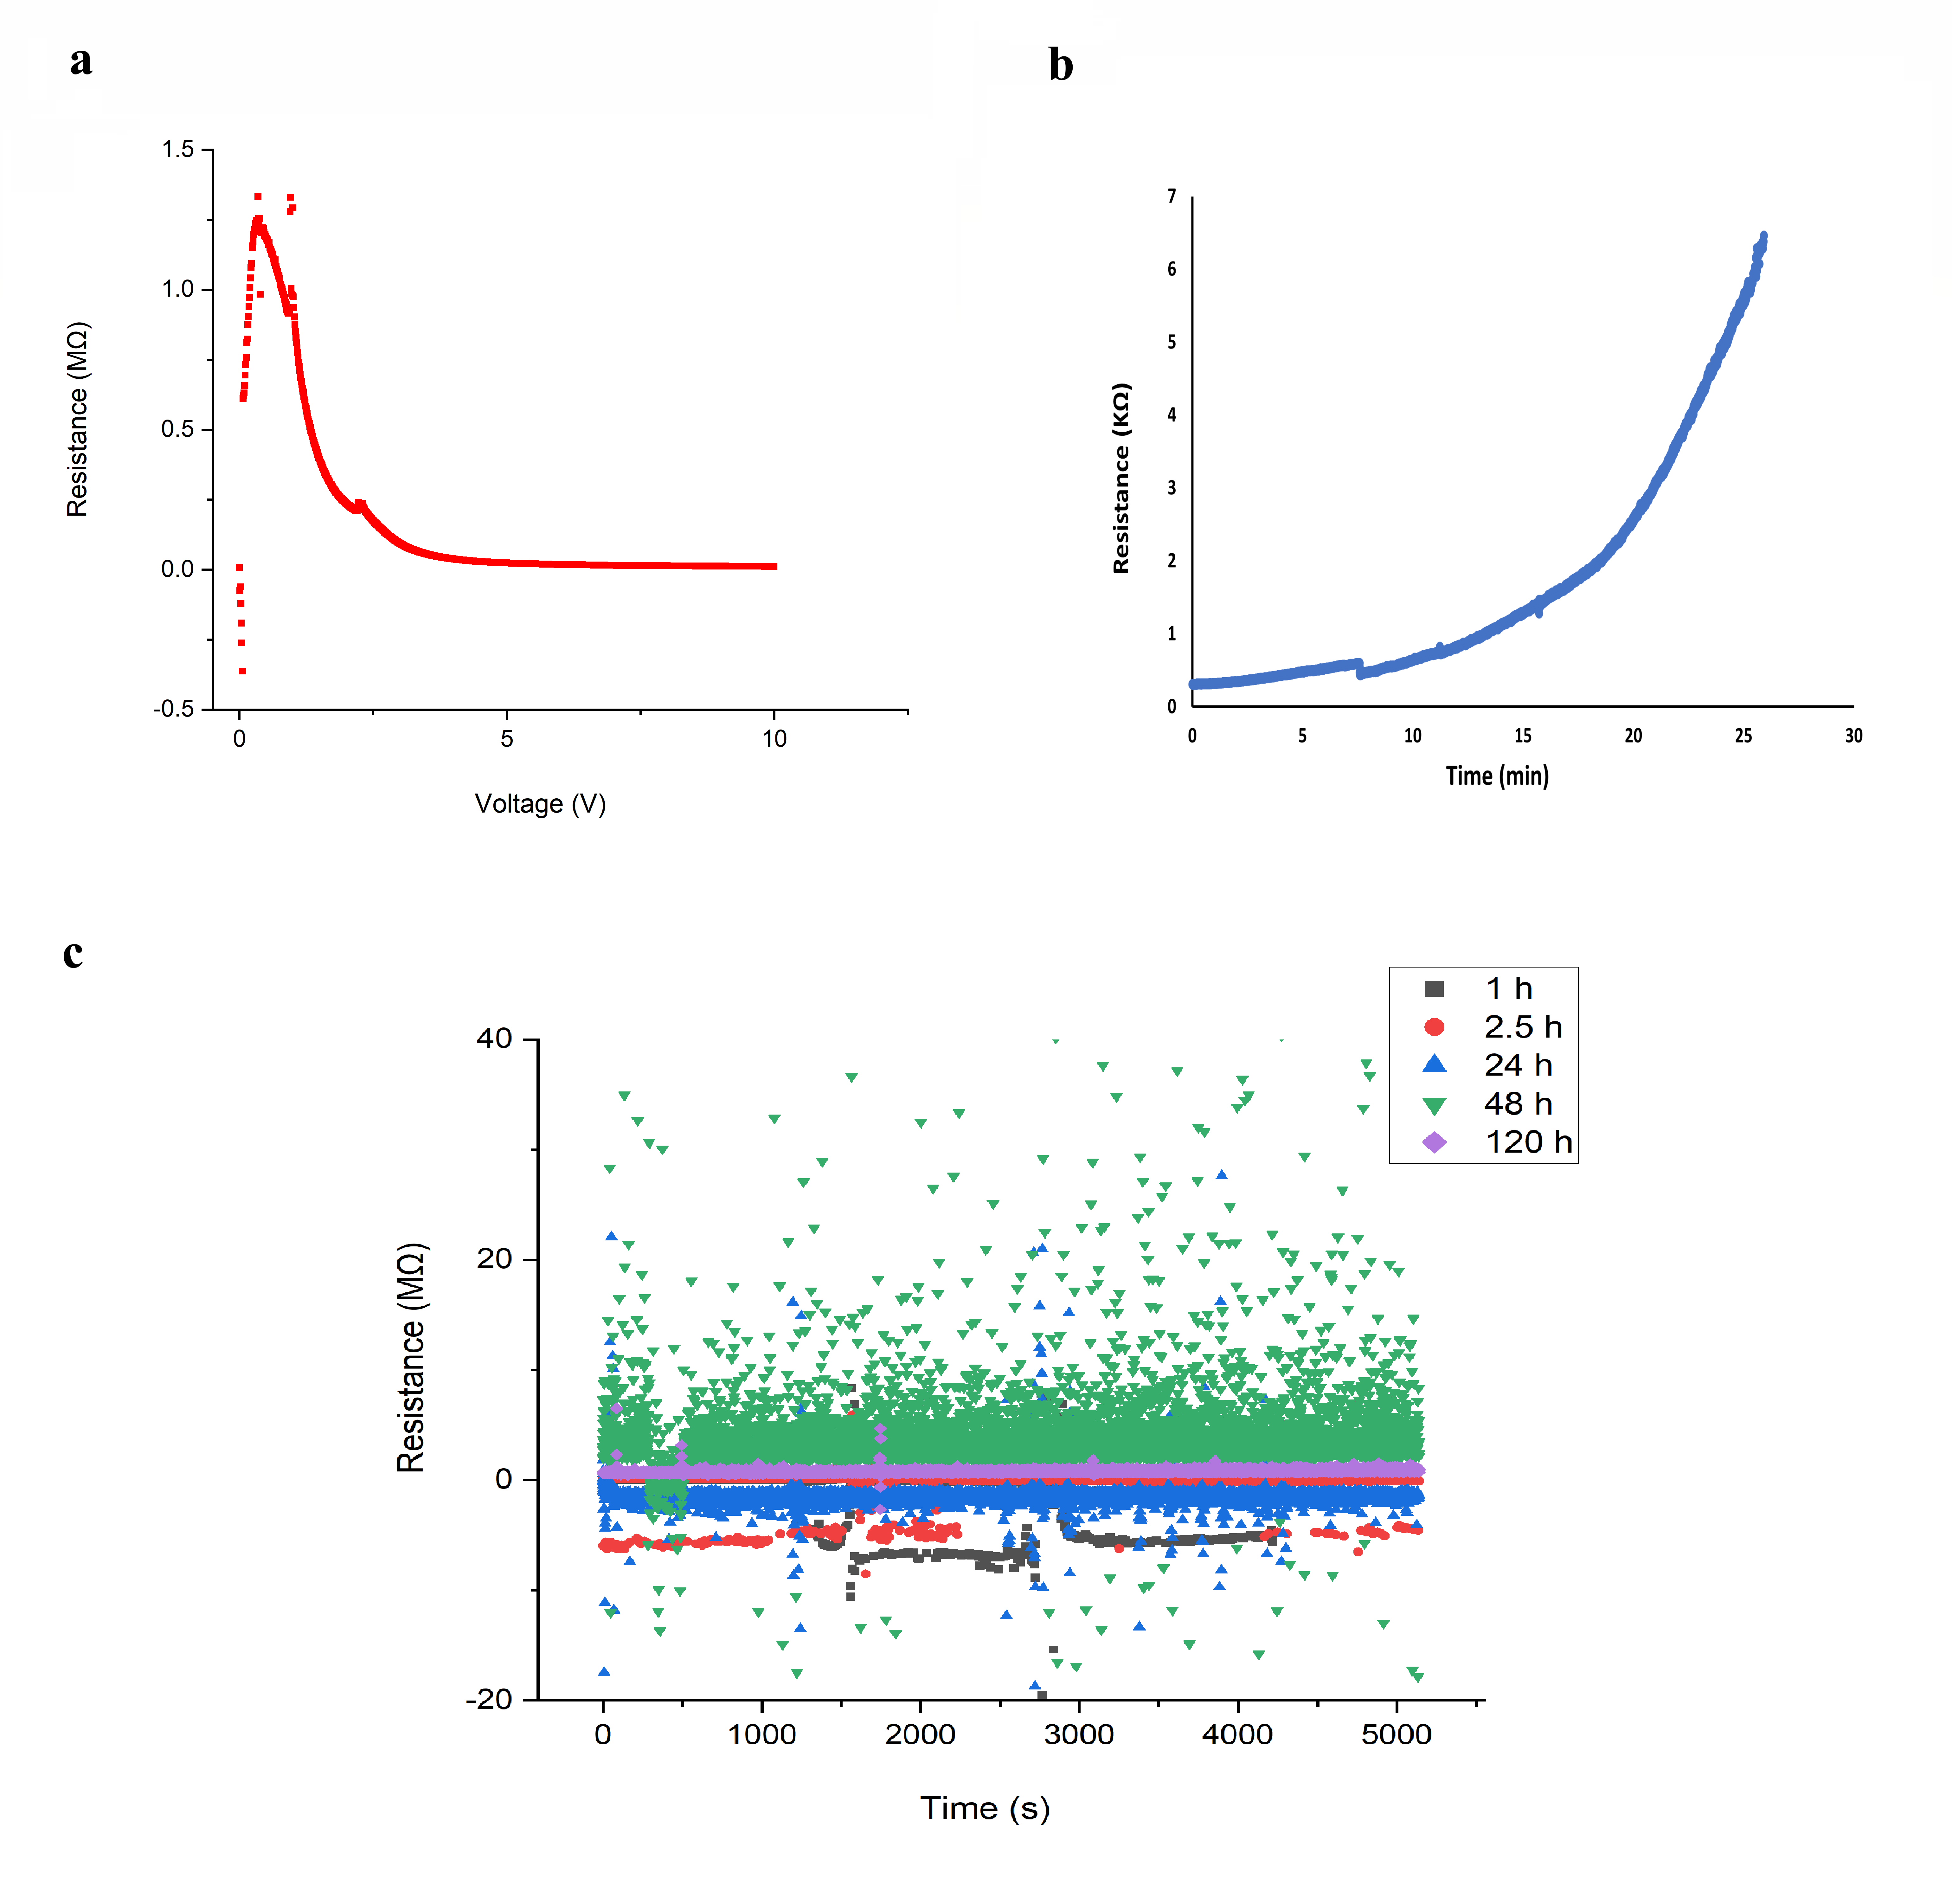
Electrical resistance before and after stimulation were compared to quantify both the quality and duration of the memory. To check the memorisation process, the resistance behaviour before and after stimulation, and find for how long does the stimulation effects last, some experiments were implemented. Firstly, the resistance of sample was measured without any stimulation other than the applied by the measuring device, and then after applying DC stimulation, from , the resistance was measured again continuously (Fig. 6a), to find the stability of the dropped resistance. Secondly, the stimulated sample was placed without any moving and any further stimulation. Then its resistance was measured just after stopping stimulation (Fig. 6b), after 1h, 2.5h, 24h, 48h and 120h. All results are shown in the Fig. (6c).
Resistance was about 1.3 M before applying any stimulation, during applying 10 V DC stimulation, resistance dropped down to under (Fig. 6a). After stopping stimulation, the resistance started to rise from under to by spending 30 minutes (Fig. 6b). In one hour, the resistance increased to , in 2.5 hours to , in 24 hours to , and in 120 hours to (Fig. 6c). As it can be seen, the resistance increases slowly during 120 hours after stopping stimulation indicating memory existence in our colloid.
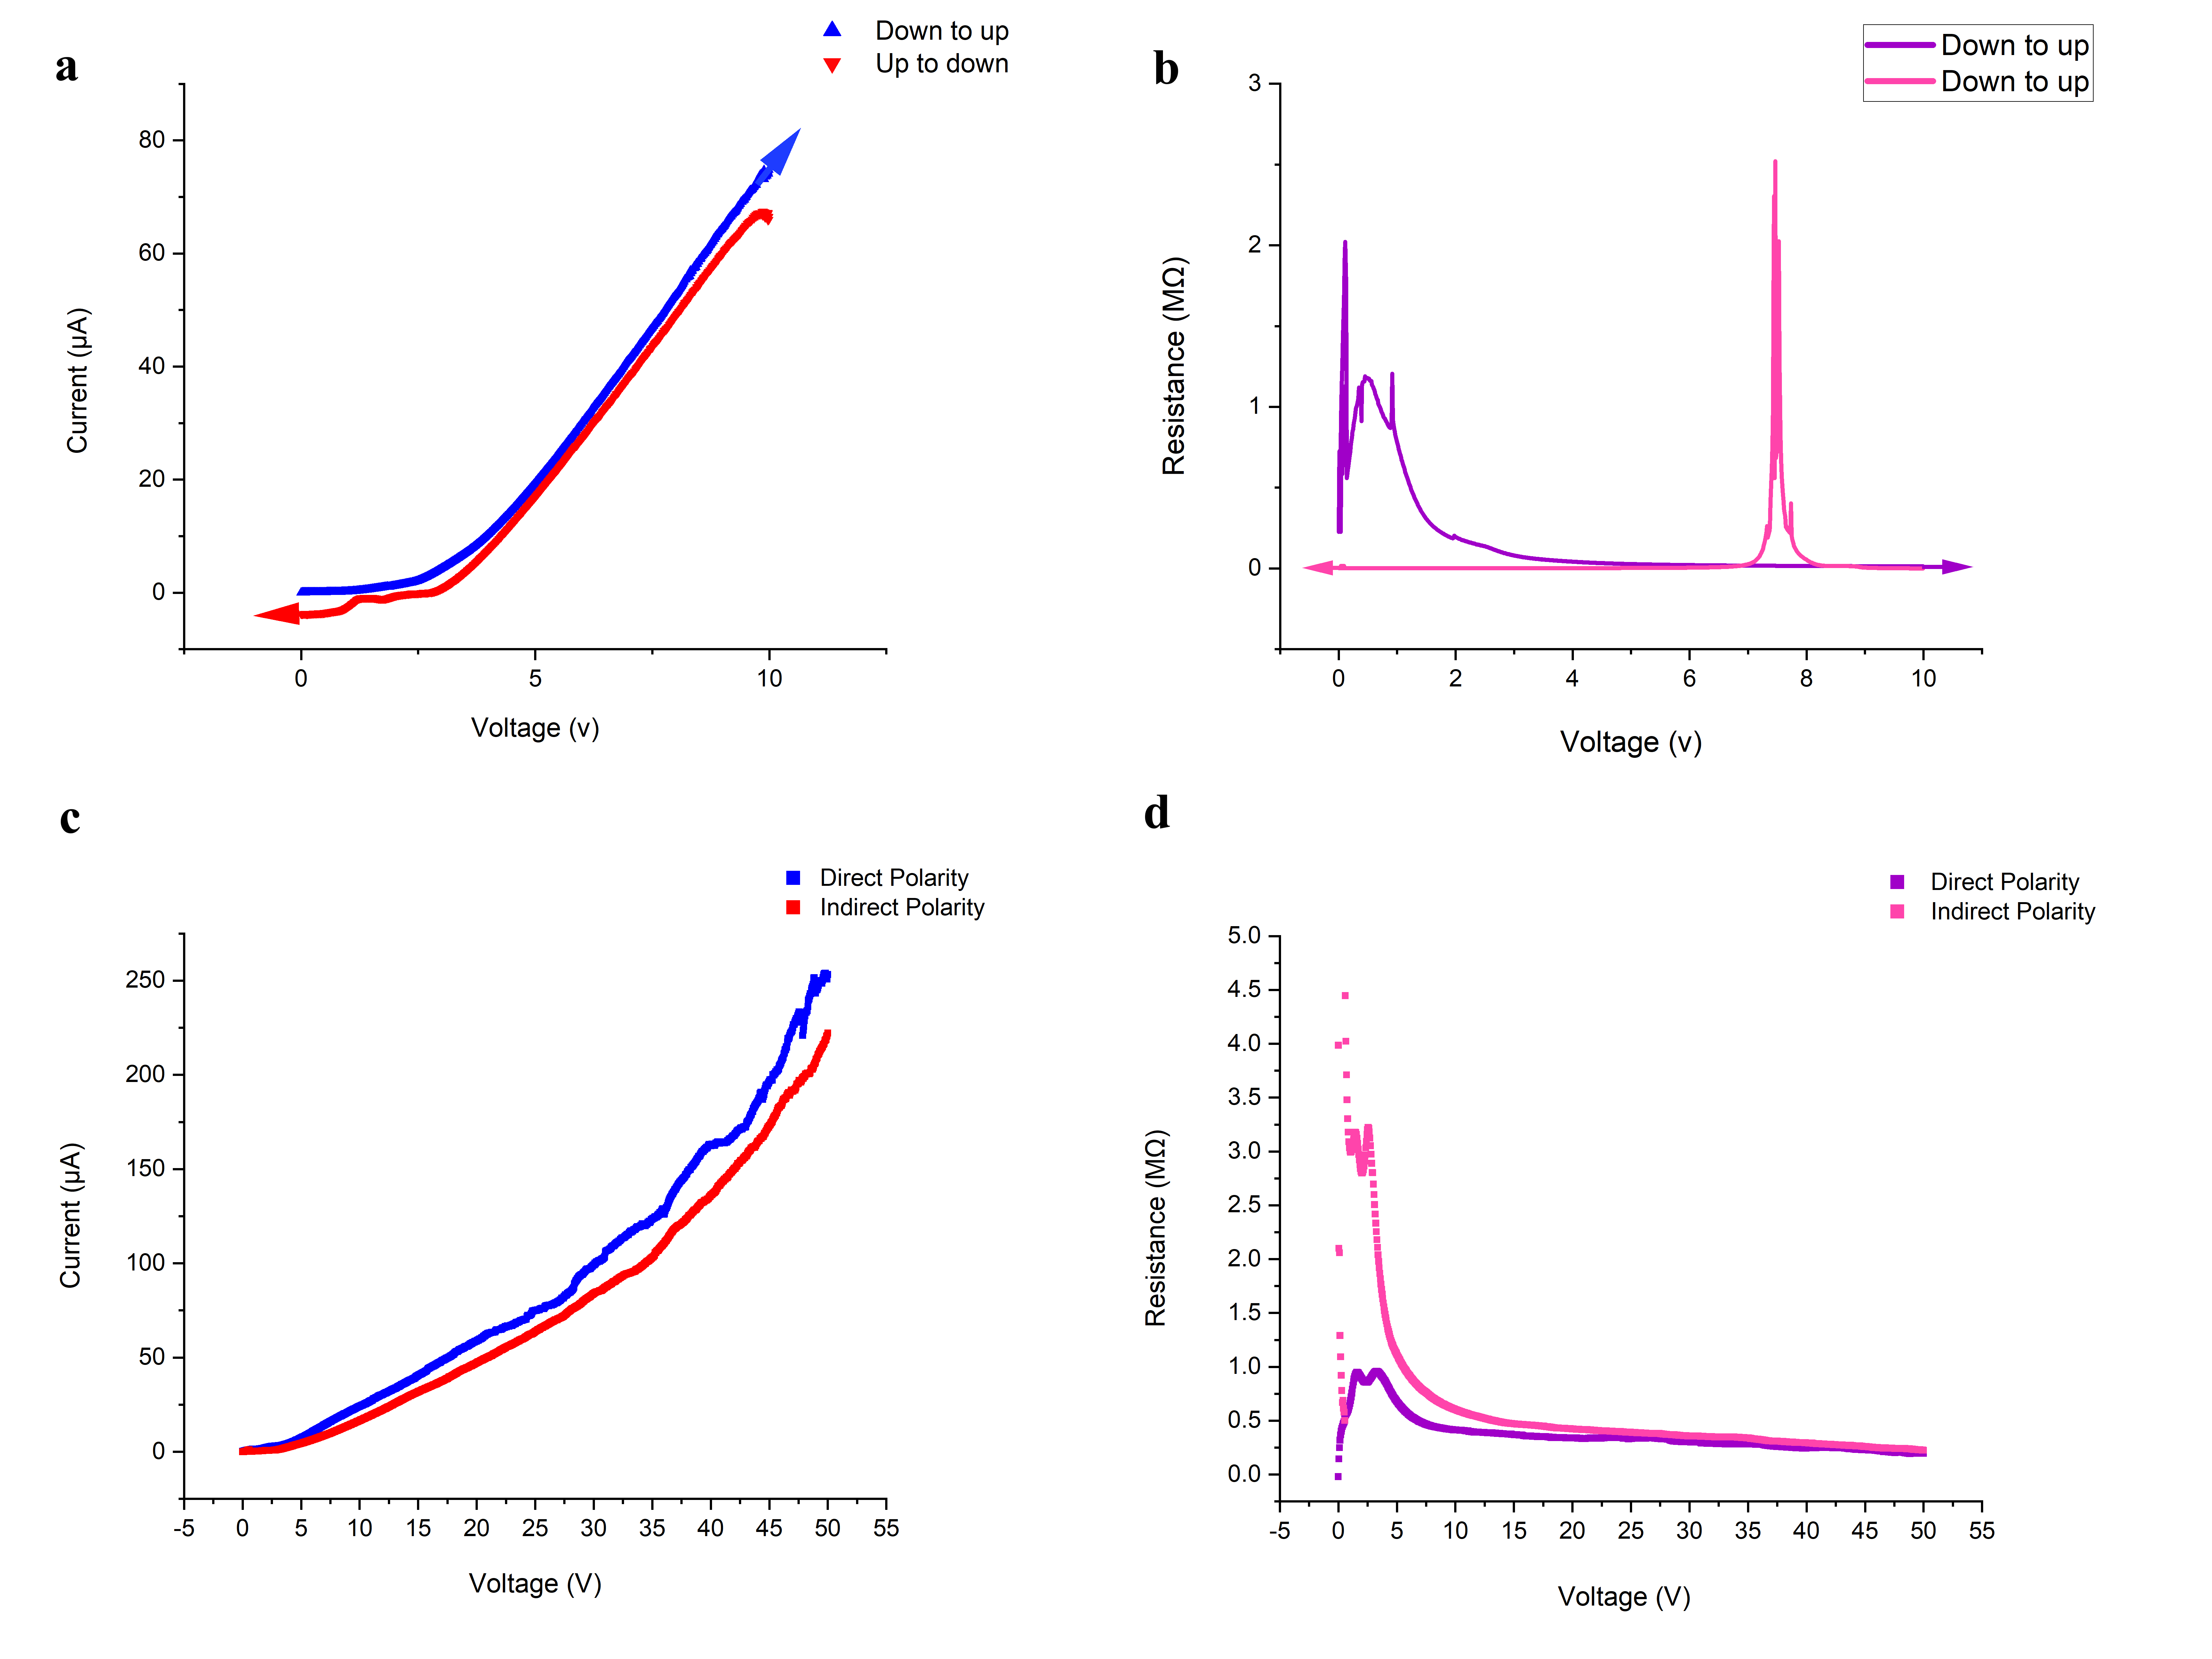
In order to study the reverse cycle, the switching of the resistance back from low R to high R by reversing voltage were investigated. In the first stage, DC stimulation from , were applied with Keithley to the sample and then the resistance was measured. In the next stage, this process was repeated but in reverse cycle (applying DC stimulation from ). Figures 7a,b indicate the current diagram and the resistance diagram of this test, respectively.
In the next step, the polarity of electrodes was changed. The sample have been stimulated from with direct polarity, first. Then the cables on Keithley ports were swapped (without moving electrodes) and sample have been stimulated again from but with indirect polarity. The resulted current and resistance diagrams are shown in the Fig. 7(c,d), respectively. The hysteresis loop of current and voltage shown in Fig. 7c indicates history is more prominent in voltage and current approach zero.
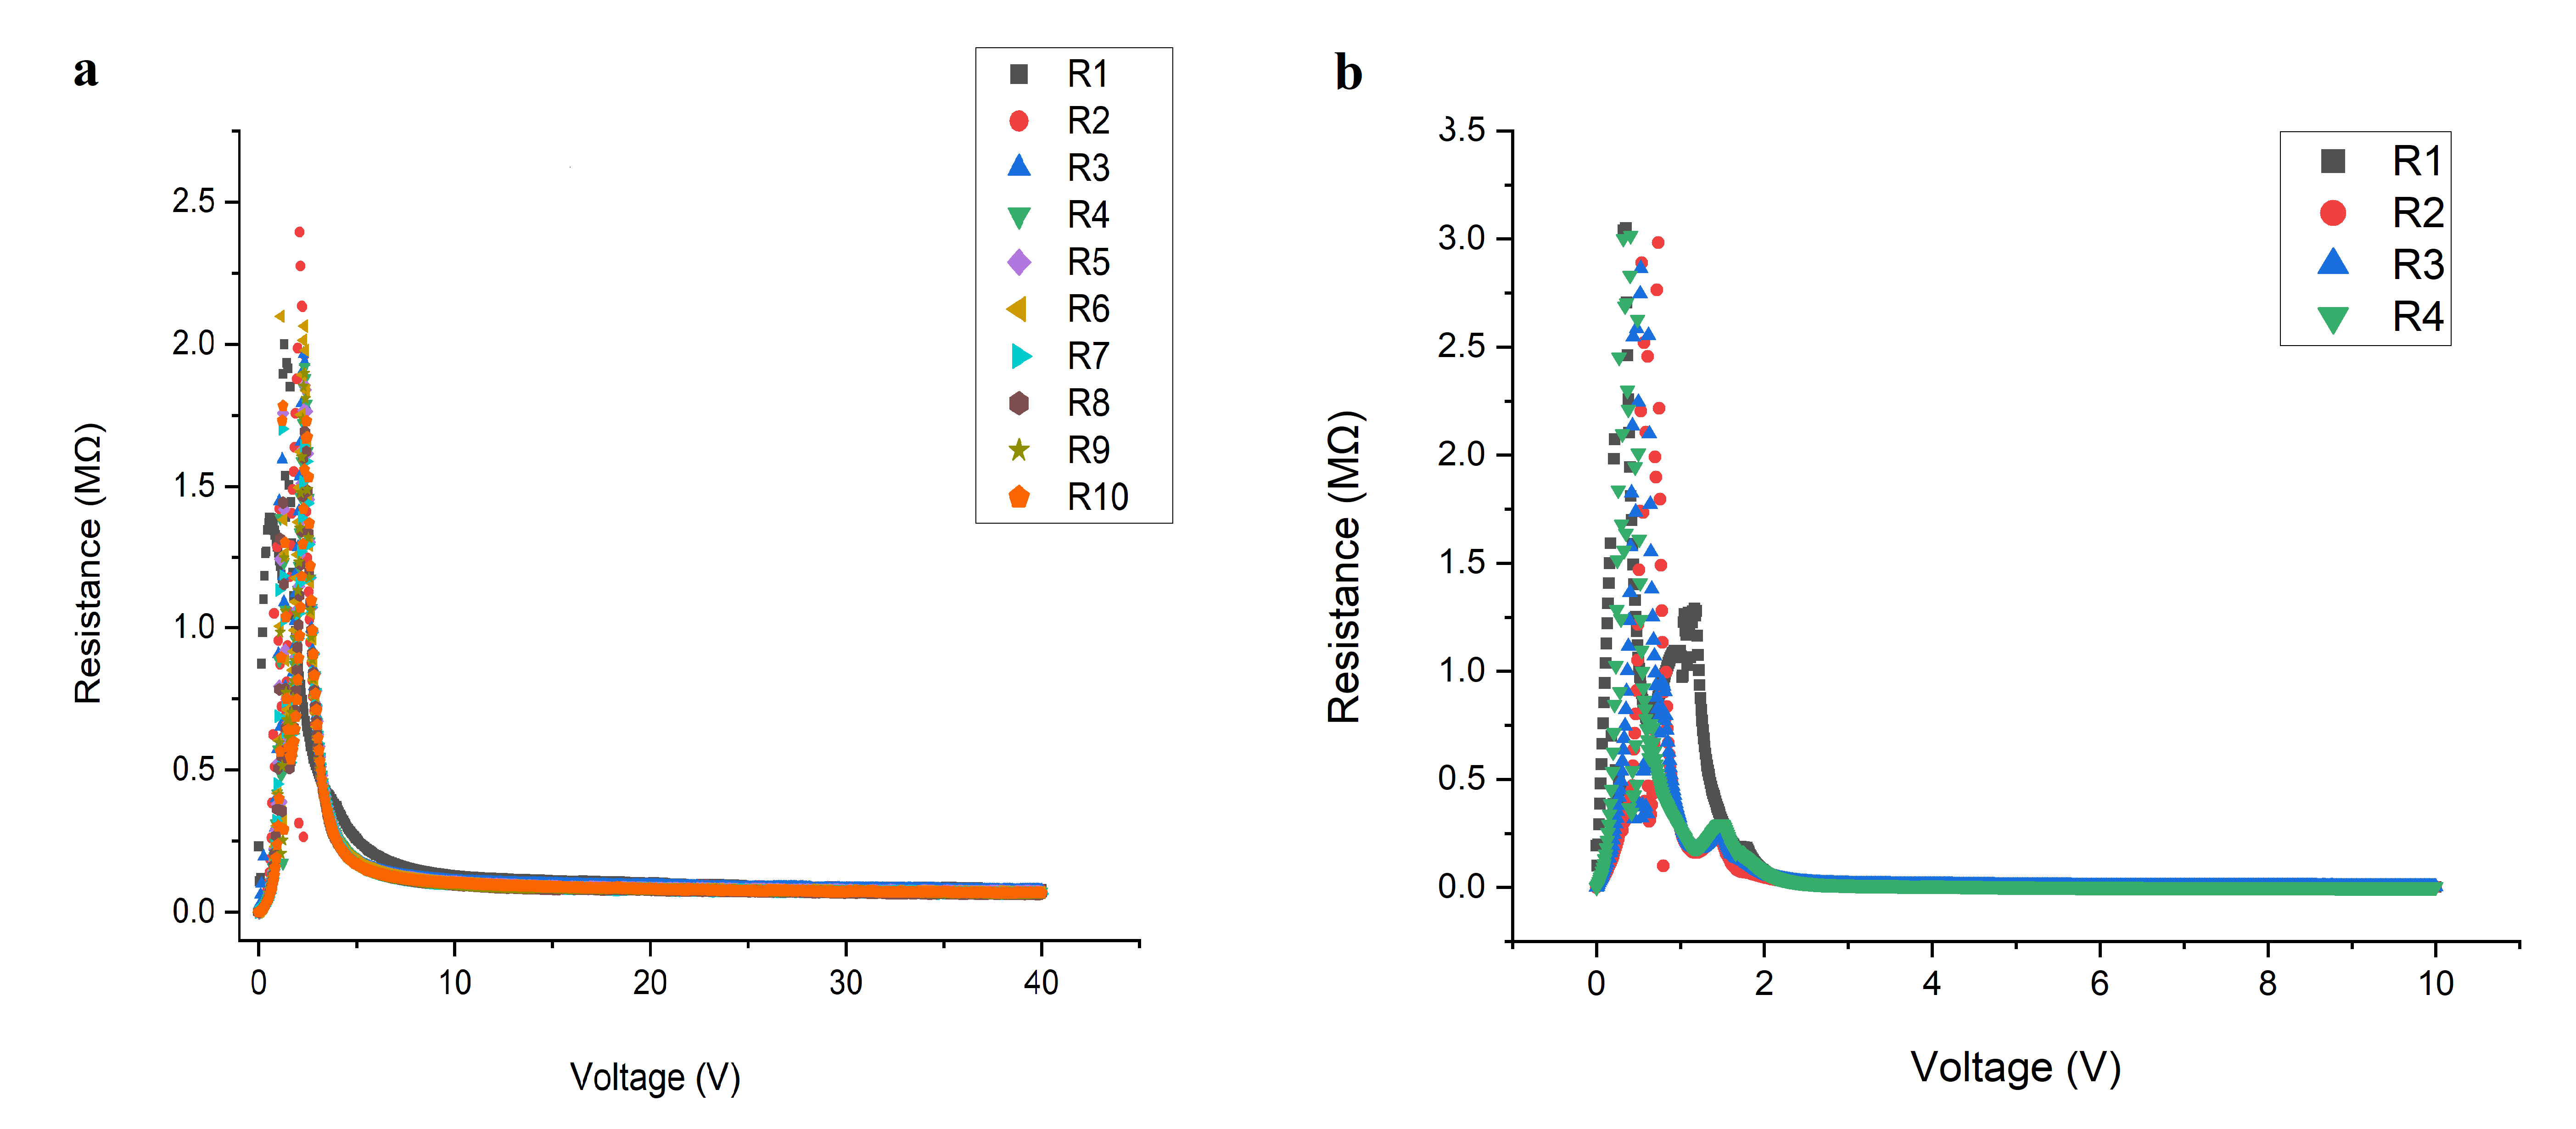
Finally, to check the effects of Brownian movements and oxygen interactions, we repeated the DC stimulation experiments under Nitrogen gas and at . This test was repeated four times. Fig. 8 shows the results of this experiment and compares them with the previous tests in an ambient atmosphere. No significant differences are observed between these two atmospheric conditions. Hence, we can conclude that Brownian movements and oxygen interactions do not have obvious effects on the learning and memorization process of the synthesized colloid.
4 Conclusion
We demonstrated that a colloid of zinc oxide in dimethyl sulfoxide is capable for formation of conductive pathways under application of direct current. The conductive pathways are volatile, they disintegrated with time. The phenomenon can be used to prototype memory devices in liquid phase robots and computers, and to implement synaptic devices in liquid phase neuromorphic circuits. Future directions of the research could be developing protocols for simulation formation of several conductive non-intersecting pathways in a spherical volume of a colloid. These pathways would play a role of information highways in liquid robots and computers.
5 Acknowledgements
The authors are grateful to David Patton for performing FESEM characterization and Paul Bowdler for his help to use the UV-Visible spectroscopy device.
This project has received funding from the European Union’s Horizon 2020 research and innovation programme FET OPEN “Challenging current thinking” under grant agreement No 964388.
References
- [1] Andrew Adamatzky. Handbook of Unconventional Computing. World Scientific, 2021.
- [2] Lilia S. Xie, Grigorii Skorupskii, and Mircea Dincă. Electrically conductive metal–organic frameworks. Chemical Reviews, 120(16):8536–8580, 2020. PMID: 32275412.
- [3] Marco Sangermano, Alessandro Chiolerio, Giulio Marti, and Paola Martino. Uv-cured acrylic conductive inks for microelectronic devices. Macromolecular Materials and Engineering, 298:607–611, 2013.
- [4] M Sumita, S Asai, N Miyadera, E Jojima, and K Miyasaka. Electrical conductivity of carbon black filled ethylene-vinyl acetate copolymer as a function of vinyl acetate content. Colloid and Polymer Science, 264(3):212–217, 1986.
- [5] Bernhard Wessling. Electrical conductivity in heterogeneous polymer systems. v (1): Further experimental evidence for a phase transition at the critical volume concentration. Polymer Engineering & Science, 31(16):1200–1206, 1991.
- [6] Masao Sumita, Hibeki Abe, Hiroyuki Kayaki, and Keizo Miyasaka. Effect of melt viscosity and surface tension of polymers on the percolation threshold of conductive-particle-filled polymeric composites. Journal of Macromolecular Science—Physics, 25(1-2):171–184, 1986.
- [7] Dietrich Stauffer. Scaling theory of percolation clusters. Physics reports, 54(1):1–74, 1979.
- [8] Cheng Zhang, Ping Wang, Chun-an Ma, Guozhang Wu, and Masao Sumita. Temperature and time dependence of conductive network formation: dynamic percolation and percolation time. Polymer, 47(1):466–473, 2006.
- [9] C Zhang, JF Sheng, CA Ma, and M Sumita. Electrical and damping behaviors of cpe/batio3/vgcf composites. Materials letters, 59(28):3648–3651, 2005.
- [10] Jaime C Grunlan, William W Gerberich, and Lorraine F Francis. Lowering the percolation threshold of conductive composites using particulate polymer microstructure. Journal of applied polymer science, 80(4):692–705, 2001.
- [11] Micaela Castellino, Alessandro Chiolerio, Muhammad Imran Shahzad, Pravin Vitthal Jagdale, and Alberto Tagliaferro. Electrical conductivity phenomena in an epoxy resin–carbon-based materials composite. Composites: part A, 61:108–114, 2014.
- [12] Keizo Miyasaka, Kiyosi Watanabe, Eiichiro Jojima, Hiromi Aida, Masao Sumita, and Kinzo Ishikawa. Electrical conductivity of carbon-polymer composites as a function of carbon content. Journal of Materials Science, 17(6):1610–1616, 1982.
- [13] Xianhu Liu, Yamin Pan, Xiaoqiong Hao, Kun Dai, and Dirk W Schubert. The role of conductive pathways in the conductivity and rheological behavior of poly (methyl methacrylate)–graphite composites. Journal of Applied Polymer Science, 133(32), 2016.
- [14] Wenlin Li, Yaqiong Zhang, Jingjing Yang, Jun Zhang, Yanhua Niu, and Zhigang Wang. Thermal annealing induced enhancements of electrical conductivities and mechanism for multiwalled carbon nanotubes filled poly (ethylene-co-hexene) composites. ACS Applied Materials Interfaces, 4(12):6468–6478, 2012.
- [15] Samuele Porro, Francesca Risplendi, Giancarlo Cicero, Katarzyna Bejtka, Gianluca Milano, Paola Rivolo, Alladin Jasmin, Alessandro Chiolerio, Candido Fabrizio Pirri, and Carlo Ricciardi. Multiple resistive switching in core–shell zno nanowires exhibiting tunable surface states. Journal of Materials Chemistry C, 5:10517–10523, 2017.
- [16] Alessandro Chiolerio, Ignazio Roppolo, Katarzyna Bejtka, Abil Asvarov, and Candido Fabrizio Pirri. Resistive hysteresis in flexible nanocomposites and colloidal suspensions: interfacial coupling mechanism unveiled. RSC Advances, 6:56661–56667, 2016.
- [17] Yang Zhang, Yongsheng Chen, Paul Westerhoff, Kiril Hristovski, and John C Crittenden. Stability of commercial metal oxide nanoparticles in water. Water research, 42(8-9):2204–2212, 2008.
- [18] Alessandro Chiolerio and Marco B Quadrelli. Smart fluid systems: the advent of autonomous liquid robotics. Advanced Science, 4(7):1700036, 2017.
- [19] Alessandro Chiolerio. Liquid cybernetic systems: The fourth-order cybernetics. Advanced Intelligent Systems, 2(12):2000120, 2020.
- [20] K Anand, Sibi Varghese, and A Krishnamoorthy. Role of surfactants on the stability of nano-zinc oxide dispersions. Part. Sci. Technol, 35:67–70, 2017.
- [21] Marvin L Cohen. The theory of real materials. Annual review of materials science, 30(1):1–26, 2000.
- [22] L Dong, YC Liu, YH Tong, ZY Xiao, JY Zhang, YM Lu, DZ Shen, and XW Fan. Preparation of zno colloids by aggregation of the nanocrystal subunits. Journal of colloid and interface science, 283(2):380–384, 2005.
- [23] Marco Laurenti, Alessio Verna, and Alessandro Chiolerio. Evidence of negative capacitance in piezoelectric zno thin films sputtered on interdigital electrodes. ACS Applied Materials Interfaces, 7:24470–24479, 2015.
- [24] Woojin Lee, Jiwoo Yeop, Jungwoo Heo, Yung Jin Yoon, Song Yi Park, Jaeki Jeong, Yun Seop Shin, Jae Won Kim, Na Gyeong An, Dong Suk Kim, et al. High colloidal stability zno nanoparticles independent on solvent polarity and their application in polymer solar cells. Scientific reports, 10(1):1–10, 2020.
- [25] E Marín, A Calderón, and D Díaz. Thermal characterization of zno-dmso (dimethyl sulfoxide) colloidal dispersions using the inverse photopyroelectric technique. Analytical Sciences, 25(5):705–709, 2009.
- [26] Hao Tang, Xinfang Chen, Aoqing Tang, and Yunxia Luo. Studies on the electrical conductivity of carbon black filled polymers. Journal of applied polymer science, 59(3):383–387, 1996.
- [27] Harvey Scher and Richard Zallen. Critical density in percolation processes. The Journal of Chemical Physics, 53(9):3759–3761, 1970.
- [28] Scott Kirkpatrick. Percolation and conduction. Reviews of modern physics, 45(4):574, 1973.
- [29] Shameem Akhter and Jason Roberts. Multi-core programming, volume 33. Intel press Hillsboro, Oregon, 2006.
- [30] Hong Han, Haiyang Yu, Huanhuan Wei, Jiangdong Gong, and Wentao Xu. Recent progress in three-terminal artificial synapses: from device to system. Small, 15(32):1900695, 2019.
- [31] Yoeri van De Burgt, Armantas Melianas, Scott Tom Keene, George Malliaras, and Alberto Salleo. Organic electronics for neuromorphic computing. Nature Electronics, 1(7):386–397, 2018.
- [32] Manoj Pudukudy and Zahira Yaakob. Facile synthesis of quasi spherical zno nanoparticles with excellent photocatalytic activity. Journal of Cluster Science, 26(4):1187–1201, 2015.
- [33] A Jagannatha Reddy, MK Kokila, H Nagabhushana, JL Rao, C Shivakumara, BM Nagabhushana, and RPS Chakradhar. Combustion synthesis, characterization and raman studies of zno nanopowders. Spectrochimica Acta Part A: Molecular and Biomolecular Spectroscopy, 81(1):53–58, 2011.
- [34] Jian-Hui Sun, Shu-Ying Dong, Jing-Lan Feng, Xiao-Jing Yin, and Xiao-Chuan Zhao. Enhanced sunlight photocatalytic performance of sn-doped zno for methylene blue degradation. Journal of Molecular Catalysis A: Chemical, 335(1-2):145–150, 2011.
- [35] Sotirios Baskoutas and Gabriel Bester. Conventional optics from unconventional electronics in zno quantum dots. The Journal of Physical Chemistry C, 114(20):9301–9307, 2010.
- [36] Sotirios Baskoutas and Gabriel Bester. Transition in the optical emission polarization of zno nanorods. The Journal of Physical Chemistry C, 115(32):15862–15867, 2011.
- [37] Pei-Jia Lu, Wei-En Fu, Shou-Chieh Huang, Chun-Yen Lin, Mei-Lin Ho, Yu-Pen Chen, and Hwei-Fang Cheng. Methodology for sample preparation and size measurement of commercial zno nanoparticles. journal of food and drug analysis, 26(2):628–636, 2018.