Advanced LIGO, LISA, and Cosmic Explorer as dark matter transducers
Abstract
We present a method to search for scalar field ultralight dark matter directly interacting with gravitational-wave interferometers via a modulation of the fine structure constant and the electron mass. This modulation induces an effective strain in solid materials at a frequency determined by the mass of the dark matter particle. We study the prospects for looking for such an effect in the LIGO detectors by using the solid cavity which is nominally used for pre-stabilizing the laser frequency and we project upper limits. We contextualize them with previous limits from GEO600, possible limits from a similar strain in the LIGO beamsplitter, and with potential limits from upcoming experiments like LISA, Cosmic Explorer and from an upgraded solid cavity. We find that with the sensitivity of Advanced LIGO, competitive upper limits on DM coupling can be placed at the level of for with a combination of two searches using the solid cavity and the beamsplitter in LIGO; future experiments could reduce this upper limit to .
I Introduction
Dark matter (DM) is known to interact gravitationally with normal matter, but so far, numerous efforts to look for a secondary interaction have not come to fruition [1, 2, 3, 4]. The attometer precision of modern Michelson interferometers makes them suitable to look for gravitational waves (GWs), but they can also be used to search for various dark matter candidates, either via direct interaction with the interferometer [5, 6, 7, 8, 9, 10, 11, 12], or by generation of GWs by axion DM [13, 14, 15, 16, 17] or primordial black holes [18, 19, 20, 21, 22]. Furthermore, mapping out black-hole populations and merger rates will also provide clues regarding the nature of DM [13, 14, 23, 22, 24, 25, 26, 27].
Ultralight scalar fields – another promising class of candidate for DM – can also cause a direct interaction with GW detectors [28, 29, 30, 31]. When coupled to the standard model, such a field modulates the fine-structure constant and the mass of the electron , in turn leading to a periodic strain in solid materials due to a change in atomic radius [28, 32, 33]. For a monochromatic DM signal, the modulation of the fine structure constant and the mass of the electron [28, 29]
| (1) | ||||
| (2) |
occurs at an angular frequency where is the mass of the DM particle. The strength of the modulation is given by , where is the local DM energy density and and are the DM couplings with Standard Model [34]. This implies a typical strain for . Under the cold dark matter scenario, the DM is not exactly monochromatic but is expected to have a narrow linewidth: [35].
This modulation of fundamental constants will lead to a strain in a solid body, which in the non-relativistic limit can be simplified to [33]
| (3) |
This strain can be measured by a resonant mass, as was done in the AURIGA GW detector [36]. Separately, such a DM strain can also appear in a free-space Michelson interferometer if its two arms contain unequal amounts of solid material, which can happen when light in one arm traverses the substrate material of the beamsplitter optic [30]; this effect was recently exploited in the GEO600 and Holometer interferometers to search for scalar dark matter [37, 38]. This effect can also be detected by locking a laser to an optical cavity made out of a solid material and monitoring the frequency modulation of the laser by, for example, comparing it to a laser locked to a free-space suspended cavity [34, 35]. In this scheme, the suspended cavity acts as the stable frequency reference, and the solid cavity is the primary DM signal transducer. We note that these same DM fields can also couple to the masses of objects (in addition to their size) via a direct coupling to the gluons, the effect of this coupling with GW interferometers was studied in Refs. [28, 31].
We propose to constrain the coupling strength of above DM models by inspecting the relative frequency changes between a solid cavity and two suspended cavities in Advanced LIGO. We also investigate the prospects of monitoring the beamsplitter thickness in Advanced LIGO. Furthermore, we propose cross correlating the two LIGO detectors for a stronger suppression of spurious environmental effects.
In the second section of this paper, we describe how the reference cavities [39] in the current LIGO detectors can be used as DM monitors.111When using the phrase reference cavity, we will mean the solid cavity. In the third section, we compare this method to other ground-based schemes. We show that at lower DM masses, the Advanced LIGO reference cavity method can perform better than the GEO600 beamsplitter method. At intermediate masses, we find that the Advanced LIGO beamsplitter constraints will outperform GEO600 and the Advanced LIGO reference cavity constraints. In the fourth section, we discuss the prospects of using the reference cavity in LISA in a similar manner to constrain lower-mass scalar fields.
II LIGO reference cavity
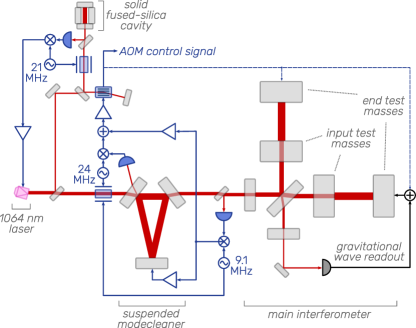
Advanced LIGO’s frequency stabilization is shown in Fig. 1, showing a system of nested frequency locking loops involving the fused silica reference cavity, a suspended triangular modecleaner, and the main interferometer, which is also formed from suspended optics [40, 41, 42]. In brief, the laser frequency is first stabilized to the reference cavity using Pound–Drever–Hall (PDH) locking, with a typical loop bandwidth in excess of . It is then additionally stabilized to the suspended modecleaner, again with PDH locking and with a bandwidth of about , by feeding the PDH control signal to a double-pass acousto-optic modulator (AOM) placed at the input of the reference cavity. Finally, the laser light is PDH stabilized to the common-mode arm degree of freedom of the main interferometer with a bandwidth of tens of kilohertz by feeding the PDH control signal to the error point of modecleaner’s frequency locking loop [43]. At timescales slower than a few hertz, the AOM control signal is fed back to the main interferometer test masses to prevent the accumulation of large seismic- and tidally-driven offsets (dashed line). The timescale of this tidal servo sets a lower frequency limit for using the AOM control signal to search for DM-induced fluctuations in the reference cavity, while the bandwidth of the suspended modecleaner sets an upper frequency limit to the search.
Overall, the effect of the nested frequency locking system is that any relative frequency noise between the reference cavity and the suspended optics appears in the control signal applied to the double-pass AOM at the reference cavity input. In particular, a dark matter signal that induces a solid-body strain will produce a frequency modulation in the reference cavity . The same signal will also produce strains in the various suspended optics, but this signal is suppressed by , where is the length of the suspended cavity and is the effective thickness of the suspended mirrors. For the modecleaner is of order , and for the main interferometer it is . Therefore, any dark matter strain in the solid cavity will appear in the feedback control signal applied to the double-pass AOM.222One could also look for a strain in the feedback control from the main interferometer to the suspended modecleaner, which typically has lower frequency noise than the solid cavity control signal, but such a search is not as sensitive due to the signal suppression mentioned above.
II.1 System noises
In the frequency domain, the feedback control applied to the double-pass AOM is approximately
| (4) |
here all noise terms are referred to frequency fluctuation; is the laser frequency, with being the laser wavelength. The quantity describes noises associated with the (apparent) length of the solid cavity, other than the noise from a DM signal. These other noises include thermal fluctuations and shot noise. The quantity is the intrinsic (free-running) frequency fluctuation of the laser, which is suppressed by the loop gain of the solid cavity laser locking loop. The quantity describes noises associated with the (apparent) length fluctuation of the suspended modecleaner, similar to the solid reference cavity, and similarly describes noise associated with the main interferometer. Assuming each of these contributions to is uncorrelated with the others, the resulting power spectral density of the feedback control signal is thus
| (5) |
| Cavity parameter | Symbol | Current | Upgraded |
|---|---|---|---|
| Length [cm] | 20.3 | 30.0 | |
| Beam size [mm] | 0.29 | 3.0 | |
| Coating loss | |||
| Substrate/spacer loss | |||
| Coating thickness [µm] | 4.5 | 4.5 | |
| Wavelength [nm] | 1064 | 1064 | |
| Temperature [K] | 300 | 300 | |
| Young modulus [GPa] | 72 | 72 | |
| Poisson ratio | 0.17 | 0.17 | |
| Input power [mW] | 10 | 10 | |
| Finesse |
Many of the contributions to for the LIGO reference cavities have been measured in a laboratory setting [39]. An irreducible contribution to is the thermal noise in the cavity, particularly the Brownian motion of the mirror coatings. As can be determined from parameters in Table 1 and the expression in supplemental material (SM), two mirrors of the cavity should together yield a Brownian noise limit of . Additional Brownian noise contributions come from the mirror substrates and from the cavity spacer, and at low frequencies the noise from thermoelastic damping of the mirror substrates becomes comparable to the Brownian noise level. Aside from thermal noise, the typical shot noise limit is (ref SM and Table 1), which is below the thermal noise level. Additionally, Chalermsongsak et al. [39] measured and found it negligible compared to the thermal noise level below . Also there is the noise of the voltage-controlled oscillator driving the AOM, which has a broadband noise level of about [44]. Finally, the digital readback of has an associated noise floor, although this digitization does not affect the performance of the servo loop.
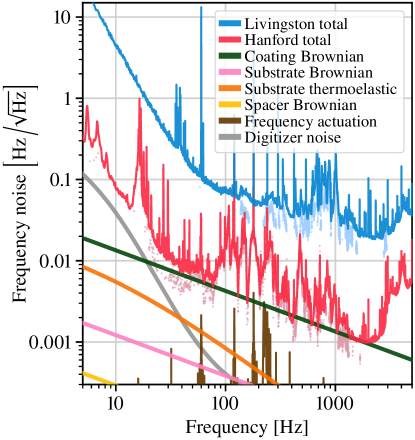
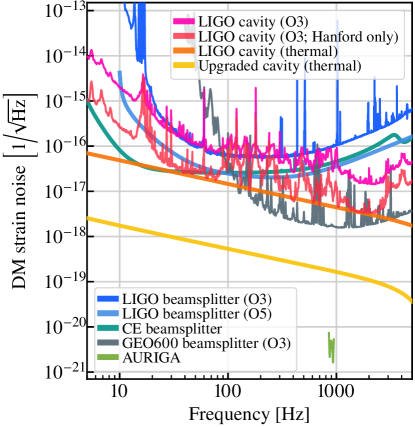
In Fig. 2, we show the measured noise in the reference cavity loops at Livingston and Hanford during the third observing run (O3), as well as the expected thermal noise limit. We also show the contribution from digitizer noise, laser table vibrations, and frequency actuation noise. In Fig. 3 we show the DM-strain-equivalent of the solid cavity noise, as a geometric mean of the Livingston and Hanford noises.
II.2 Projected limits
For the LIGO Hanford and Livingston detectors, the signal is common to both since the coherence length of the dark matter is , which is at least for . Such a signal could be uncovered via a cross-correlation search assuming that the shape of the dark matter strain spectral density is known. The optimal signal-to-noise ratio for such a search is [45, 46]
| (6) |
with being the power spectral density of the Hanford strain-referred frequency control feedback signal , and similarly for Livingston (Eqs. 4 and 5). is the total time of the search.
The dark matter strain spectral density is given by , where and is the dark matter lineshape. This lineshape has been computed by, e.g., Derevianko [35], under the standard assumptions that the dark matter halo is a coherently oscillating field with thermal distribution of modes (see SM). The lineshape is narrowly peaked near , meaning that the spectra and in Fig. 2 can be approximated by their values at . Then using the result (see SM), the achievable limit on the detectable dark matter strain is
| (7) |
where, is the ratio of the velocity of the solar system and the Maxwell-Boltzmann velocity of the DM field, and is the coherence time of the DM signal. We take and . Eq. 7 is valid so long as .
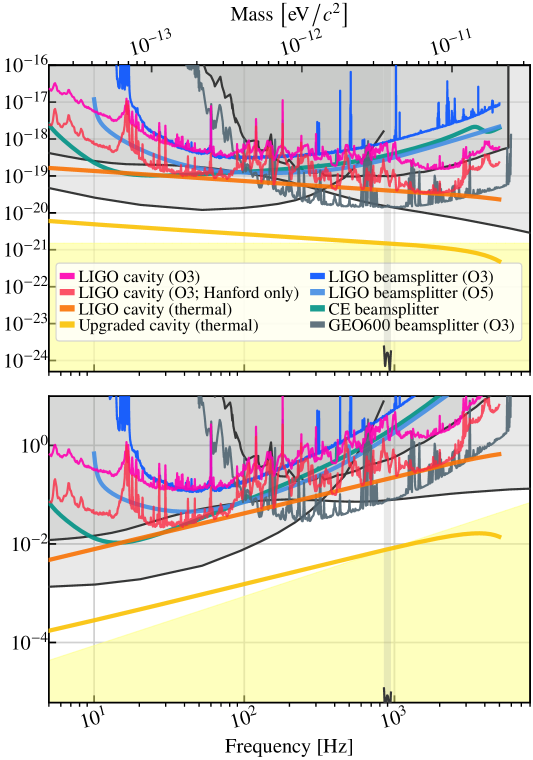
In Footnote 4 we show the projected upper limit from LIGO’s solid cavities, as well as the thermal noise limit, in both strain as well as limits on the coupling constant . We assume an integration time of 1000 hours and signal-to-noise ratio threshold of 3 [45]. Because of the look-elsewhere effect, the exact threshold required to achieve a specified statistical significance depends on the number of frequency bins that are searched over [50].
III Other ground based experiments
We now summarize other possible ways of searching for this effect in ground-based experiments. Firstly, we study the effect of upgrading the LIGO reference cavity to a longer spacer and lower loss amorphous coatings as shown in Table 1. We show the spacer and coating thermal noise limit in Fig. 3 and the potential upper limits from this upgrade in Footnote 4.
Another way to constrain this DM model is by looking for solid-body strain experienced by the beamsplitter of a Michelson interferometer. Given the GW strain noise in a Michelson interferometer, its arm length , and the effective thickness of its beamsplitter ,555The effective thickness accounts for the differential optical path length through the beamsplitter, including effects due to the index of refraction and the non-normal angle of incidence [37, Eq. 5]. the equivalent DM strain noise is , where the gain of the arm cavities decreases the overall sensitivity to fluctuations in the beamsplitter thickness [30].
In Fig. 3 we show the strain noise referred to the DM strain for the Livingston detector during O3. We also show the sensitivity of the GEO600 detector, which has a better sensitivity to DM because of the thicker beamsplitter, higher level of squeezing, and absence of arm cavities. On the same figure, we also show estimated noise performance of the LIGO A+ configuration, as well as the as future gravitational-wave detector, Cosmic Explorer (CE) [51]. We provide a summary of the most important experimental parameters to compare the performance of GW detectors in Table 2. It should be noted that the GEO600 projection assumed a single detector, while the others assumed a cross-correlation of two detectors. In the case of a single detector, the statistical variance in the noise background limits the minimum detectable value of to
| (8) |
where is the detector noise expressed as an equivalent dark-matter strain spectrum; this limit has the same scalings as the cross-correlation limit Eq. 7 and differs only by order-unity factors. In Footnote 4 we show the projected upper limits from these experiments. Finally, we note that other ground-based gravitational-wave detectors like Virgo [52] and Kagra [53] could likely be used in a similar fashion as LIGO, GEO600, and Cosmic Explorer to search for scalar dark matter.
| GEO600 | LIGO | CE | |
|---|---|---|---|
| Beamsplitter thickness [cm] | 8 | 6 | 6 |
| Arm length [km] | 1.2 | 4 | 40 |
| Arm gain | 1 | 280 | 280 |
IV Space based experiments
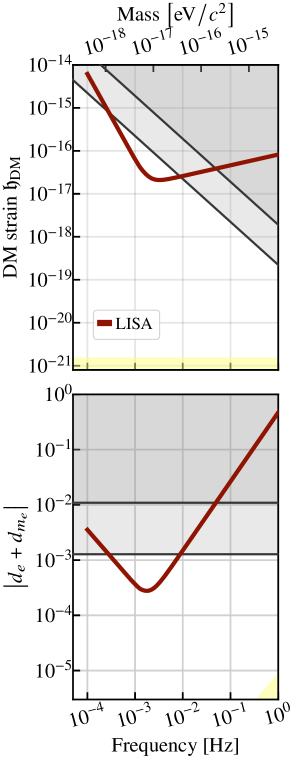
Space-based missions such as LISA may also employ solid reference cavities as part of a laser frequency stabilization scheme. Similar to the case with the LIGO solid cavities, a DM search can be carried out by comparing the cavity-stabilized laser light to the light propagating between the freely falling LISA spacecraft. We can also project the sensitivity of LISA using the reference cavity stability requirement [54, 55]
| (9) |
from to . For , the limit to DM detection follows from previous formulae. However, for millihertz frequencies, exceeds several years, which is comparable to the expected mission duration. Thus for these low search frequencies, the sensitivity to for either a cross-correlation search or single-detector search will scale with integration time like rather than [56]. The projected limits are shown in Footnote 4. This assumes a total search time .
V Discussion
While the exact nature of dark matter remains elusive, concerted efforts to exclude all possible interactions are required. In this work, we provide a method to search for DM interacting with the LIGO detectors — via the length modulation of the solid laser-frequency stabilization cavity — in addition to previously discussed interactions in the main interferometer’s beamsplitter [30]. We find that these methods can be competitive with previous limits in the mass range even with O3 sensitivity.
In order to run this search, we propose using about one year of data, binning it with longer than usual FFT segments in order to optimize sensitivity in the frequency band. The solid cavity readback channel will need to be tagged for glitches and coherence in order to run this search. Finally, akin to other cross-correlation and GW searches, the data will be used from time segments that are glitch free and low-noise in both detectors simultaneously.
We also show prospects to obtain more stringent limits by future experiments. Firstly, we propose lowering of technical noise in the Advanced LIGO frequency locking loop for the next observing runs. We show the possible DM coupling limits if the LIGO solid cavity could be operated at its thermal noise limit. We compare this limit with an upgraded cavity with longer length and lower loss mirror coatings. Finally, we show that the beamsplitter in CE, at its currently expected thickness would provide marginally more stringent limits than the Advanced LIGO beamsplitter, but will not be competitive with limits obtained from thermal-noise limited spacer cavities. It is notable that if the current LIGO reference cavities can be operated at the thermal noise limit, they will provide the best constraints up to 100 Hz in the absence of lower thermal noise spacer cavities.
Acknowledgements.
EDH is supported by the MathWorks, Inc., and the LIGO Laboratory. NA is supported by NSF grant PHY–1806671 and a CIERA Postdoctoral Fellowship from the Center for Interdisciplinary Exploration and Research in Astrophysics at Northwestern University. The authors thank Lee McCuller, Craig Cahillane, Matthew Evans, Lisa Barsotti, Max Isi, Keith Riles, and Masha Baryakhtar for valuable discussions. LIGO was constructed by the California Institute of Technology and Massachusetts Institute of Technology with funding from the National Science Foundation, and operates under Cooperative Agreement No. PHY–0757058. Advanced LIGO was built under Grant No. PHY–0823459.References
- Rubin [1983] V. C. Rubin, Dark matter in spiral galaxies, Scientific American 248, 96 (1983).
- Aghanim et al. [2020] N. Aghanim et al. (Planck), Planck 2018 results. VI. Cosmological parameters, Astron. Astrophys. 641, A6 (2020), [Erratum: Astron.Astrophys. 652, C4 (2021)], arXiv:1807.06209 [astro-ph.CO] .
- Clowe et al. [2006] D. Clowe, M. Bradac, A. H. Gonzalez, M. Markevitch, S. W. Randall, C. Jones, and D. Zaritsky, A direct empirical proof of the existence of dark matter, Astrophys. J. Lett. 648, L109 (2006), arXiv:astro-ph/0608407 .
- Bertone et al. [2005] G. Bertone, D. Hooper, and J. Silk, Particle dark matter: Evidence, candidates and constraints, Phys. Rept. 405, 279 (2005), arXiv:hep-ph/0404175 .
- Hall et al. [2018] E. D. Hall, R. X. Adhikari, V. V. Frolov, H. Müller, M. Pospelov, and R. X. Adhikari, Laser Interferometers as Dark Matter Detectors, Phys. Rev. D 98, 083019 (2018), arXiv:1605.01103 [gr-qc] .
- Pierce et al. [2018] A. Pierce, K. Riles, and Y. Zhao, Searching for Dark Photon Dark Matter with Gravitational Wave Detectors, Phys. Rev. Lett. 121, 061102 (2018), arXiv:1801.10161 [hep-ph] .
- Nagano et al. [2019] K. Nagano, T. Fujita, Y. Michimura, and I. Obata, Axion Dark Matter Search with Interferometric Gravitational Wave Detectors, Phys. Rev. Lett. 123, 111301 (2019), arXiv:1903.02017 [hep-ph] .
- Guo et al. [2019] H.-K. Guo, K. Riles, F.-W. Yang, and Y. Zhao, Searching for Dark Photon Dark Matter in LIGO O1 Data, Commun. Phys. 2, 155 (2019), arXiv:1905.04316 [hep-ph] .
- Michimura et al. [2020] Y. Michimura, T. Fujita, S. Morisaki, H. Nakatsuka, and I. Obata, Ultralight vector dark matter search with auxiliary length channels of gravitational wave detectors, Phys. Rev. D 102, 102001 (2020), arXiv:2008.02482 [hep-ph] .
- Nagano et al. [2021] K. Nagano, H. Nakatsuka, S. Morisaki, T. Fujita, Y. Michimura, and I. Obata, Axion dark matter search using arm cavity transmitted beams of gravitational wave detectors, Phys. Rev. D 104, 062008 (2021), arXiv:2106.06800 [hep-ph] .
- Baum et al. [2022] S. Baum, M. A. Fedderke, and P. W. Graham, Searching for dark clumps with gravitational-wave detectors, Phys. Rev. D 106, 063015 (2022), arXiv:2206.14832 [astro-ph.CO] .
- Abbott et al. [2022a] R. Abbott et al. (LIGO Scientific Collaboration, Virgo Collaboration,, KAGRA, Virgo), Constraints on dark photon dark matter using data from LIGO’s and Virgo’s third observing run, Phys. Rev. D 105, 063030 (2022a), arXiv:2105.13085 [astro-ph.CO] .
- Arvanitaki et al. [2015a] A. Arvanitaki, M. Baryakhtar, and X. Huang, Discovering the QCD Axion with Black Holes and Gravitational Waves, Phys. Rev. D 91, 084011 (2015a), arXiv:1411.2263 [hep-ph] .
- Baryakhtar et al. [2017] M. Baryakhtar, R. Lasenby, and M. Teo, Black Hole Superradiance Signatures of Ultralight Vectors, Phys. Rev. D 96, 035019 (2017), arXiv:1704.05081 [hep-ph] .
- Arvanitaki et al. [2017] A. Arvanitaki, M. Baryakhtar, S. Dimopoulos, S. Dubovsky, and R. Lasenby, Black Hole Mergers and the QCD Axion at Advanced LIGO, Phys. Rev. D 95, 043001 (2017), arXiv:1604.03958 [hep-ph] .
- Sun et al. [2020] L. Sun, R. Brito, and M. Isi, Search for ultralight bosons in Cygnus X-1 with Advanced LIGO, Phys. Rev. D 101, 063020 (2020), [Erratum: Phys.Rev.D 102, 089902 (2020)], arXiv:1909.11267 [gr-qc] .
- Yuan et al. [2022] C. Yuan, Y. Jiang, and Q.-G. Huang, Constraints on an ultralight scalar boson from Advanced LIGO and Advanced Virgo’s first three observing runs using the stochastic gravitational-wave background, Phys. Rev. D 106, 023020 (2022), arXiv:2204.03482 [astro-ph.CO] .
- Sasaki et al. [2016] M. Sasaki, T. Suyama, T. Tanaka, and S. Yokoyama, Primordial Black Hole Scenario for the Gravitational-Wave Event GW150914, Phys. Rev. Lett. 117, 061101 (2016), [Erratum: Phys.Rev.Lett. 121, 059901 (2018)], arXiv:1603.08338 [astro-ph.CO] .
- Abbott et al. [2022b] R. Abbott et al. (LIGO Scientific, VIRGO, KAGRA), Search for Subsolar-Mass Binaries in the First Half of Advanced LIGO’s and Advanced Virgo’s Third Observing Run, Phys. Rev. Lett. 129, 061104 (2022b), arXiv:2109.12197 [astro-ph.CO] .
- Nitz and Wang [2021] A. H. Nitz and Y.-F. Wang, Search for Gravitational Waves from the Coalescence of Subsolar-Mass Binaries in the First Half of Advanced LIGO and Virgo’s Third Observing Run, Phys. Rev. Lett. 127, 151101 (2021), arXiv:2106.08979 [astro-ph.HE] .
- Miller et al. [2022] A. L. Miller, N. Aggarwal, S. Clesse, and F. De Lillo, Constraints on planetary and asteroid-mass primordial black holes from continuous gravitational-wave searches, Phys. Rev. D 105, 062008 (2022), arXiv:2110.06188 [gr-qc] .
- Jedamzik [2021] K. Jedamzik, Consistency of Primordial Black Hole Dark Matter with LIGO/Virgo Merger Rates, Phys. Rev. Lett. 126, 051302 (2021), arXiv:2007.03565 [astro-ph.CO] .
- Ng et al. [2021] K. K. Y. Ng, S. Vitale, O. A. Hannuksela, and T. G. F. Li, Constraints on Ultralight Scalar Bosons within Black Hole Spin Measurements from the LIGO-Virgo GWTC-2, Phys. Rev. Lett. 126, 151102 (2021), arXiv:2011.06010 [gr-qc] .
- Clesse and García-Bellido [2017] S. Clesse and J. García-Bellido, The clustering of massive Primordial Black Holes as Dark Matter: measuring their mass distribution with Advanced LIGO, Phys. Dark Univ. 15, 142 (2017), arXiv:1603.05234 [astro-ph.CO] .
- Gow et al. [2020] A. D. Gow, C. T. Byrnes, A. Hall, and J. A. Peacock, Primordial black hole merger rates: distributions for multiple LIGO observables, JCAP 01, 031, arXiv:1911.12685 [astro-ph.CO] .
- Hütsi et al. [2021] G. Hütsi, M. Raidal, V. Vaskonen, and H. Veermäe, Two populations of LIGO-Virgo black holes, JCAP 03, 068, arXiv:2012.02786 [astro-ph.CO] .
- Franciolini et al. [2022] G. Franciolini, V. Baibhav, V. De Luca, K. K. Y. Ng, K. W. K. Wong, E. Berti, P. Pani, A. Riotto, and S. Vitale, Searching for a subpopulation of primordial black holes in LIGO-Virgo gravitational-wave data, Phys. Rev. D 105, 083526 (2022), arXiv:2105.03349 [gr-qc] .
- Arvanitaki et al. [2015b] A. Arvanitaki, J. Huang, and K. Van Tilburg, Searching for dilaton dark matter with atomic clocks, Phys. Rev. D 91, 015015 (2015b), arXiv:1405.2925 [hep-ph] .
- Stadnik and Flambaum [2015a] Y. V. Stadnik and V. V. Flambaum, Searching for dark matter and variation of fundamental constants with laser and maser interferometry, Phys. Rev. Lett. 114, 161301 (2015a), arXiv:1412.7801 [hep-ph] .
- Grote and Stadnik [2019] H. Grote and Y. V. Stadnik, Novel signatures of dark matter in laser-interferometric gravitational-wave detectors, Phys. Rev. Res. 1, 033187 (2019), arXiv:1906.06193 [astro-ph.IM] .
- Morisaki and Suyama [2019] S. Morisaki and T. Suyama, Detectability of ultralight scalar field dark matter with gravitational-wave detectors, Phys. Rev. D 100, 123512 (2019).
- Stadnik and Flambaum [2015b] Y. V. Stadnik and V. V. Flambaum, Can dark matter induce cosmological evolution of the fundamental constants of Nature?, Phys. Rev. Lett. 115, 201301 (2015b), arXiv:1503.08540 [astro-ph.CO] .
- Arvanitaki et al. [2016] A. Arvanitaki, S. Dimopoulos, and K. Van Tilburg, Sound of Dark Matter: Searching for Light Scalars with Resonant-Mass Detectors, Phys. Rev. Lett. 116, 031102 (2016), arXiv:1508.01798 [hep-ph] .
- Geraci et al. [2019] A. A. Geraci, C. Bradley, D. Gao, J. Weinstein, and A. Derevianko, Searching for Ultralight Dark Matter with Optical Cavities, Phys. Rev. Lett. 123, 031304 (2019), arXiv:1808.00540 [astro-ph.IM] .
- Derevianko [2018] A. Derevianko, Detecting dark-matter waves with a network of precision-measurement tools, Phys. Rev. A 97, 042506 (2018), arXiv:1605.09717 [physics.atom-ph] .
- Branca et al. [2017] A. Branca et al., Search for an Ultralight Scalar Dark Matter Candidate with the AURIGA Detector, Phys. Rev. Lett. 118, 021302 (2017), arXiv:1607.07327 [hep-ex] .
- Vermeulen et al. [2021] S. M. Vermeulen et al., Direct limits for scalar field dark matter from a gravitational-wave detector, Nature 600, 428 (2021), arXiv:2103.03783 [gr-qc] .
- Aiello et al. [2022] L. Aiello, J. W. Richardson, S. M. Vermeulen, H. Grote, C. Hogan, O. Kwon, and C. Stoughton, Constraints on Scalar Field Dark Matter from Colocated Michelson Interferometers, Phys. Rev. Lett. 128, 121101 (2022), arXiv:2108.04746 [gr-qc] .
- Chalermsongsak et al. [2014] T. Chalermsongsak, F. Seifert, E. D. Hall, K. Arai, E. K. Gustafson, and R. X. Adhikari, Broadband measurement of coating thermal noise in rigid Fabry–Pérot cavities, Metrologia 52, 17 (2014), arXiv:1406.4467 [physics.optics] .
- Kwee et al. [2012] P. Kwee, C. Bogan, K. Danzmann, M. Frede, H. Kim, P. King, J. Pöld, O. Puncken, R. L. Savage, F. Seifert, P. Wessels, L. Winkelmann, and B. Willke, Stabilized high-power laser system for the gravitational wave detector advanced LIGO, Optics Express 20, 10617 (2012).
- Aasi et al. [2015] J. Aasi et al. (LIGO Scientific), Advanced LIGO, Class. Quant. Grav. 32, 074001 (2015), arXiv:1411.4547 [gr-qc] .
- Bode et al. [2020] N. Bode et al., Advanced LIGO Laser Systems for O3 and Future Observation Runs, Galaxies 8, 84 (2020).
- Cahillane et al. [2021] C. Cahillane, G. Mansell, and D. Sigg, Laser frequency noise in next generation gravitational-wave detectors, Opt. Express 29, 42144 (2021), arXiv:2107.14349 [physics.ins-det] .
- Angert and Sigg [2009] C. I. Angert and D. Sigg, Characterization of a Voltage Controlled Oscillator, Tech. Rep. T0900451–v1 (LIGO, 2009).
- Romano and Cornish [2017] J. D. Romano and N. J. Cornish, Detection methods for stochastic gravitational-wave backgrounds: a unified treatment, Living Rev. Rel. 20, 2 (2017), arXiv:1608.06889 [gr-qc] .
- Foster et al. [2021] J. W. Foster, Y. Kahn, R. Nguyen, N. L. Rodd, and B. R. Safdi, Dark Matter Interferometry, Phys. Rev. D 103, 076018 (2021), arXiv:2009.14201 [hep-ph] .
- Adelberger et al. [2003] E. G. Adelberger, B. R. Heckel, and A. E. Nelson, Tests of the gravitational inverse square law, Ann. Rev. Nucl. Part. Sci. 53, 77 (2003), arXiv:hep-ph/0307284 .
- Bergé et al. [2018] J. Bergé, P. Brax, G. Métris, M. Pernot-Borràs, P. Touboul, and J.-P. Uzan, MICROSCOPE Mission: First Constraints on the Violation of the Weak Equivalence Principle by a Light Scalar Dilaton, Phys. Rev. Lett. 120, 141101 (2018), arXiv:1712.00483 [gr-qc] .
- O’Hare [2020] C. O’Hare, cajohare/AxionLimits: AxionLimits, https://cajohare.github.io/AxionLimits/ (2020).
- Palken [2020] D. A. Palken, Enhancing the scan rate for axion dark matter: Quantum noise evasion and maximally informative analysis, Ph.D. thesis, University of Colorado, Boulder (2020).
- Evans et al. [2021] M. Evans et al., A Horizon Study for Cosmic Explorer: Science, Observatories, and Community, arXiv (2021), arXiv:2109.09882 [astro-ph.IM] .
- Acernese et al. [2015] F. Acernese et al. (VIRGO), Advanced Virgo: a second-generation interferometric gravitational wave detector, Class. Quant. Grav. 32, 024001 (2015), arXiv:1408.3978 [gr-qc] .
- Akutsu et al. [2021] T. Akutsu et al. (KAGRA), Overview of KAGRA: Detector design and construction history, PTEP 2021, 05A101 (2021), arXiv:2005.05574 [physics.ins-det] .
- Heinzel et al. [2006] G. Heinzel, C. Braxmaier, K. Danzmann, P. Gath, J. Hough, O. Jennrich, U. Johann, A. Rudiger, M. Sallusti, and H. Schulte, LISA interferometry: Recent developments, Class. Quant. Grav. 23, S119 (2006).
- Valliyakalayil et al. [2022] J. T. Valliyakalayil, A. J. H. Sutton, R. E. Spero, D. A. Shaddock, and K. McKenzie, Enhanced frequency noise suppression for LISA by combining cavity and arm locking control systems, Phys. Rev. D 105, 062005 (2022), arXiv:2110.10870 [gr-qc] .
- Graham et al. [2016] P. W. Graham, D. E. Kaplan, J. Mardon, S. Rajendran, and W. A. Terrano, Dark Matter Direct Detection with Accelerometers, Phys. Rev. D 93, 075029 (2016), arXiv:1512.06165 [hep-ph] .
- Hong et al. [2013] T. Hong, H. Yang, E. K. Gustafson, R. X. Adhikari, and Y. Chen, Brownian thermal noise in multilayer coated mirrors, Phys. Rev. D 87, 082001 (2013), arXiv:1207.6145 [gr-qc] .
Appendix A DM signal properties
Modulation strength: The expected strength of modulation of fundamental constants has been postulated in Refs. [28, 33, 34] as
| (10) | ||||
| (11) | ||||
| (12) |
where, is the local dark matter density, is the mass of the dark matter particle, and is the dominant frequency of modulation.
Lineshape: The DM velocity profile in the rest frame of the galaxy is Maxwell–Bolzmann-distributed with a characteristic velocity , with and hence a coherence time . This velocity dispersion leads to a Doppler-broadened lineshape [35]
| (13) |
where results from the Doppler shift due to the velocity of the solar system relative to the galactic rest frame, and [35].
Appendix B Noises
Thermal noise: Given some assumptions — namely that the coating and substrate have similar mechanical parameters and that the internal mechanical loss angles of the mirrors are similar for bulk and shear modes — the power spectral density of the Brownian motion in a single mirror is [57]
| (14) |
where the relevant parameters for the fused silica cavity are defined in Table 1.
Appendix C LIGO frequency loop architecture
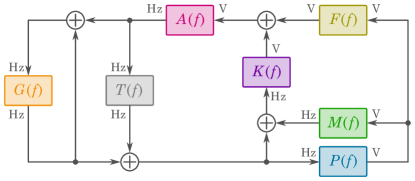
Fig. 5 shows a loop diagram of LIGO’s laser frequency suppression servo system. In the frequency domain, frequency actuation applied to the reference cavity error point are found via
| (16) | ||||
| (17) | ||||
| (18) |
with and . Here we have ignored the effect of the tidal servo in Fig. 5, which is irrelevant for .
The reference cavity gain , the modecleaner gain and the interferometer gain are known to satisfy for . Thus within this frequency band, , so and . Together these imply , with in the relevant frequency band. Substituting these approximations in
| (19) |