2021
[1,2]\fnmMartin \surTømterud
[1]\fnmBodil \surHolst
[1]\orgdivDepartment of Physics and Technology, \orgnameUniversity of Bergen, \orgaddress\streetAllégaten 55, \postcode5007 \cityBergen, \countryNorway
2]\orgdivDonostia International Physics Center (DIPC), \orgaddress\streetPaseo Manuel de Lardizabal, 4, \postcode20018 \cityDonostia-San Sebastián, \countrySpain
3]\orgdivCenter for Nanotechnology Innovation@NEST, \orgnameIstituto Italiano di Tecnologia, \orgaddress\streetPiazza San Silvestro 12, \postcode56127 \cityPisa, \countryItaly
4]\orgdivDepartment of Physics and Astronomy, \orgnameClemson University, \orgaddress\cityClemson, \stateSouth Carolina \postcode29634, \countryUSA
Temperature Dependent Bending Rigidity of Graphene
Abstract
The mechanical properties of two-dimensional (2D) materials are important for a wide range of applications including composite materials, van der Waals materials and flexible electronics. Several aspects are highly debated in the literature: For example, the theoretically predicted bending rigidity, , of the most important 2D material, graphene, varies from 0.8 eV to 10 eV for predictions at 0 K and there are predictions that it could increase or decrease with temperature depending on the applied theory. Here we present the first systematic experimental study of the temperature dependence of graphene. Extracting values of from the ZA-phonon dispersion relation measured with helium atom scattering, we find the value of to increase with sample temperature. A linear fit in the temperature range (120 K-480 K) gives a bending rigidity of .
1 Introduction
The class of atomically thin material sheets and membranes, commonly referred to as 2D materials, are foreseen to take center stage in the development of van der Waals heterostructures and flexible electronics components. For these applications, the materials’ mechanical properties are of immense importance. In the last few years, helium atom scattering (HAS) has been established as a technique uniquely suited for evaluating the bending rigidity of 2D materials Holst2013 .
The bending rigidity, , sometimes referred to as the bending stiffness or the flexural rigidity, is an expression of the flexibility of the material. Classically, the bending rigidity of an isotropic plate is given by RN1 :
| (1) |
where is Young’s modulus, is the plate thickness, and is Poisson’s ratio. The unit of is [Pa m3]=[J], but is usually expressed in [eV] for nanomaterials. For hexagonal crystals, such as graphene, the elastic properties in the (0001) plane can be treated as isotropic RN1 . Both Young’s modulus and Poisson’s ratio for 2D materials can be measured relatively simply by using an atomic force microscope and poking with a well-defined force and measuring the response RN2 . However, in order to determine using equation (1), one needs to know the thickness of the material. This is often difficult to determine for 2D materials RN3 ; RN4 ; RN5 . Furthermore, it is not evident that an atomically thin layer behaves in a classical manner, and the use of Eq. (1) for determining is not well justified.
Many experiments have been performed to investigate the mechanical properties of 2D materials, using various techniques of nanoengineering RN2 . The bending rigidity has however proven difficult to measure.
The experimental predictions for the bending rigidity of monolayer graphene ranges from 1.2 eV to 2.7 eV RN6 ; RN12 ; RN17 , with an outlier finding a bending rigidity of eV RN7 . The very large experimental range is mainly due to challenges with out-of-plane corrugation and strain. For bilayer graphene, the experimental prediction is 2.6 eV - 5.8 eV, depending on the bending angle RN17 . Theoretical predictions give values from 0.8 eV to 35.5 eV for monolayer graphene RN8 ; RN9 ; RN10 ; RN11 ; RN13 ; RN14 ; RN15 ; RN16 ; RN18 ; RN19 and 2.6 eV to 180 eV for bilayer graphene RN13 ; RN15 ; RN16 ; RN18 ; RN19 .
A couple of years back Amorim and Guinea showed how the bending rigidity for an isotropic, free-standing thin membrane which is weakly bound to a substrate is related to the phonon dispersion of the ZA mode via RN20 , see also RN26 ; 2Dsilica_Erratum :
| (2) |
where is the phonon frequency, is 2D material density, is the parallel component of the change in the wave vector, and is the binding energy between the membrane and the substrate. Note that it is the free-standing 2D material value for that is measured, as long as the membrane is only weakly bound to the substrate. Strictly speaking, for an infinite extent thin film with fixed or periodic boundary conditions, Eq. (2) contains a quadratic term in , implying a linear term in the dispersion relation. However, this term is typically small compared to the binding energy and is therefore usually ignored RN26 ; 2Dsilica_Erratum .
Al Taleb et al. applied this theory in 2015 to measure the bending rigidity of free-standing monolayer graphene using phonon dispersion curves from monolayer graphene weakly bound on a copper substrate obtained through helium scattering RN12 . They obtained a value for that shows good agreement with theory. An often cited value in the literature that agrees well with theory, eV, was derived from Raman spectroscopy experiments performed on bulk graphite by Nicklow et al. NicklowPRB . To our best knowledge, the work by Al Taleb et al. remains the most precise measurement of the bending rigidity of monolayer graphene up till now. In 2018 the bending rigidity of 2D silica was obtained using the same method RN26 . The first measurements of the temperature dependent bending rigidity of a 2D material were published in 2021. Eder et al. applied the method of Al Taleb et al. to AB stacked bilayer graphene weakly bound on intercalated silicon carbide, obtaining the bending rigidity by measuring the phonon dispersion curves Eder2021 . The change in bending rigidity of a 2D material with material density has also been explored using HAS Tomterud2022 .
In this paper we present the first measurements of the temperature dependent bending rigidity of “the mother of all 2D materials”; graphene.
2 Experimental
The measurements were performed on a quasi free-standing monolayer graphene sample prepared at the Istituto Italiano di Tecnologia (IIT) on a N-doped () 6H-SiC(0001) crystal from Crystal GmbH. The sample was prepared using an established procedure at the institute: first the substrate was etched in a 50 Ar and H2 mixture with a total pressure of 450 mbar (fluxes 500 sccm (standard cubic centimetre per minute) each) at 1200°C for 5 min to regularize the step-terrace morphology. The sample was then exposed to a 50 Ar and H2 mixture with a total pressure of 750 mbar (fluxes 500 sccm each) at 800°C for 20 min. This leads to atomic hydrogen intercalating at the hetero-interface between SiC(0001) and the carbon rich surface reconstruction, thereby lifting the covalent interaction so that the carbon atoms previously in the reconstruction form a monolayer of graphene on top of the now H-terminated SiC(0001) RN35 ; RN36 ; RN37 . The graphene is weakly bound to the substrate: it can be peeled off the substrate in a manner similar to graphene on Cu RN47 .
We can obtain measurements of the bending rigidity of the free-standing monlayer using the phonon dispersion curve model discussed above because the sample is weakly bound. The sample temperature can be varied easily and uniformly by changing the temperature of the underlying SiC substrate.
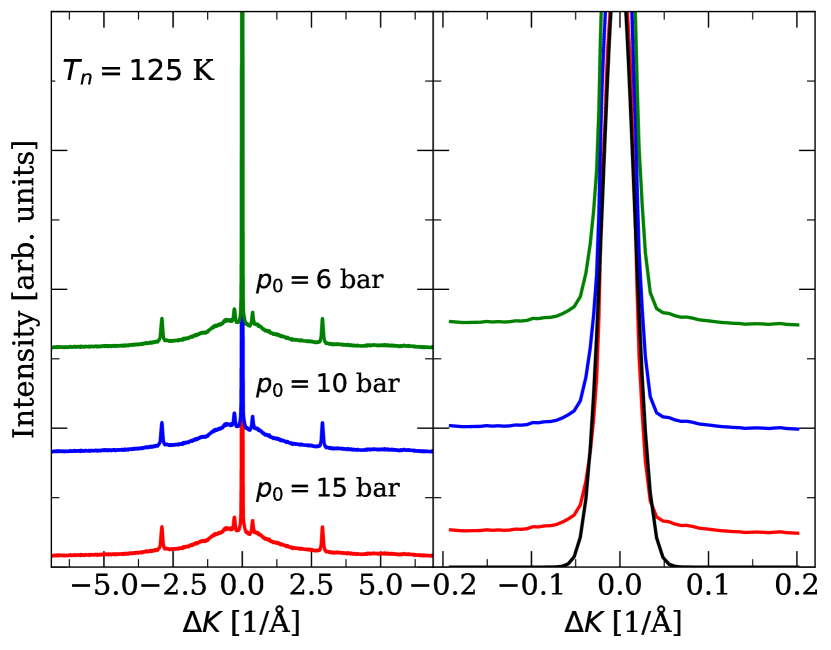
After preparation, the sample was placed in a sealed package, filled with ambient air from the laboratory (humidity 50, temperature 22∘C) and shipped to the University of Bergen (UiB). The sealed package was stored in the laboratory for several months before the sample was mounted in the argon vented sample chamber of the molecular beam apparatus known as MAGIE at UiB, which was then pumped down. The neutral helium beam used for sample investigation was created by a supersonic (free-jet) expansion from a source reservoir through a diameter nozzle RN48 . The central part of the beam was selected by a skimmer, in diameter, placed mm in front of the nozzle. The sample was characterized in vacuum, by helium diffraction scans and time of flight (TOF) spectra using a pseudorandom chopper RN49 . The background pressure during all measurements was around mbar or less. The incident beam spot size on the sample was around 4 mm in diameter for all measurements. Directly after mounting the sample and pumping it down, no diffraction pattern was observed. A bake-out was performed for 1 h at a sample temperature K followed by a gradual cooldown to the desired substrate temperature in 25 K steps with 60 s wait time in between. This improved the signal strongly yielding a high intensity specular peak, with a measured full width at half maximum of Å-1 (the instrument resolution), see Fig. 1. This bake-out procedure was repeated between the measurements. The diffraction measurements were taken using cooled beam, K, at a sample temperature of 400 K. The TOF measurements were taken using a beam of = 71 bar with beam energy meV. The sample temperature was (320, 370 and 400 0.2) K. An angular range of 25°– 65°was investigated for each temperature, and in total 698 TOF spectra were obtained. For more details see supplementary information.
3 Results and Discussion
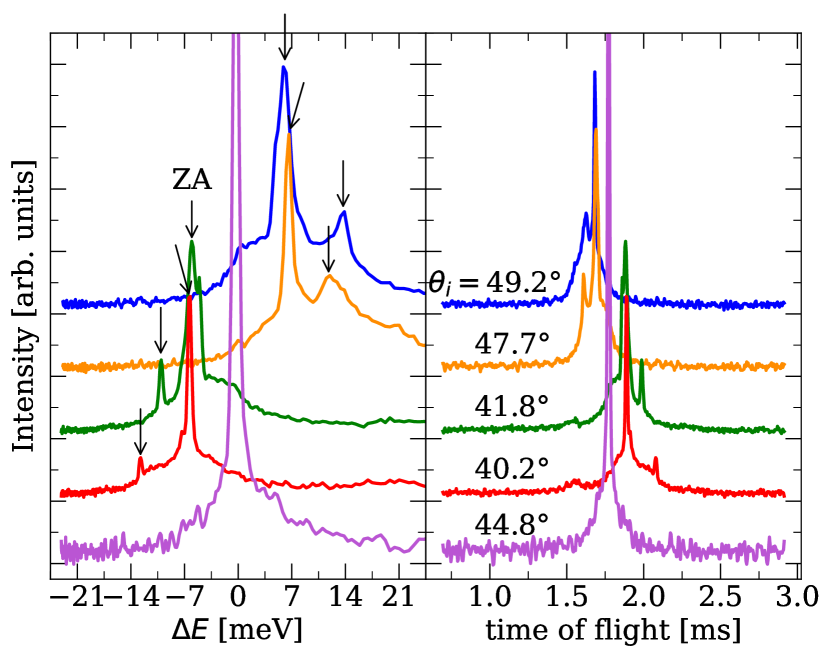
Examples of TOF spectra can be found in Fig 2. The arrow annotations identify ZA peaks in the spectra.
Identified ZA mode excitations in the HAS spectra are plotted as a function of their parallel momentum exchange in Fig. 3. The solid curves show fits of the dispersion relation presented in Eq. (2) to the ZA modes. The three panels show the different sample temperatures, with the measurement series at K also depicting a measurement taken with the sample azimuth rotated °, to check that the sample behaved isotropic in the plane as expected.
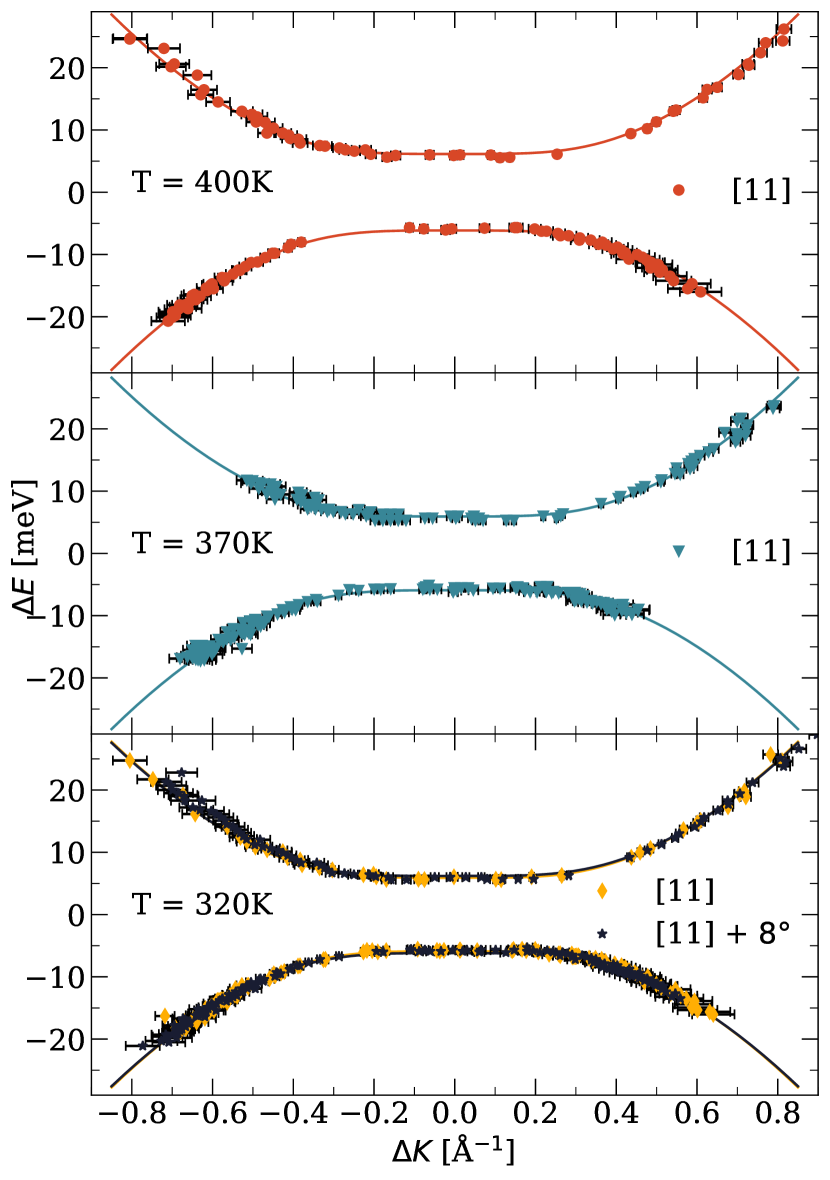
The ZA mode behaviour is seen to be in good agreement with the model in Eq. (2). With mass density kg/m2 we obtain temperature dependent measurements of the bending rigidity presented in Fig. 4. As can be seen, the bending rigidity increases with temperature. From a weighted, linear fit of the measurement points we obtain a relation for , given by
| (3) | ||||
The errors are one standard deviation of the weighted fit. The fit is performed on a narrow temperature range, and it is not clear that a linear relation between and sample temperature is correct for a larger temperature range.

In Fig. 4, we have included the HAS measurement of monolayer graphene on supported on copper foil RN12 . This measurement was obtained at a sample temperature of 125 K and fits well, within errorbars, of the linear extrapolation of the measurements series obtained for our SiC-supported graphene. The measurement is however attributed significantly larger error bars than ours, and should therefore not be taken as an argument for the linear fit to hold in general. The linear extrapolation also coincides with MD simulations at 300 K Ramirez2016 . Also shown in the Fig. 4 are theoretical results obtained through various methods and models at zero temperature. These were summarised in Table 1 of Ref. 16, including density functional theory (DFT) RN14 ; Sanchez-Portal-PRB ; Kudin-PRB , tight-binding DFT (DFTB) RN16 ; Munoz-Diamond , and empirical potential calculations Tersoff-PRB ; Tu-PRB ; Arroyo-PRB ; Lu-APD . At finite temperature, theoretical results include elastic membrane calculations Liu-APL , calculations of the bending rigidity of carbon nanotubes Yi-Aip , and the bending rigidity of graphene from MD simulations RN18 ; Costamagna-PRB . Furthermore, a comparative study between calculations and electron microscopy by Han et al. in good agreement with our measurements, is included Han-Nature . Note that we assume these measurements were carried out at room temperature. We could not find an explicit mentioning of this in the paper. At zero temperature there is a significant disagreement between the theoretical predictions of the bending rigidity. Such a disagreement is also present in the finite temperature theoretical results, but to a smaller magnitude. The most significant disagreement at finite temperature is the debate on whether the bending rigidity increases or decreases with increasing temperature. This is the second set of measurements we present where the bending rigidity is found to increase, which is also the case for the majority of literature results. The starting point of Ref. 41, which disagrees, is a liquid membrane theory. One interesting implication could be that for a glassy 2D material, the bending rigidity will decrease when heated. This is a topic for future investigation. Another observation from the theoretical results is that they all underestimate the value we measure experimentally. A plausible explanation is as follows. With HAS we are measuring the phonon dispersion out to about Å-1. We observe that the ZA mode peaks in our spectra follow the dispersion relation in Eq. (2) up until this cutoff. When computing free-standing graphene phonon dispersions with molecular dynamics one obtains the entire spectrum, and the bending rigidity is often taken to be the fitting limit of the ZA dispersion in the limit , i.e. close to the zone centre. This part of the dispersion relation is hidden by the coupling energy in the substrate-graphene system and not probable with HAS unless one obtains a truly free-standing graphene system with . It is therefore possible that important physics are hidden close to the -point that will decrease the measured value of . Conversely, as already stated, our measurements show that the ZA mode follow the dispersion relation at least until Å-1 - which signals that obtaining the bending rigidity by only fitting close to the -point misses out on important physics further out in the zone. A “simple” way to test this hypothesis experimentally is obtaining graphene samples on different substrates and measuring the effect of the binding energy on the bending rigidity and extrapolating the free-standing value.
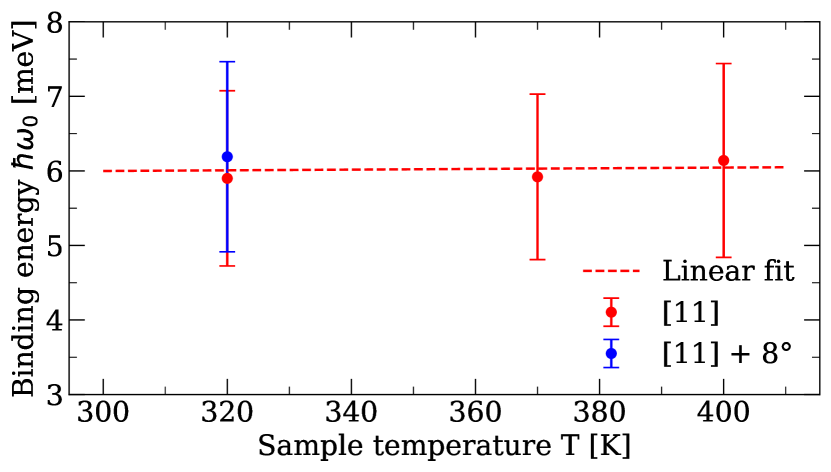
The experimental results for the binding energy between the graphene monolayer and the SiC-substrate are presented in Fig. 5. We do not observe a significant change with temperature in the binding energy within the investigated temperature range.
4 Conclusion
We have presented temperature resolved measurements of the ZA mode of SiC-supported monolayer graphene. From the phonon dispersion we are able to extract temperature dependent values of the bending rigidity, which we show are increasing with temperature. Future work should include measurements over a larger temperature range to investigate the linear behaviour we observe, measurements of different 2D materials, and particularly glassy ones, to investigate if they behave in a different manner when heated, and measurements of graphene on different substrates to investigate the influence of the binding energy on the values we are able to extract for the bending rigidity.
Supplementary information Supporting information, including sample characterization, will be made available upon publication.
Acknowledgments
-
•
Funding: B. H. acknowledges funding from the Norwegian Research Council, Grant No.
-
•
Conflict of interest: The authors declare no conflicts of interest.
-
•
Authors’ contributions: S. F. and C. C. made the sample. B. H. designed the experiments. S. K. H and S. D. E. performed the experiments. M. T. performed the data analysis. J. R. M. provided theoretical support. M. T. and B. H. wrote the paper with support from all authors.
References
- (1) B. Holst and G. Bracco, Probing surfaces with thermal he atoms: Scattering and microscopy with a soft touch. In Surface Science Techniques, (Springer, Berlin, 2013) pp. 333 – 365.
- (2) L. D. Landau, L. P. Pitaevskii, A. M. Kosevich, and E. M. Lifshitz. Theory of Elasticity. Butterworth.Heinemann, 2012.
- (3) D. Akinwande, C. J. Brennan, J. Scott Bunch, P. Egberts, J. R. Felts, H. Gao, R. Huang, J. Kim, T. Li, Y. Li, K. M. Liechti, N. Lu, H. S. Park, E. J. Reed, P. Wang, B. I. Yakobson, T. Zhang, Y.-W. Zhang, Y. Zhou, and Y. Zhu. A review on mechanics and mechanical properties of 2d materials - graphene and beyond. Extreme Mechanics Letters, 13 42–77, 2017.
- (4) L. Wang, Q. Zheng, J. Z. Liu, and Q.Jiang. Size dependence of the thin-shell model for carbon nanotubes. Phys . Rev. Lett., 95:105501, 2005.
- (5) P. Pine, Y. E. Yaish, and J. Adler. Vibrational analysis of thermal oscillations of single-walled carbon nanotubes under axial strain. Phys. Rev. B, 89:115405, 2014.
- (6) Y. Huang, J. Wu, and K. C. Hwang. Thickness of graphene and single-wall carbon nanotubes. Phys. Rev. B, 74:245413, 2006.
- (7) J. Zhao, Q. Deng, T. H. Ly, G. H. Han, G. Sandeep, and M. H. Rümmeli. Two-dimensional membrane as elastic shell with proof on the folds revealed by three-dimensional atmic mapping. Nature Communications, 6:8935, 2015.
- (8) A. Al Taleb, H. K. Yu, G. Anemone, D. Farias, and A. M. Wodtke. Helium diffraction and acoustic phonons of graphene grown on copper foil. Carbon, 95:731–737, 2015.
- (9) E. Han, Y. Jaehyung, E. Annevelink, J. Son, D. A. Kang, K. Watanabe, T. Taniguchi, E. Ertekin, P. U. Huang, and A. M. van der Zande. Ultrasoft slip-mediated bending in few-layer graphene. Nature Materials, 19:305–309, 2020.
- (10) M. K. Blees, A. W. Barnard, P. A. Rose, S. P. Roberts, K. L. McGill, P. Y. Huang, A. R. Ruyack, J. W. Kevek, B. Kobrin, D. A. Muller, and P. L. McEuen. Graphene kirigami. Nature, 524:204–207, 2015.
- (11) Y. K. Shen and H. A. Wu. Interlayer shear effect on multilayer graphene subjected to bending. Appl. Phys. Lett., 100:101909, 2012.
- (12) N. Lindahl, D. Midtvedt, J. Svensson, O. A. Nerushev, N. Lindvall, A. Isacsson, and E. E. B. Campbell. Determination of the bending rigidity of graphene via electrostatic actuation of buckled membranes. Nano Lett., 12:3526–2531, 2012.
- (13) K. V. Zakharchenko, M. I. Katsnelson, and A. Fasolino. Finite temperature lattice properties of grpahene beyond the quasiharmonic approximation. Phys. Rev. Lett., 102:046808, 2019.
- (14) E. Ertekin, D. C. Chrzan, and M. S. Daw. Topological description of the stone-wales defect formation energy in carbon nanotubes and graphene. Phys. Rev. B, 79:155521, 2009.
- (15) Y. Guo, J. Qiu, and W. Guo. Mechanical and electronic coupling in few-layer graphene and hbn wrinkles: a first-principles study. Nanotechnology, 27:505702, 2016.
- (16) Y. Wei, B. Wang, J. Wu, R. Yang, and M. I. Dunn. Bending rigidity and gaussian bending stiffness of single-layered graphene. Nano Lett., 13:26–30, 2013.
- (17) X. Chen, C. Yi, and C. Ke. Bending stiffness and interlayer shear modulus of few-layer graphene. Appl. Phys. Lett., 106:101907, 2015.
- (18) P. Koskinen and O. O. Kit. Approximate modelling of spherical membranes. Phys. Rev. B, 82:235420, 2010.
- (19) K. V. Zakharchenko, J. H. Los, M. I. Katsnelson, and A. Fasolino. Atomistic simulations of structural and thermodynamic properties of bilayer graphene. Phys. Rev. B, 81:235439, 2010.
- (20) D. B. Zhang, E. Akatyeva, and T. Dumitrica. Bending ultrathin graphene at the margins of continuum mechanics. Phys . Rev. Lett., 106:255503, 2011.
- (21) B. Amorim and F. Guinea. Flexural mode of graphene on a substrate. Phys. Rev. B, 88:115418, 2013.
- (22) C. Büchner, S. D. Eder, T. Nesse, P. Kuhness, P. Schlexer, G. Pacchioni, J. R. Manson, M. Heyde, B. Holst, and H.-J. Freund. Bending rigidity of 2D silica, Phys. Rev. Lett. 120, 226101 (2018).
- (23) C. Büchner, S. D. Eder, T. Nesse, P. Kuhness, P. Schlexer, G. Pacchioni, J. R. Manson, M. Heyde, B. Holst, and H.-J. Freund. Erratum: Bending rigidity of 2D silica, Phys. Rev. Lett. 127, 029902 (2021).
- (24) S. D. Eder, S. K. Hellner, S. Forti, J. M. Nordbotten, J. R. Manson, C. Colleti, and B. Holst. Temperature-Dependent Bending Rigidity of AB-Stacked Bilayer Graphene Phys . Rev. Lett., 127, 266102, 2021.
- (25) R. Nicklow, N. Wakabayashi, and H. G. Smith, Lattice Dynamics of Pyrolytic Graphite, Phys. Rev. B, 5:4951, 1972.
- (26) M. Tømterud, S. D. Eder, C. Büchner, M. Heyde, H.-J. Freund, J. R. Manson, and B. Holst, Variation of bending rigidity with material density: Bilayer silica with nanoscale holes, Phys. Chem. Chem. Phys, 24, 17941, 2022.
- (27) C. Riedl, C. Coletti, T. Iwasaki, A. A. Zakharov, and U. Starke. Quasi-free-standing epitaxial graphene on sic obtained by hydrogen intercalation. Phys. Rev. Lett., 103:246804, 2009.
- (28) S. Forti, K. V. Emtsev, C. Coletti, A. A. Zakharov, C. Riedl, and U. Starke. Large-area homogeneous quasifree standing epitaxial graphene on SiC(0001): Electronic and structural characterization. Phys. Rev. B, 84:125449, 2011.
- (29) S. Forti. Growing Graphene on Semiconductors, pages 141–80. Jenny Stanford Publishing, 2017.
- (30) K. Liu, P. Yan, J. Li, C. He, T. Ouyang, C. Zhang, C. Tang, and J. Zhong. Effect of hydrogen passivation on the decoupling of graphene on SiC(0001) substrate: First principles calculations, Sci. Rep. 7, 8461, 2017.
- (31) S. D. Eder, B. Samelin, G. Bracco, K. Ansperger, and B. Holst. A free jet (supersonic), molecular beam source with automatized, 50 nm precision nozzle-skimmer positioning. Review of Scientific Instruments, 84:093309, 2013.
- (32) D. D. Koleske and S. J. Sibener. Generation of pseudorandom sequences for use in cross-corelation modulation. Rev. Sci. Inst., 63:3852, 1992.
- (33) R. Ramírez, E. Chacón, and C. P. Herrero, Anharmonic effects in the optical and acoustic bending modes of graphene Phys . Rev. B, 93, 236519, 2016.
- (34) D. Sánchez-Portal, E. Artacho, J. M. Soler, A Rubio, and P. Ordejón Ab initio structural, elastic, and vibrational properties of carbon nanotubes Phys . Rev. B, 59, 12678, 1999.
- (35) K. N. Kudin, G. E. Scuseria, and B. I. Yakobson, C2F, BN, and C nanoshell elasticity from ab initio computations Phys . Rev. B, 64, 235406, 2001.
- (36) E. Muñoz, A. K. Singh M. A. Ribas, E. S. Penev, and B. I. Yakobson, The ultimate diamond slab: GraphAne versus graphEne, Diamond Relat. Mater., 16, 368, 2010.
- (37) J. Tersoff, Energies of fullerenes Phys . Rev. B, 46, 15546, 1992.
- (38) Z.-C. Tu and Z.-C. Ou-Yang, Single-walled and multiwalled carbon nanotubes viewed as elastic tubes with the effective Young’s moduli dependent on layer number Phys . Rev. B, 65, 233407, 2002.
- (39) M. Arroyo and T. Belytschko Finite crystal elasticity of carbon nanotubes based on the exponential Cauchy-Born rule Phys . Rev. B, 69, 115415, 2004.
- (40) Q. Lu, M. Arroyo, and R. Huang, Elastic bending modulus of monolayer graphene J. Phys. D: Appl. Phys., 42, 102002, 2009.
- (41) P. Liu and Y. W. Zhang, Temperature-dependent bending rigidity of graphene Appl. Phys. Lett., 94, 231912, 2009.
- (42) L. Yi, Temperature dependence bending rigidity of 2D membranes: Graphene as an example, AIP Advances, 8, 075104, 2018.
- (43) S. Costamagna, M. Neek-Amal, J. H. Los, and F. M. Peeters Thermal rippling behavior of graphane, Phys. Rev. B, 86, 041408, 2012.
- (44) E. Han, J. Yu, E. Annevelink, J. Son, D. A. Kang, K. Watanabe, T. Taniguchi, E. Ertekin, P. Y. Huang, and A. M. van der Zande Ultrasoft slip-mediated bending in few-layer graphene Nat. Mater., 19, 305 - 309, 2020.