A mechanism of bar formation in disk galaxies: synchronization of apsidal precession
Abstract
We discuss the mechanism(s) of bar formation in isolated and tidally interacting disk galaxies using the results of idealized collisionless Nbody simulations of the galaxies. In order to better understand the mechanism, we investigate orbital eccentricities (), epochs of apocenter passages (), azimuthal angles at (), precession rates (), for individual stars, as well as bar strengths represented by relative Fourier amplitude () and bar pattern speeds (). The main results are as follows. A significant fraction of stars with initially different and in an isolated disk galaxy can have similar values within several dynamical timescales. This synchronization of and , which is referred to as apsidal precession synchronization (“APS”) in the present study, is caused by the enhanced strength of the tangential component of gravitational force. A weak seed bar () is first formed through APS in local regions of a disk, then the bar grows due to APS. In the bar growth phase (), APS can proceed more efficiently due to stronger tangential force from the bar so that it can enhance the bar strength further. This positive feedback loop in APS is the key physical mechanism of bar growth in isolated stellar disks. Bar formation can be severely suppressed in disks with lower disk mass fractions and/or higher parameters due to much less efficient APS. APS proceeds more rapidly and more efficiently due to strong tidal perturbation in the formation of tidal bars compared to spontaneous bar formation.
keywords:
ISM: dust, extinction – galaxies:ISM – galaxies:evolution – infrared:galaxies – stars:formation1 Introduction
Bars are the fundamental galactic structure that influence galaxy evolution in various ways (e.g., Sellwood 2014, S14). One of major aims in observational and theoretical studies of bars has been to reveal their various roles in galaxy formation and evolution. For example, previous numerical and theoretical studies of bars revealed that bars can induce the rapid inward transfer of cold gas to the inner regions of galaxies and consequently trigger gas fueling to the central starbursts and AGN (e.g., Noguchi 1989; Shlosman et al. 1989; Fukunaga & Tosa 1991; Wada & Habe 1992; Heller & Shlosman 1994; Berentzen et al. 1998; Athanassoula et al. 2013; Spinoso et al. 2017). Observational studies tried to find a physical link between recent enhanced star formation in central regions of disk galaxies and presence (or absence) of bars (e.g., Hawarden et al. 1986; Pompea & Rieke 1990; Aguerri 1999; Coelho & Gadotti 2011; Ellison e tal. 2011; Perez & Sanchez-Blazquez 2011; Fraser-McKelvie et al. 2020). Radial metallicity gradients of stars have been suggested to be flattened due to mixing of stellar populations by dynamical action of bars on stellar disks (e.g., Friedli et al. 1994).
Long-term dynamical action of bars on disk field stars can change mass, angular momentum, and energy of stars and gas: bars can be one of main drivers for secular evolution of disk galaxies (e.g., Kormendy 2013; Laurikainen et al. 2013). Resonant dynamical interaction between bars and disk field stars can be a e major mechanisms of outer rings observed in a significant fraction (%) of disk galaxies (e.g., Buta & Combes 1996). Boxy and peanut-shaped bulges can be the edge-on views of three-dimensional thick stellar bars within disk galaxies (e.g., Combes & Sanders 1981). Thus understanding the physics of bar formation and evolution can lead us further to our deeper understanding of the essential mechanisms for structures of galaxies, origin of starbursts, and bulge formation.
It has long been a key theoretical question in bar formation in what physical conditions bars are formed in galaxies (e.g., Ostriker & Peebles 1970; Athanassoula & Sellwood 1986, AS86; see a classic review by Sellwood & Wilkinson 1993). Numerical simulations have so far revealed the physical parameters of galaxies required for bar formation in disk galaxies, such as the ratio of total disk mass to the total system mass (e.g., Hohl 1976; Carlberg & Freeman 1985), degrees of random motion (e.g., AS86), initial rotation curves (e.g., Sellwood 1981; Combes & Elmegreen 1993), gas mass fractions (e.g., Shlosman & Noguchi 1993; Bournaud et al. 2005), accretion rates of cold gaseous components (Sellwood & Carlberg 1984), and the compactness of galaxies (e.g., Efstathiou et al. 1982). However, it is not so clear why these parameters can determine whether stellar bars can be formed or not. Also, although a number of the bar formation paths have been proposed, such as global bar instability (e.g., Hohl 1976) tidal interaction (e.g., Noguchi 1987; Łokas 2018, 2020), and galaxy merging (e.g., Cavanagh & Bekki 2020), it has not been clearly understood (i) what mechanisms can trigger bar formation in these formation paths and (ii) why bar properties (e.g., bar pattern speed) are different in these paths. For example, it has not yet been clarified why strong tidal force in interacting galaxies can trigger the formation of stellar bars in disks that cannot form bars in isolation (Noguchi 1987).
| Symbol | Physical meaning |
|---|---|
| bar pattern speed | |
| (apsidal) precession frequency | |
| peak in N distribution function | |
| angular frequency | |
| epicyclic frequency | |
| radial period | |
| apocenter distance | |
| pericenter distance | |
| azimuthal angle at | |
| time at | |
| orbital eccentricity | |
| azimuthal component of velocity | |
| circular velocity | |
| ratio of to | |
| number distribution of | |
| number distribution of | |
| mean of | |
| maximum of | |
| number distribution of | |
| phase space density at () | |
| phase space density at () | |
| m-th relative Fourier mode strength | |
| m=2 relative Fourier mode strength (bar strength) | |
| normalized strength of tangential force () | |
| degree of (apsidal) precession synchronization | |
| power of (apsidal) precession synchronization | |
| fraction of particles with similar | |
| disk mass fraction | |
| bulge mass fraction | |
| disk size | |
| scale length for a stellar disk | |
| dynamical time scale at |
Contopoulos (1980) and Contopoulos & Papayannopoulos (1980) investigated the orbital properties of stars in barred potentials for different bar strengths and pattern speeds and different mass distributions of the systems in order to understand the major orbital populations of bars and the physical origin of bar lengths. Although they revealed the basic orbital families of barred systems, such as “” orbits along bars and the roles of inner and outer Lindblad resonances in determining the locations and lengths of bars within disks, they did not discuss how the assumed initial bars are formed in disk galaxies. Lynden-Bell (1979, L79) proposed that initially weak stellar bars can gravitationally capture the resonant orbits of stars () to fully develop: see more discussion on six bar formation mechanisms including this orbit trapping in Lynden-Bell (1996). However, the formation mechanism for such weak bars and the preferential capture of resonant orbits by existing bars have not been investigated at all by recent numerical simulations of bar formation.
AS86 investigated whether or not random motion of stars can suppress global bar instabilities in disk galaxies using numerical simulations of four different disk models with different parameters and halo mass fractions. They also tried to find a correlation between the growth rate of the simulated bars and the net growth factor (NGF) predicted from the swing amplification theory proposed by Toomre (1981, T81). Although they found a positive correlation between the two, which is consistent with the predictions by T81, the simulated growth rates show a large dispersion for a given NFS factor, in particular, for (see their Fig. 5). Furthermore, the simulated growth rates are by a factor of smaller than the local estimates based on the swing amplification theory (their Fig. 6). This inconsistency could be due largely to the assumptions adopted in estimating the growth factors, however, the origin of the inconsistency needs to be clarified. It would be possible that the positive correlation is explained by other theories of bar formation. Thus, it would be fair to say that the physical mechanism of bar formation is yet to be fully understood.
Each star in a disk galaxy can have a Rosetta-shaped orbit in which the line connecting between apocenter and pericenter (i.e., line of apsides) slowly rotates over many dynamical timescales: this apsidal precession is simply referred to as precession in the present study, as in Binney & Tremaine (1987). The rate of this precession and and the direction of the line of apsides can be quite different between different stars in disk galaxies. Accordingly, barred disk galaxies can be described as self-gravitating systems in which (i) the directions of the lines of apsides are aligned to a large extent and (ii) precession rates of these stars are very similar (S14): disk galaxies with no bars, on the other hand, have a much smaller fraction of such synchronized orbits. In short, bar formation can be described as (apsidal) precession synchronization, which is referred to as “APS” from now on in the present study. Since APS process was not extensively investigated at all in previous numerical simulations of bar formation, it is not so clear how and why APS can occur during bar formation in disk galaxies.
The purpose of this paper is thus to investigate (i) how precession of stars can be synchronized during bar formation in disk galaxies and (ii) what causes such synchronization using idealized collisionless Nbody simulations of the galaxies. In order to do so, we investigate the orbital properties of all stars in a simulation, such as orbital eccentricities (), apocenter distances (), epochs of apocenter passages (), azimuthal angles at apocenter passages (), precession rates (), angular velocities (), radial period (). Although there are a number of bar formation paths, we focus exclusively on the bar formation through (i) global bar instability in isolated disk galaxies and (ii) tidal perturbation during galaxy interaction with companion galaxies. We mainly investigate the time evolution of , , and of stars in disk galaxies with forming bars for the two formation paths. Thus, the present study is complementary to previous theoretical studies of bar formation (e.g., L79 and T81), which did not investigate how the alignment/synchronization of and occurs during bar formation.
We consider that the tangential (azimuthal) component of gravitational force is crucial for APS in bar formation in the present study. We therefore introduce the following parameter:
| (1) |
where is the total gravitational force and is the tangential (azimuthal) component of the force. This normalized tangential force () is rather small () in the initial disk models with almost spherical dark matter halos and very smooth stellar disks (i.e., no/little local density inhomogeneity). However, as shown later in this paper, can change much more dramatically than the radial force so that it can change and of stars. We thus demonstrate how the time evolution of can cause significant changes in and in order to understand the physical origin of APS (thus bar formation).
The plan of the paper is as follows. We describe the models for disk galaxies and the methods to quantify the orbital properties of stars and the physical properties of the simulated bars in §2. We present the results of numerical simulations of bar formation and reveal the major mechanism of bar formation both for isolated and tidal models in §3. Based on these results, we discuss what determines the lengths () and the pattern speeds () of stellar bars in disk galaxies in §4. We summarize the essential mechanisms of bar formation revealed from the present simulations in §5. In this paper, we do not discuss other key issues related to bar formation and evolution, such as dynamical interaction between bars and dark matter halos (e.g., Weinberg 1985; Debattista & Sellwood 2000). and redshift evolution of bars (e.g., Abraham et al. 1999; Jogee et al. 2004; Sheth et al. 2008; Cavanagh et al. 2022).
| Model | |||||
|---|---|---|---|---|---|
| IA1 | 0.35 | 0.0 | 1.5 | 14.0 | 10 |
| IA2 | 0.04 | 0.0 | 1.5 | 14.0 | 10 |
| IA3 | 0.11 | 0.0 | 1.5 | 14.0 | 10 |
| IA4 | 0.14 | 0.0 | 1.5 | 14.0 | 10 |
| IA5 | 0.17 | 0.0 | 1.5 | 14.0 | 10 |
| IA6 | 0.25 | 0.0 | 1.5 | 14.0 | 10 |
| IA7 | 0.28 | 0.0 | 1.5 | 14.0 | 10 |
| IA8 | 0.42 | 0.0 | 1.5 | 14.0 | 10 |
| IA9 | 0.53 | 0.0 | 1.5 | 14.0 | 10 |
| IA10 | 0.70 | 0.0 | 1.5 | 14.0 | 10 |
| IA11 | 0.35 | 0.17 | 1.5 | 14.0 | 10 |
| IA12 | 0.35 | 0.3 | 1.5 | 14.0 | 10 |
| IA13 | 0.35 | 0.5 | 1.5 | 14.0 | 10 |
| IA14 | 0.35 | 1.0 | 1.5 | 14.0 | 10 |
| IA15 | 0.35 | 0.0 | 1.0 | 14.0 | 10 |
| IA16 | 0.35 | 0.0 | 2.0 | 14.0 | 10 |
| IA17 | 0.35 | 0.0 | 3.0 | 14.0 | 10 |
| IB1 | 0.11 | 0.0 | 1.5 | 19.8 | 10 |
| IB2 | 0.41 | 0.0 | 1.5 | 19.8 | 10 |
| IB3 | 0.41 | 1.0 | 1.5 | 19.8 | 10 |
| IB4 | 0.41 | 2.0 | 1.5 | 19.8 | 10 |
| IB5 | 0.33 | 0.0 | 1.5 | 19.8 | 10 |
| IC1 | 0.09 | 0.0 | 1.5 | 14.0 | 16 |
| IC2 | 0.14 | 0.0 | 1.5 | 14.0 | 16 |
| IC3 | 0.28 | 0.0 | 1.5 | 14.0 | 16 |
| TA1 | 0.35 | 0.0 | 1.5 | 14.0 | 10 |
| TA2 | 0.11 | 0.0 | 1.5 | 14.0 | 10 |
| TA3 | 0.11 | 0.17 | 1.5 | 14.0 | 10 |
| TA4 | 0.14 | 0.0 | 1.5 | 14.0 | 10 |
| TA5 | 0.17 | 0.0 | 1.5 | 14.0 | 10 |
| TB1 | 0.41 | 0.3 | 1.5 | 19.8 | 10 |
| TB2 | 0.41 | 0.5 | 1.5 | 19.8 | 10 |
| TB3 | 0.41 | 2.0 | 1.5 | 19.8 | 10 |
| TC1 | 0.09 | 0.0 | 1.5 | 14.0 | 16 |
| TC2 | 0.14 | 0.0 | 1.5 | 14.0 | 16 |


2 Models
2.1 Isolated and interacting galaxy models
We investigate the details of bar formation processes in both (i) isolated disk galaxy model and (ii) tidally interaction one, because the physical mechanism(s) of bar formation can be quite different between the two different models. Since we have used and described the details of these models in our previous papers (e.g., Bekki 2015), we give them in Appendix A. We use our original code that can be run on GPU (Graphics Processing Unit) clusters (Bekki 2013, 2015) to perform purely collisionless Nbody simulations of bar formation: the details of the code are given in Appendix A. In order to understand the physical mechanisms of bar formation more clearly, we also run comparative models with fixed gravitational potentials in addition to the above-mentioned full Nbody simulations: the details are given also in Appendix A.

2.2 Orbital properties of stellar particles
In order to better understand the bar formation processes, we investigate the orbital properties of individual stars, such as apocenter and pericenter distances of orbits ( and , respectively), azimuthal angles at and ( and , respectively), orbital eccentricities (), radial and angular frequencies ( and , respectively), and precession frequencies () in a simulation. The method to estimate the bar strengths and patter speeds and the evolution of the strengths and the speeds are given in Appendix B. Each star can have about ten apocenter (pericenter) passages at least in a simulation, these orbital properties are estimated at each apocenter passage. For example, of a stellar particle after its -th apocenter and pericenter passages is defined as follows:
| (2) |
The precession rate of a star at its -th apocenter passage is estimated as follows:
| (3) |
where and are at -th and apocenter passages, and is the radial period at the -th apocenter passage (i.e., the time interval between the two apocenter passages), which is simply defined as
| (4) |
2.3 Relative strengths of the radial and azimuthal components of gravitational force
As mentioned in §1, we investigate the relative strength of tangential component of gravitational force () for each individual stellar particle at every in a simulation in order to discuss how orbital evolution of stars can be influenced by evolving . The relative strength of the radial component is defined as follows:
| (5) |
where is the radial component of gravitational force. This does not change much (almost ) in the early disk evolution, however, can change dramatically from initially very small values () to in the final growth phases of bars. Time evolution of could be also quite different in spontaneous and tidal formation of stellar bars, which could end up with different bar properties in the two bar formation modes. In the present study, we use our original GPU-based direct Nbody simulation code that does not use the tree method adopted in our other simulations (e.g., Bekki et al. 2005). Therefore, we can more accurately estimate for all particles, which is an advantage of the present study.
2.4 Quantifying the degrees of precession synchronization
We consider that the synchronization of apsidal precession among stars in disk galaxies is one of physical processes that are crucial for bar formation. We try to quantify the degree of this synchronization by investigating the phase space density of stars ()) in the plane (). We first count the number of stellar particles for each of the grid points in the plane ( and thereby derive the phase space density as follows:
| (6) |
We here use the grid sizes of and for and , respectively, mainly because the sizes are small enough to resolve the time evolution of characteristic patterns of ).
Although there could be a number of ways to quantity the degree of APS () in the simulated stellar disks, we adopt the following method. We first count the number of stellar particles in each grid point () at each grid and estimate the mean ()) and maximum (). The degree of APS is accordingly as follows:
| (7) |
Accordingly, stellar disk with a larger number of stars with similar can have a higher value. A barred galaxy has two distinct peaks in the distribution and thus shows a high value. It should be stressed that both (i) disks with bi-symmetric spiral arms yet without bars and (ii) prolate stellar systems without figure rotation are unable to have high , though they can show high . This means that we need to investigate (not just ) in order to confirm bar formation through APS.
The time evolution rate of in a disk galaxy with a forming bar corresponds to the bar growth rate. Accordingly, the time derivation of can be used to discuss what controls the bar growth rates in disk galaxies. We here introduce the following “” parameter, which describes the power of a disk galaxy to grow its stellar bar through physical processes (e.g., global instability or tidal interaction):
| (8) |
where is not the time step width of a simulation but the time difference between two time steps at which are estimated. Since stellar bars grows slowly in most of the present models (except for the tidal models), we adopt a large of . This parameter can depend on a number of disk properties such as disk mass fractions, Toomre’s parameters, and strengths of tidal perturbation. We consider that bar growth rates can also depend on the strengths of bars (quantified by ) as follows:
| (9) |
where we derive the functional form of from the results of the present simulations. We cross-correlate between and in a simulated barred galaxy in order to discuss whether and how the bar growth rate is determined by the bar strength itself. This investigation is still useful in understanding bar formation, though many previous works already investigated the evolution of m=2 amplitudes in disk galaxies using simulations with different spatial resolutions (e.g., Dubinski et al. 2009).
2.5 Parameter study for understanding bar formation
Although we investigate the physical processes of bar formation in 35 models with different model parameters, we mainly describe the results of the fiducial model (IA1). The models are divided into the two main categories, “I” and “T” depending on whether they are for isolated or tidally interacting models, and each of the two are divided into sub-categories, “A”, “B”, and “C” depending of the details of dark matter properties. The models IA (TA) have and , which are regarded as the standard model for dark matter halos of Milky Way type disk galaxies in the present study. The models IB (TB) have and , which means that the dark matter halos are more diffuse compared to other models (i.e., is higher for a given mass of dark matter). More compact dark matter models (IC and TC) with and are investigated to discuss bar formation in low-mass disk galaxies. Three key parameters in the present study are , , and for the above 6 types of models, and the values are given for each model in Table 2.
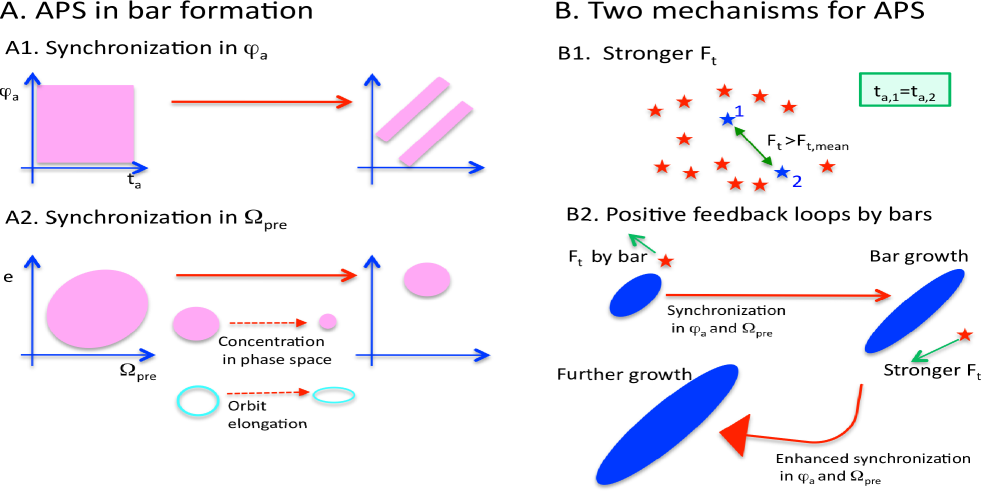
We mainly investigate the distributions of stellar particles in the two phase spaces, and , because bar formation can be clearly manifested in the strong concentration of the particles on the phase spaces. Also, stellar evolution in the two phase spaces enables us to understand how strengthened tangential components of gravitational force can cause significant changes of these four variables. Fig. 1 illustrates a major difference in the distributions of stellar particles on the plane between disks with and without bars. The significantly smaller number of grid points occupied by stellar particles in the bar model in this figure might get readers to think of analogy between bar formation and Fermi Degeneracy. Fig. 2 illustrates (A) the required synchronization of and in bar formation due to APS and (B) the strengthened as the major physical mechanism of APS.
3 Results
3.1 Fiducial model
3.1.1 Dynamics of bar formation and growth
Figs. 3 and 4 show the time evolution of the two-dimensional (2D) maps of stellar mass distributions and in the fiducial model with (i.e., bulgeless) and . The face-on views of the stellar disk clearly indicate that the disk first develops an oval-like structure in the inner region () and then a longer and stronger bar finally (). In this particular bulgeless model, strong spiral arms cannot be seen in the early dynamical evolution of the disk (), which implies that dynamical action of spiral arms on disk field stars is irresponsible for the early growth of the oval-shaped structure (and thus for the transformation from the oval to the bar).
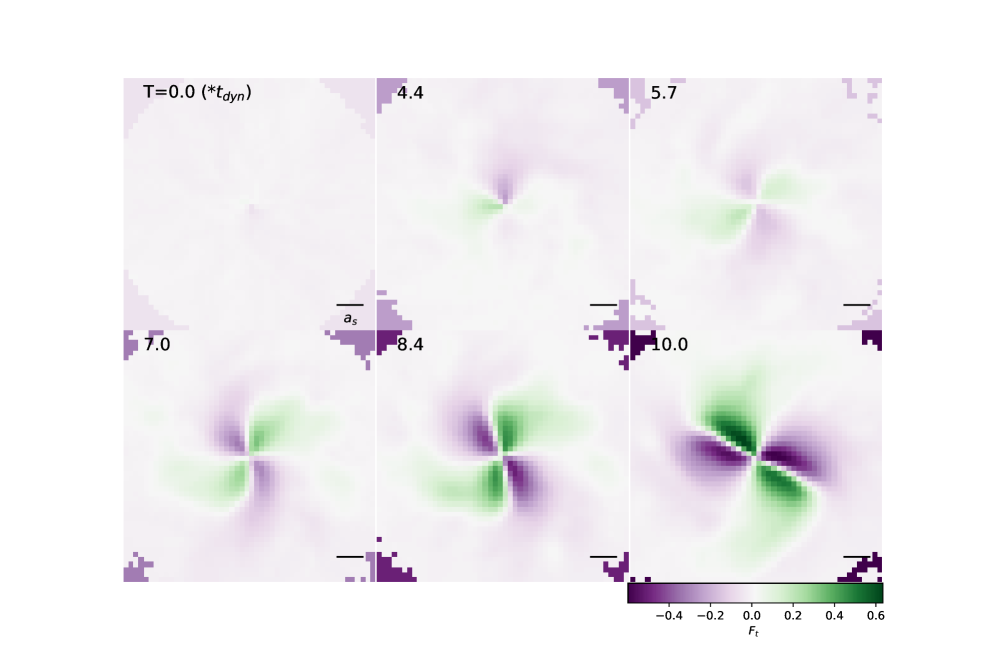
Fig. 4 demonstrates that the is rather small () in the early formation phases of the bar () owing to the weak tangential force of the disk with a seed bar. As the stellar bar grows, both the strength of and the 2D map of steadily evolves. A unique shape looking like a four-leave clover (or an isocontour of an electric quadrapole field) can be clearly seen in the 2D map of at when the bar is fully developed. Stellar particles with (azimuthal angle, ) larger than ( for the major axis of the bar) can have negative whereas those with smaller than (below the bar in the right half of this figure) can have positive . This results means that stellar particles leading (trailing) the bar can experience negative (positive) : this is quite important in bar growth, as discussed later.


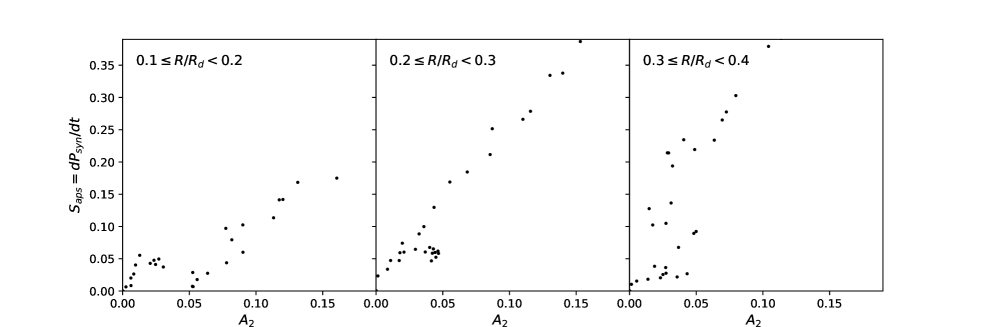
Fig. 5 demonstrates how of disk stars with can be synchronized (i.e., APS during bar formation) in the fiducial model. Below, we first describe the APS in , because the transition from unbarred to barred structures on this plane can be more clearly seen for such a radial range. Initially different stars have different and so that the phase-space distribution cannot show a striped pattern (). As APS proceeds in the disk, a striped pattern with a higher number density of stellar particles appears in the phase space (), though the pattern is not so clearly seen. The multiple stripes in this figure are all steeply inclined, and each stripe appears to consist of small rectangular-shaped regions with higher densities in the earlier evolution (). Two density peaks in this map at a given can be found in the later dynamical evolution, because the two stripes are separated by in and sharply inclined. The two peaks correspond to the two edges of the growing bar and the inclination angle of the striped pattern with respect to the axis corresponds to the pattern speed of the stellar bar. A larger number of stars can have identical due to APS in the disk so that the stripped pattern can become quite remarkable in the later phase of the bar formation (). Thus Fig. 4 demonstrates that APS during bar formation can be clearly seen in the stellar distribution in the - phase space.
However, such clear APS in the map for cannot be clearly seen in , which suggests that APS cannot proceed efficiently in the outer part of the disk. The distinct two density peaks for are weaker compared with those for in the later dynamical evolution. This result implies that APS induced by bars can proceed more efficiently in the inner region of the disk.
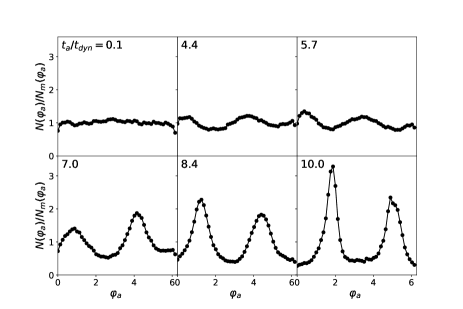
In the present study, if a stellar disk has two distinct peaks in the distribution (normalized by its mean, )) at a given , it can be regarded as having a bar at . Accordingly, we investigate when a stellar disk can have such two peaks in a simulation in order to identify the formation epoch of the seed bar. Fig. 6 shows that (i) the distribution at is initially very flat with no distinct peak and (ii) it has two clear peaks at . The two peaks become higher and narrower as the bar grows due to APS in the later epoch of bar formation (). The distribution is not so symmetric after the formation of the two peaks: this asymmetry can be seen in other radii of the disk. Such broken symmetry is a signature of a young bar that has just been formed and is still growing due to APS.
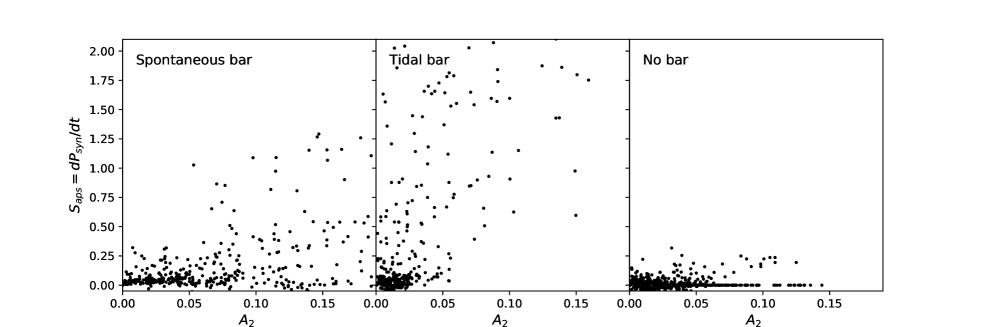
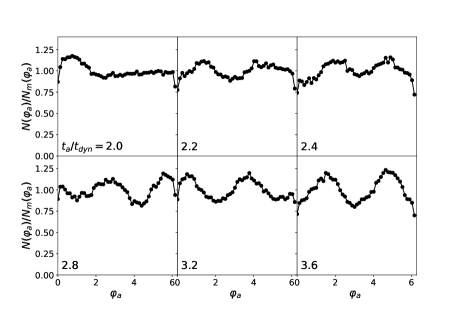
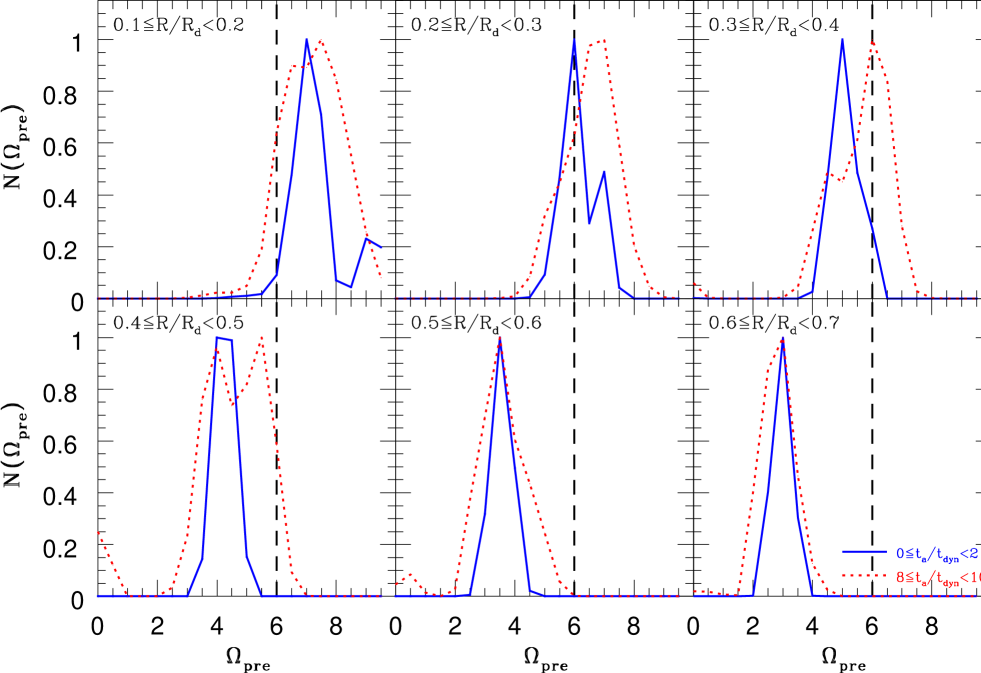
Fig. 7 indicates that the epoch of seed bar formation characterized by two distinct peaks in the normalized distribution is around for in this model. The distribution has just one strong and wide peak at (radian) at . Although it has multiple peaks at , the highest and the 2nd highest peaks are separated by radian, which is an indication of seed bar formation. The distribution shows two more distinct peaks at with the peak positions moving right from those at and . Since these two peaks can be clearly seen in the distribution at , the epoch of seed bar formation can be identified as in this model.
It should be stressed here that during the seed bar formation () is only 1.1-1.2, which is by a factor of lower than that in the fully developed bar (). Therefore, such a structure with two peaks in cannot be clearly seen as a bar in the projected distribution of stellar particles at : it might not be so reasonable to call it “bar”. Nevertheless, the seed bar can steadily grow stronger due to APS. It would be interesting that such hidden seed bars are growing in disk galaxies with apparently no clear barred structures (): it would be our future work to find a way to detect such pre-bar phases in observational images of galaxies.
Fig. 8 describes how the number distribution of of stellar particles evolves with time at different radii. needs to become smaller (larger) to synchronize with , if is larger (smaller) than . Since initial is systematically larger in the inner region of the disk for the adopted mass and rotation profiles, this means that the inner (outer) stellar particles need to decrease (increase) their through some physical processes in order to synchronize their with . Fig. 8 indeed confirms that such changes are possible for some particles at some radii. For example, the normalized ) at is initially very small () at , it can become as large as 0.6 finally. Also the normalized ) at increases from 0.3 to 1 (i.e., the maximum peak) within at . This significant increase can be seen at but cannot be seen at . Synchronization of with (i.e., APS) required for bar growth can indeed occur during the dynamical evolution of the disk, though it is limited to a certain radial range. A physical reason for no/little synchronization for is that the initial is too small to be aligned with even through the stronger tangential force of the growing bar is acting on the stars.
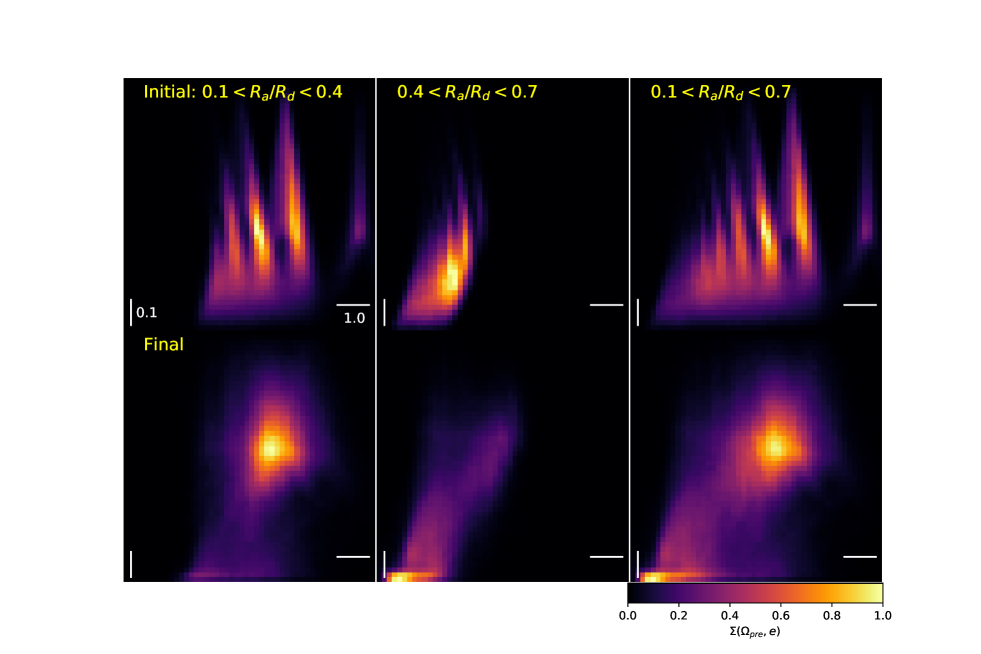
Synchronization of can be clearly seen in Fig. 9 too, which describes the distribution of stellar particles on the plane for 6 radial bins (). The initial distribution with four vertical stream-like features at the inner regions () can be transformed into a triangle-like distribution with a single strong yet broad peak during bar formation. Furthermore, the mean can become significantly larger during bar formation, which means that the orbits of stellar particles are significantly elongated during this synchronization. These results suggest that synchronization is closely associated with orbital elongation. Intriguingly, the particles with shows lower final (less elongated orbits), which suggests that the orbits are circularized during bar formation: these outer particles can gain angular momentum during bar formation. The final two peaks in this diagram for is characteristic for spontaneous bars, which reflects the differences of bars’ dynamical influences on disk particles between inner and outer disk regions.
3.1.2 Seed bar formation due to local APS
Although Figs. 6 and 7 have shown that a seed bar can be formed at , it is yet to be clarified how APS is possible in such an early dynamical phase of the stellar disk: see also Fig. B1, which indicates that the bar growth rate is quite different between () and (): As shown in Fig. 4, the tangential force () due to a bar-like structure is rather weak in the early phase of bar formation (). These results suggest that the bar formation and growth processes can be divided into the following two stages: one is “from noise to seed” stage () and the other is “from seed to fully grown” (or “seed to matured”) stage (). In the present study, we discuss the bar formation/growth processes separately for the two stages.
In order to reveal the formation mechanism of the seed bar, we select the stellar articles that constitute the seed bar at (referred to as “seed bar particles” for simplicity), and thereby investigate the orbital evolution of the particles. This investigation can reveal the initial locations of the stars and how the seed bar grows from the initial density enhancement(s) of the stellar disk. We select the seed bar particles, if of stellar particles is either (radian) or , where is the peak in the distribution (see Fig. 7) and is the second peak ( if ). Therefore, these particles are within the seed bar at . It should be noted here that we can select other seed bar particles at different times (e.g., , 2.6, etc). We here describe the results for the seed bar particles selected at (where the bar has the highest ). The time evolution of the spatial distribution of the particles projected onto the - plane is described in Appendix A.
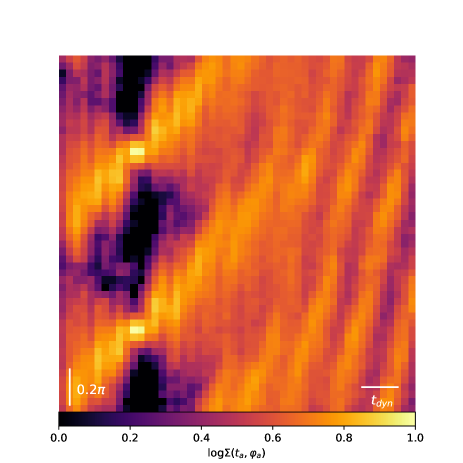
Fig. 10 shows that the seed bar particles initially have wide ranges of initial and , though there are two inclined stripe-like shapes with higher phase space densities that finally form two peaks at . This synchronization (or narrowing) of should be caused by some local physical processes, because a global bar does not exist at . After the formation of the seed bar, the particles continue to show two peaks at a given time, though the peak becomes weaker possibly due to phase mixing within the disk. The particles finally show the same pattern as seen in for all particles at (see Fig. 7).
It is important here to point out that a significant fraction of the seed bar particles at originate from the highest density peak of at and (radian). This means that such the highest phase space density can grow fastest to form (the part) of the seed bar. For a given , there is almost no difference in the surface number densities of stellar particles at different (). However, there is a very large difference (a factor of more than 10 for grid points) in the initial at different and . This difference can cause a difference in the dynamical evolution of stellar populations with different and . A key question here is as to how the synchronization of leading to the seed bar formation is possible in the local regions with initially high .
Here, we hypothesize that mutual gravitational interaction between particles with very similar at near is responsible for the synchronization of (referred to as “local APS” from now on), because stronger gravitational interaction between these particles lasts longer at : in particular, the tangential component of the force () becomes stronger. As discussed later in §4, and can be much more significantly influenced by . Therefore, strong mutual gravitational interaction between paricles at (at ) can possibly cause APS between the local particles.
In order to investigate the above hypothesis, we run comparative models in which stellar particles in a local region move under the fixed gravitational potential that is exactly the same as the initial potential of the fiducial model. The key parameter in these comparative experiments is (defined in the model section), which controls the initial fraction of stars that have a same yet different at a given : these particules do not show strong orbital alignment initially. Although there are many particles with different and in a local small area of a stellar disk, the number of stars with almost identical in the area should be small. By changing , we can possibly reveal the threshold above which stars with initially different can finally have similar due to local APS (caused by mutual gravitational interaction between local particles).
As shown in Fig. 11, the model with has a narrow peak (i.e., higher ) in the distribution, whereas the model with that does not include gravitational interaction between particles does not show such a narrow peak. These results accordingly reveal that mutual gravitational interaction between particles in a local small area is a key for the alignment of (i.e., APS). The comparative model with does not show a narrower distribution (very similar to the test particle model) whereas the model with shows the narrowing more clearly. These results imply that should be as large as for APS to be effective. Clearly, is higher for larger , though can become at most 1.8 within .
The models with smaller show narrower final distributions, and should be as small as so that synchronization can occur for . This implies that APS works only between particles with similar and similar that is determined by at a given . This also implies that APS cannot proceed so efficiently in stellar disks with higher values in which a wider range of orbits is possible (owing to more random motions of stars). Thus, these comparative experiments demonstrate that APS can proceed in a local area due to mutual gravitational interaction between the particles in the area, though needs to be smaller.

It is the tangential component of gravitational force () between the local particles that causes the local APS in these models, because the radial component () is much weaker than the gravitational force from the potential. At , particles with similar can mutually interact with one another for longer timescales so that the tangential force can change . Although this explanation would be quite reasonable, it is yet to be demonstrated in the present study why the tangential force of the particles can cause such alignment if exceeds a certain threshold value. Probably, the tangential gravitational force acting on particles can always move of the particles toward the direction of the tangential force at . In this mechanism, the change of should be proportional to the relative strength of among particles in the local area:
| (10) |
Therefore, if is positive (e.g., +0.5) , then the change of should be positive (e.g., 0.2 radian). This shift of toward the direction of tangential force could be the main physical reason for local APS. We discuss this point in §4 using idealized models.
3.1.3 Bar growth due to bar-induced APS
Fig. 12 shows that can very slowly increases during the formation/growth phases of the seed bar (), which is consistent with evolution of the stellar disk (in Fig. 5). However, can rapidly increase after , which means that the -parameter () can be significantly different between the two stages of bar formation. In order to clarify the physical mechanism of bar growth after , we investigate the correlation between and in this and other models. In the following discussion, the (two) azimuthal angles of the two edges of a stellar bar are referred to as for convenience (no distinction between the two).
Fig. 13 demonstrates that is linearly proportional to for (after seed bar formation) in the three selected radial bins, though the correlation between and is not so tight in this model. The correlation can be approximated by the following equation:
| (11) |
where and can be different in different radial bins in a same galaxy model. For example, and for in the fiducial model. Similar positive correlations between and can be seen in other models with strong bars, though the slopes () of the relations are quite different, as discussed later. It should be pointed out here that such a positive correlation cannot be clearly seen in the three radial bins for when the bar has not been developed yet. The small for is due to local APS that is less efficient than the bar-induced one.
Given that the is the time derivative of , the correlation in Fig. 13 indicates that the strength of the bar itself is a key parameter for the synchronization of during the growth stage of the bar. The radial component of gravitational force of the weak bar with cannot be significantly stronger than that of the background axisymmetric potential. Accordingly, the tangential component of the bar’s force and its time evolution should be the main cause of this correlation. As the bar in a disk becomes stronger, the tangential force of the bar becomes also stronger to influence the orbits of the disk stars more strongly. As a result of this, a larger number of stars can be gravitationally captured by the bar and also have at aligned to of the either side of the bar major axis (). Therefore, APS can proceed more efficiently in stronger bars, and more efficient APS can cause the stronger growth of bars. Thus we can conclude that this positive feedback loop is the essence of bar instability in disk galaxies.
APS due to dynamical action of growing bars themselves is quite different from local APS that can be effective during seed bar formation. It is yet to be clarified why APS can proceed more efficiently (i.e., is higher), if the tangential force is stronger (i.e., is higher). In order to solve this problem, we first need to understand why and how the tangential force of a bar can cause APS. Although it would be reasonable that (i) the tangential force of bars can act to reduce and (ii) the stronger force can trigger the greater reduction of , we currently do not have a quantitative answer for this problem. Although it is our future study to investigate how stars with different response to stellar bars with different bar strength to finally have , we discuss this issue qualitatively in §4 using idealized models.
3.2 Bar formation in other models
3.2.1 Spontaneous bar formation
The basic physical mechanisms and processes of bar formation in other isolated models with bars are confirmed to be the same as those revealed in the fiducial model: APS can be clearly seen in distribution in the early and late phases of the bar formation (i.e., higher in later phases). It is also found that bar formation is not possible or strongly suppressed (i.e., very long formation time of ) in the models with lower . For example, the maximum within in the models IA2 and IA3 with and 0.11 are 0.05 and 0.09, respectively, which means that bar formation is not possible in these models with low owing to much less efficient APS. Bars cannot be formed within in the model IA4, however, they can be slowly developed within in the model. IA6 - IA 10 all show bar formation, and the bar formation time scale is shorter for larger . No bar formation in smaller () is confirmed in the models with more diffuse dark matter halos (IB1, IB2, and IB5).
Although the central bulges can suppress the bar formation in IA12, IA13, and IA14 with larger within , a bar can be formed in the Milky Way type model IA11 ().It should be stressed that IB3 with a big massive bulge () and a higher disk mass fraction () can form a bar within (not ). These results suggest that if , then the combination of massive bulges and more compact dark matter halos (not just massive bulges alone) are required for the severe suppression of bar formation: just compact bulges alone cannot completely suppress bar formation. Such slow bar formation in IB3 is quite intriguing, because it indicates that APS is slowly ongoing in such a model. IB4 with corresponding to bulge-dominated S0 galaxies cannot show bar formation within , which may explain why the observed bar fraction in S0s is lower. IA16 and IA17 with higher () do not show bar formation, because APS can be severely suppressed by the higher degrees of random motion of stars in the models.
IC1 and IC2 with have smaller (by ) compared to those with models (IA3 and IA5) so that bar formation can be more severely suppressed. The time scale of bar formation in IC3 with is significantly longer than the fiducial model, which means that bar formation can be delayed by more compact dark matter halos. Given that disk galaxies with lower masses are more likely to have larger and smaller , these results imply that the bar formation can be severely suppressed in disk galaxies with lower masses. Strong suppression of bar formation in disks with lower , higher , and higher found in the present study were already reported in previous simulations (e.g., AS86; Efstathiou et al. 1982).
Fig. 14 demonstrates that APS is more likely to proceed effectively for larger in the isolated models with strong bar formation. The parameter can be different in different models, because the rapidity of bar formation is quite different: for example, a strong bar can be more rapidly formed due to lower stellar velocity dispersions in the model with (i.e., larger ). Clearly, the models with no bar formation do not show larger () for a given , which confirms that a strong bar cannot grow due to APS in these models. Intriguingly, the distributions on this map are quite different between spontaneous and tidal bar models in the sense that the latter can show very large () even for , when a bar is not developed at all. This is mainly because the external tidal perturbation in these tidal models is the main cause of APS (not due to the growing bar, as seen in spontaneous bar formation). Such a sharp increase in is associated with dramatic orbital elongation and loss of angular momentum of stars during tidal interaction, as discussed later in this paper.
3.2.2 Tidal bar formation
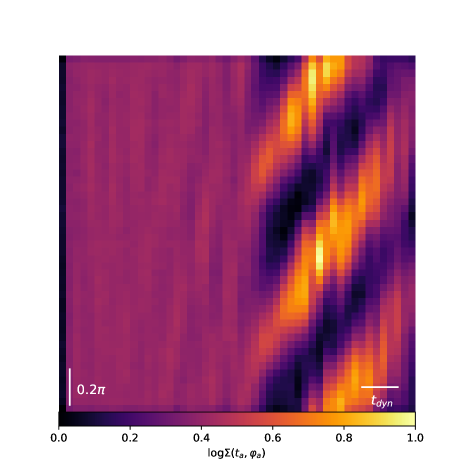
Galaxy interaction can trigger bar formation even in the disks with lower and higher for which bars cannot be formed spontaneously (e.g., Noguchi 1987). This point is confirmed in the present study: for example, TA2 can form a bar whereas IA3 cannot. Given that APS is not so efficient for lower and higher , the mechanism of bar formation in interacting galaxies should be different from that in isolated galaxies. Fig. 15 describes the 2D map of in the tidal interaction model TA1 in which the initial disk is exactly the same as that adopted in the fiducial model. There are three major differences in this map between this model and the fiducial one (compare Fig. 15 with Fig. 7). First, striped patterns appear suddenly around in the tidal model, which is in a striking contrast with the fiducial one (i.e., isolated one) in which such patterns slowly build up. This dramatic change in the 2D map is due to very rapid formation of the bar triggered by strong tidal force of the companion galaxy. Second is that the striped patterns in the tidal model are less inclined with respect to the axis (i.e., shallower slopes), which physically means lower . Such lower during tidal bar formation was already reported by a number of previous simulations (e.g., MN98). Third is that each strip is wider in the tidal model than in the isolated one. This is consistent with the morphology of the tidal bar with a fatter appearance (e.g., Noguchi 1987).
The very rapid synchronization of soon after the pericenter passage of the companion is due largely to the strong tidal perturbation of the bar to the disk particles. Such tidal perturbation can forcefully transform the initially circular disk into a very elongated structure (i.e., bar) and also align of the particles to a very narrow range of . Accordingly, the rapidity and physical mechanism of APS in this tidal bar formation are quite different from those of spontaneous bar formation. Angular momentum redistribution of stars occurs during spontaneous bar formation (as shown in the present study) whereas a large fraction of disk stars can lose their angular momentum in a tidal bar (e.g., MN98). It would be therefore possible to say that the two formation paths are different in terms of angular momentum evolution during bar formation.
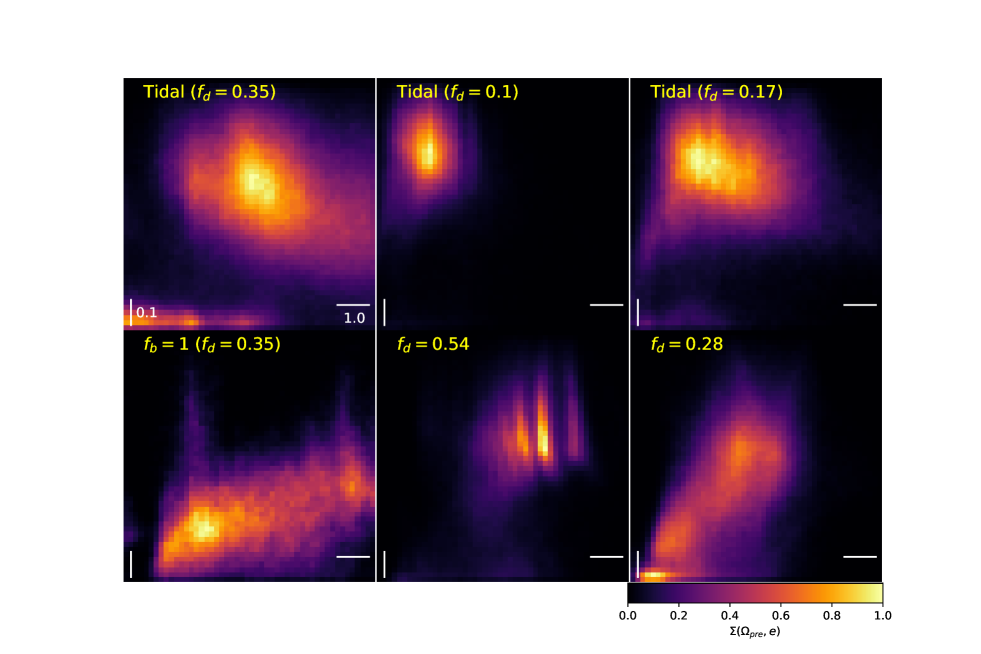
As shown in Fig. 16, there is a strong concentration of the particles in the distribution of stellar particles on the plane in the tidal bar model TA1, as is the case with the spontaneous bar formation. The details of the map in the tidal bar model, however, are significantly different from those of the spontaneous one (IA1), which reflect the difference in APS processes between the two. The slightly lower at the peak of in the tidal bar is consistent with the shallower slope of the inclined strip-patterns shown in the map for this model (see Fig. 15). The systematically higher in this tidal bar compared to the spontaneous bar is consistent with loss of angular momentum (in the tidal bar) that can cause lower . It is also confirmed in Fig. 16 that other tidal models show similarly lower and higher at the peak of , which suggests that can be low in tidal bars. Previous studies found evidence for fast bars in post-interacting and weakly interacting galaxies (e.g., Debattista et al. 2002; Cuomo et al. 2019), which is not so consistent with lower in Fig. 16. However, there is no observational study which systematically investigated the differences in between spontaneous and tidal bars: even the classification of such two different bars has not been done for the observed galaxies with bars. Therefore, it is too early to conclude that the present results are inconsistent with observations. It is quite intriguing to compare between these maps for bars and those in the models without bars in the present study. Accordingly, the details of the maps for non-barred galaxies are described in Appendix B.
Although TA3, TB1, and TB2 with compact bulges can finally form bars, TB3 (S0 model) with cannot develop a bar even after strong tidal interaction. Given that IB4 with does not show a bar either, these suggests that S0s with large bulge-to-disk-ratios cannot have bars. Previous simulations of tidal bar formation revealed the physical properties of bars and their correlations (e.g., between bar strengths and pattern speeds; Berentzen et al. 2004). It is found in the present study that stellar kinematics can be different between spontaneous and tidal bars (e.g., not so clear “S-shaped” line-of-sight velocity profiles in tidal bars). However we will describes stellar kinematics such as the 2D maps of velocities and velocity dispersion in many models with bars in our future studies, because they are not so relevant to the purpose of this paper.

4 Discussion
4.1 Physical origins of APS
We have shown that synchronization of and (i.e., APS) is strongly influenced by (i) mutual gravitational interaction of stars in local areas of disks and (ii) by gravitational fields of growing bars in the present study. However, the physical mechanism(s) of these local and bar-induced APS have not been elucidated well in this paper. In order to understand the physics of APS deeply, we need to answer the following three questions: (1) why can be influenced by gravitational interaction of local particles and growing bars (“ shift”), (2) why can be changed during the dynamical evolution of stellar disks, and (3) why and change in such a way that their dispersion, i.e., and , become quite small (i.e., synchronization).
In initial stellar disks, the radial components of gravitational force are much stronger than the tangential ones as follows:
| (12) |
As demonstrated later, evolves with time more dramatically and also can be much more strongly influenced by these local particles and growing bars compared to in the present disk galaxy models. Also cannot be significantly changed by local gravitational interaction and growing weak bars due to the dominance of dark matter in disk galaxies (except in the late phase of bar formation). We therefore consider that strengthened during disk evolution is the main causes of local and bar-induced APS in the present study. Accordingly we try to answer the above-mentioned three questions by investigating how can influence and using simple orbital calculations of stellar particles.
4.1.1 shift due to
In order to illustrate (i) how this shift can occur and (ii) how the shift depends on the strengths of external (tangential/azimuthal) force, we investigate orbital evolution of stars in a point-mass (Kepler) potential in which external gravitational force is added only to the azimuthal component of gravitational force. In the Kepler potential without external force, can never change. We therefore adopt this idealized model for orbital calculations, because it is straightforward to quantify the effects of external force on . A key parameter in this study is that is the strength ratio of the external force to the total gravitational one. The tangential force starts to influence the orbits of stars at and ends at . (given in units of ). Although is a time-dependent variable in simulations, we here assume a fixed for clarity in this orbital calculation. We show the results of the models with .
In this study, the mass, size, velocity, and time units and the gravitational constant are all given as 1 and the initial and without external perturbation are set to be 1.0 and 0.7, respectively. By changing for a given set of and , we can discuss how the tangential force influences . Initial positions of a particles, are fixed at in all models and the particles are initially at their apocenter distances (). Given that the first is 0 in the model with (i.e., no external perturbation), the second in the models with non-zero is simply the amount of shift (). Although the results depend on and , we describe the results only for the models with (corresponding to the peak in the in the fiducial model) and , (1,2), (2,3), (3,4), and (4,5) below. For these models with (), the mean of () is simply . We use these as a guide to physical interpretation of APS demonstrated for the present full Nbody simulations.
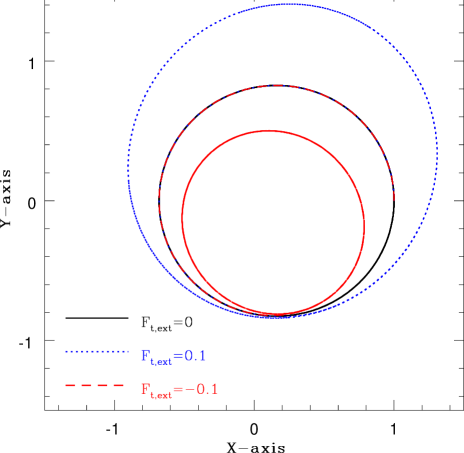
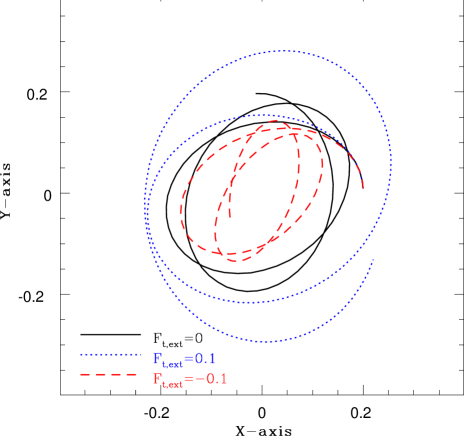
Fig. 17 shows that (i) shift can be clearly seen in the models with and (ii) the direction of the shift can be clockwise or counter-clockwise depending on the sign of . As demonstrated in Fig. 18, there is a positive correlation between and , thought it is not so strong. These results strongly suggest that the tangential component of gravitational force can play a key role in local and bar-induced APS. Also, negative tangential force can reduce the angular momentum (and kinetic energy of stars) so that can be higher (i.e., more elongated) in these orbital models, and changes () depend on too.
Although these results are based on the adopted Kepler potential, it is confirmed in the present study that , , , and can be influenced by stronger in realistic galactic potentials too. Fig. 19 shows how stellar orbits can be changed by stronger positive and negative in the fiducial model. In these orbital calculations, mass-less test particles can move around the galactic center being influenced both by the potential generated by the fixed Nbody particles and by external for : the model with =(0,1) is shown in Fig. 19. Clearly, negative can (i) elongate the orbits, (ii) shorten the radial periods of the orbits (), and (iii) make smaller. It is also found that can be influenced significantly by stronger , which is described in detail in Appendix D. These results for Kepler and more realistic galactic potential models suggest that if the net for a star becomes negative due to dynamical actions by local density enhancement or an existing bar, then the star becomes able to have an elongated orbit. Such a star with a higher can thus become the major constituent of a bar.
Although these results depend also on and (), we can discuss how , which is the difference between two consecutive apocenter passages, depends on using the models with different (0, , , , and ) and a fixed =(0,0.5). Although we did not run many models, we could find the following relation;
| (13) |
It should be stressed here that this linear relation is introduced only for the purpose of discussing the local and bar-induced APS in this paper. We need to do a thorough parameter survey in order to understand this relation.
If the outer parts of stellar disks with can experience net positive , stellar bars would not grow due to APS in the outer parts of disks, because becomes smaller: the initially lower in the outer parts needs to become larger to be similar with to join the bars. Accordingly, we need to understand how APS depends on in order to understand what determines the lengths of stellar bars. Thus both APS and elongation of orbits that are important in bar formation, and they can be caused by stronger tangential force during disk evolution.
Here we can compare in these orbital studies with the mean of (simply referred to as ) from the present Nbody simulations in order to discuss whether in the simulated galaxies can be as strong as required for shift (i.e., as large as ). Fig. 20 shows that can be as large as 0.02 during the early formation of the seed bar () in the fiducial model. Given that the test particle model shows that is almost constant and low (), the increasing in this model is due to gravitational interaction (i.e., self-gravity) between stellar particles. The stellar particles in the seed bar shows a larger compared with the mean of all particles in the fiducial model, which is consistent with the faster growth of the seed bar. in the fiducial model. It is also clear in Fig. 20 that can be significantly larger in the later epoch of bar formation, due to the stronger tangential force from the stronger bar (see Fig. 5 for the time evolution of ).
As described in Fig. 20, in the tidal bar model becomes significantly larger than that in the fiducial model, which demonstrates that much larger during tidal interaction is the main cause of APS in the tidal bar formation. This rather large can cause loss of angular momentum and significant elongation of stellar orbits, which is described in Appendix D in detail. The model with have smaller , which is consistent with no bar formation within in this model. Although we do not show the time evolution of for all models with bars, these results clearly demonstrate that stronger is a main cause for shift thus for local and bar-induced APS. Appendix E also explains why shift in bar-induced APS proceeds in such a way that (where is the azimuthal angle of the bar’s major axis) can become smaller in the present models of disk galaxies.
4.1.2 change due to
It is confirmed in the present study that can be significantly changed due largely to stronger , as long as is larger than a threshold value of this (see Appendix C for the details ). As long as is not very large (), positive can decrease both and due to increase in angular momentum. On the other hand, negative can increase both and . Even if is as small as , can be significantly changed for . These results clearly show that strengthened by local particles and growing bars are able to change .
4.1.3 Local synchronization
Now that we have shown that can change due to stronger , we need to explain why dispersions in () can be smaller in local particles with similar , as shown already in Fig. 11. We here again adopt the model with shown in Fig. 11 in order to provide a qualitative explanation for the smaller . We assume that the local area consists of two groups of stellar particles, i.e., one with initial ranging from 0 to 0.52 and the other with initial ranging from 0.52 to 1.05. We here consider mutual gravitational interaction between the two groups for convenience and clarity (not between individual particles of the two groups) and define the first and second groups’ initial as and , respectively (): the number in “()” indicates the -th apocenter passage and the first apocenter passage (i.e., ) corresponds to (start of the simulation). The two groups increase their by and , respectively, in the next (2nd) apocenter passage as follows;
| (14) |
and
| (15) |
If there is no between the two groups, then is equal to :
| (16) |
where is constant. Accordingly, can be constant () in the second apocenter passage. However, is not equal to if is not 0:
| (17) |
As shown in Fig. 18, positive and negative can lead to larger and smaller , respectively, in the second apocenter passage (i.e., larger and smaller amount of increment). Since group 1 and 2 experience positive and negative by definition, can be negative, which means that can be smaller than the initial value of 0.52 (at the first apocenter passage). Thus should be able to be smaller owing to mutual gravitational interaction between local particles with similar . In the early formation of seed bars, is yet to be synchronized. Therefore, synchronization in is due largely to dynamical action of bars on stellar particles.
5 Conclusions
Using idealized collisionless Nbody simulations of disk galaxies, we have investigated the orbital properties of the individual stellar particles and their time evolution in order to understand the physical mechanisms of bar formation. Based on these orbital properties, the number distributions of stellar particles with () and the phase space densities of stellar particles in the (i.e., ) and the planes (i.e., ) have been also investigated. Although bars can be formed from a number of galaxy-scale physical processes (global instabilities, tidal interaction, mergers, and dynamical action of triaxial dark matter halos etc), we have exclusively focused on two formation paths of bars, i.e., (i) global bar instability (“spontaneous bars”) and (ii) tidal interaction (“tidal bars”).
Our numerical simulations have investigated, for the first time, how and why the apsidal precession synchronization (“APS”) of stars can occur during bar formation in disk galaxies. This APS has been quantified by newly introduced two parameters, i.e., (i) , which is defined as the ratio of maximum to average , and (ii) () in the present study. Disk galaxies with stronger bars tend to have higher , and can be higher in bars that are more rapidly forming. These two parameters are investigated for different radii () in each bar model and cross-correlated with the physical properties of bars such as the relative amplitudes of Fourier mode (corresponding to the bar strength). The main results are as follows:
(1) APS is the main mechanism of bar formation in isolated and tidally interacting disk galaxies, though the physical processes that cause APS are quite different between these spontaneous and tidal bar formation. APS can be clearly seen in the time evolution of the map as characteristic stripped patters in these two formation paths. During and after bar formation within a stellar disk, the striped patterns can have two distinct peaks with the peak locations being roughly separated by (radian) for a given , which is a clear reflection of very similar (i.e., synchronized precession) at the two edges of the bar.
(2) Spontaneous bar formation in isolated stellar disks consists of (i) seed bar formation due to APS in local regions with higher phase space densities () and (ii) bar growth due to APS caused by existing (growing) stellar bars (). Stars with initially different yet similar in a local region of a stellar disk can have similar due to mutual gravitational interaction of the stars within a few . This relatively rapid APS is a key physical process for the formation of seed bars, though can be only moderately high (). This seed bar formation due to local APS is strongly suppressed or much delayed in disks with lower (), because is very low in such disks.
(3) Stellar disks with growing bars show a positive correlation between and , which demonstrates that APS is caused by dynamical action of existing (weak) bars on stellar orbits. APS in a growing bar physically means the alignment of of stars to the azimuthal angles of the bar’s two edges (). As a stellar bar grows (higher ), the power of the bar to align of stars to becomes greater due to the stronger tangential gravitational force (which can change significantly): bar growth can enhance further growth of bars through APS. This positive feedback loop can be called “gravitational self-proliferation” in the present study. This self-proliferation can continue until bars show their maximum possible strengths.
(4) APS in a tidally interacting pair of disk galaxies can proceed more rapidly during the pericenter passages of its companion galaxy. Accordingly, the time evolution of the map is quite different from that of isolated disk models, which confirms that bar formation mechanisms are different between the two formation paths. Stellar disks with tidal bars do not show a strong correlation between and , because bar formation processes do not depend strongly on the structures of tidally perturbed galaxies. Both and are higher in tidal interaction models than in isolated ones. The strong time-changing tidal force of galaxy interaction is the main cause of such efficient and rapid APS seen in interaction models.
(5) Thus APS in the formation of spontaneous and tidal bars has been clearly shown,
for the first time, in the present numerical simulations of disk galaxies.
The speed and efficiency of APS have been demonstrated to be different between
spontaneous and tidal bar formation, which reflects the differences in physical
processes that cause APS in the two formation paths.
APS can depend on the physical parameters of disk galaxies, such as ,
, and parameters. Therefore,
one can discuss why bars can be formed in certain ranges of these parameters
(or particular combinations of these) in the context of APS.
6 DATA AVAILABILITY
The data used in this paper (outputs from computer simulations) will be shared on reasonable request to the corresponding author.
7 Acknowledgment
I (Kenji Bekki; KB) am grateful to the referee for constructive and useful comments that improved this paper.
References
- (1) Abraham, R. G., Merrifield, M. R., Ellis, R. S., Tanvir, N. R., Brinchmann, J., 1999, MNRAS, 308, 569
- (2) Aguerri, J. A. L., 1999, A&A, 351, 43
- (3) Aguerri, J. A. L., et al., 2003, MNRAS, 338 465
- (4) Athanassoula, E., 2003. MNRAS, 341, 1179
- (5) Athanassoula, E., Sellwood, J. A. 1986, MNRAS, 221, 213
- (6) Athanassoula, E., Morin, S., Wozniak, H., Puy, D., Pierce, M. J., Lombard, J., Bosma, A., 1990, MNRAS, 245, 130
- (7) Athanassoula, E., Misiriotis, A., 2002, MNRAS, 330, 54
- (8) Athanassoula, E., Machado, R. E. G., Rodionov, S. A., 2013, MNRAS, 429, 1949
- (9) Binney, J., Tremaine, S. 1987, Galactic Dynamics (Princeton : Princeton Univ. Press)
- (10) Bekki, K., 1997, ApJ, 483, 608
- (11) Bekki, K., 2013, 432, 2298
- (12) Bekki, K., 2015, MNRAS, 449, 1625,
- (13) Bekki, K., Koribalski, B. S., Ryder, S. D., Couch, W. J., 2005, MNRAS, 357, L21
- (14) Berentzen, I., Heller, C. H., Shlosman, I. , 1998, MNRAS, 300, 49
- (15) Bournaud, F., Combes, F., 2002, A&A, 392, 83
- (16) Bournaud, F., Combes, F., Semelin, B., 2005, MNRAS, 364, L18
- (17) Buta, R., Combes, F., 1996, FCPh, 17, 95
- (18) Cavanagh, M. K., Bekki, K., 2020, A&A, 641, 77
- (19) Cavanagh, M. K., Bekki, K., Groves, B. A., 2021, MNRAS, 506, 659
- (20) Cavanagh, M. K., et al., 2022, MNRAS, 510, 5164
- (21) Carlberg, R. G., Freeman, W. L. 1985, ApJ, 298, 486
- (22) Coelho, P., Gadotti, D. A., 2011, ApJL, 743, 13
- (23) Combes, F., Sanders, R. H., 1981, A&A, 96, 164
- (24) Combes, F., Elmegreen, B. G., 1993, A&A, 271, 391
- (25) Contopoulos, G., 1980, A&A, 81, 198
- (26) Contopoulos, G., Papayannopoulos, Th., 1980, A&A, 92, 33
- (27) Cuomo, V., et al. 2019, MNRAS, 488, 4972
- (28) Debattista, V. P., Sellwood, J. A., 2000, ApJ, 543, 704
- (29) Debattista, V. P., Corsini, E. M., Aguerri, J. A. L., 2002, MNRAS, 332, 65
- (30) Dubinski, J., et al., 2009, ApJ, 697, 293
- (31) Efstathiou, G., Lake, G., Negroponte, J., 1982, MNRAS, 199, 1071
- (32) Ellison, S. L., Nair, P., Patton, D. R., Scudder, J. M., Mendel, J. T., Simard, L., 2011, MNRAS, 416, 2182
- (33) Elmegreen, B. G., Elmegreen, D. M., Chromey, F. R., Hasselbacher, D. A., Bissell, B. A., 1996, AJ, 111, 2233
- (34) Erwin, P., 2005, MNRAS, 364, 283
- (35) Eskridge, P. B., et al. 2000, AJ, 119, 536
- (36) Fraser-McKelvie, A., et al., 2020, MNRAS, 495, 4158
- (37) Friedli, D., Benz, W., Kennicutt, R., 1994, ApJL, 430, 105
- (38) Fukunaga, M., Tosa, M., 1991, PASJ, 43, 469
- (39) Garcia-Gomez, C., Athanassoula, E., Barberà, C., et al. 2017, A&A, 601, A132
- (40) Heller, C., Shlosman, I., 1994, ApJ, 424, 84
- (41) Hawarden, T. G., Mountain, C. M., Leggett, S. K., Puxley, P. J., 1987, MNRAS, 221, 41
- (42) Hohl, F. 1976, AJ, 81, 30
- (43) Jogee, S., et al., 2004, ApJL, 615, L105
- (44) Kormendy, J., 1977, ApJ, 218, 333
- (45) Kormendy, J., 2013, Secular Evolution of Galaxies, by Jesús Falcón-Barroso, and Johan H. Knapen, Cambridge, UK, Cambridge University Press, 2013, p.1
- (46) Łokas, E. L., 2018, ApJ, 857, 6
- (47) Łokas, E. L., 2020, A&A, 638, 133
- (48) Lee, Y. H., Park, M.-G., Ann, H. B., Kim, T., Seo, W.-Y.,
- (49) Laurikainen, E., et al., 2013, MNRAS, 430, 3489
- (50) Lynden-Bell, D. 1979, MNRAS, 187, 101
- (51) Lynden-Bell, D. 1996, Lecture Notes in physics, volume 474, p7
- (52) Lynden-Bell, D., Kalnajs, A. J., 1972, MNRAS, 157, 1
- (53) Manos, T., Athanassoula, E., 2011, MNRAS, 415, 629
- (54) Masters K. L. et al., 2011, MNRAS , 411, 2026
- (55) Miller, R. H., Smith, B. F., 1979, ApJ, 227, 785
- (56) Miwa, T., Noguchi, M., 1998, 499, 149
- (57) Navarro, J. F., Frenk, C. S., White, S. D. M., 1996, ApJ, 462, 563 (NFW)
- (58) Noguchi, M., 1987, MNRAS, 228, 635
- (59) Noguchi, M., 1989, A&A, 203, 259
- (60) Ostriker, J. P., Peebles, P. J. E., 1973, ApJ, 186, 467
- (61) Pérez, I.; Sánchez-Blázquez, P., 2011, A&A, 529, 64
- (62) Peschken N., Łokas E. L., 2019, MNRAS, 483, 2721
- (63) Pompea, S. M., Rieke, G. H., 1990, ApJ, 356, 416
- (64) Sellwood, J. A. 1981, A&A, 99, 362
- (65) Sellwood, J. A. 1983,JCoPh, 50, 227
- (66) Sellwood, J. A. 1989, NNRAS, 238, 115
- (67) Sellwood, J. A., 2014, ReMP, 86, 1 (S14)
- (68) Sellwood, J. A., Carlberg, R. G., 1984, ApJ, 282, 61
- (69) Sellwood, J. A., Carlberg, R. G., 1984, ApJ, 282, 61
- (70) Sellwood, J. A., Wilkinson, A., 1993, RPPh, 56, 173
- (71) Sheth, K., et al. 2008, ApJ, 675, 330
- (72) Shlosman, I., Frank, J., Begelman, M. C., 1989, Nat, 338, 45
- (73) Shlosman, I., Noguchi, M., 1993, ApJ, 414, 474
- (74) Spinoso, D., Bonoli, S., Dotti, M., Mayer, L., Madau, P., Bellovary, J., 2017, MNRAS, 465, 3729
- (75) Toomre, A., 1981, in Structure and Evolution of Normal Galaxies, ed. S. M. Fall & D. Lynden-Bell (Cambridge : Cambridge Univ. Press), 111 (T81)
- (76) Tremaine, S., Weinberg, M. D., 1984, ApJ, 282, L5
- (77) Weinberg, M. D., 1985, MNRAS, 213, 451
- (78) Wada, K., Habe, A., 1992, MNRAS, 258, 82
- (79) Weiner, B. J., Sellwood, J. A., 1999, ApJ, 1999, 524, 112
Appendix A Description of models
A.1 Disk galaxies
A disk galaxy is assumed to consist of dark matter and stars only (i.e., purely collisionless system), because we only investigate the roles gravitational dynamics of stars in bar formation in the present study. The total masses of dark matter halo, stellar disk, bulge are denoted as , , and , respectively. In order to describe the initial mass density profile of the dark matter halo, we adopt the density distribution of the so-called “NFW” halo (Navarro, Frenk & White 1996) suggested from CDM simulations:
| (18) |
where , , and are the spherical radius, the characteristic density of a dark halo, and the scale length of the halo, respectively. The -parameter (, where is the virial radius of a dark matter halo) and are chosen appropriately for a given dark halo mass (). We mainly investigate the models with and 16 in the present study.
The stellar bulge of a disk galaxy is assumed to (i) have a spherical shape with a size of and a scale-length of and (ii) be represented by the Hernquist density profile with . The adopted scaling relation between masses (or surface mass densities) and sizes for bulges is consistent with the observed one (e.g., Kormendy 1977). For example, the models with (for ) have , 0.35, and 0.49 for , 0.5, and 1.0, respectively. The spherical bulge is assumed to have isotropic velocity dispersions dependent on the distance from the bulge’s center and the radial profile is given according to the Jeans equation for a spherical system. The stellar disk with an initial mass of and an initial size of is assumed to have the standard exponential profile and the radial () and vertical () density profiles are assumed to be proportional to with scale length and to with scale length , respectively. Rotational velocity caused by the gravitational field of disk, bulge, and dark halo components, and the initial radial and azimuthal velocity dispersions are assigned to the disc component according to the epicyclic theory with a given Toomre’s “”parameter ranging from 1.0 to 3.0 in the present study. The vertical velocity dispersion at a given radius is set to be 0.5 times as large as the radial velocity dispersion at that point.
We investigate various disk galaxies models with different bulge-to-disk-mass-ratios () and disk mass fraction disk mass fraction, and and parameters. A particularly important parameter in the present study is the disk mass fraction within , which is defined as follows:
| (19) |
where and represent the total mass of a stellar disk in a disk galaxy within and that of the disk galaxy including dark matter, respectively. We mainly investigate a bulge-less disk model with , , and in the present study, and the model is referred to as the fiducial model. The number of particles and the spatial resolution of the stellar particles in the fiducial model are , , respectively. Since we focus exclusively on global dynamics (kpc-scale) of bar formation in disk galaxies, this adopted number is enough for the required spatial resolution in this investigation. The number of particles used for bulges in other models are simply proportional to , where is the number of particles used for stellar disks.
In the present study, all masses and lengths are measured in units of and , respectively, unless specified. Velocity and time are measured in units of and , respectively, where G is the gravitational constant that is assumed to be 1.0. These means that if we adopt and kpc in the fiducial model (like the Galaxy), then km s-1 and yr, respectively. The pattern speed of a bar and precession and angular speeds of stars, which are defined later, are all given in these dimensionless units (e.g., for the angular speeds, which is 6.91 km s-1 kpc-1). The mass resolution is , which corresponds to in the above specific disk galaxy mass. The size resolution for stellar particles (i.e., gravitational softening length) is (117pc for kpc), which is enough to discuss global dynamic of galaxies.
A.2 Tidal interaction
One of the two galaxies (‘primary galaxy’) in a pair of interacting galaxies is represented by the above-mentioned disk galaxy model whereas the interacting companion galaxy is represented by a point-mass particle. Although the mass-ratio of the companion to the primary () can be a free parameter, we investigate the only tidal models with , because we focus exclusively on the formation mechanism of tidal bars and its comparison with that of spontaneous bars: the details of the physical properties of tidal bars were already discussed in previous simulations (e.g., Miwa & Noguchi 1998; MW98). We investigate only “prograde interaction” models in which the spin axis of the primary in a pair of interacting galaxies is parallel to the orbital spin axis (thus tidal perturbation to the primary is quite strong). The initial distance of the two galaxies, the pericenter distance, and the orbital eccentricity are set to be , , and 1.1 respectively. The disk of the primary is included by 30 degrees with respect to the orbital plane of the interacting pair.
A.3 Simulation code
We will use our original code adopted in our previous studies (Bekki 2013, 2015) in order to perform numerical simulations of bar formation. Since the details of the simulation code used in the present study are already given in Bekki (2013), we only briefly describe the code in the present study. The code adopts a direct-summation -body algorithm for gravitational interaction between dark matter and stars. The calculation speed of a -body system is proportional to in the code, however, the speed is significantly increased by using GPU. We adopt the multiple gravitational softening lengths, i.e., the gravitational softening length () can be different for each component in a galaxy: for dark matter (), disk stars (), and bulge stars () are determined separately by the initial mean separation of each component.
Furthermore, when two different components interact gravitationally in a galaxy, the mean softening length for the two components is applied for the gravitational calculation. For example, is used for gravitational interaction between dark matter and disk stars. The code also adopts (i) the models for chemical evolution and galaxy-wide star formation, and (ii) the smoothed-particle hydrodynamics (SPH) method for following the time evolution of gas dynamics in galaxies. However, the modules of the code related to gas dynamical processes, star formation, and chemical enrichment are “switched off” in the present study, because we only analyze gravitational dynamics of disk galaxies. The roles of gas dynamics and star formation in bar formation should be discussed in our next papers, though there are many previous papers discussing how bar formation is influenced by dissipative gas processes and star formation (e.g., Shlosman & Noguchi 1993; Bekki 1997; Bournaud & Combes 2002).
A.4 Comparative models with fixed potentials
In order to understand the physical mechanisms of bar formation more clearly, we run the following comparative models with fixed gravitational potentials in addition to the above-mentioned full Nbody simulations. We consider that APS needs to proceed locally through dynamical processes in stellar disks when the disks have no global stellar bars. It would be possible that stars with initially slightly different in local regions with higher mass densities (or phase densities) can finally have similar (and ) due to their mutual gravitational interaction within local regions. This local APS can end up with the formation of seed bars from noisy initial distribution of stars in disks. In order to demonstrate that APS can really proceed in local regions with higher mass densities of stars, we run “fixed potential models” in which (i) the initial mass distributions of stars and dark matter do not evolve with time at all and (ii) “local particles” are newly added to a narrow area of the above-mentioned full Nbody disk in the fiducial model. In these comparative experiments, only the local particles can move under the fixed potential. and their orbits are investigated to derive and of the particles. In the present study, these local particles do not necessarily mean mass-less particles that do not mutually interact with other particles. Instead, local particles with masses are assumed to be gravitationally influenced both by other local particles and by the fixed gravitational potentials of the disks. We also run models in which local particles do not have masses (i.e., test particles) in order to understand the roles of mutual gravitational interaction of the particles in local APS.
These local particles are distributed in a small portion of the exponential disk of a galaxy. The local particles are distributed in a local area with and (i.e., in an arc-like region of the disk). The initial distribution are drawn from the initial distributions of the Nbody disk model. They are assumed to be at their apocenter distances initially (i.e., ) and have their initial velocities () of where is the circular velocity at their initial and is defined as follows:
| (20) |
We show the new results only for the models with for all stellar particles, mainly because the results are more than enough to demonstrate the roles of self-gravity among local particles in APS (i.e., synchronization of ). We also investigate more realistic models in which different stars have different at in order to understand how local APS depends on the dispersion in orbital properties of particles. The models with dispersions in (denoted by )) being 0.01, 0.03, 0,1, 0.2, and 0.3 are mainly investigated.
We consider that the ratio of the total mass (number) of the local particles in the local area to that of the same local area including all components (dark matter, disk, bulge) in the fixed Nbody disk is also a key parameter denoted as . We therefore investigate the time evolution of distribution functions for models with different to confirm that the distributions have sharper peaks in the later phase of orbital evolution of local particles. In order to derive a reasonable range of in the fiducial model, we here calculate for a given and at each time step () as follows. First, we count the number of particles with ranging from to at each and bin and divide the number by the total number of particles located at and (at the time step ). Accordingly this fraction corresponds to the number fraction of stars that have passed their apocenter within at each time step ().
We confirm that is quite different at different , , and in the fiducial model and accordingly consider that is a key parameter that can control the formation of seed bars in stellar disks. The average value at () is 0.28 in the fiducial model:
| (21) |
About 30% of stars with different and can pass through their apocenters at . We thus try to demonstrate that mutual gravitational interaction between particles with similar at near apocenters can be crucial in the formation of seed bars by investigating the models with different in these comparative experiments.
Appendix B Quantification of bars

B.1 Bar strength and pattern speed
Although there are a number of ways to quantify the strength of a stellar bar (e.g., Lee et al. 2020), we adopt the relative Fourier amplitude ( as the bar strength as done in other previous simulations (e.g., Athanassoula et al. 2002). We investigate the relative Fourier amplitudes at each radius (), as follows:
| (22) |
where , , and are the Fourier coefficients estimated at from the projected surface density in the polar coordinate. These coefficient are given as follows:
| (23) |
| (24) |
| (25) |
In order to estimate the pattern speed of a bar at each radius ((R)) in a simulation at each time step, we estimate the phase of the component at each time step (;
| (26) |
The bar pattern speed at -th time step is therefore derived as follows:
| (27) |
where and are estimated at -th and ()-th time steps, respectively, and is the time step width.
B.2 Definition of seed bar formation
A disk galaxy would develop a very weak bar initially, and the “seed bar” grows though some physical processes in the disk. As described later, the strength of this seed bar is crucial in the later bar growth processes in the present study. We therefore need to define the epoch of seed bar formation in order to demonstrate how the bar is formed. However, it would be fairly ad hoc for the present study to use the parameter (e.g., ), which is often used for the strengths of stellar bars both in observations and simulations, to define the bar formation epoch. We consider that when a disk has a seed bar, then (i) there should be two distinct peaks in the distribution and (ii) the two peaks are separated roughly by radian. Accordingly, we try to find the bar formation epochs in the simulated disk galaxies based on these two requirements.
B.3 Evolution of and
As shown in Fig. B1, of the stellar bar (i.e., bar strength) rapidly increases after in the fiducial model, however, a bar-like shape cannot be clearly seen at and . This means that it is difficult to find morphological evidence for “pre-bar” phases (or “seed bar” phases) in the observational images of disk galaxies by human eye inspection. If disk galaxies with apparent no bars and observed at different redshifts () can be selected as “pre-bar” galaxies, then one can discuss the redshift evolution of the number fraction of forming bars. The bar growth rate, (i.e., slopes in the evolution), is significantly different between (shallower) and (steeper), which indicates the two stages of bar formation. Fig. B1 also clearly demonstrates that other even modes, , 6, and 8 can start to grow significantly later than bar mode. This result suggests that (also and ) can be used to measure the dynamical ages of stellar bars: younger bars that have formed recently can have smaller , for example. The physical reason for this time evolution of mode ratios is yet to be clarified, however.
Fig. B2 shows rapid changes of during the early dynamical evolution () in this model, because a seed bar is not so fully developed that the phase () cannot be accurately defined. Clearly, estimated at () and () becomes almost identical only after when the seed bar starts to grow rapidly (see Fig. B1). In this bulgeless model, is slightly lower than at , which is consistent with derived in many previous simulations (e.g., Sellwood 1981). Given that is much larger than , it is not be possible that the bar gravitationally captures the resonant orbits of stellar orbits to grow stronger: the mechanisms proposed by L79 does not work in this model. Instead, other mechanisms need to be responsible for the bar formation with at , as discussed later in this paper.
B.3.1 A correlation between bar pattern speeds and peak precession rates
Fig. B3 shows a positive and almost linear correlation between and at the peaks of distributions () in the models in which strong bars are developed. Although the correlation is not so strong with a significant dispersion in for a given , this result indicates that can be determined by initial from which can be estimated directly. As shown in Fig. 16, detailed morphological properties of particles distribution on the plane is quite diverse, which reflects the differences both in the initial distributions and the bar formation processes (e.g., tidal or spontaneous bar formation).


Appendix C maps in other models
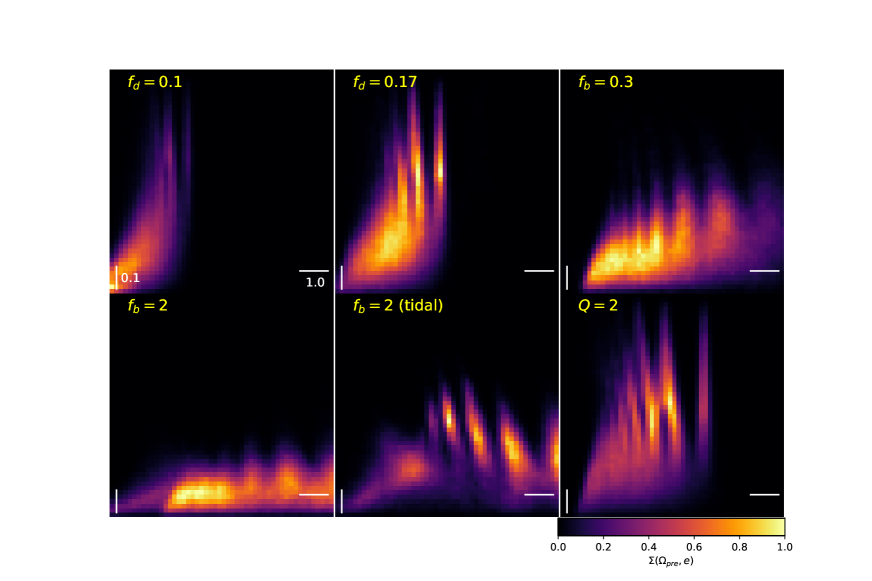
It is clearly shown in the main text that APS is responsible for the formation of a strong single peak in the 2D map for a simulated disk galaxy: this single peak can be regarded as a signature of bar formation due to APS. Since the time evolution of maps in the simulated disk galaxies with bars is well presented and discussed in the main text, here we focus mainly on the results for disk models without bars. Fig. C1 describes the maps for six models in which stellar bars cannot be formed within . Clearly, all of these models do not show single strong peak in the map as the models with bars show. Instead, they all show multiple stripe-like patterns in the map, which is a clear indication that APS cannot proceed efficiently in the stellar disks. The models with lower disk mass fractions ( and 0.17) cannot form bars mainly because the weaker self-gravity of the disks cannot allow local APS to work to form seed bars. The central compact bulge in the model with can also severely suppress APS mechanisms so that a bar cannot be formed within . It should be stressed here that no bar formation in disks with lower and higher was already pointed out by previous studies (e.g., see a review by Sellwood 2015). The present study clearly visualize this no formation of bar in the maps.
It is intriguing that both isolated and tidal interaction models have no bars if is as large as 2. As a result of this, a single peak characteristic for bar formation due to APS cannot be seen in the maps of these two models (see Fig. C1). Given that these models are for bulge-dominated S0s, these results indicates that bar formation due to spontaneous bar instability and tidal interaction is unlikely in S0s thus provides a physical reason why the bar fraction in S0s is small both in observational studies and in cosmological simulations (e.g., Cavanagh et al. 2022 for recent discussion on this topic). It can be seen clearly, however, that the orbital eccentricities of stars () in the tidal model become significantly higher: local APS do not work to form seed bars though. The model with higher (=2) cannot form a bar, which is consistent with lack of a single peak (i.e., no APS) in the map of the model in Fig. B1. Thus, the results of these six models with no bars clearly demonstrate that APS is one of essential ingredients in bar formation.
Appendix D A physical origin of change
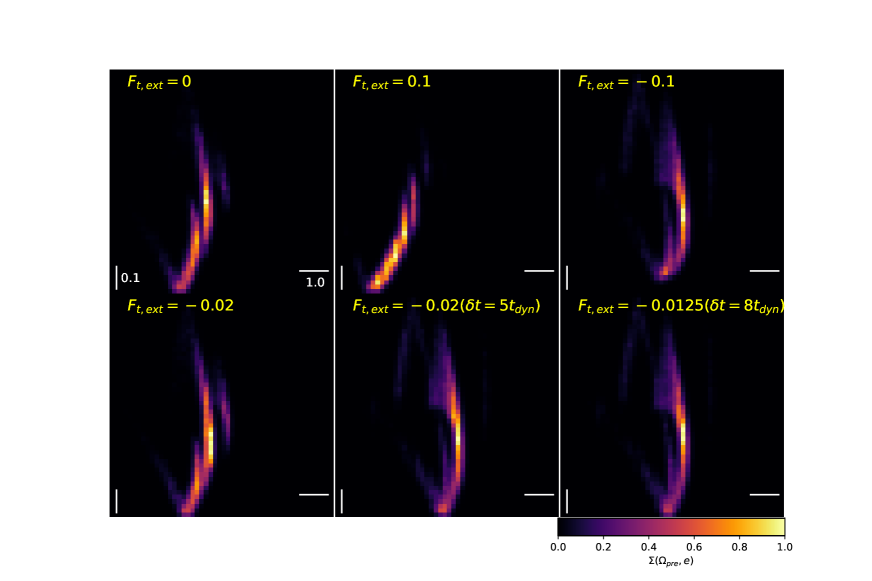
Although We have already shown how and can be influenced by external gravitational force (), we have not shown how can be influenced by in the main text. In the models described in the main text, this is fixed to be whereas is changed in different models. We here consider that a change of depends on multiplied by as follows;
| (28) |
Therefore, we investigate models with different and using the fiducial model below Fig. D1 describes how the distribution of test stellar particles with in the map Fig. D1 describes how the distribution of test stellar particles with in the map depend on and . In these six models, test stellar particles can move under the fixed gravitational potential generated by Nbody particles of the fiducial model: they do not mutually interact through gravity. Therefore, the effects of mutual gravitational interaction of the particles on their orbital evolution are artificially “switched off” so that the effects of external force can be on and can be clearly inferred in these models. It is assumed that and its dispersion are 0.7 and 0.3, respectively, for these stellar particles.
Fig. D1 describes the results of the three models with (no external gravitational force), 0.1 (positive tangential force), and (negative one) in which is . This figure clearly shows that positive (=0.1) can shift stellar particles toward lower and lower on the map due largely to the increased total angular momentum of the particles. On the other hand, the particles are moved toward higher without any significant change of in the model with negative (-0.1). If of a barred disk galaxy is larger than of its stars, then the stars need to increase to match with (i.e., to join the bar). The results in Fig. D1 suggest that the stars can join the bar if they experience negative from the existing bar: stars with , on the other hand, need to experience positive from the bar to align with the bar.
Fig. D1 also describes how influence the evolution of stellar orbits on the map in the models with . The distribution of stellar particles on the map in the model with and is almost identical to that of the model with . However, the density peak in the map is moved toward higher in the model with and in which is the same as that in the model with and . This result implies that needs to be larger for a certain period of time in order for external gravitational force to change effectively. This value of can be achieved for mutual gravitational interaction of local high-density regions in stellar disks, as demonstrated in the main text. Fig. D1 also shows that if pretty weak can influence stellar orbits for a longer time scale (), then their can be changed significantly by such weak force. Thus it can be concluded that strengthened tangential/azimuthal component of gravitational force by local density enhancements and existing bars is the main cause of changes that are necessary to APS.
Appendix E Bar-induced synchronization
It needs to be clarified why shift in bar-induced APS proceeds in such a way that can become smaller. This is a complicated problem, because this alignment process of to depends on orbital parameters of stars and bar pattern speeds (e.g., such as ). We here quantify at two consecutive (-th and -th) apocenter passages of stars at and in a growing bar by adopting the following assumptions for clarity: (1) the bar major axis is aligned with the -axis at (i.e., ), (2) , (3) and are constant and similar initially (), and (4) stars are within or near the bar region. In this qualitative discussion, the difference in between a star and the bar at -th apocenter passage () is simply . At -th apocenter passage, it is described as follows:
| (29) |
where is the difference between two consecutive apocenter passages and is the radial period of a star. If there is no (bar’s)
| (30) |
Accordingly,
| (31) |
because of . This means that does not change at all. However, as shown in Fig. 23, this can change depending on the sign and the magnitude of . For (i.e., star leading the bar), is negative (see Fig. 4) so that can be smaller than by a small amount of (). Accordingly, ) for is as follows:
| (32) |
Therefore, it follows from these equations that
| (33) |
If (the bar leading stars), then the net due to the bar’s gravitational force can be positive. Therefore can be larger than , which means that . Clearly, these discussion is valid only for , and we did not consider that net effect on the long-term orbits of stars depends on how long the stars lead or trail the bar. It is possible that the “donkey effect” (Lynden-Bell & Kalnajs 1972) can influence the time duration when a star leads/trails the bar (due to positive or negative by the bar). More quantitative discussion needs further investigation of evolution as a function of , , and of stars and .
It also needs to be clarified why become small due to dynamical action of bars on stars. As discussed in Appendix C, can change significantly due to stronger (), if stars can experience such tangential force (due to bar in this discussion) for certain duration of time. Accordingly, if , the net needs to be positive so that can become smaller (to be more similar to ). On the other hand, If , the net needs to be negative so that can becomes larger. As shown in Fig. 8, a fraction of stellar particles with decrease their to be more similar to . Also, a significant fraction of stellar particles with increase their to be more similar to in Fig. 8. Thus, a very qualitative explanation for this evolution of depending on is that net of stars with different can depend largely on their (that depends on ). It is our future study to provide a more quantitative explanation for the bar-induced APS for the formation of bars with different bar properties (lengths, pattern speeds, and shapes etc).