Collective enhancement in nuclear level density of 72Ga and its effect on 71Ga(n, )72Ga capture cross-section
Abstract
The -gated proton spectra measured in the reactions 64Ni(9Be, p2n)70Ga and 64Ni(9Be, pn)71Ga, have been utilized to obtain the nuclear level density (NLD) of 71Ga and 72Ga nuclei by using the statistical model (SM) calculations. It is seen that the -gated proton spectrum are reasonably explained by using the large value of the inverse level density parameter ( = 11.2 MeV) in the NLD prescription of the Fermi gas (FG) model. The large value of is indicative of the rotational enhancement, which is consistent with the earlier results in other mass regions. Furthermore, a rotational enhancement factor has been included in the NLD and used in the SM calculation keeping the systematic value of =8.6 MeV and it explains the -gated proton spectrum nicely. The result clearly indicates the presence of collective enhancement in NLD. Subsequently, the NLD with collective enhancement has been utilized in the TALYS calculation, for the first time, to calculate the 71Ga(n, )72Ga capture cross-section. It is observed that, while the FG model without the collective enhancement in the NLD for 72Ga under predicts the capture data, with the rotational enhancement correction the FG model over predicts the data by similar amount at higher energies. However, in the energy range of 0.01 MeV to 0.1 MeV, the FG model corrected for rotational enhancement describes the data quite well. Thus, the present work indicates that collective enhancement, whenever required, should be taken into account fro proper description of low energy capture cross section data.
keywords:
Nuclear level density, Collective enhancement , neutron capture cross sectionThe basic understanding of a quantum many-body system such as an atomic nucleus is highly crucial to unfold the chemical evolution of the Universe in its present state. To perceive the characteristics of the atomic nucleus, usually it is brought under small external perturbations. Nuclear level density (NLD) is one of the important physical quantities in order to understand the response of an atomic nucleus to such external perturbations [1, 2]. Level density, defined as the number of excited levels per unit of excitation energy for a nucleus, plays an important role as one of the key ingredients in the statistical model description of low energy nuclear reactions. Consequently, the knowledge of NLD is also important in the modeling stellar nucleosynthesis and evolution [3]. However, NLD provides the highest uncertainties in estimating the reaction cross-section for production of stable and unstable nuclei in the nucleosynthesis process. Reliable nuclear level densities are therefore very crucial in the determination of nuclear reaction rates in the field of nuclear astrophysics [4, 5]. In addition, the enhancement in the NLD due to collective degrees of freedom (such as rotation and vibration) i.e collective enhancement [6, 7, 8, 9] is another puzzling topic [8]. The collective enhancement present in the NLD, especially around the particle separation energy, could have a significant role in the particle capture cross-sections. Therefore, an accurate extraction of the NLD using a reliable experimental technique is essential to constrain the quantity in estimating the important low energy capture reaction cross-section as precisely as possible.
Neutron capture on 71Ga is one of the important astrophysical reactions in the s-process, which not only determines the abundances of gallium isotopes but also affects the abundances of the elements up to zirconium [10]. Gallium is mostly produced by the weak s-process that takes place in massive stars of more than eight solar masses during convective helium-burning (at temperatures T 30 keV) and shell carbon burning (at T 90 keV) [10]. A recent simulation indicates that a 50 change in the neutron capture cross section on one gallium isotope changes the s-abundances of all the following isotopes in shell carbon burning by up to 20 [11]. In addition, there are three discrepant experimental results on the neutron capture cross-section on 71Ga at 25 keV [12, 13, 14].
The primary goal of the present work is clearly two fold. First, to investigate the collective enhancement in the NLDs of deformed nuclei 72Ga and 71Ga by using the evaporation particle-gamma coincidence technique. Secondly, to use the extracted NLD of 72Ga isotope in the statistical model description of 71Ga(n,)72Ga capture cross sections by upgrading the statistical model code TALYS [36] to include the effect of collective enhancement in the NLD prescription.
Experimentally, the precise measurement of NLD is a very difficult task due to the lack of suitable techniques. The density of low lying excited levels of the nucleus (small in number, well separated, and simple in nature) is generally measured directly by counting the levels [15] and from neutron resonance studies [16]. Whereas, the Oslo technique based on particle-gamma coincidence [17], the two-step cascade method [18], the -Oslo method [19], the gamma-ray calorimetry [20], etc, are used to estimate the level density especially up to the particle separation energy. Another approach to estimate the level density below as well as above the particle threshold energy is the particle evaporation technique [21, 22, 23, 24, 25]. In this technique, the evaporated particles (neutron or proton or alpha) are measured and compared with the statistical model calculations using the different formalisms for level density such as FG (Fermi gas), Gilbert-Cameron, etc. The parameters characterizing the level density of each formalism are varied to explain the evaporated particle spectrum and the study yields the level density of the corresponding residual nucleus.The main concern with the particle evaporation technique is to measure the particles from compound nuclear reactions, which can be confirmed by measuring the particles at backward angles and studying the angular distribution of the emitted particles in light-ion induced reactions [21, 22, 23, 24, 25]. Very recently, we adopted a new approach to select the evaporated particles only from compound nuclear reactions by using the gamma-gated particle spectra [26]. The same approach, as discussed in Ref. [26] has been used in the present work.
In this work, we have measured the -gated evaporated protons coming from the reactions 64Ni(9Be, p2n)70Ga and 64Ni(9Be, pn)71Ga. Particle-gamma coincidence has been performed to eliminate the events from target contamination and pre-equilibrium emission. The -gated proton spectra have been utilized to obtain the level densities of residual nuclei. The obtained level density for 72Ga has further been used to calculate the 71Ga(n,) capture reaction cross-section as a function of neutron energy.
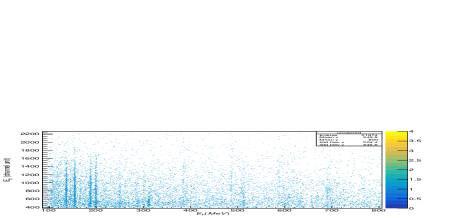
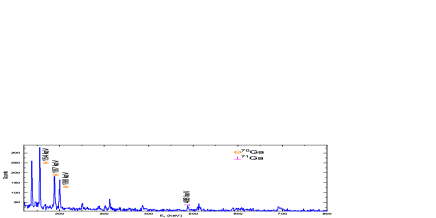
The 9Be beam of 30 MeV energy with an average current of 5 nA from BARC-TIFR Pelletron Linac Facility, Mumbai, was used to bombard a self-supporting 64Ni target of thickness 500 g/cm2, populating the 73Ge compound nucleus (CN). The outgoing protons were detected by using CsI(Tl) detectors with the angle of coverage from 22∘ to 67∘. The 14 Compton-suppressed Clover detectors were used to detect the de-exiting discrete -rays coming from the residual nuclei. XIA-LLC-based digital data acquisition system was used to store the data in list mode. Tantalum foil of thickness 30 mg/cm2 was used to stop the elastically scattered events from entering the detectors. The proton spectrum is calibrated using 229Th source with pulse height defect correction based on light output vs. energy data of CsI(Tl) in Ref.[27]. Multi parameter time stamped based coincidence search program (MARCOS) [28] was used to construct the p- matrix as shown in Fig. 1. From this matrix, proton yield spectra were extracted gated by characteristic 154.9 (5- 4-), 187.6 (4- 2-), 198 keV -rays from the residual 70Ga nucleus and 488 keV -ray from 71Ga nucleus [29]. Finally, the -gated proton spectra are added after efficiency correction ( YTotal= + + + ) to visualize the shape of the final proton spectrum with higher statistics as shown in Fig. 2. The quantities, and Yi, are the detection efficiency of ith -ray and the yield of proton that are in coincidence with the -ray.
In order to investigate the NLD of residual nuclei, the -gated proton spectrum has been compared with the statistical model calculations using the code CASCADE [30] with the Fermi-Gas (FG) model of NLD given by
| (1) |
where, UE∗SpP, E∗ and J are the initial excitation energy and the angular momentum of the nucleus, respectively, , with Ieff, Sp and P being the effective rigid-body moment of inertia, the proton separation energy and the pairing energy respectively. The quantity in Eq.1 is the level density parameter. Ignatyuk prescription [31] of level density parameter , which takes into account the shell effects as a function of excitation energy is adopted and it is expressed as
| (2) |
where, asymptotic level density parameter = A/ and is the inverse density parameter. is the ground-state shell correction defined as the difference of the experimental and theoretical (liquid drop) masses. The inverse of in the exponent of Eq.2, given by = is the rate at which the shell effect is damped with the increase in excitation energy. The optical model potential parameters for proton transmission coefficient are taken from Refs. [32]. The moment of inertia of the CN is taken as ), where (= ) is the moment of inertia of a spherical nucleus, (= 1.0 10-4) and (= 2.0 10-6) are the deformability parameters, r0=1.25 fm is the radius parameter and is the total spin of the nucleus. It is seen that the choice of proton optical potential has negligible effect on the slope of the spectrum. The deformability parameters have also negligible effect on slope ( change from 10-6 to 10-4 and change from 10-8 to 10-6). The slope of the spectrum mainly depends on the inverse level density parameter , which is generally varied to explain the evaporated particle spectrum by using minimization technique.
The -gated proton spectrum along with the statistical model calculations is shown in Fig. 2. It is observed that the systematic value of (8.6 MeV) is unable to explain the experimental data above 10 MeV as shown in Fig. 2(a). Indeed, a large value of (11.2 MeV) is required to explain the experimental data considering the emission of first chance protons from CN as shown in Fig. 2(a). This observation is consistent with the previous results obtained in refs. [6, 7]. The Ground-state quadrupole deformations of 71Ga and 72Ga are -0.207 and -0.215, respectively as have been reported by P. Moller et. al [33]. Moreover, rotational bands have also been observed up to the 4.2 MeV excitation energy in 71Ga [34]. One can expect also a rotational band structure at high spin in 72Ga.Therefore, a rotational enhancement in the Gallium isotopes is in agreement with the structural study. So the collective enhancement due to ground state deformation of residual nucleus could be the possible reason for this large value. On the other hand, as the evaporated proton spectrum is gated with the -rays of 70Ga and 71Ga residual nuclei, it could also contain the contributions of protons coming out after one or two neutrons (1n or 2n) are emitted from the CN. Therefore, a statistical model calculation has been carried out by using =11.2 MeV to obtain the proton spectrum after 1n and 2n emissions and compared with the experimental data as shown in Fig.2(b). It should be mentioned that the same normalization has been used in each case (protons from the first chance, protons after 1n emission, and protons after 2n emission) while comparing with the experimental data. It is seen that there could have been some contributions of protons after 1n emission. However, the proton after 2n emission is negligibly small as shown in Fig. 2(b).
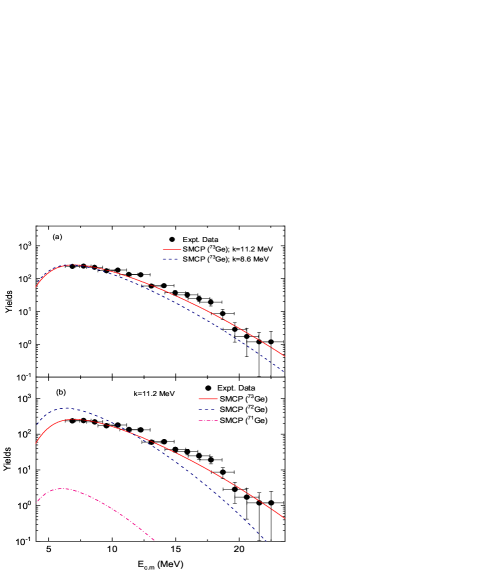
A large value of = 11.2 MeV from the previous statistical model analysis with FG model for NLD and the bumps around the centre of mass energies of 12 MeV and 15 MeV, could be a possible reason for the existence of collective enhancement in NLD due to the deformation of the residual nuclei. In a subsequent analysis, the -gated proton spectrum has been compared with the statistical model prediction of proton (SMCP) spectrum by including collective enhancement factor in NLD of 72Ga residual nucleus as shown in Fig.3. The model calcualtion has been carried out by considering 1st chance proton emission with the systematic value of =8.6 MeV (which best explains the low energy part of the proton spectra below 10 MeV) and a rotational enhancement factor () has been inlcuded as =, where is intrisic level density. The factor Krot is introduced with the intrinsic single particle level density to consider the contribution of rotational enhancement factor in the NLD. Microscopic shell model studies [6] have predicted that for nuclei with finite ground state deformation, rotational collectivity causes large enhancement of NLD (K 100). With increasing excitation energy, the deformation effect gradually dies down due to the intrinsic motion. The deformed shape of the residual nucleus changes into spherical shape and rotational levels die out. Due to this shape transition, fade out of collective enhancement in NLD is observed after a certain excitation energy. The energy dependent Fermi function has been used in the rotational enhancement factor given as
| (3) |
| (4) |
The spin cut off parameter, is replaced by T, where T [=] is nuclear temperature and is treated as the magnitude of the enhancement parameter. The parameters , Ecr and dcr are generally varied to explain the experimental data. It is observed that the the experimental data below 10 MeV and above 13 MeV are nicely described by the result of the statistical model calcualtion considering the first chance protons and including the rotational enhancement in NLD of 72Ga, as shown in Fig. 3(a). However, the experimental data in between 10 to 13 MeV centre of mass energy cannot be explained. The conjecture is the presence of protons from 2nd chance emission in that energy domain. Therefore, the proton spectrum has also been calculated considering the level density and including the rotational enhancement factor of 71Ga residual nucleus and shown in Fig. 3(b). Finally, the 1st and 2nd chance statistical model calculated proton (SMCP) spectra are added with weightage obtaining the total yield as Ytotal= Y(1st chance) + Y(2nd chance), which nicely explains the -gated proton spectrum as shown in Fig. 3(b). A minimization procedure, with parameters from two rotational enhancement factors corresponding to the NLDs of residual nuclei 72Ga and 71Ga and the weight factor in the total yield, has been carried out to fit the experimental spectrum. The best fit parameters of the rotational enhancement factor in NLD are =4.0 0.5, Ecr=14 0.6 MeV and dcr=0.8 0.1 MeV for 72Ga, and =5.0 0.5, Ecr=19 0.7 MeV and dcr=0.7 0.12 MeV for 71Ga and the weight factor =0.3. The fit clearly indicates that the collective enhancement in NLD due to the deformation of residual nucleaus is required to explain the experimental data. The nuclear level densities of the residual nuclei 72Ga and 71Ga including the collective enhancements used in the statistical model calculation for explaining the -gated spectrum are shown in Fig. 4. The NLD of 72Ga is normalized with the experimental NLD at Sn obtained from neutron resonance spacing [35].
In Fig. 4, two different model nuclear level densities have been plotted to compare with the present level densities of 72Ga and 71Ga and also compared with the cumulative level distribution computed from the levels given in the RIPL-3 [15] at low excitation energy. The constant temperature (CT) model, which is known to best describe the level densities in the low excitation energy domain up to the particle threshold energy, is represented by solid curve. Also, shown the prediction of FG model with the systematic value of the parameter = 8.6 MeV and not including the collective enhancement contribution (dashed line). The CT model level density is given as = e, where T and E0 are free parameters. It should be mentioned that the systematic values of CT model parameters (E0=-2.44 MeV, T=0.92 MeV), obtained from the fitting of the NLD data from RIPL-3 and the data at the neutron separation energy (Sn [35] are used while comparing with the level density of 72Ga from the present work. As the experimental NLD of 71Ga at Sn (from neutron resonance studies) is not available, the present NLD of 71Ga is normalized with the results obtained from CT model by using the value of E0=-2.5 MeV, T=0.99 MeV based on RIPL-3 data. The important aspects of the comparisons in Fig. 4 should be emphasized here. It is seen that the extracted density that includes the enhancement effect follows the trend of the CT model prediction locally around the normalization point at Sn. However, with increasing excitation energy beyond the neutron separation energy, as the collective enhancement effect wanes, the NLD from the present work deviates from CT model prediction and gradually coincides with the prediction of FG Model without enhancement using =8.6 MeV. Thus, the excitation energy dependence of the extracted NLD, , matching the CT prediction at lower excitations and that of the FG model prediction without the deformation effect at higher excitations, indicates that the consideration of rotational enhancement in NLD can play a significant role in the low energy neutron capture process.
given in RIPL-3 [15]
Furthermore, the collective enhancement in NLD has been included in TALYS 1.95 code [36], for the first time, to investigate the effect of collective enhancement in NLD on neutron capture cross-section. A rotational enhancement function for 72Ga nucleus has been included in the FG model prescription of NLD = in TALYS 1.95 code to estimate the 71Ga(n, )72Ga capture cross-section by using the systematic value of inverse level density parameter (k = 8.6 MeV). In the TALYS code, default global neutron optical model potential has been used for 71Ga+n and a generalized Lorentzian form [42] of E1 -ray strength function has been considered for 72Ga. It is found that (Fig. 5), the NLD without the collective enhancement underpredicts the neutron capture cross-section data, while the inclusion of collective enhancement in NLD can explain the data much better, especially in the low excitation energy domain. The lower and upper limit (red dashed line in Fig. 5) of the present cross-section arises due to the uncertainties of parameters characterizing the collective enhancement function as discussed earlier. As can be seen from Fig. 5, the neutron capture cross-section with including collective enhancement is 2.1 times greater than that of FG model with systematic LD parameter in the energy range of 25 - 90 keV and matches the data quite well in the low energy region. At higher energies the capture data, however, fall within the lower limit of the curve including the enhancement effect. It should be mentioned here that there exists some difference in the relative normalization between the different capture data sets. If the normalization is properly taken care of, the matching with the present calculation will improve further. The present result indicates that with the inclusion of collective enhancement in the NLD, the calculated 71Ga(n, )72Ga cross-sections are closer to the direct measurement data. In the low excitation energy domain, there are three discrepant results for 71Ga(n, )72Ga cross-sections at 25 keV, which are 104 14 mb [12], 140 30 mb [13] and 75 10 mb [14]. Interestingly, the result at 25 keV from the present work is consistent with the result obtained in Ref. [13]. It is worthwhile to mention that overall in the low energy region, which is of astrophysical importance, the NLD with the collective enhancement that explains the proton evaporation spectrum, better describes the available neutron capture data. It should be added that the -ray strength function could also play an important role to estimate the neutron capture cross-section. Therefore, level density and -ray strength function are both essential to estimate the astrophysical reaction cross-section as precisely as possible.
In summary, the measured -gated proton spectrum is predominantly from the compound nuclear process, which is ensured by the coincidence measurement with selected rays from the residues of p2n and pn channels following the 9Be+64Ni reaction. The gated proton spectrum has been utilized to obtain the level densities of residual nuclei (72Ga and 71Ga). It is observed that collective enhancement factors due to the deformation of residual nuclei are required to be included in the NLD prescription of the Fermi-Gas (FG) model to explain the experimental -gated proton spectrum. Furthermore, the obtained level density for 72Ga has been used in the TALYS reaction code to calculate the 71Ga(n, ) 72Ga capture cross-section. It is seen that NLD with collective enhancement explains the neutron capture data better than the NLD without collective enhancement. The present results indicate that collective enhancement in NLD could play an important role in order to understand the production of nuclei through the neutron capture process precisely. Therefore, a systematic and exclusive investigation is required in near future to understand the effect of collective enhancement on neutron capture cross-section to provide a reliable prediction of astrophysical abundances.
Acknowledgements
We would like to thank Dr. D. Pandit, VECC for his help and advice in this project. Authors thank the BARC-TIFR PLF staff for uninterrupted, steady beam during the experiment.This work is supported by the Department of Atomic Energy, Government of India (Project Identification No. RTI 4002), and the Department of Science and Technology, Government of India (Grant No.IR/S2/PF-03/2003-II).
References
- [1] A. Bohr and B. R. Mottelson, Nuclear Structure (Benjamin,New York, 1969), Vol. 1.
- [2] H. A. Bethe, Phys. Rev. 50, 332 (1936); Rev. Mod. Phys. 9, 69 (1937).
- [3] T. Rauscher et al., Phys. Rev. C 72 (2005), 044311.
- [4] T. Rauscher and F. K. Thielemann, At. Data Nucl. Data Tables 75, 1 (2000).
- [5] T. Rauscher, Friedrich-Karl Thielemann,Karl-Ludwig Kratz, Phys. Rev. C 56, 1613 (1997).
- [6] K. Banerjee et al., Physics Letters B 772 (2017) 105–109.
- [7] D. Pandit et al. Phys. Rev. C, 97(2018) 041301(R).
- [8] D. Pandit et al., Physics Letters B 816 (2021) 136173.
- [9] G. Mohanto et al., Phys. Rev. C 100, 011602(R) (2019).
- [10] P. A. Seeger, W. A. Fowler, and D. D. Clayton. The Astrophysical Journal, Supplement 11, 121 (1965).
- [11] M. Pignatari et al.. The Astrophysical Journal 710, 1557 (2010).
- [12] R. Anand, M. Jhingan, D. Bhattacharya, and E. Kondaiah. Nuovo Cimento 50A, 247 (1979).
- [13] R. L. Macklin, N. H. Lazar, and W. S. LYON, Phys. Rev., 107, 504 (1957).
- [14] A. K. Chaubey and M. L. SehgaL, Phys. Rev., 152, 055 (1966).
- [15] R. Capote et al., Nuclear Data Sheets 110, 12, 2009(3107-3214).
- [16] J. R. Huizengaand, L. G. Moretto, Ann. Rev. Nucl. Sci. 22, 427 (1972).
- [17] A. Schiller, et al., Nucl. Instrum. Methods Phys. Res., Sect. A 447 (2000) 498.
- [18] F. Becvar et al., Phys. Rev. C 46, 1276 (1992).
- [19] A. Spyrou, et al., Phys. Rev. Lett. 113 (2014) 232502.
- [20] J. L. Ullman et al., Phys. Rev. C 87, 044607 (2013).
- [21] A. V. Voinov et al., Phys. Rev. C 74, 014314 (2006).
- [22] Balaram Dey, et al., Phys. Rev. C 96 (2017) 054326.
- [23] A.P.D. Ramirez, A.V. Voinov, S.M. Grimes, A. Schiller, C.R. Brune, T.N. Massey, Phys. Rev. C 88 (2013) 064324.
- [24] A. P. D. Ramirez, A. V. Voinov, S. M. Grimes, Y. Byun, C. R. Brune, T. N. Massey, S. Akhtar, S. Dhakal, and C. E. Parker., Phys. Rev. C 92, 014303 (2015).
- [25] Y. Byun, A. P. D. Ramirez, S. M. Grimes, A. V. Voinov, C. R. Brune, and T. N. Massey., Phys. Rev. C 90, 044303 (2014).
- [26] R. Santra et al., Physics Letters B 806 (2020) 135487.
- [27] D. Dell’Aquila, et al., Nucl. Instrum. Methods A 929, 162-172 (2019).
- [28] R.Palit, et al., Nucl. Instrum. Methods A 680,90 (2012).
- [29] S. E. ARNELL, H. LINUSSON and Z. SAWA, Nuclear Physics A 166 (1971) 241-252.
- [30] F. Puhlhofer, Nucl. Phys. A 280, 267 (1977).
- [31] A. V. Ignatyuk, G. N. Smirenkin, and A. S. Tishin, Sov. J. Nucl. Phys. 21, 255 (1975).
- [32] F. D. Becchetti, Jr. and G. W. Greenlees, Phys. Rev. 182, 1190.
- [33] Moller, P.Nix, J.R.Myers, W.D.Swiatecki, W.J., Atomic Data and Nuclear Data Tables 59, 185 (1995).
- [34] I. Stefanescu, et al., PHYSICAL REVIEW C 79, 064302 (2009).
- [35] Till von Egidy and Dorel Bururescu, Phys. Rev. C 72, 044311 (2005).
- [36] A.J. Koning, S. Hilaire and M.C. Duijvestijn, “TALYS-1.95”, Proceedings of the International Conference on Nuclear Data for Science and Technology, April 22-27, 2007, Nice, France, editors O.Bersillon, F.Gunsing, E.Bauge, R.Jacqmin, and S.Leray, EDP Sciences, 2008, p. 211-214.
- [37] Junhua Luo et. al, Nuclear Science and Engineering: 172, 122–126(2012).
- [38] A. G. Dovbenko, V. E. Kolesov, V. P. Koroleva, V. A. Tolstikov, Soviet Atomic Energy 26, 82–85(1969).
- [39] Yu. Ya. Stavisskii and V. A. Tolstikov, At. Energy., 7, 259 (1959).
- [40] G.Petö, Z.Miligy, I.Hunyadi, Journalof Nuclear Energy 21, 797-801(1967).
- [41] W.S. Lyon and R. L. Macklin, Phys. Rev. 114, 6(1959).
- [42] J. Kopecky and M. Uhl, Phys. Rev. C 41, 1941 (1990).