Predicting Brain Age using Transferable coVariance Neural Networks
Abstract
The deviation between chronological age and biological age is a well-recognized biomarker associated with cognitive decline and neurodegeneration. Age-related and pathology-driven changes to brain structure are captured by various neuroimaging modalities. These datasets are characterized by high dimensionality as well as collinearity, hence applications of graph neural networks in neuroimaging research routinely use sample covariance matrices as graphs. We have recently studied covariance neural networks (VNNs) that operate on sample covariance matrices using the architecture derived from graph convolutional networks, and we showed VNNs enjoy significant advantages over traditional data analysis approaches. In this paper, we demonstrate the utility of VNNs in inferring brain age using cortical thickness data. Furthermore, our results show that VNNs exhibit multi-scale and multi-site transferability for inferring brain age. In the context of brain age in Alzheimer’s disease (AD), our experiments show that i) VNN outputs are interpretable as brain age predicted using VNNs is significantly elevated for AD with respect to healthy subjects for different datasets; and ii) VNNs can be transferable, i.e., VNNs trained on one dataset can be transferred to another dataset with different dimensions without retraining for brain age prediction.
††footnotetext: Submitted to 2023 IEEE International Conference on Acoustics, Speech, and Signal Processing.Index Terms— Graph convolutional network, covariance matrix, brain age, Alzheimer’s disease, biomarkers.
1 Introduction
Ageing is a biologically complex process marked by progressive anatomical and functional changes in the brain [1]. Critically, individuals age at different rates, captured by so-called “biological aging”, and accelerated aging (e.g., when biological age is greater than chronological age) is a precursor for cognitive decline and age-related phenotypes like dementia [2]. Therefore, age-related biological changes are not uniform across the population. Hence, understanding the biological mechanisms of the aging brain is widely relevant because of their implications on quality of life and clinical interventions in vulnerable populations [3].
Different neuroimaging modalities provide complementary insights into the changes of the brain due to pathology and healthy ageing [4, 5]. Indeed, various statistical approaches to derive biomarkers of pathology from neuroimaging datasets have been widely studied in the literature [6]. The biomarker of interest in this paper is the brain age gap, i.e., the difference between the predicted biological age and the chronological age. The brain age gap for a pathology can be conceptualized as a scalar representation of the accumulation of longitudinal atypical changes in the brain leading to the pathology [7]. Existing studies have reported an elevated brain age with respect to controls for various neurodegenerative conditions, including Alzheimer’s disease [7] and schizophrenia [8].
Inferring brain age from different neuroimaging modalities, including structural magnetic resonance imaging (MRI), functional MRI, and positron emission tomography, has been an active area of research [9, 10, 11, 12, 13, 14]. The statistical approaches utilized for predicting brain age are usually specialized to the input structure (for e.g., convolutional neural networks for raw MRI images [9, 10]). In this paper, we aim to predict brain age using cortical thickness measures derived from structural MRI images. The cortical thickness measures correspond to different brain regions that are pre-defined according to a brain atlas used in the processing of the MRI images [15]. Cortical thickness measures evolve with normal ageing [16] and are affected due to neurodegeneration [17]. Thus, the age-related and disease severity related variations also appear in anatomical covariance matrices evaluated from the correlation among the cortical thickness measures across a population [18].
Neuroimaging data analyses face challenges due to limited sample size, high cost of data acquisition, and heterogeneity in datasets due to induced inter-site and inter-scanner variability [19]. To tackle such challenges, existing studies deploy techniques from meta learning and transfer learning to develop data-efficient and compatible algorithms [20, 21]. Specifically, transfer learning is closely related to domain adaptation, where the inference algorithm trained on a source domain is fine tuned for performance in a target domain [20]. In [21], learnable brain atlas transformations are studied to combine datasets organized according to different brain atlases.
In our recent work, we have studied coVariance neural networks (VNNs) that derive their architecture from graph convolutional networks [22] and operate on the sample covariance matrix as a graph [23]. VNNs have two key features: i) VNN outputs are stable to perturbations in the covariance matrices; and ii) VNNs can be transferable to datasets of dimensions different from that of the training set while preserving performance. Both these features translate into significant advantages in terms of generalizability and reproducibility over traditional data analysis approaches like principal component analysis and regression that are typically used for the analysis of cortical thickness data [18, 13, 14]. The notion of transferability in this paper is derived from the properties of coVariance filters whose parameters do not depend on the covariance matrix and therefore, the VNNs can be transferred to a dataset of a different dimension. Hence, the notion and implementation of transferability in this paper is distinct from the approaches in [20] and [21]. Our contributions in this paper are summarized below.
Contributions: We study a VNN-based framework for brain age prediction on various datasets consisting of controls, subjects with mild cognitive impairment (MCI) and subjects with Alzheimer’s disease (AD), where MCI is an intermediate clinical stage between no cognitive impairment and AD [24]. We consider two independent datasets with cortical thickness features extracted according to distinct brain atlases or templates. One dataset is a multi-scale cortical thickness dataset curated according to different resolutions of Schaefer parcellation [25]. In this context, our observations are as follows:
1. Interpretablity: Brain age predicted using VNNs is significantly elevated for AD with respect to controls and the brain age for the MCI cohort is intermediate between AD and controls. This observation is qualitatively consistent with the findings of other brain age approaches in the literature [11]. Furthermore, our results show that brain age gap correlates significantly with clinical dementia rating (CDR), which is a marker of dementia severity [26]. These findings imply that brain age predicted using VNN is a potential biomarker for AD and clinically interpretable.
2. Transferability: The proposed brain age prediction framework exhibits multi-scale transferability, i.e., it can be transferred across the different scales of the multi-scale dataset with no retraining and minimal deviation in performance. Moreover, in contrast to existing frameworks that rely on atlas transformation for transfer learning or domain adaptation between neuroimaging datasets [21], we show that the VNN-based framework is transferable for brain age prediction while preserving interpretability without any learnable atlas transformation.
2 Setting
In this section, we briefly discuss the preliminaries of the cortical thickness datasets. We denote the number of subjects in the dataset by . For every subject, we have mean cortical thickness data available at distinct cortical regions. Therefore, for a subject , we have a vector of mean cortical thickness data and their chronological age . Using the samples , the covariance matrix is evaluated as
| (1) |
where is the sample mean of samples and is the transpose operator. Furthermore, we also investigate brain age prediction on a multi-scale cortical thickness dataset described next.
Multi-scale Cortical Thickness Dataset: In a multi-scale setting, the cortical thickness data across the whole brain is available at different scales or resolutions. Examples of brain atlases that allow multi-scale brain parcellations include Schaefer’s atlas [25] and Lausanne atlas [27]. A multi-scale brain atlas partitions the cortical surface into variable number of regions at different scales. For a multi-scale dataset with scales, let the dimension of cortical thickness at -th scale be denoted by . In the -th scale, the cortical thickness data for subject is given by . Subsequently, we denote the covariance matrix at scale by , where is evaluated from according to (1). Therefore, a multi-scale cortical thickness dataset from subjects is represented as . Next, we discuss the framework for brain age prediction using VNNs.
3 Methods
We start by discussing the architecture and the notion of multi-scale transferability of VNNs.
3.1 coVariance Neural Networks
VNNs inherit the architecture of graph convolutional networks and therefore, consist of a bank of convolutional filters and pointwise non-linear activation function. The convolutional filters for VNNs, referred to as coVariance filters, operate on the sample covariance matrix. If dimensions of the data can be considered as individual nodes of an undirected graph, the covariance matrix represents its adjacency matrix, where the off-diagonal elements of represent the linear relationship between different dimensions of the dataset.
3.1.1 Architecture
Analogously to a graph convolutional filter that combines information according to the graph topology, we define coVariance filter as
| (2) |
where parameters are scalars and referred to as filter taps. Accordingly, the output of the graph filter for some data is given by . In a single layer of VNN, the coVariance filter output is further passed through a non-linear activation function (e.g. ), such that, the output of a single layer VNN with input is given by , where is a pointwise non-linear function, such that, for .
To incorporate sufficient expressive power in the VNN architecture for a learning task, in practice, a VNN may consist of multiple layers and parallel features per layer to form filter banks at every layer. For a VNN layer with features at input, such that, , and features at the output, such that, , the relationship between the -th output and the input is given by
| (3) |
Finally, the node-level features at the output of the final VNN layer are aggregated via unweighted mean, thus, rendering the VNN architecture to be permutation invariant. We denote the VNN architecture using the notation , where is the set of all filter taps associated with the coVariance filters in all layers of the VNN. For a supervised learning objective with a training dataset , the filter taps in are chosen to minimize the training loss, i.e.,
| (4) |
where is the mean squared error (MSE) loss function that satisfies iff .
3.1.2 Transferability of VNNs
The filter taps in the graph filter in (2) are independent of the dimension of the covariance matrix. Therefore, in the multi-scale setting, we can readily replace the covariance matrix at scale , i.e., in with to process the cortical thickness data at scale using VNN trained at scale . The VNN with filter taps is transferable in the multi-scale setting if the difference between the outputs and for subject is bounded. This notion is formalized in the following definition.
Definition 1 (Transferable coVariance Neural Networks).
Consider a multi-scale dataset , where and . A VNN architecture with a set of filter taps is transferable between data and if we have
| (5) |
where is some finite constant, is the sample covariance matrix for data and is the sample covariance matrix for data .
Existing studies report the transferability property to hold for GNNs between graphs that are sampled from the same limit object (graphon) [28]. Since the multi-scale dataset (described in Section 2) involves a variable number of partitions of the same surface across scales, we anticipate VNNs to be transferable for applications involving such datasets. The implication of the permutation-invariance of VNNs is that the cortical thickness datasets curated according to different brain atlases or templates do not have to be aligned for (5) to hold. Therefore, we will also investigate whether transferability exists for datasets of different dimensions collected from independent sites. Moreover, the property of transferability enables VNNs to be computationally efficient (for instance, by training on low resolution data and deploying on high resolution data) [23].
In this paper, we deploy VNN as a regression model to learn the relationship between cortical thickness and chronological age, thus, capturing the variations in cortical thickness due to ageing. The details on the evaluation of brain age and using it as a biomarker of pathology are discussed next.
3.2 Brain Age Evaluation and -Age
The gap between estimated brain age and the chronological age is a biomarker of pathology [7]. Using VNNs, we obtain an estimate for chronological age . However, there may exist a systemic bias in the gap between and , where the age is underestimated for older subjects and overestimated for younger subjects [29]. Such a bias may exist, for example, when the correlation between VNN output and chronological age is smaller than 1. In practice, this age bias can confound the interpretations of brain age. Therefore, to correct for age-related bias, we adopt a linear model based post hoc bias correction approach from the existing literature [30]. Under this approach, we follow the following bias correction steps on the VNN estimated age to obtain the brain age for a subject with chronological age and cortical thickness data :
Step 1: Fit a linear regression model to determine and in the following model:
| (6) |
Step 2: Obtain corrected predicted age or brain age as follows:
| (7) |
Therefore, forms the brain age after bias correction for a subject with chronological age . The gap between and is the biomarker of interest which is defined below.
Definition 2 (-Age).
In our experiments, we obtain VNN estimates on the combined dataset of healthy subjects and pathological subjects. The age-bias correction in (6) and (7) is performed over healthy subjects to account for bias in the VNN estimates due to healthy ageing and applied to the pathological cohort. Further, the distributions of -Age are obtained for healthy controls and pathological subjects. -Age for subjects with pathology is expected to be elevated as compared to healthy subjects.
4 Results
In this section, we discuss our experiments on brain age prediction for different datasets using the methodology outlined in Section 3. The datasets consist of heterogeneous populations of healthy subjects (HC), subjects with MCI, and subjects with AD. We consider the following datasets:
Multi-scale FTDC Datasets: These datasets consist of the cortical thickness data extracted at different resolutions from healthy subjects (HC; , age = years, 101 females), subjects with MCI (MCI; , age = years, 22 females), and subjects with AD (AD; , age = years, 30 females). For each subject, we have the cortical thickness data curated according to multi-resolution Schaefer atlas [25], at 100 parcel, 300 parcel, and 500 parcel resolutions. Accordingly, we form three datasets: FTDC100, FTDC300 and FTDC500, which form the cortical thickness datasets corresponding to 100, 300 and 500 features resolutions, respectively. For MCI and AD subjects, we also have the CDR sum of boxes scores. CDR sum of boxes scores are commonly used in clinical and research settings to quantify dementia severity. A higher CDR score is associated with cognitive and functional decline [31].
ABC Dataset: This dataset is collected from a population of subjects, which is composed of healthy subjects (HC; subjects, age = years, 116 females), subjects with MCI (MCI; , age = years, 18 females), subjects with AD (AD; , age = years, 23 females), and remaining subjects with other forms of dementia. For each subject, joint-label fusion [32] was used to quantify mean cortical thickness in cortical regions.
Our goal is to evaluate whether the VNN-based brain age prediction framework outputs can act as biomarkers of disease in AD or MCI. For this purpose, we focus on group differences in -Age for HC, MCI, and AD for all experiments and the correlation of -Age with CDR scores. To determine the success of transferability, we evaluate if group differences in -Age are retained and if the -Age scores correlate with CDR scores after transferring the model. In Section 4.1, we provide the experimental details and results for the brain age prediction task on FTDC300 and ABC datasets. The performances reported in this section correspond to the training performance. In Section 4.2, we leverage the transferability of VNNs to test the brain age prediction models from Section 4.1 for multi-scale and multi-site transferability.
4.1 Brain Age Prediction using VNN
We first evaluate the proposed VNN-based framework for brain age prediction on FTDC300 and ABC datasets. The VNN models are trained using two distinct approaches for FTDC300 and ABC datasets. For FTDC300, we train VNNs to predict chronological age using only HC cohort. In contrast, for ABC dataset, we use the complete, hetereogeneous dataset for training VNNs. The former approach is more commonly used, while the latter has been used to disentangle neurodegeneration from healthy ageing [33]. The subsequent steps to evaluate the brain age for HC, MCI, and AD cohorts are the same in both approaches.
FTDC300 Dataset: The VNN is trained as a regression model between cortical thickness and chronological age using data from only HC cohort. For this purpose, we randomly divide the HC cohort in a train/validation/test split. The sample covariance matrix is evaluated from the training set and normalized, such that its largest eigenvalue is . For FTDC300, the VNN model consists of -layer architecture, with filter taps per layer, features per dimension for dimensions in both layers, and is trained using mean squared error as the loss function. The learning rate for the Adam optimizer is . The hyperparameters for the VNN architecture are chosen using a hyperparameter optimization framework applied on the training set [34]. The model is trained up to epochs and the best model is chosen based on its performance on the validation set. We train VNN models on different permutations of the training and validation sets.
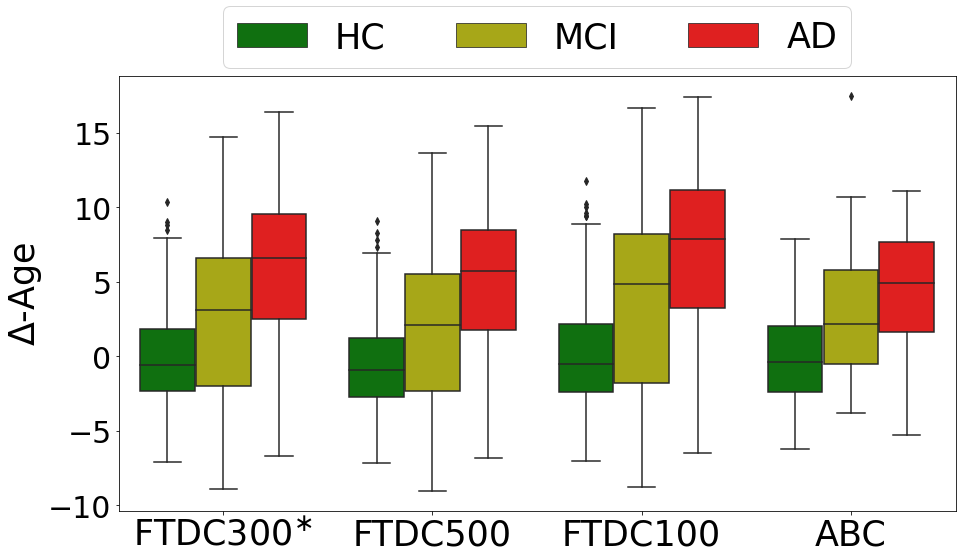
To evaluate brain age for the FTDC300, we use the sample covariance matrix from the whole dataset and evaluate the VNN predicted age for a subject as the mean of all VNN models. The bias due to chronological age is corrected according to the methodology described in (6) and (7), where the linear regression model for bias correction is trained on the HC cohort. The MAE between the predicted brain age (after bias correction of VNN outputs) and chronological age for HC subjects is years, MCI subjects is years and AD subjects is years. Figure 1 depicts the distributions of -Age for HC, MCI, and AD cohorts for the FTDC300 dataset. Significant group differences exist among the -Age for AD, MCI, and HC (ANOVA: -value = 35.92, -value). As expected, the -Age for HC is significantly lower than that for AD cohort (post hoc Tukey’s HSD test: FWER corrected -value = 0.001 for AD vs HC), with the -Age for MCI intermediate between the two (post hoc Tukey’s HSD test: FWER corrected -values are 0.002 for MCI vs HC and 0.001 for AD vs MCI).
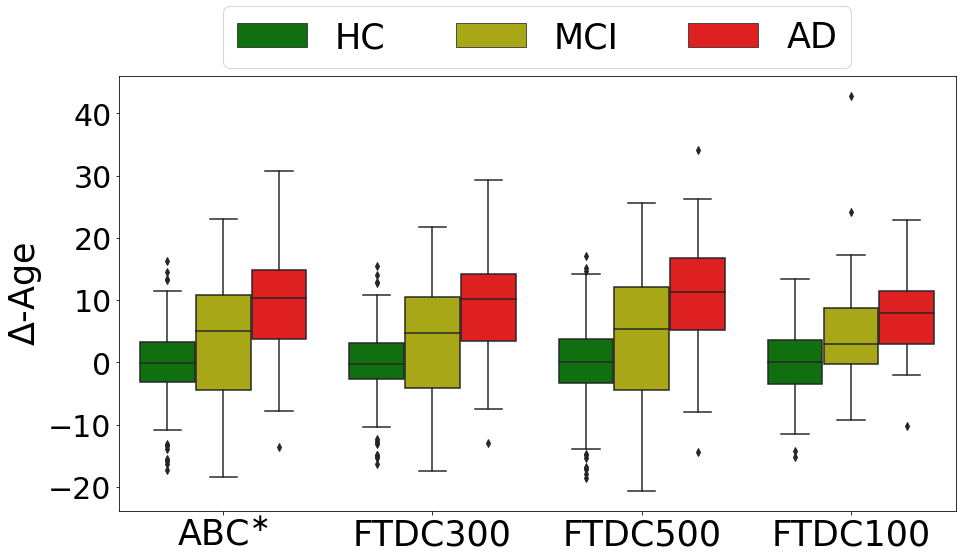
ABC Dataset: For this dataset, we use cortical thickness data for the complete dataset for training VNNs. The dataset is split into an train/validation/test split. The VNN architecture consists of layers with filter-taps per layer, features per dimension for dimensions in both layers. The selection of VNN hyperparameters and the training procedure are similar to that for FTDC300 dataset. The subsequent brain age evaluation procedure is similar to that followed for FTDC300 and focuses on correcting for bias due to healthy ageing. The MAE between predicted brain age and chronological age is years for HC, years for MCI, and years for AD. The box plots illustrating the distributions of -Age for the three cohorts in the ABC dataset are shown in Fig. 2. Significant group differences exist between -Age for the AD, MCI, and HC cohort (ANOVA: -value= 35.83, -value). The -Age for HC is significantly lower than that for AD (post hoc Tukey’s HSD test: FWER corrected -value = 0.001 for AD vs HC), with MCI intermediate between the two (post hoc Tukey’s HSD test: FWER corrected -values are 0.001 for AD vs MCI and 0.0762 for MCI vs HC). Therefore, the approaches adopted for FTDC300 and VNN datasets provide similar qualitative results in terms of relative elevation of brain age on the HC-MCI-AD spectrum.
4.2 Transferability of VNNs for Brain Age Prediction
In this set of experiments, we evaluate the transferability of brain age prediction frameworks trained on FTDC300 and ABC datasets. We focus on two aspects of transferability: i) multi-scale transferability from FTDC300 to FTDC100 and FTDC500 datasets; and ii) multi-site transferability from FTDC300 to ABC dataset and ABC dataset to FTDC100, FTDC300, and FTDC500 datasets.
Multi-Scale Transferability: Our results in [23, Section 5.2] show that VNN outputs are transferable as per Definition 1 (in terms of MAE) across the multi-scale FTDC datasets. Therefore, we transfer the filter taps from the VNN models trained on FTDC300 and the age bias-correction linear model to determine the brain age using cortical thickness from FTDC100 (100 features resolution) and FTDC500 (500 features resolution). Our results in Figure 1 show that the significant group differences exist in -Age for the three cohorts in both FTDC100 and FTDC500 (ANOVA: -value), and post hoc analyses reveals that -Age for AD is significantly elevated with respect to HC, with MCI intermediate between the two for FTDC100 and FTDC500 datasets. Thus, these findings are qualitatively consistent with those on FTDC300 model and hence, the brain age prediction model learnt on FTDC300 can be transferred to FTDC100 and FTDC500 for brain age prediction.
Multi-Site Transferability: We evaluate the multi-site transferability from FTDC300 to ABC, and ABC to FTDC100, FTDC300, and FTDC500 datasets. The methodology to evaluate multi-scale transferability is similar to that for multi-site transferability with one difference: here, we re-evaluate the linear model for age bias correction on the HC cohort in the test dataset. We remark that the relative elevation of -Age for AD and MCI with respect to HC is preserved even without re-learning the age bias correction model in the test set. However, in this scenario, there exists a constant offset in the -Age for HC when the model is transferred from ABC dataset to FTDC dataset or FTDC300 to ABC dataset. In Figures 1 and 2, we observe that the VNN models learnt on FTDC300 and ABC datasets using the procedures described in Section 4.1 can be transferred to ABC and FTDC datasets, respectively, while preserving interpretability of -Age. Specifically, we observe the pattern of progressive increase in -Age from HC to MCI to AD after transferring the VNNs to the test datasets. In the experiment to evaluate transferability from FTDC300 to ABC dataset (Fig. 1), we observe significant group differences in -Age (ANOVA: -value = 43.15) and significant pairwise differences (post hoc Tukey’s HSD test: -values for all pairwise comparisons). For case of ABC to FTDC300 (Fig. 2), we make similar observations: -value = 31.76 for ANOVA and -values for all post hoc tests. Therefore, we observe evidence of multi-site transferability for brain age prediction.
4.3 -Age and CDR Sum of Boxes Scores
The -Age inferred from the brain age prediction model trained on the FTDC300 dataset is significantly associated with CDR sum of boxes scores from MCI and AD subjects (, -val ). Furthermore, the -Age inferred for the FTDC300 datset from the prediction model trained on the ABC dataset is also significantly associated with the CDR sum of boxes scores (, -val ). The observations in this section and Section 4.2 imply that the -Age derived using our framework is clinically interpretable and the interpretability is retained after transferability.
5 Conclusions
In this paper, we have proposed a VNN-based brain age predictor from cortical thickness data. By leveraging the property of transferability in VNNs, we have illustrated cross-resolution and cross-site transferability of brain age prediction. Moreover, in the context of Alzheimer’s disease, our experiments have shown that the brain age predictions are biomarkers for AD and clinically interpretable. Future work includes expanding the application to other pathologies and neuroimaging modalities.
6 Acknowledgements
The ABC dataset was provided by the Penn Alzheimer’s Disease Research Center (ADRC; NIH AG072979) at University of Pennsylvania. The MRI data for FTDC datasets were provided by the Penn Frontotemporal Degeneration Center (NIH AG066597). Cortical thickness data were made available by Penn Image Computing and Science Lab at University of Pennsylvania.
7 Data Availability
Data for experiments on ABC and FTDC datasets may be requested through https://www.pennbindlab.com/data-sharing and upon review by the University of Pennsylvania Neurodegenerative Data Sharing Committee, access will be granted upon reasonable request.
References
- [1] Carlos López-Otín et al., “The hallmarks of aging,” Cell, vol. 153, no. 6, pp. 1194–1217, 2013.
- [2] M Habes, D Janowitz, G Erus, JB Toledo, SM Resnick, J Doshi, S Van der Auwera, K Wittfeld, K Hegenscheid, N Hosten, et al., “Advanced brain aging: Relationship with epidemiologic and genetic risk factors, and overlap with Alzheimer disease atrophy patterns,” Translational Psychiatry, vol. 6, no. 4, pp. e775–e775, 2016.
- [3] James H Cole, Stuart J Ritchie, Mark E Bastin, Valdés Hernández, S Muñoz Maniega, Natalie Royle, Janie Corley, Alison Pattie, Sarah E Harris, Qian Zhang, et al., “Brain age predicts mortality,” Molecular Psychiatry, vol. 23, no. 5, pp. 1385–1392, 2018.
- [4] Giovanni B Frisoni, Nick C Fox, Clifford R Jack, Philip Scheltens, and Paul M Thompson, “The clinical use of structural MRI in Alzheimer disease,” Nature Reviews Neurology, vol. 6, no. 2, pp. 67–77, 2010.
- [5] J Jean Chen, “Functional MRI of brain physiology in aging and neurodegenerative diseases,” Neuroimage, vol. 187, pp. 209–225, 2019.
- [6] Stefan Klöppel, Ahmed Abdulkadir, Clifford R Jack Jr, Nikolaos Koutsouleris, Janaina Mourão-Miranda, and Prashanthi Vemuri, “Diagnostic neuroimaging across diseases,” Neuroimage, vol. 61, no. 2, pp. 457–463, 2012.
- [7] Katja Franke and Christian Gaser, “Longitudinal changes in individual brainage in healthy aging, mild cognitive impairment, and Alzheimer’s disease.,” GeroPsych: The Journal of Gerontopsychology and Geriatric Psychiatry, vol. 25, no. 4, pp. 235, 2012.
- [8] Tomas Hajek, Katja Franke, Marian Kolenic, Jana Capkova, Martin Matejka, Lukas Propper, Rudolf Uher, Pavla Stopkova, Tomas Novak, Tomas Paus, et al., “Brain age in early stages of bipolar disorders or schizophrenia,” Schizophrenia Bulletin, vol. 45, no. 1, pp. 190–198, 2019.
- [9] Jeyeon Lee, Brian J Burkett, Hoon-Ki Min, Matthew L Senjem, Emily S Lundt, Hugo Botha, Jonathan Graff-Radford, Leland R Barnard, Jeffrey L Gunter, Christopher G Schwarz, et al., “Deep learning-based brain age prediction in normal aging and dementia,” Nature Aging, vol. 2, no. 5, pp. 412–424, 2022.
- [10] Wutao Yin, Longhai Li, and Fang-Xiang Wu, “Deep learning for brain disorder diagnosis based on fMRI images,” Neurocomputing, vol. 469, pp. 332–345, 2022.
- [11] Peter R Millar, Brian A Gordon, Patrick H Luckett, Tammie Benzinger, Carlos Cruchaga, Anne M Fagan, Jason Hassenstab, Richard J Perrin, Suzanne E Schindler, Ricardo F Allegri, et al., “Multimodal brain age estimates relate to Alzheimer disease biomarkers and cognition in early stages: A cross-sectional observational study,” bioRxiv, 2022.
- [12] Jessica Dafflon, Walter HL Pinaya, Federico Turkheimer, James H Cole, Robert Leech, Mathew A Harris, Simon R Cox, Heather C Whalley, Andrew M McIntosh, and Peter J Hellyer, “An automated machine learning approach to predict brain age from cortical anatomical measures,” Human Brain Mapping, vol. 41, no. 13, pp. 3555–3566, 2020.
- [13] Lea Baecker, Jessica Dafflon, Pedro F Da Costa, Rafael Garcia-Dias, Sandra Vieira, Cristina Scarpazza, Vince D Calhoun, Joao R Sato, Andrea Mechelli, and Walter HL Pinaya, “Brain age prediction: A comparison between machine learning models using region-and voxel-based morphometric data,” Human Brain Mapping, vol. 42, no. 8, pp. 2332–2346, 2021.
- [14] Habtamu M Aycheh, Joon-Kyung Seong, Jeong-Hyeon Shin, Duk L Na, Byungkon Kang, Sang W Seo, and Kyung-Ah Sohn, “Biological brain age prediction using cortical thickness data: A large scale cohort study,” Frontiers in Aging Neuroscience, vol. 10, pp. 252, 2018.
- [15] Marcel A de Reus and Martijn P Van den Heuvel, “The parcellation-based connectome: limitations and extensions,” Neuroimage, vol. 80, pp. 397–404, 2013.
- [16] Scott M McGinnis, Michael Brickhouse, Belen Pascual, and Bradford C Dickerson, “Age-related changes in the thickness of cortical zones in humans,” Brain Topography, vol. 24, no. 3, pp. 279–291, 2011.
- [17] Jasmeet P Hayes, Mark W Logue, Naomi Sadeh, Jeffrey M Spielberg, Mieke Verfaellie, Scott M Hayes, Andrew Reagan, David H Salat, Erika J Wolf, Regina E McGlinchey, et al., “Mild traumatic brain injury is associated with reduced cortical thickness in those at risk for Alzheimer’s disease,” Brain, vol. 140, no. 3, pp. 813–825, 2017.
- [18] Alan C Evans, “Networks of anatomical covariance,” Neuroimage, vol. 80, pp. 489–504, 2013.
- [19] Tong Zhu, Rui Hu, Xing Qiu, Michael Taylor, Yuen Tso, Constantin Yiannoutsos, Bradford Navia, Susumu Mori, Sven Ekholm, Giovanni Schifitto, et al., “Quantification of accuracy and precision of multi-center dti measurements: a diffusion phantom and human brain study,” Neuroimage, vol. 56, no. 3, pp. 1398–1411, 2011.
- [20] Zaniar Ardalan and Vignesh Subbian, “Transfer learning approaches for neuroimaging analysis: A scoping review,” Frontiers in Artificial Intelligence, vol. 5, 2022.
- [21] Yi Yang, Yanqiao Zhu, Hejie Cui, Xuan Kan, Lifang He, Ying Guo, and Carl Yang, “Data-efficient brain connectome analysis via multi-task meta-learning,” arXiv preprint arXiv:2206.04486, 2022.
- [22] Luana Ruiz, Fernando Gama, and Alejandro Ribeiro, “Graph neural networks: architectures, stability, and transferability,” Proceedings of the IEEE, vol. 109, no. 5, pp. 660–682, 2021.
- [23] Saurabh Sihag, Gonzalo Mateos, Corey McMillan, and Alejandro Ribeiro, “coVariance neural networks,” in Proc. Conference on Neural Information Processing Systems, Nov. 2022.
- [24] DA Bennett, JA Schneider, JL Bienias, DA Evans, and RS15753419 Wilson, “Mild cognitive impairment is related to Alzheimer disease pathology and cerebral infarctions,” Neurology, vol. 64, no. 5, pp. 834–841, 2005.
- [25] Alexander Schaefer, Ru Kong, Evan M Gordon, Timothy O Laumann, Xi-Nian Zuo, Avram J Holmes, Simon B Eickhoff, and BT Thomas Yeo, “Local-global parcellation of the human cerebral cortex from intrinsic functional connectivity MRI,” Cerebral Cortex, vol. 28, no. 9, pp. 3095–3114, 2018.
- [26] John C Morris, “The clinical dementia rating (cdr): Current version and,” Young, vol. 41, pp. 1588–1592, 1991.
- [27] Patric Hagmann, Leila Cammoun, Xavier Gigandet, Reto Meuli, Christopher J Honey, Van J Wedeen, and Olaf Sporns, “Mapping the structural core of human cerebral cortex,” PLoS Biology, vol. 6, no. 7, pp. e159, 2008.
- [28] Luana Ruiz, Luiz Chamon, and Alejandro Ribeiro, “Graphon neural networks and the transferability of graph neural networks,” Advances in Neural Information Processing Systems, vol. 33, pp. 1702–1712, 2020.
- [29] Iman Beheshti, Scott Nugent, Olivier Potvin, and Simon Duchesne, “Bias-adjustment in neuroimaging-based brain age frameworks: A robust scheme,” NeuroImage: Clinical, vol. 24, pp. 102063, 2019.
- [30] Ann-Marie G de Lange and James H Cole, “Commentary: Correction procedures in brain-age prediction,” NeuroImage: Clinical, vol. 26, 2020.
- [31] Sid E O’Bryant, Stephen C Waring, C Munro Cullum, James Hall, Laura Lacritz, Paul J Massman, Philip J Lupo, Joan S Reisch, Rachelle Doody, Texas Alzheimer’s Research Consortium, et al., “Staging dementia using clinical dementia rating scale sum of boxes scores: a texas Alzheimer’s research consortium study,” Archives of Neurology, vol. 65, no. 8, pp. 1091–1095, 2008.
- [32] Hongzhi Wang, Jung W Suh, Sandhitsu R Das, John B Pluta, Caryne Craige, and Paul A Yushkevich, “Multi-atlas segmentation with joint label fusion,” IEEE Transactions on Pattern Analysis and Machine Intelligence, vol. 35, no. 3, pp. 611–623, 2012.
- [33] Gyujoon Hwang, Ahmed Abdulkadir, Guray Erus, Mohamad Habes, Raymond Pomponio, Haochang Shou, Jimit Doshi, Elizabeth Mamourian, Tanweer Rashid, Murat Bilgel, et al., “Disentangling Alzheimer’s disease neurodegeneration from typical brain ageing using machine learning,” Brain Communications, vol. 4, no. 3, pp. fcac117, 2022.
- [34] Takuya Akiba, Shotaro Sano, Toshihiko Yanase, Takeru Ohta, and Masanori Koyama, “Optuna: A next-generation hyperparameter optimization framework,” in Proceedings of the 25th ACM SIGKDD International Conference on Knowledge Discovery & Data Mining, 2019, pp. 2623–2631.