Polariton lasing in AlGaN microring with GaN/AlGaN quantum wells
Abstract
Microcavity polaritons are strongly interacting hybrid light-matter quasiparticles, which are promising for the development of novel light sources and active photonic devices. Here, we report polariton lasing in the UV spectral range in microring resonators based on GaN/AlGaN slab waveguides, with experiments carried out from 4 K up to room temperature. Stimulated polariton relaxation into multiple ring resonator modes is observed, which exhibit threshold-like dependence of the emission intensity with pulse energy. The strong exciton-photon coupling regime is confirmed by the significant reduction of the free spectral range with energy and the blueshift of the exciton-like modes with increasing pulse energy. Importantly, the exciton emission shows no broadening with power, further confirming that lasing is observed at electron-hole densities well below the Mott transition. Overall, our work paves the way towards development of novel UV devices based on the high-speed slab waveguide polariton geometry operating up to room temperature with potential to be integrated into complex photonic circuits.
Microcavity polaritons are hybrid light-matter quasiparticles, arising from strong exciton-photon coupling in semiconductor photonic structures. They have attracted a significant attention in the last 15 years with a number of fundamental effects observed such as polariton condensation Kasprzak et al. (2006) and lasing Bajoni et al. (2008), superfluidity Amo et al. (2009), solitons Sich et al. (2016), polariton blockade Delteil et al. (2019) and single polariton nonlinearity Kuriakose et al. (2022) to name just a few, which are enabled by giant polariton interactions. Interacting polaritons are highly promising for the development of novel quantum light sources, photonic nonlinear simulators Amo and Bloch (2016), logic gates and quantum optical signal processing Ghosh and Liew (2020).
Polariton lasing, the coherent light emission from polariton condensates, provides several advantages over standard photonic lasing, including operation without population inversion with a threshold lower than that in conventional semiconductor lasers Imamoğlu et al. (1996). It has been demonstrated via optical Christopoulos et al. (2007); Bajoni et al. (2008) and electrical pumping Schneider et al. (2013). Room temperature (RT) operation has been reported in structures based on wide bandgap semiconductors Christopoulos et al. (2007); Li et al. (2013); Christmann et al. (2008) enabled by their large exciton binding energy. Polariton lasing has been mainly studied in planar semiconductor microcavities (MCs) made of two Bragg mirrors, which are challenging to fabricate. On the other hand polaritons have also been investigated in the slab waveguide (WG) geometry Walker et al. (2013); Ciers et al. (2017), where photonic confinement in the vertical direction arises from total internal reflection (TIR). The main advantages of the WG geometry over MCs are low disorder due to thinner and simpler structures and the high polariton speed, enabling long propagation distances up to several 100s of m, which makes this system favourable for the development of integrated polariton circuits. A number of nonlinear effects arising from giant optical Kerr-like polariton nonlinearity, such as dark and bright solitons Walker et al. (2015, 2017), continuum generation Walker et al. (2019) and ultrafast pulse modulation Paola et al. (2021), have been reported in the WG polariton platform.
III-nitride based polaritons are of particular interest since they enable coherent emission and low threshold ultrafast nonlinear optical modulation in the UV spectral range and can operate at RT Paola et al. (2021), with many potential applications including studies of chemical reactions, coherent Raman spectroscopy, and manipulation of trapped ions. UV polariton lasing in III-nitride WG devices has been reported only recently in GaN ridge resonators up to 150 K, likely limited by the smaller exciton binding energy in bulk GaN Souissi et al. (2022) compared to that in quantum heterostructures.
In this paper, we report polariton lasing in microring resonators fabricated from GaN/AlGaN quantum well (QW) slab WGs with operation in a wide temperature range from 4 to 300 K enabled by the large exciton binding energy in the GaN QWs ( meV) and a lower surface state recombination velocity than their III-arsenide counterparts Boroditsky et al. (2000). Polariton lasing from the multiple ring resonator modes is revealed by the threshold-like dependence of the emission intensity with increasing pump pulse energy. The free spectral range (FSR) between the modes reduces as the polariton energy approaches that of the exciton due to the strong dependence of the polariton group velocity on the photonic fraction of the polaritons, a clear signature of strong exciton-photon coupling. Furthermore, a strong blueshift of the lower polariton exciton-like states with increasing pulse energy is observed due to polariton interactions.
Apart from the development of coherent UV polariton sources, our demonstration of microring polariton resonators also paves the way towards further applications in integrated polariton circuits (e.g. filtering and directional coupling) and studies of low threshold generation of frequency combs and Kerr solitons.
Our microring resonators are formed by etching an AlGaN planar slab WG containing multiple GaN QWs Ciers et al. (2017) which was grown by metal-organic vapour phase epitaxy on free-standing GaN substrate. Propagating polaritons have been demonstrated in similar unetched planar WGs with a Rabi-splitting of 60 meV Ciers et al. (2017). The confinement induced by the ring geometry is expected to lead to discrete clockwise and counterclockwise ring polariton modes. The samples are fabricated by means of e-beam lithography and reactive ion etching.
After etching, the total height of the structures amounts to 315 nm (Fig. 1a). Rings of different radii () and widths () have been etched on the sample. The radius is taken from the centre to the mid-point of the ring. Here we studied microrings with = 3, 4, 6, 8 m and = 2 m. A scanning electron microscopy (SEM) image of a typical microring ( = 3 m, = 1 m) is shown in Fig. 1b (see also Fig. S1 in the supplemental material (SM)).
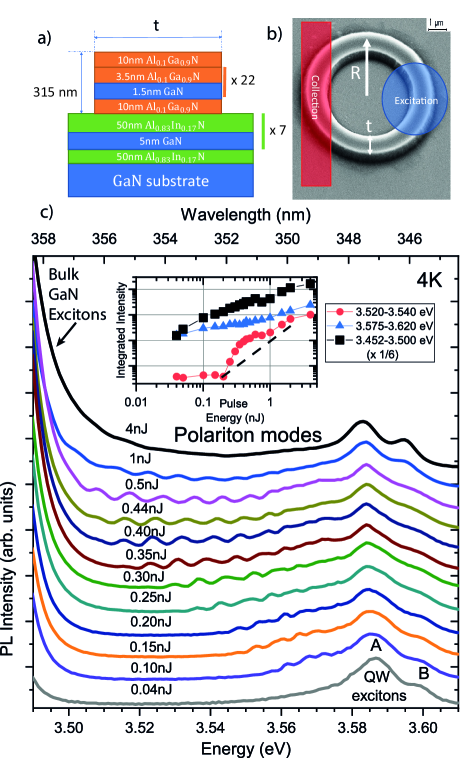
We study polariton lasing over a wide range of temperatures ( 4-300 K) by using a continuous flow liquid helium cryostat. A standard microphotoluminescence (-PL) setup allows us to excite and collect light emission at different spots on the sample in a backscattering configuration (see Fig. 1b). Pulsed laser excitation is performed with a frequency-quadrupled optical parametric amplifier (TOPAS) pumped by a Ti:sapphire regenerative amplifier. The excitation pulses were centred around 320 nm and had a duration of 100 fs and a repetition rate of 1 kHz. The PL signal collected by a microscope objective (NA = 0.39) is sent to a spectrometer with a resolution of 0.16 nm while being integrated over the entire rectangular entrance slit of the monochromator.
The optical resonances in the ring structures occur when the circumference of the ring is an integer multiple () of the polariton wavelength. This condition can be written as , where is the polariton wavenumber at energy and is the effective radius at which the mode propagates. In addition, the finite thickness of the ring may give rise to quantisation of polariton waves along the radial direction and formation of transverse modes characterised by the integer quantum number . We calculated the optical modes of the circular waveguides using the Lumerical MODE finite difference eigenmode (FDE) solver (see supplementary discussion 4).
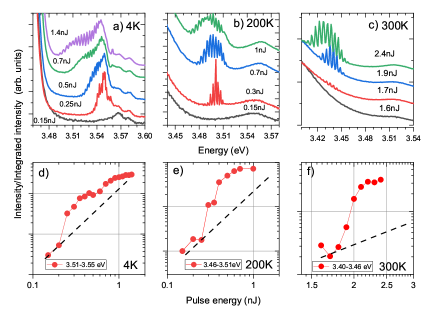
To demonstrate polariton lasing, we carried out a PL pulse energy dependence study on the m, m resonator with pulse energies varying from 0.04 to 4 nJ. The emission spectra for this entire excitation range at 4 K are shown in Fig. 1c. At low pulse energies the spectra consist of excitonic peaks at 3.587 eV and 3.598 eV associated with QW A and B excitons as previously reported in studies led on similar wafer samples Ciers et al. (2017). Even though the detection and excitation regions are spatially separated, exciton emission in the detection region may arise from the propagation of high velocity upper polaritons away from the excitation spot with their subsequent relaxation into the lower energy low momenta exciton states. Upon increasing pulse energy, narrow full width at half maximum (FWHM) 3 meV) modes start to appear abruptly at energies below the QW exciton peaks, firstly closer to the QW exciton emission, and then at lower energies down to 3.501 eV between the QW excitonic peaks and the bulk GaN exciton emission (centred at 3.46 eV) originating from the substrate.
As we argue below, the appearance of these modes with increasing pulse energy is associated with stimulated polariton scattering into the optical ring resonator states which are in the strong coupling regime with the QW excitons. The bulk GaN excitons are isolated from the ring structure by the cladding layers and thus are only weakly coupled to the resonator modes. Importantly, our polariton system is nonequilibrium: the multiple modes (co-existing condensates) become macroscopically occupied due to the dynamical equilibrium between gain and dissipation channels Kasprzak et al. (2008); Krizhanovskii et al. (2009). At 4 K, relaxation to the polariton states occurs mainly through exciton-exciton and exciton-polariton scattering, since at low temperature phonon-assisted scattering is inefficient Ciers et al. (2020). Initially, at pulse energies just above threshold, scattering to the exciton-like polariton states whose energy is close to the QW exciton level is more efficient. With further increase in pulse energy scattering to more photon-like states increases Tartakovskii et al. (2000) leading to polariton lasing from the lower energy ring states (see Fig. 1c). The macroscopical occupation of the polariton modes is confirmed by the superlinear (threshold-like) increase of the mode emission intensity (integrated in the energy interval where the background from GaN and QW excitons is negligible) with pulse energy, whose dependence is much faster than quadratic, as shown in the inset of Fig. 1c. If the filling factor of the polariton modes was less than unity it is expected that enhanced relaxation due to interparticle scattering would lead only to a quadratic dependence. For comparison, we also show in the inset of Fig. 1c that the integrated emission intensity exhibits a linear or slightly superlinear power dependence in the energy range where QW and GaN backgrounds dominate, respectively.
We note that in our case the modes are confined in the vertical direction due to TIR and the emission is likely observed due to Rayleigh scattering on fabrication imperfections of the ring resonators.
Below threshold, the polariton emission from the ring resonator modes is too weak to be detected because the latter is guided in the microring resonator plane. It is only above threshold that the scattered light from the lasing modes becomes sufficiently strong and comparable to the excitonic background to be coupled to our microscope objective.
The FSR of the ring resonator modes is given by the following equation:
| (1) |
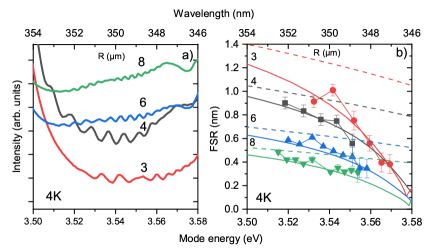
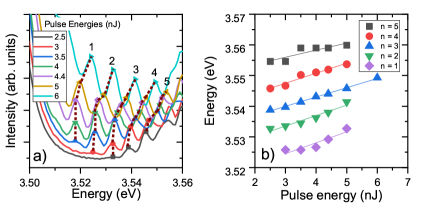
where is the reduced Planck’s constant and is the (energy dependent) group velocity of planar slab WG polariton modes at energy , and is the radius around which the lasing modes propagate. In the strong coupling regime and hence the FSR are expected to decrease strongly with increasing as the lower polariton dispersion curves strongly towards the exciton level (see supplementary discussion 5). We investigated the stimulated emission from ring resonators of different radii at 4 K over the wavelength range 346-354 nm, with the raw data shown in Fig. 2.a). The FSR vs. energy is summarised in Fig. 2.b). The FSR increases with decreasing ring radius , as expected from Eqn. 1. The FSR also decreases with increasing energy. For and 4 m the FSR decreases drastically by a factor of 2-3 as the energy approaches the exciton level, which is a strong confirmation that the observed modes are in the strong coupling regime. Some trend of decreasing FSR with energy is also visible for = 6 and 8 m, although the dependence is more noisy for = 8 m since the FSR becomes comparable to the spectral resolution. The theoretical FSR for purely photonic modes was calculated using FDE as described above and the FSR for polaritons was calculated using the photonic values and a standard coupled oscillator model (see supplementary section 5). The solid lines in Fig. 2.b show the theoretical polariton FSR and their curvature is in good agreement with the experiment. The purely photonic FSR theory curves (dashed lines) also show decreasing FSR with energy which occurs mainly due to the energy dependence of the material refractive indexes. However, this curvature is much shallower than that seen in the experiment. In summary, the strong curvature of the FSR vs. energy cannot be explained without invoking a strong coupling picture, thus confirming that the system remains strongly coupled while in the lasing regime. Further detail is given in supplementary section 5.
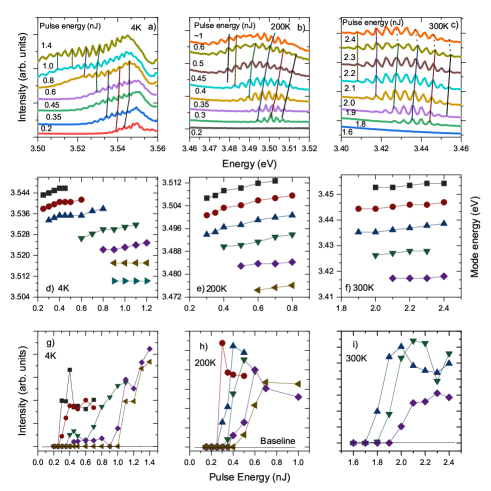
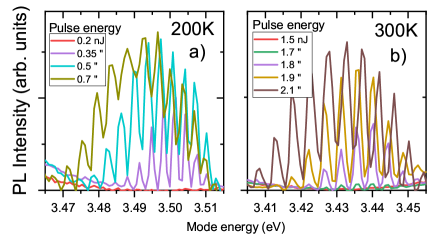
Furthermore, we perform measurements on an = 8 m microring over a wider temperature range up to 300 K. The PL spectra for different pulse energies are displayed in Figs. 3a,b,c for 4, 200 and 300 K, respectively. At all temperatures the bunch of narrow ring resonator modes associated with polariton lasing appears below the QW A exciton energy level with increasing pulse energy. As in the case of = 4 m the emission intensities integrated in the energy range where modes are the most visible, demonstrate a clear threshold-like behaviour with a faster than quadratic dependence in Figs. 3d,e,f at all temperatures, indicating macroscopic occupation and lasing of several modes. By contrast, the bulk GaN and QW excitonic peaks behave linearly (see SM section 7). As the data taken at 200 and 300 K sits on a strong incoherent PL background originating from the bulk GaN and the QW exciton emission peaks, this background has been subtracted. The resulting PL spectra are available in the SM (section 6). In the supplementary material (SM section 5), we plot FSR measurements at 300 K and compare them with the theorerical simulations, which support the strong exciton-photon coupling at room temperature.
Whilst with increasing temperature both the exciton and the polariton emission shift to lower energy due to band gap reduction, it is also observed that the onset of lasing occurs in more photon-like polariton states at higher . This occurs because a) the losses of the exciton-like states with energies closer to the exciton level increase due to phonon scattering and b) at elevated temperature the polaritons can relax to more photon-like states by exciton-phonon as well as exciton-exciton and exciton-polariton scattering Ciers et al. (2020); Tartakovskii et al. (2000); Savvidis et al. (2002). The non-radiative processes and polariton losses increasing with temperature also lead to the increase of the lasing threshold from 0.25 nJ at 4 K to 0.35 nJ and approximately 1.8 nJ at 200 K and 300 K, respectively. Interestingly, however, this overall increase in the polariton lasing threshold with temperature remains within a factor about seven. Such a variation is far smaller than that reported recently for ridge waveguide polariton lasers made from bulk GaN, where the drastic increase in the lasing threshold by more than two orders of magnitude from 70 K to 220 K was incompatible with a polaritonic picture that could hold from cryogenic to room temperature Souissi et al. (2022). This reduced sensitivity for our sample is again most likely stemming from the quantum heterostructure nature of our polariton gain medium that leads to stabler excitons. We are also able to explore a significant range of pumping conditions above threshold with pulse energy values nearly up to an order of magnitude larger than that at threshold at 4 K for the 8 m ring resonator (Figs. 3d,e,f) and even beyond one order of magnitude for the 4 m ring resonator (Fig. 1c and corresponding inset).

The excitonic component of the polariton wavefunction leads to strong polariton-polariton interactions responsible for the blueshift of polariton resonances with increasing density. In Figs. 4a,b,c we plot expanded spectra for different pulse energies, tracing the peak position of each of the lasing modes. The extracted peak positions of the polariton modes are plotted in Figs. 4d,e,f, respectively. As expected the higher energy exciton-like states exhibit stronger blueshift with pulse energy than the lower energy photon-like polaritons. At 4 and 200 K an energy blueshift up to 6-7 meV is observed for exciton-like modes, whereas at 300 K the observed shifts are much less, meV, due to the decreased excitonic content of the lasing modes and increased thermal effects, which may lead to polariton redshift counterbalancing the effect of interactions. Note that only inter- and intra-mode polariton-polariton interactions are responsible for the polariton blueshifts, whereas the interaction with the higher energy exciton reservoir does not play a role since its density is expected to be pinned above the polariton lasing threshold Wouters and Carusotto (2007). The evolution of the peak intensity of the modes with pulse energy is finally given in Fig. 4g,h,i. The peak intensity is given by the maximum intensity of the mode minus the intensity at the base of the peak. We can see that the modes examined here have a different threshold-like increase at a given pulse energy, and then stagnate or decrease as more modes, and hence mode competition, come into play. Similar strong blueshifts are seen in the 4 m ring at 4 K (see SM section 8). Finally, we note that interparticle interactions and mode competition may determine the linewidth (FWHM 2-3 meV) of the lasing modes above threshold (see SM section 3).
Importantly, the fact that the exciton emission line, detected either in the area of the pump spot or on the opposite side of the ring, (Figs. 1 and 3) does not broaden with pulse energy and shows no or small energy blueshift (10 meV) confirms that there is a limited screening of the built-in electric field and that the created electron-hole density in each QW is well below the Mott density ( cm-2) Rossbach et al. (2014). Indeed, above the Mott density, the emission is expected to originate from an electron-hole plasma with a high energy emission tail extending by 50-60 meV from the exciton peak maxima Rossbach et al. (2014). This observation is another confirmation that the nonlinear emission is associated with polariton lasing.
In conclusion, we report UV polariton lasing from multiple modes in microring resonators fabricated from AlGaN planar waveguides with embedded GaN quantum wells at temperatures up to 300 K. The micro-structured polariton system we present has the potential to be used to study modelocking of polaritons into a sequence of short pulses, generation of UV soliton trains and frequency combs supported by giant polariton Kerr nonlinearity. Polariton modelocking was demonstrated numerically for resonantly pumped microring resonators Egorov and Skryabin (2018). Beyond this, the non-resonant pump like the one used in this work and a combination of both resonant and non-resonant pumping offer several avenues for further research into the complex interplay between turbulence and modelocking Piccardo et al. (2020). Additional opportunities should arise from the coupling between two and more rings, which includes combining space topology and modelocking Yang et al. (2020), an aspect not easily within reach with the linear WG geometry. Overall, our work has the potential to be a significant step forward for the development of compact active nonlinear polariton devices operating at RT.
Supplementary material
See supplemental document for supporting information concerning experimental methods and simulation models for polariton dispersion.
Author Contribution
Anthonin Delphan: Data Curation, Formal Analysis, Investigation, Software, Visualisation, Conceptualisation, Methodology, Validation, Writing - Original Draft
Maxim N. Makhonin: Data Curation, Formal Analysis, Investigation, Software, Visualisation, Conceptualisation, Supervision, Methodology, Validation, Writing - Original Draft
Tommi Isoniemi: Resources, Investigation, Methodology, Writing - Review & Editing
Paul M. Walker: Data Curation, Formal Analysis, Software, Visualisation, Conceptualisation, Methodology, Writing - Review & Editing
Maurice S. Skolnick: Conceptualisation, Methodology, Writing - Review & Editing
Dmitry N. Krizhanovskii: Conceptualisation, Funding acquisition, Methodology, Project Administration, Supervision, Writing - Review & Editing
Dmitry V. Skryabin: Methodology, Writing - Review & Editing
Jean-François Carlin: Methodology, Resources, Writing - Review & Editing
Nicolas Grandjean: Methodology, Resources, Writing - Review & Editing
Raphaël Butté: Conceptualisation, Methodology, Project Administration, Supervision, Writing - Review & Editing
Acknowledgements.
We acknowledge UK EPSRC grants EP/V026496/1, EP/S030751/1 and EP/R007977/1. Anthonin Delphan would like to thank Christopher Vickers and Thomas Ball for their help with the cryogenics setup.Conflicts of interests
The authors declare no conflicts of interest.
Data Availability Statement
| AVAILABILITY OF DATA & STATEMENT OF DATA AVAILABILITY | |
| Data available on request from the authors | The data that support the findings of this study are available from the corresponding author upon reasonable request. |
References
- Kasprzak et al. (2006) J. Kasprzak, M. Richard, S. Kundermann, A. Baas, P. Jeambrun, J. M. J. Keeling, F. M. Marchetti, M. H. Szymańska, R. André, J. L. Staehli, V. Savona, P. B. Littlewood, B. Deveaud, and L. S. Dang, Nature 443, 409 (2006).
- Bajoni et al. (2008) D. Bajoni, P. Senellart, E. Wertz, I. Sagnes, A. Miard, A. Lemaître, and J. Bloch, Phys. Rev. Lett. 100, 047401 (2008).
- Amo et al. (2009) A. Amo, J. Lefrère, S. Pigeon, C. Adrados, C. Ciuti, I. Carusotto, R. Houdré, E. Giacobino, and A. Bramati, Nature Physics 5, 805 (2009).
- Sich et al. (2016) M. Sich, D. V. Skryabin, and D. N. Krizhanovskii, Comptes Rendus Physique 17, 908 (2016).
- Delteil et al. (2019) A. Delteil, T. Fink, A. Schade, S. Höfling, C. Schneider, and A. Imamoğlu, Nature Materials 18, 219 (2019).
- Kuriakose et al. (2022) T. Kuriakose, P. M. Walker, T. Dowling, O. Kyriienko, I. A. Shelykh, P. St-Jean, N. C. Zambon, A. Lemaître, I. Sagnes, L. Legratiet, A. Harouri, S. Ravets, M. S. Skolnick, A. Amo, J. Bloch, and D. N. Krizhanovskii, Nature Photonics 16, 566 (2022).
- Amo and Bloch (2016) A. Amo and J. Bloch, Comptes Rendus Physique 17, 934 (2016).
- Ghosh and Liew (2020) S. Ghosh and T. C. H. Liew, npj Quantum Information 6, 16 (2020).
- Imamoğlu et al. (1996) A. Imamoğlu, R. J. Ram, S. Pau, and Y. Yamamoto, Physical Review A 53, 4250 (1996).
- Christopoulos et al. (2007) S. Christopoulos, G. B. H. von Högersthal, A. J. D. Grundy, P. G. Lagoudakis, A. V. Kavokin, J. J. Baumberg, G. Christmann, R. Butté, E. Feltin, J.-F. Carlin, and N. Grandjean, Phys. Rev. Lett. 98, 126405 (2007).
- Schneider et al. (2013) C. Schneider, A. Rahimi-Iman, N. Y. Kim, J. Fischer, I. G. Savenko, M. Amthor, M. Lermer, A. Wolf, L. Worschech, V. D. Kulakovskii, I. A. Shelykh, M. Kamp, S. Reitzenstein, A. Forchel, Y. Yamamoto, and S. Höfling, Nature 497, 348 (2013).
- Li et al. (2013) F. Li, L. Orosz, O. Kamoun, S. Bouchoule, C. Brimont, P. Disseix, T. Guillet, X. Lafosse, M. Leroux, J. Leymarie, G. Malpuech, M. Mexis, M. Mihailovic, G. Patriarche, F. Réveret, D. Solnyshkov, and J. Zuniga-Perez, Appl. Phys. Lett. 102, 051102 (2013).
- Christmann et al. (2008) G. Christmann, R. Butté, E. Feltin, J.-F. Carlin, and N. Grandjean, Applied Physics Letters 93, 051102 (2008).
- Walker et al. (2013) P. M. Walker, L. Tinkler, M. Durska, D. M. Whittaker, I. J. Luxmoore, B. Royall, D. N. Krizhanovskii, M. S. Skolnick, I. Farrer, and D. A. Ritchie, Applied Physics Letters 102, 012109 (2013).
- Ciers et al. (2017) J. Ciers, J. Roch, J.-F. Carlin, G. Jacopin, R. Butté, and N. Grandjean, Physical Review Applied 7, 034019 (2017).
- Walker et al. (2015) P. M. Walker, L. Tinkler, D. V. Skryabin, A. Yulin, B. Royall, I. Farrer, D. A. Ritchie, M. S. Skolnick, and D. N. Krizhanovskii, Nature Communications 6, 8317 (2015).
- Walker et al. (2017) P. Walker, L. Tinkler, B. Royall, D. Skryabin, I. Farrer, D. Ritchie, M. Skolnick, and D. Krizhanovskii, Physical Review Letters 119, 097403 (2017).
- Walker et al. (2019) P. M. Walker, C. E. Whittaker, D. V. Skryabin, E. Cancellieri, B. Royall, M. Sich, I. Farrer, D. A. Ritchie, M. S. Skolnick, and D. N. Krizhanovskii, Light: Science & Applications 8, 6 (2019).
- Paola et al. (2021) D. M. D. Paola, P. M. Walker, R. P. A. Emmanuele, A. V. Yulin, J. Ciers, Z. Zaidi, J.-F. Carlin, N. Grandjean, I. Shelykh, M. S. Skolnick, R. Butté, and D. N. Krizhanovskii, Nature Communications 12, 3504 (2021).
- Souissi et al. (2022) H. Souissi, M. Gromovyi, T. Gueye, C. Brimont, L. Doyennette, D. Solnyshkov, G. Malpuech, E. Cambril, S. Bouchoule, B. Alloing, S. Rennesson, F. Semond, J. Zúñiga-Pérez, and T. Guillet, Physical Review Applied 18, 044029 (2022).
- Boroditsky et al. (2000) M. Boroditsky, I. Gontijo, M. Jackson, R. Vrijen, E. Yablonovitch, T. Krauss, C.-C. Cheng, A. Scherer, R. Bhat, , and M. Krames, Journal of Applied Physics 87, 3497 (2000).
- Kasprzak et al. (2008) J. Kasprzak, D. D. Solnyshkov, R. André, L. S. Dang, and G. Malpuech, Physical Review Letters 101, 146404 (2008).
- Krizhanovskii et al. (2009) D. N. Krizhanovskii, K. G. Lagoudakis, M. Wouters, B. Pietka, R. A. Bradley, K. Guda, D. M. Whittaker, M. S. Skolnick, B. Deveaud-Plédran, M. Richard, R. André, and L. S. Dang, Physical Review B 80, 045317 (2009).
- Ciers et al. (2020) J. Ciers, D. D. Solnyshkov, G. Callsen, Y. Kuang, J.-F. Carlin, G. Malpuech, R. Butté, and N. Grandjean, Physical Review B 102, 155304 (2020).
- Tartakovskii et al. (2000) A. I. Tartakovskii, M. Emam-Ismail, R. M. Stevenson, M. S. Skolnick, V. N. Astratov, D. M. Whittaker, J. J. Baumberg, and J. S. Roberts, Physical Review B 62, R2283 (2000).
- Savvidis et al. (2002) P. G. Savvidis, J. J. Baumberg, D. Porras, D. M. Whittaker, M. S. Skolnick, and J. S. Roberts, Physical Review B 65, 073309 (2002).
- Wouters and Carusotto (2007) M. Wouters and I. Carusotto, Phys. Rev. Lett. 99, 140402 (2007).
- Rossbach et al. (2014) G. Rossbach, J. Levrat, G. Jacopin, M. Shahmohammadi, J.-F. Carlin, J.-D. Ganière, R. Butté, B. Deveaud, and N. Grandjean, Physical Review B 90, 201308(R) (2014).
- Egorov and Skryabin (2018) O. A. Egorov and D. V. Skryabin, Optics Express 26, 24003 (2018).
- Piccardo et al. (2020) M. Piccardo, B. Schwarz, D. Kazakov, M. Beiser, N. Opačak, Y. Wang, S. Jha, J. Hillbrand, M. Tamagnone, W. T. Chen, A. Y. Zhu, L. L. Columbo, A. Belyanin, and F. Capasso, Nature 582, 360 (2020).
- Yang et al. (2020) Z. Yang, E. Lustig, G. Harari, Y. Plotnik, Y. Lumer, M. A. Bandres, and M. Segev, Phys. Rev. X 10, 011059 (2020).
Polariton lasing in AlGaN microring with GaN/AlGaN quantum wells - Supplemental Material
.1 Growth details and fabrication process
The sample was grown using metal organic vapour phase epitaxy on high-quality low threading dislocation density (106 cm-2) c-plane free-standing GaN substrate. The sample structure consists of a 130-nm-thick active region with 22 embedded GaN/Al0.1Ga0.9N (1.5 nm/3.5 nm) quantum wells (QWs) grown on top of a 400-nm-thick Al0.83In0.17N cladding lattice-matched to GaN. It is essentially a replica of the samples in which waveguided polaritons were reported for the first time in III-nitride slab waveguides [1] and for which we subsequently demonstrated ultrafast-nonlinear ultraviolet pulse modulation in the strong coupling regime up to room temperature [2]. For electron beam lithography (EBL) a layer of the photoresist CSAR-62 [3] with the adhesion enhancer hexamethyldisilazane was spinned on the sample. The soft mask has a thickness of 1130 nm. The resist was exposed with a 50 keV electron beam using a Raith Voyager EBL system, using a base dose of 94 C/cm2 together with a proximity dose correction. The mask was developed in xylene for 60 s at 23 ∘C and rinsed in isopropanol. After development, inductively-coupled plasma reactive ion etching (ICP-RIE) was used to etch the patterns through the core and partly into the cladding. The dry etch process uses a RF power of 80 W, ICP power of 450 W and 4 mTorr pressure. The gas flows were 1.5 sccm for SiCl4, 15 sccm for Cl2 and 4 sccm for Ar. The etching time was 10.75 min with the etching rates of 67 nm/min for the resist and 30 nm/min for GaN. After etching the resist was removed with 4 min O2 plasma ashing with 100 W power, submerging the sample in heated Microposit resist remover 1165 for 4 min and rinsing it in isopropanol for 2 min.
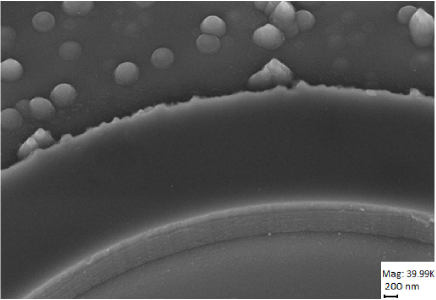
A scanning electron microscopy (SEM) image of a ring resonator is shown in Fig. 5 that illustrates the very good flatness of the top ring. The small droplets on the outer side of the ring are from unetched photoresist and are not believed to have any impact on the optical measurements.
.2 Normalisation of Photoluminescence Spectra
In the main text, we present in Fig. 1 the photoluminescence (PL) spectra of the 4 m ring at different pulse energies. We also give PL spectra of the 8 m ring in Fig. 3 for different pulse energies and temperatures. These spectra are normalised to the PL intensity of the QW A exciton, according to equation 2:
| (2) |
where is the energy, is the raw photoluminescence data, is the energy of the QW A exciton resonance, and is the resulting normalised spectrum. We observe that the function is almost constant for the QW peaks and the bulk GaN peaks across all pulse energies, which shows that both follow a similar pulse energy dependency (shown in section 6 to be quasi-linear), but varies significantly in the region where the modes appear. This shows that the polariton modes follow a non-linear pulse energy dependency.
The PL spectra are all shifted vertically for clarity. The value of the shifts is as follows:
-
•
for the 4 m ring at 4 K, the shift is equal to 0.5 for all powers;
-
•
for the 8 m ring at 4 K, the shift is equal to 0.7 for 0.25 nJ, then 1.5 for 0.5 nJ, 2 for 0.7 nJ, and finally 1 for 1.4 nJ;
-
•
for the 8 m ring at 200 K, the shift is equal to 1 for 0.3 nJ, then 2.5 for 0.7 nJ, and finally 1.5 for 1 nJ;
-
•
for the 8 m ring at 300 K, the shift is equal to 3 for all pulse energies.
The interest of this representation is to emphasize the evolution in relative contrast between the polariton modes and the neighbouring excitons. In Fig. 6, we show the non-shifted, non-normalised spectra, which show the evolution in absolute contrast.
.3 Polariton mode linewidth
One of the distinctive signatures of lasing is a reduction of the linewidth of the cavity modes supporting lasing when crossing the threshold. For a single mode laser the linewidth of the lasing mode is predicted to decrease inversely proportional to the mode filling factor according to the celebrated Schawlow-Townes linewidth formula [4]. In our experiment, the scattered photoluminescence signal from the cavity modes is not observed below threshold, since it is too weak to efficiently contribute to the collected signal with our backscattering configuration as discussed in the main text. Above the polariton lasing threshold the peak intensities of the modes quickly saturate with power (see Fig. 4 of the main text) and no measurable reduction of the polariton mode linewidths is observed. The linewidth of the polariton modes is observed to be around 2-3 meV and is very likely limited by the polariton-polariton interactions, cross scattering and gain competition between the modes. Given that our system is pumped with a 1 kHz laser of very short (100 fs) pulses there is most likely a strong variation in the total exciton and polariton density (and hence in the modes peak positions) from pulse to pulse, which further leads to polariton mode broadening in the time-averaged spectra we measure.
.4 Polariton dispersion and photonic loss of ring resonators
The strong reduction in free spectral range (FSR) as the energy approaches that of the exciton resonance arises due to the strong dispersion of polaritons. This is illustrated in Fig. 7 which shows the experimentally measured energy vs. wavenumber dispersion relation for the planar waveguide. The points give the experimental data while the solid curve gives the best fit of the polariton model. Panels a) and b) show the cases for two representative temperatures: 4 K and 300 K, respectively. The data and analysis are taken from Ref. [2] and are fully described in that work.
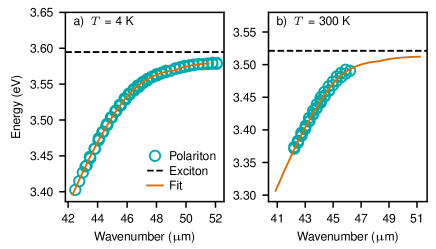
Exciton-polaritons (hereafter polaritons) are formed by hybridisation of photons and excitons. The polariton dispersion is obtained by first calculating the dispersion of the purely photonic modes of the planar waveguide structure using electromagnetic simulation, and then employing a coupled oscillator model to calculate the dispersion of the polaritons. The photons and excitons hybridise to form two polariton branches, the upper polaritons (UP) and lower polaritons (LP). The UP are not observed because of strong absorption at energies above the exciton resonance [1]. The dispersion of the LP given by the conventional coupled oscillator model is
| (3) |
Here is the lower polariton energy, and are the photon and exciton energies, respectively, and is the coupling strength between photon and exciton, known as the vacuum Rabi splitting. The hybridisation leads to an avoided crossing, where the LP does not cross the exciton energy but strongly curves over as it approaches it. This leads to very strong dispersion and ultimately underlies the strongly reducing FSR for resonator modes at energies close to the exciton energy.
We now consider the dispersive properties of the ring resonators which we study in this work. Following a similar general method we first calculated the dispersion of purely photonic modes using electromagnetic simulation, and then calculated the dispersion of resonator polaritons using a coupled oscillator model. The photon dispersion was calculated using the finite difference eigenmode (FDE) solver of the commercial Lumerical MODE solutions package. This was used to simulate curved waveguides with transverse profile corresponding to the 2 m wide ridge waveguides in the experiment. For a wide range of optical wavelengths the solver calculates the corresponding angular wavenumber (rate of phase accumulation with angle travelled around the curved waveguide). The dashed orange curve in Fig. 8a) shows the photon energy vs. angular wavenumber. The polariton energy at each angular wavenumber is then obtained using the coupled oscillator model, as above, and is shown as the solid blue curve in Fig. 8a). The small kink in the curves around 3.64 eV for the photons and around 3.58 eV for polaritons is due to the rapid variation of the background refractive index of the quantum wells near the band edge. It is well above the energies of the experimentally investigated polariton modes and does not affect the results.
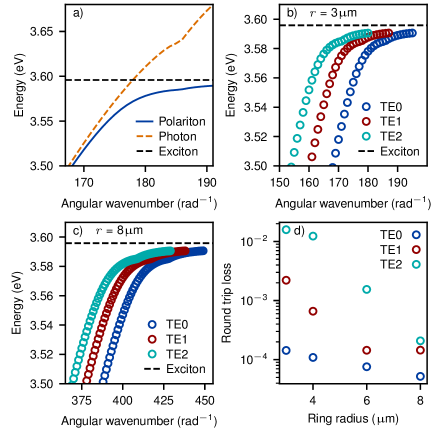
Once the dispersion of curved waveguides is known the energies of ring resonator modes can be calculated. The phase accumulated in one round trip of a circular resonator is and the condition for resonance is that the round trip phase should be a multiple of . Thus we obtain where is an integer. Interpolating into the curved waveguide dispersion gives the polariton energies of the resonances. These are shown in Figs. 8b) and c) for 3 m and 8 m rings, respectively. A feature of relatively wide resonators such at the 2 m devices we use is that they support several transverse modes in addition to the longitudinal modes. This leads to a set of longitudinal modes for each transverse modal index. Figs. 8b) and c) show the first three transverse-electric polarised transverse mode families, TE0, TE1 and TE2. The transverse-magnetic polarised modes have a weak coupling to the quantum wells [1] and do not play a role in these experiments. The energy difference between any given longitudinal mode and the closest mode in the next transverse family is less than the distance between longitudinal modes.
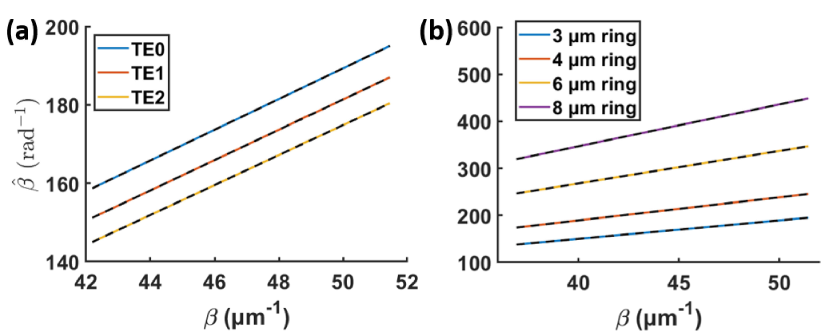
As discussed above we calculated the angular wavenumber of the pure photonic modes of the rings for a range of frequencies. At the same frequencies we also calculated the wavenumber of pure photons in the planar waveguide from which the rings were etched (also using Lumerical MODE). In Fig. 9 we plot the angular wavenumbers vs. the planar waveguide wavenumber . Fig. 9(a) shows this for the three lowest order TE modes of the 3 micron ring. The coloured curves are the simulated data. The black dashed lines are best fit straight lines. It is seen that is a linear function of to a high precision over a large range of wavenumbers, which correspond to photon wavelengths of 335 nm to 400 nm. This is true for all the different modes. Fig. 9(b) shows the same data for the lowest order TE mode of several different rings of different radii, showing the same linear relationship. Mathematically we have where is an offset analagous to the quantisation energy coming from the transverse confinement, and and is an effective radius of propagation for the mode labelled by index . The radius comes in because we are comparing angular wavenumber (in units of rad-1) and actual wavenumber (in units of m-1). The offset will disappear when taking derivatives to find, for example, the group velocity. The dispersive properties of all these modes (which have different orders and propagate in different rings) can therefore be explained entirely by the dispersion of the underlying planar waveguide. We conclude that the transverse confinement and circular propagation have negligible effect on the modal dispersive properties and that all transverse modes are equivalent to within a linear scaling factor related to the radius.
We finally consider the radiation losses in the resonators. Fig. 8d) shows the calculated round trip loss for photons in the resonator due to radiation loss and tunnelling through the cladding into the substrate. The round trip losses are obtained from the imaginary part of as calculated by the FDE solver using perfectly-matched-layer boundary conditions. As expected, the losses are higher for the rings with smaller radius. The losses are also higher for higher order transverse modes TE1 and TE2 compared to the fundamental transverse mode family TE0. This suggests that either higher order transverse modes experience higher radiation losses or that their lower effective refractive index increases tunnelling loss through the substrate, or both.
.5 Frequency dependence of free spectral range as evidence of strong coupling
A key signature of strong coupling is the anti-crossing of photon and exciton states which leads to a strong curvature of the lower polariton dispersion as it asymptotically approaches the exciton energy with increasing wavenumber (see section .4). A good measure of this curvature is the group velocity . For uncurved (linear) dispersion relations it is just a constant whereas in the strong coupling regime it is expected to vary strongly, starting from the pure-photon group velocity and tending to zero as the polariton energy approaches the exciton energy from below. In a simplified picture of a linear dispersion relation for the pure photons the polariton group velocity is proportional to the photonic fraction. In reality the pure photon dispersion relation also exhibits some curvature due to the wavelength dependence of the material refractive indexes, especially near the material band edges. As discussed in supplementary section .4, the dispersive properties (e.g. ) of our ring resonator modes are determined entirely by those of the planar waveguide from which the rings are etched.
Experimentally we have direct access to the group velocity since it is directly proportional to the FSR. We have where is a radius and is the energy spacing between ring resonator modes (free spectral range). Because of this direct proportionality the variation of the FSR with energy is also a good measure of the polaritonic character of the modes. Theoretically, we can also calculate the expected free spectral range for both polaritons and also pure photons, as discussed in supplementary section .4. Since we do not have experimental access to the transverse profile of the lasing modes, we calculate the FSR for a radius corresponding to the center of the 2 micron wide ridge for comparison with the experiment. The exciton energy, used in Eqn. 3 to calculate the polariton energies, is taken from the spectra. The Rabi splitting is treated as a fitting parameter and we obtain values between 55 and 65 meV, in good agreement with the value reported in Ref. [1].
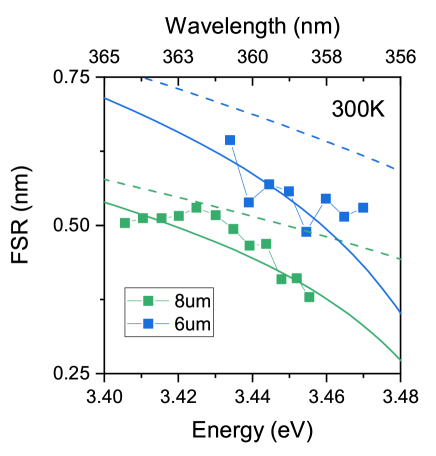
Figure 2b in the main text shows the experimentally measured FSR for several rings at 4 K. In the case of the 3 m radius ring the experimental FSR (and hence the group velocity) decreases by 65% of the maximum measured value over an energy range of 41 meV. As discussed in the main text this large variation in FSR cannot be accounted for by a purely photonic model. The rings with other radii at 4 K show similar behaviour, with changes in FSR (group velocity) too large for the purely photonic model to explain. They evidence the strong coupling and its strong effect on the curvature of the dispersion relation.
In Fig. 10 we show the experimental FSR for two rings at 300 K as points. For the 8 m radius ring the FSR varies by 25% between lowest and highest energy points over a 54 meV range of energies. This is less than the case at 4 K since the data points at 300 K are for energies further from the exciton where the polaritons are more photonic and the curvature due to strong coupling is therefore expected to be lower. The solid (dashed) curves show the theoretical FSR for polaritons (pure photons). For 8 m radius rings the theory predicts a variation of 24% for polaritons over the same energy range as the experimental points. The purely photonic model can account for a change of only 14%. Overall at 300 K there is better agreement with the strongly coupled model than the purely photonic one, which confirms that the strong coupling is retained in the lasing regime up to room temperature. This is further supported by our observation that above threshold the luminescence peak from the exciton does not exhibit broadening or energy blueshift, which would be expected if we were beyond the Mott density where strong coupling collapses (see main text).
.6 PL spectra without GaN background
At 4 K the polariton emission intensity was integrated in the region where the contribution from the QW and GaN exciton emissions is negligible.
By contrast, the polariton modes at 200 and 300 K sit on a strong, smooth, and broad incoherent PL background coming mainly from the bulk GaN excitons. This background was removed by fitting it with a Gaussian peak. In the main text, our analysis to extract the threshold-like behaviour of the modes relies on the removal of this background for enhanced contrast. In Figs. 11.a and b, we present the PL spectra measured at 200 and 300 K of the 8 m ring with the PL background removed. These spectra show how the modes quickly grow in intensity, much faster than the linear evolution of the GaN exciton peaks themselves (cf. next SM section).
.7 Power dependency of the bulk GaN excitonic luminescence peaks and QW exciton luminescence peaks at different temperatures
One argument used to prove polariton lasing operation is the presence of a sharp threshold at which the PL intensity of the lasing modes rapidly increases. In this section, we give the pulse energy dependency of the integrated PL intensity of the bulk GaN exciton peaks at 4, 200, and 300 K for the 8 m microring resonator (Fig. 12).
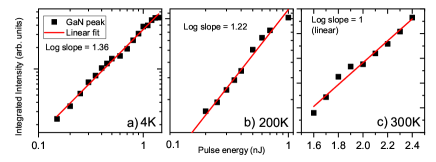
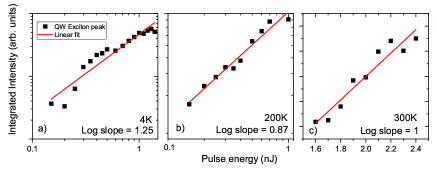
Note that from the log-log scale used to display the data recorded at 4 and 200 K, a slope slightly higher than unity is obtained for the power dependency of the integrated PL intensity of the bulk GaN exciton peaks, which implies a weak nonlinearity. For example, at 4 K, we have a fit leading to . All the exponents remain reasonably close to 1 and hence the power dependence of the bulk GaN exciton peak PL intensity is found to be close to linear. We use a linear scale at 300 K due to the smaller accessible range of powers. This is in sharp contrast with the polariton modes, whose intensity follows a superlinear increase well-above a quadratic function (see the main text). The same analysis applies for the QW excitonic peaks as seen in Fig. 13. Similar results were obtained for the 4 m microring and are shown in Fig. 1 of the main text.
.8 Blueshift of the 4 m ring
Blueshift is a defining feature of polaritons. It is a signature of their non-linearity owing to their excitonic part. In the main text, we have described strong blueshift in the 8 m ring at all temperatures. Such blueshift is also seen in the smaller 4 m ring, as shown in Fig. 14. The difference in the range of pulse energies is due to a slightly different excitation scheme compared to the main text, exciting a smaller part of the ring with each pulse. Under this excitation scheme, the blueshift is much clearer than in Figure 1 of the main text, but happens at higher pulse powers.
[1] J. Ciers, J. G. Roch, J.-F. Carlin, G. Jacopin, R. Butté, and N. Grandjean,
Propagating Polaritons in III-Nitride Slab Waveguides, Phys. Rev. Applied 7,
034019 (2017).
[2] D. M. Di Paola, P. M. Walker, R. P. A. Emmanuele, A. V. Yulin, J. Ciers, Z. Zaidi, J.-F. Carlin, N. Grandjean, I. Shelykh, M. S. Skolnick, R. Butté, and D. N. Krizhanovskii,
Ultrafast-nonlinear ultraviolet pulse modulation in an AlInGaN polariton waveguide operating up to room temperature, Nat. Commun. 12, 3504 (2021).
[3] Stephen Thoms and Douglas S. Macintyre, Investigation of CSAR 62, a new resist for electron beam lithography, J. Vac. Sci. Technol. B 32, 06FJ01 (2014).
[4] A. L. Schawlow and C. H. Townes, Infrared and optical masers, Phys. Rev. 112, 1940–1949 (1958).