[]
[]
[]
[type=editor,auid=000,bioid=1,orcid=0000-0002-0153-1095] URL]https://soumyabrata.dev/ \cormark[1]
[cor1]Corresponding author
Link Climate: An Interoperable Knowledge Graph Platform for Climate Data
Abstract
Climate science has become more ambitious in recent years as global awareness about the environment has grown. To better understand climate, historical climate(e.g. archived meteorological variables such as temperature, wind, water, etc.) and climate-related data (e.g. geographical features and human activities) are widely used by today’s climate research to derive models for an explainable climate change and its effects. However, such data sources are often dispersed across a multitude of disconnected data silos on the Web. Moreover, there is a lack of advanced climate data platforms to enable multi-source heterogeneous climate data analysis, therefore, researchers must face a stern challenge in collecting and analyzing multi-source data. In this paper, we address this problem by proposing a climate knowledge graph for the integration of multiple climate data and other data sources into one service, leveraging Web technologies (e.g. HTTP) for multi-source climate data analysis. The proposed knowledge graph is primarily composed of data from the National Oceanic and Atmospheric Administration’s daily climate summaries, OpenStreetMap, and Wikidata, and it supports joint data queries on these widely used databases. This paper shows, with a use case in Ireland and the United Kingdom, how climate researchers could benefit from this platform as it allows them to easily integrate datasets from different domains and geographical locations.
keywords:
knowledge graph \sepclimate data \sepontology \seplinked data \sepSPARQL \sepclimate change
1 Introduction
Climate change is a pressing and urgent topic in today’s climatic and meteorological research. Scientists are working nonstop to find ways to avoid the harmful consequences of climate change in the future. One of the most important challenges being investigated by researchers is currently how to model big historical climate data and develop algorithms based on the data to predict the effects of climate change (Hu et al., 2018; Yu et al., 2020; Poppick et al., 2020; Fathima et al., 2021, 2019). However, climate can be understood to be a complex ensemble of various meteorological variables such as cloud, precipitation, temperature, wind, water, and so on, all of which are critical to furthering the scientific knowledge of climate (Manandhar et al., 2019, 2018; Wu et al., 2022; Pathan et al., 2021; Dev et al., 2017). The resulting analytical model is inextricably linked to the input data, which consists of observations of the meteorological variables mentioned above. This usually results in time-consuming attempts to identify a sufficient range of suitable input datasets (Wu et al., 2021f, g, 2022c). Additionally, although modern models, particularly those employed in automation systems, are capable of digesting large amounts of data and reaching a certain degree of performance, it is difficult to ascertain the reason behind the automated decisions (Lacayo et al., 2021; Wu et al., 2021c, a). In these intelligent platforms, the way models organize data is much more machine-readable than human-readable.
On the other hand, climate as a system influences - and is also influenced by - additional elements, e.g. regional characteristics (Martel et al., 2018), socioeconomic variables such as gross domestic product, transportation routes, agricultural, and industrial production (Bojinski et al., 2014). There is still a large room for improvement by adding new datasets (e.g. satellite and remote sensing data) to the existing models (Liu et al., 2021). The investment on finding new and diverse (multi-dimensional) data sources is becoming larger (Beretta et al., 2021; Wu et al., 2021b, e). As yet many climatic studies are facing a challenge in examining the relationships between the climate domain and others (Bonan and Doney, 2018; Wu et al., 2022b, d, e). Some of the difficulties may stem from the lack of frameworks or platforms that facilitate cross-domain analysis. Perera et al. (Perera et al., 2018), for example, is adamant about the need for a powerful computational platform that can assess a mix of urban climate, building modeling, and energy system optimization all at once to improve energy system performance. When distinct scientific aims are identified, meteorological variables are supposed to be allocated varying relative importance according to standard criteria, as highlighted in a recent survey (Burrows et al., 2018). According to Burrows et al., new research methodologies for studying climate effects on other disciplines are in urgent need of development.
In view of the growing need for meteorological data sources and computing platforms, this study examines how contemporary Knowledge Graph (KG) approaches can be used as an answer to these difficulties in the climate area. Specifically, we present a standards-based methodology for creating a KG and dynamically updating it using historical climate data from climate data providers (daily observations of meteorological variables and stations). In addition, we show how to integrate geographical information about weather stations from OpenStreetMap111https://www.openstreetmap.org/ and enrich this data by linking identical locations to the corresponding ones on Wikidata (a Wikipedia-based open KG). As a result, our methodology based on KGs facilitates the simultaneous study of numerous meteorological variables as well as cross-domain analysis of heterogeneous climate datasets. The approach is based on W3C Semantic Web standards222https://www.w3.org/standards/semanticweb/ (Berners-Lee et al., 2001) and Linked Data principles (Bizer et al., 2011). As a demonstrating example, along with Wikidata333https://www.wikidata.org/ and OpenStreetMap, we use the NOAA (National Oceanic and Atmospheric Administration) climate data 444https://www.ncdc.noaa.gov/cdo-web/.
The rest of the paper555In the spirit of reproducible research, the source code is available at https://github.com/futaoo/LinkClimate. is organized as follows: Section 2 introduces the related work and indicates where our contributions stand in comparison to said work. Then we provide an overview of the whole workflow in Section 3.1 and describe in Section 3.2 how each component involved contributes to the KG platform’s functionality. Finally, in Section 4 we examine the usability study of our platform to demonstrate how the platform is evaluated by potential users. We suggest that the proposed platform should be considered as a starting point of climate-relevant KG research, and that other KG applications in the climate area should be investigated further.
The novel contributions of this paper are as follows:
-
•
An open online KG populated with NOAA climate data as a means of providing context to data, thus increasing the platform’s explainability, which is often lacking in many automation systems.
-
•
Integration of heterogeneous data sources e.g. climate, with geographic (OpenStreetMap) and encyclopedic (Wikidata) source through use of Linked Data Principles.
-
•
Regular, automated synchronization of heterogeneous data into the KG.
-
•
A Web interface to assist climate researchers in exploring and using the platform.
2 Related Work
The proposed work spans across the following distinct but related domains: ontology modeling (knowledge engineering), geographic data integration, Linked Data, KGs and RDF (Resource Description Framework) data integration and publication. In this section, we describe how prior work in each domain makes up our contributions.
One of the fundamentals to create a KG is to take advantage of ontologies to semantically structure the graph data. Especially for sensor-related data (e.g. climate observations), SSN (the Semantic Sensor Networks) (Haller et al., 2019) and SOSA (Sensor, Observation, Sample, and Actuator) (Janowicz et al., 2019) ontologies are widely employed by scholars as the basic semantics to create domain-specific KGs and for defining and representing data. For example, in our previous work we have proposed the Climate Analysis (CA) ontology (Wu et al., 2021d), an extension of the SOSA ontology by adding adaptable and concrete meteorological and geographic elements associated terms designed to semantically represent tabular NOAA climate data. In this work, we enhance the CA ontology with additional vocabularies (see Section 3.2.2) to further support the flexible API-based NOAA climate data which will be used to create a climate KG able update with dynamic NOAA climate data. In addition, we also align our ontology with additional classes and properties of the AEMET (the Spanish Agency of Meteorology) ontology, which is also defined for the climate domain by Vilches-Blázquez (Vilches-Blázquez et al., 2014). The aim of alignment is to improve the interoperability of heterogeneous resources.
Integration of geographic data into climate domain has been popularly investigated by many researchers. The common tendency is to use GeoNames (Wick et al., 2015), which is a derived knowledge base of Google Maps, as the source for geographic data integration (Escobar et al., 2020). However, there are some other competitive volunteered geographic information providers, but few to be investigated for geographic data integration in climate KGs. For example, OpenStreetMap (OSM) is recently evolved as a key backbone for various OSM applications such as spatial data mining, geographic information services666https://histosm.org/, and GPS tracking777https://gitlab.com/eneiluj/phonetrack-oc. The variety of application innovations create large potential in widening the climate research horizon. Moreover, the geographic entities in OSM (so-called “OSM nodes”) have been linked to Wikidata and DBpedia to bring more contextual, semantic information (Tempelmeier and Demidova, 2021). This motivates our work in using OSM to include geographic information, as well as contextual information for spatial nodes, in our climate KG (e.g. weather stations) instead of GeoNames.
Linked Data, Semantic Web and RDF data publication have been proposed in the past to make KGs available for users across the Web. We use Apache Jena888https://jena.apache.org/documentation/fuseki2/ Fuseki (Seaborne, 2011) TM to configure a triple-store (a RDF graph database) and open a SPARQL endpoint on the Web for users to query our climate KG. In addition, we follow the Linked Data principles to construct the KG and every node is associated with a unique URI able to be dereferenced with any standard web browser. We adopted the tool LodView999https://lodview.it/ to dereference these URIs. The advantage of using LodView is that it is a graph-like RDF browser and the dereferenciation complies with W3C standards.
3 Workflow
3.1 Graphical Overview
Fig 1 depicts an automatic procedure to integrate and adapt climate and “beyond-climate” data within KG’s norms. First, the procedure starts by requesting climate data from the NOAA service APIs (described in Section 3.2.1) as an input for the KG’s automated creation. It should be noted that a KG is meant to be assembled following specific KG data schema aka. “Ontology” (Hogan et al., 2020). The CA ontology (described in Section 3.2.2) is used to structure and introduce consistent semantics to the raw data retrieved from NOAA. Second, OpenStreetMap-based geographic information, such as counties and cities of climate stations, is integrated to enrich the KG serving as the reference for including the corresponding identical entities in Wikidata (specified in Section 3.2.6). Finally, we use a Linked Data platform101010http://jresearch.ucd.ie/linkclimate/index.html to publish the KG and dereference all URIs of entities and concepts presented in the CA ontology (specified in Section 3.2.7) for data navigation over HTTP. Further details about each step are presented independently in the following workflow design section.
3.2 Design of the workflow components
3.2.1 Selection of NOAA data services
The application is designed to get climatic data from the data vendor as input at the start of the workflow. According to the NOAA website, there are three main options for fetching the data and for implementing this initial step: Search Tool111111https://www.ncdc.noaa.gov/cdo-web/search (data is retrievable by filling in the forms), FTP121212https://www1.ncdc.noaa.gov/pub/data/ghcn/daily/ (data is retrievable by dump downloading), and Service APIs131313https://www.ncdc.noaa.gov/cdo-web/webservices (data is retrievable by programmable methods). We conclude from employing the REST APIs for obtaining the NOAA climate data as they are made up of parameterized HTTP methods that are generally meant for developers. As compared with the former two services, REST API is the most frequently changing, lightweight, and least constrained, typically beneficial to be utilized as the building block for creating the climate observations KG in this study.
3.2.2 Upper-level semantics creation
A notable characteristic of the KG is that it is structured under some domain specific ontology, i.e. a collection of human- and machine-readable vocabularies for describing concepts and relationships inferred by data (Gruber, 2018). Ontology confers data a semantic manifestation of their relationships (Hogan et al., 2020). The main advantage is that it allows for the creation of an accurate machine-understandable data structure, allowing data to be processed and inferred by algorithms and logic (knowledge reasoning) in a manner comparable to human thinking (Lassila, 1998). The CA ontology reuses parts of certain additional open ontologies, e.g. SSN/SOSA ontology (sensors modeling), WGS84 ontology141414https://www.w3.org/2003/01/geo/ (spatial entities modeling), QUDT ontology151515http://www.qudt.org/ (units of measure, quantity kinds, and data types modeling), to organize NOAA climate data obtained over HTTP to develop the semantics of the climate KG. The reuse of existing ontologies can lower the cost of developing an ontology for a given topic and improve the interoperability between computer applications.
The vocabulary used in CA will correspond with the data schema underpinning the data acquired via the NOAA Service APIs, as well as providing more human-understandable interpretations for the data by a simple subject-predicate-object grammar (e.g. “Dublin”-“isCityOf”-“Ireland”). A summary of the steps involved in the entire procedure is as follows. (1) The first step is to look at the structure of the NOAA climate data format. We deduced the schema indirectly from a number of Service APIs’ HTTP endpoints because NOAA does not provide it explicitly. This is theoretically feasible since NOAA climate data records of various categories are delivered as key-value pairs with a predetermined set of keys depending on the endpoint. For instance: “{baseurl}/datasets” offering access to dataset instance records only (e.g. “Global Summary of the Year” dataset), and “{baseurl}/stations” available only for station instance records. Furthermore, these endpoints accept utilizing arguments to impose scope constraints for data selection. For instance, request to “{baseurl}/stations?locationid=FIPS:UK” will simply return all UK’s stations information. The above API features imply a clear data structure that is conducive to KG schema alignment. After that, (2) we define a collection of vocabularies that are inspired by the aforementioned accessible HTTP endpoints and their accompanying retrievable climate data entries to establish the ontology (CA) for the proposed climate KG. These vocabularies are grouped into two categories: Classes and Properties each of which will only include a few of the most relevant keywords in this paper. (Fig. 2 shows a example of how CA ontology describes the NOAA climate data).
Classes
The main classes defined in CA are consistent with the number of endpoints used in Service APIs. Table 1 lists in rows the alignment of our CA classes with the NOAA Web Service APIs endpoints, as well as their interpretations.
| Ontology Term | Endpoint | Interpretation |
| Dataset | /datasets | Class for dataset instances (e.g. “GSOY”, “GHCND”) |
| DataCategory | /datacategories | Class for data category instances (e.g. “Precipitation”, “Temperature”) |
| DataType | /datatypes | Class for data type instances (e.g. “Average Temperature”) |
| LocationCategory | /locationcategories | Class for the category of location (e.g. “City”, “Country”) |
| Location | /locations | Class for locations (e.g. “Dubai, AE”) |
| Station | /stations | Class for stations |
| Observation (SOSA) | /data | Class for observations made by stations |
Properties
The main ontology properties are aligned with the fields of retrieved JSON data from the NOAA API endpoints and can be referred to on Table 2.
| Onotlogy Term | Data Field | Interpretation |
| name | “name” | literal name of an entity |
| isLocatedIn | parameter ?locationid on request | location of an entity (if applicable) |
| elev/lat/long | “elevation”/“latitude” /“longitude” | elevation/latitude/longitude of an entity (if applicable) |
| elevUnit | “elevationUnit” | the measure units of entity’s elevation |
| inDataCategory | parameter ?datacategoryid on request | the data category of an data type |
| sourceStation | “station” | the station where the data release |
| resultTime (SOSA) | “date” | the time when observation happened |
| withDataType | “datatype” | the data type of the data value |
| numericValue (qudt) | “value” | the observed value |
| hasResult (SOSA) | nested with withDataType, numericValue | the observed result |
3.2.3 Ontology alignment
The CA ontology is built using a blend of the vocabulary from open ontologies and the vocabulary we created independently. In order to achieve better integrative compatibility (providing the identical semantics) with large outside linked datasets, we align some of the classes and properties we created exclusively in CA with vocabularies that are either already accepted as extendable ontologies by W3C (World Wide Web Consortium161616https://www.w3.org/) standards, such as SOSA/SSN, or defined in sophisticated KGs owned by other communities. In this study, ontology alignment was accomplished manually by identifying the conceptual relations between CA and other ontologies, such as concept inclusion and concept equivalence. A key benefit of manual alignment in this research is guaranteeing the correctness of the ontology alignment from an expert’s perspective for minimizing non-standard ontologies and maximizing the usage of standard ontologies such as SOSA/SSN. For any more studies that want to adapt and scale up this methodology, it may be helpful to adopt some automated ontology alignment methods initially, followed by expert review, in order to reduce the alignment time for ontological heterogeneity while ensuring the correctness.
The alignment generally happens when associating CA ontology concepts (i.e. class and property terminologies) to those established in other ontologies using RDF schema171717https://www.w3.org/TR/rdf-schema/ and OWL (the Web Ontology Language) vocabularies181818https://www.w3.org/TR/2012/REC-owl2-overview-20121211/. For example, in CA, rdfs:subClassOf is applied to ca:Result to extend the W3C standard class sosa:Result, allowing the related instances to be assigned the CA-specific properties. Furthermore, because several KGs in this field have specified a number of well-conceptualized vocabularies, we match some of the CA vocabularies with the ontologies applied to those KGs by finding vocabularies with equal meanings. This study targets the Spanish climate KG—AEMET191919http://aemet.linkeddata.es/index_en.html, and alignment between all identical conceptions is achieved using owl:sameAs (for example, ca:Locationowl:sameAs aemet:AdministrativeArea, ca:Stationowl:sameAs aemet:WeatherStation). This alignment will allow for the formation of conceptional linkages to the AEMET KG, as well as the avoidance of lexical repetition caused by the development of similar concepts in different name-spaces.
3.2.4 Collection strategy
On the NOAA website, climate data is updated using uploads from real-world observation stations. However, because data is transmitted at different times from different stations, collecting all of the updates at the same timestamp is impractical. To compensate, this study employs a simple but effective data gathering approach that downloads data from a fixed-length historical period (also known as a sliding window) prior to the data gathering time. Every historical record will undoubtedly be duplicated several times as the collection progresses, until the historical records run out of the window. Although employing a long duration length improves the completeness of fetched data, it is evident that this benefit is contingent on the amount of repeated data growing with the window length. We empirically settle on a four-week timeframe, which is long enough to minimize data loss owing to submission delays, while also avoiding excessive data collection duplication. It is also worth noting that duplication issue can be skipped loosely when inserting data into a KG, because any triplestore that complies with the Graph Store HTTP Protocol202020https://www.w3.org/TR/sparql11-http-rdf-update/ would delete duplicates effectively.
3.2.5 Publishing as Linked Data
Data published as Linked Data is key to efficiently constructing KGs. The core notion of Linked Data is to create a network of data in which every single piece of published data on the Internet has the ability to connect to and be connected to other Linked Data sources (Orlandi et al., 2019). This work publishes CDO datasets as Linked Data, allowing users to take advantages of HTTP technologies to investigate the possibilities of intersecting data with domains other than climate. One of the key benefits of this approach is the capability of enriching the data context, as seen in Section 3.2.6.
We setup a RDF triplestore for the storing of climatic RDF triples and also configure the Web-wide SPARQL endpoint212121http://jresearch.ucd.ie/kg/ to establish NOAA climate data as Linked Data. Researchers that are interested in these data may use the endpoint to submit queries directly. Obtaining data from a SPARQL endpoint, on the other hand, necessitates some understanding of the SPARQL language, which may be unfamiliar to researchers from various backgrounds who have no prior experience with Linked Data processing. To unravel the complexity in the use of SPARQL to some extent, a step-by-step online guide –which will be elucidated in Section 4– is created for the first user interactions with the SPARQL query language on exploring NOAA climate data.
3.2.6 Linkage to OpenStreetMap and Wikidata
In many situations of climate-related research, such as these more recent studies (Stockhause et al., 2020; Vermeulen et al., 2020), data from several domains is likely to be collected to see how climate interacts with other domains (e.g. global warming vs. urbanization). This generally entails analysis covering a wider range of data sources. As Linked Data is one of popular ways for this sort of analysis (Zouaq et al., 2017), we explore more in this area to connect more supplementary data with the proposed NOAA linked climate data. The general tactics proposed in this paper is to achieve the linkage of the NOAA climate data with OpenStreetMap nodes and Wikidata which has recently been discovered to be the most competitive open encyclopedic data source of detailed information about countries, cities, persons, among others (e.g. DBpedia222222https://wiki.dbpedia.org/, YAGO232323https://yago-knowledge.org/) (Mora-Cantallops et al., 2019).
To implement the aforementioned linkage, we begin with all stations recorded in CDO datasets in terms of their explicitly recorded longitude and latitude coordinates. Then, over HTTP, OpenStreetMap is employed to request detailed geographical information–country subdivisions that include the coordinates–via its reverse geocoding APIs242424https://nominatim.org/release-docs/develop/api/Reverse/. The returned results include rich subdivisions in relation to the administrative areas of the coordinates from levels of country, city, county etc. of which each entity is bound with its unique WikiData code. Finally, these geographical data, which are stored in various formats (e.g. JSON), are transformed into CA ontology-compliant data using a well-designed mapping process, and then linked to the station that generated them in the first place (a graphical view of this linkage is given in Fig. 3). As a result, our Linked Data platform now supports joint queries combining Wikidata for contextual information regarding a geographic node. For a query example, see Listing 1, where “?sta”, “?wb”, “?addr”, “?loc”, “?wd” represent station, water body, address, location, and Wikidata key, respectively. Property wdt:P206 is defined by Wikidata ontology as the interpretation “located in or next to body of water”?. The solutions to this query in effect answer the nearby water bodies (i.e oceans, seas, lakes etc.) of all stations of concern in CDO datasets, which can be helpful to find the weather discrepancies caused by water bodies’ characteristics.
![[Uncaptioned image]](/html/2210.16050/assets/listing1.png)
3.2.7 URI dereference
This work supports URI deferencing by providing precise RDF statements for each URI-named entities in the SPARQL endpoint. Users might read the statements to comprehend the semantic meaning associated with the URI-denoted item. When related entities (e.g. “Ireland”) and literal properties (e.g. “altitude”, “longitude”, and “latitude”) are presented, the URI identifying the “‘DUBLIN PHOENIX PARK” station is specified by additional associated information, as illustrated in Fig 4. Furthermore, users of this dereferencing system have access to an additional graphical view of the knowledge network in which graph nodes (i.e. URIs) are interconnected with other nodes and the scope of the view may be expanded along with node access.
3.3 Implementation
In practice, the above workflow is built by a set of Python scripts which are available in our Github repository252525https://github.com/futaoo/LinkClimate. In summary, these scripts implements functionalities including (in order): definition of the proposed CA ontology, weekly retrieval of online NOAA climate data, data transformation, and lastly storage as Linked Data. We now have 14 millions RDF triples about climate data stored in our Jena/Fuseki SPARQL endpoint.
3.4 Knowledge graph evaluation with competency questions
Competency questions (Debruyne et al., 2022) are a collection of questions proposed by a group of domain stakeholders for the purpose of evaluating a system’s capacity to answer these questions using the data it maintains. If the system is capable of answering the competence questions, the information is considered acceptable and well-organized (by the ontology) for the domain applications. The LinkClimate knowledge graph is designed to accommodate the climate data requirements for potential analysis. To evaluate LinkClimate in terms of possible climate analytical scenarios in the domain, we convened multiple meetings with domain experts and compiled the following 11 competency questions for LinkClimate to address.
-
1.
Where are all the stations that are located in a particular administrative region?
-
2.
Which station is the nearest to a certain station?
-
3.
Which stations fall inside a certain range of latitude and longitude coordinates?
-
4.
How can I group stations according to a particular observed climatic variable?
-
5.
How to find climate variables that are recorded by a particular station?
-
6.
How long has a certain climatic variable been monitored by a particular station?
-
7.
How can a time series for a single climatic variable be retrieved?
-
8.
How can a time series for a number of different climatic variables be retrieved?
-
9.
How can station observations be aggregated according to their temporal resolution?
-
10.
How can I determine the station’s geographical context?
-
11.
How to include extra environmental data into a station’s or set of stations’ knowledge graph in order to do cross-domain data analysis?
The knowledge graph is evaluated using the approach proposed by Haussmann et al. in the paper (Haussmann et al., 2019), which involves querying the knowledge graph’s underlying ontology using SPARQL. Because the knowledge graph’s information, such as the links between stations and climatic variables, is directly reflected in the ontology (see Section 3.2.2), the evaluation also reveals the ontology’s competence for the domain applications. The evaluation results indicate that SPARQL queries are capable of providing adequate responses to competency questions. Specifically, for questions concerning the geographical relationships between stations, i.e., questions 2 and 3, SPARQL can currently provide answers by querying the longitude and latitude coordinates. To determine the geographical relationships (e.g. locating stations within a given area such as a bounding box in terms of south Latitude, north Latitude, west Longitude, east Longitude), however, additional computations based on the coordinates must be conducted. To further simplify this type of geographical computing using SPARQL, we want to include the GeoSPARQL semantics with an engine implementation (Car and Homburg, 2022) into our framework in the future, allowing for more queryable geographical relations. The remaining questions can be answered directly. To summarize, we present examples of SPARQL queries written for questions 8 and 9. We advise visitors to this page262626https://github.com/futaoo/LinkClimate/blob/main/Competency-Questions.md for an in-depth evaluation process. In summary, each of the competence questions above can be addressed using a SPARQL query, and LinkClimate supplies the expected data for all of them.
![[Uncaptioned image]](/html/2210.16050/assets/listing2.png)
![[Uncaptioned image]](/html/2210.16050/assets/listing3.png)
4 Web Interface
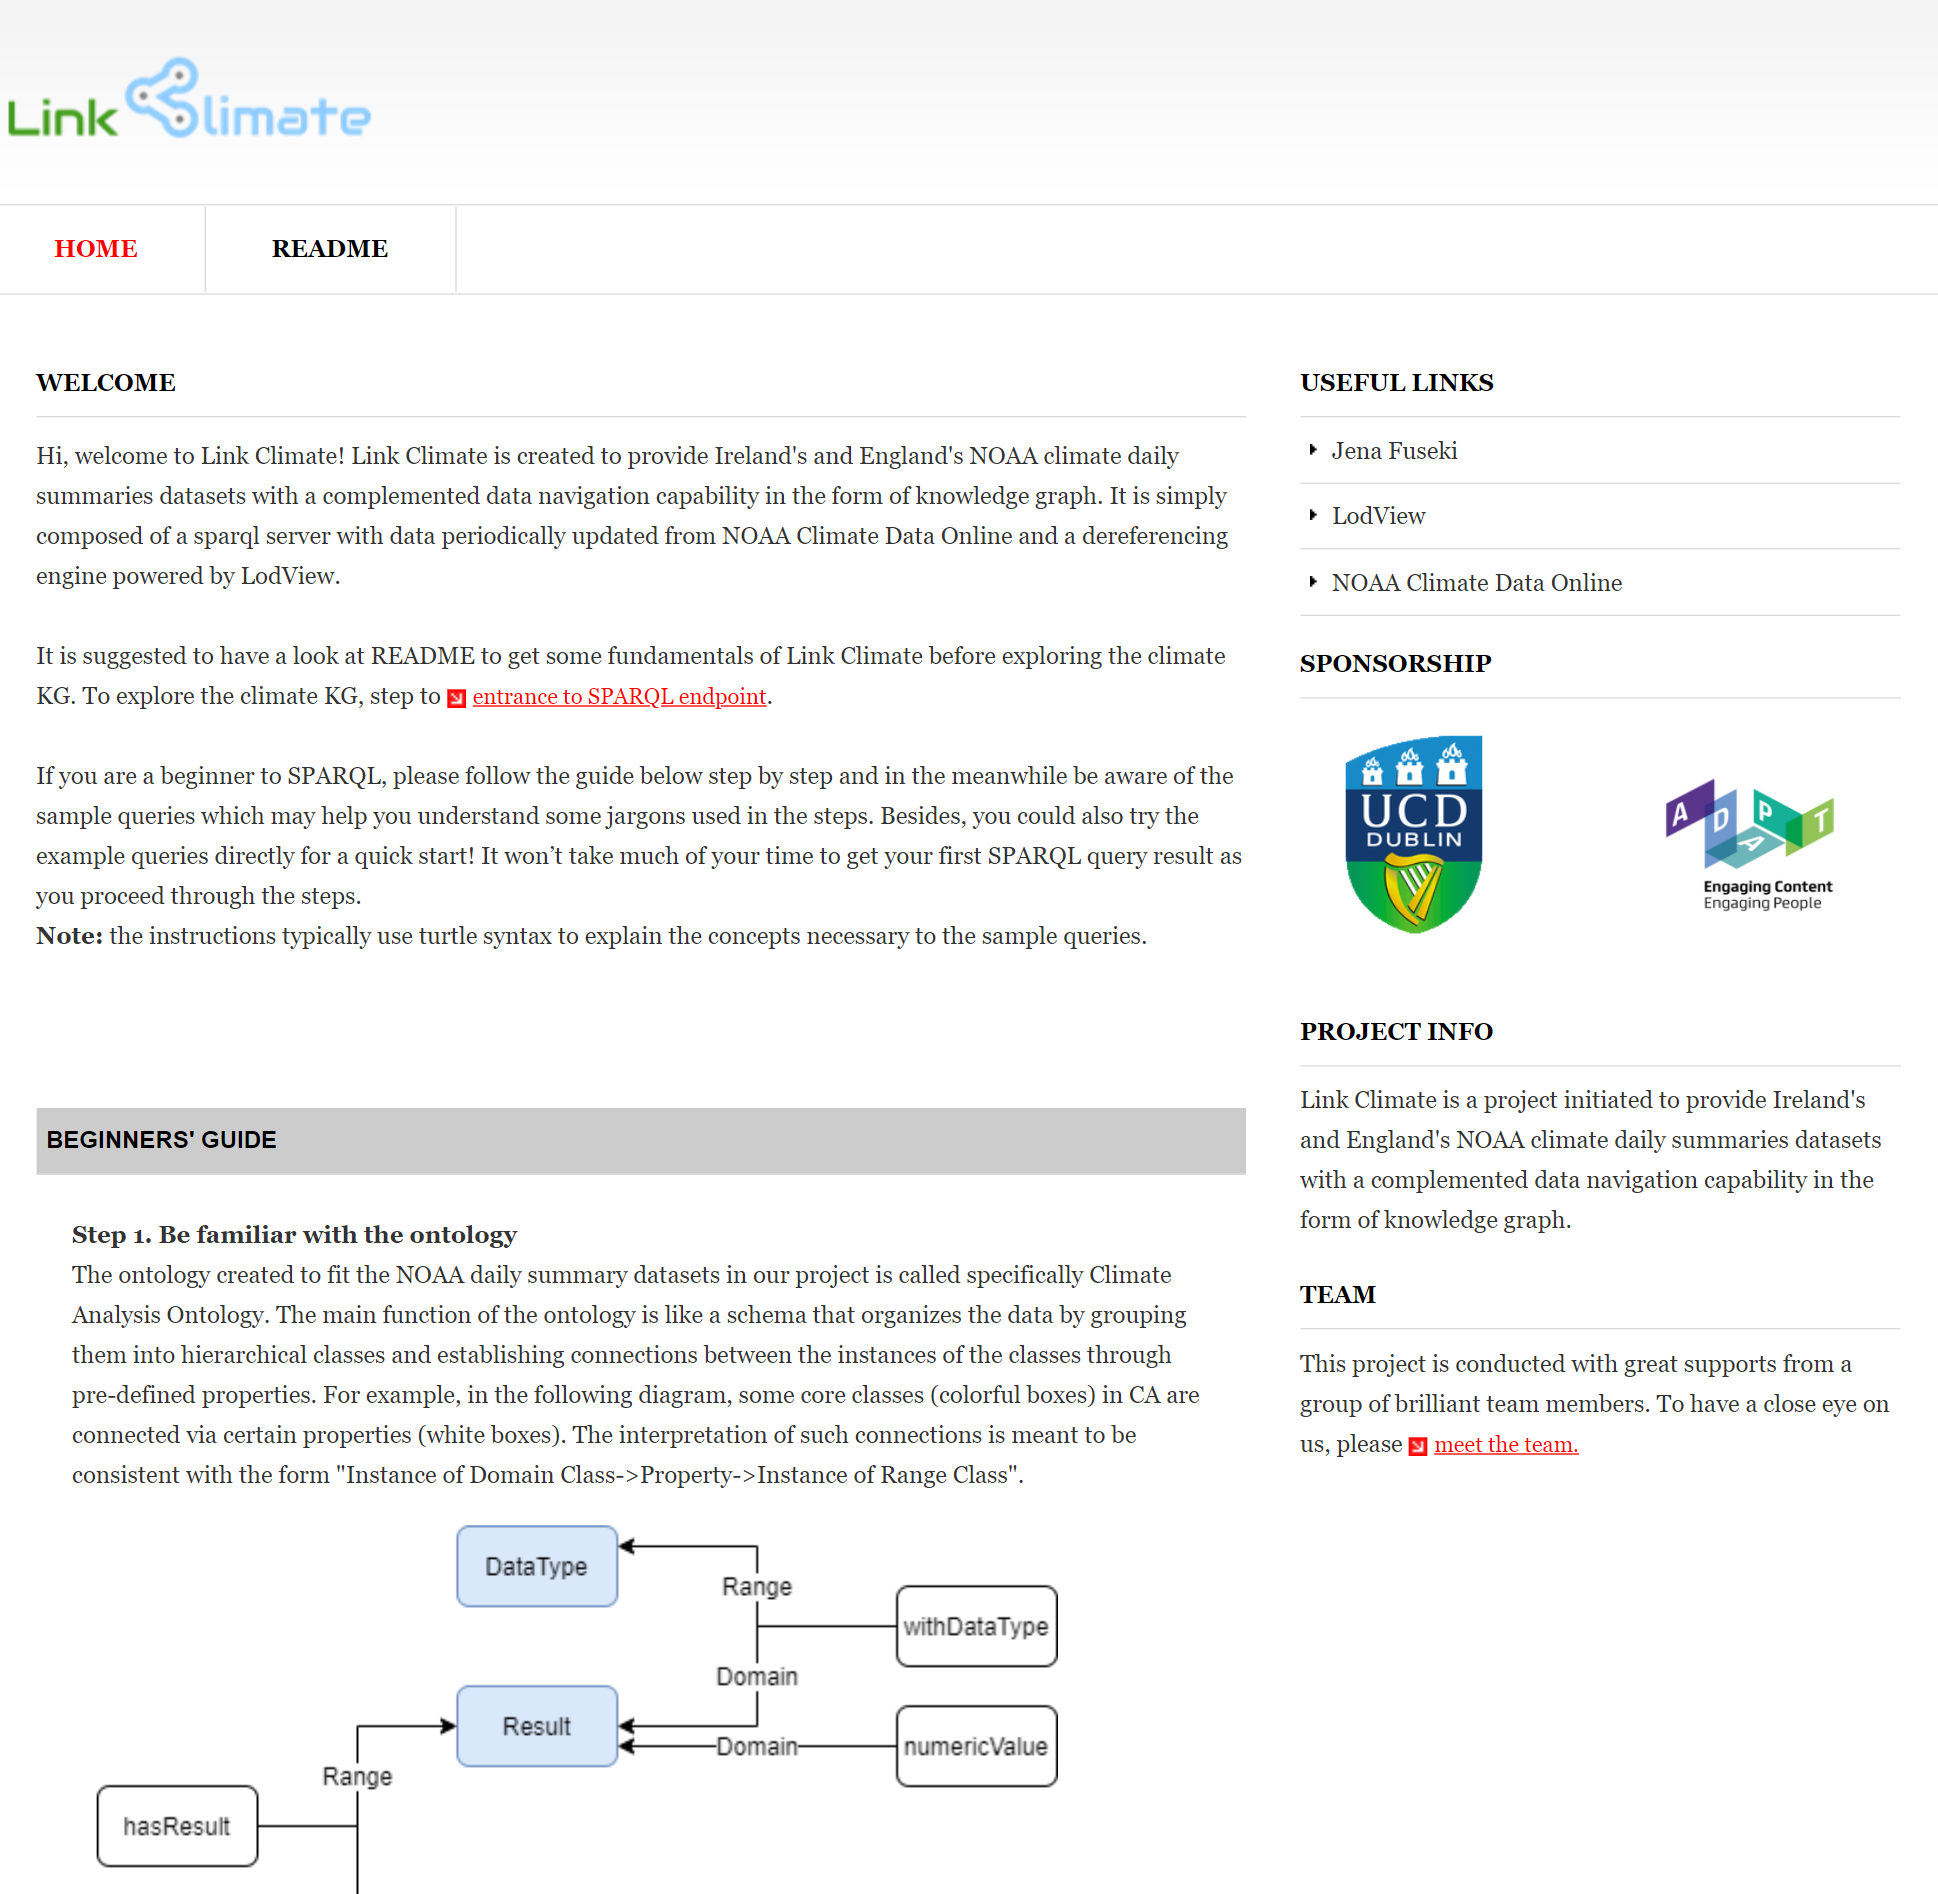
We created a supplementary instructional website272727http://jresearch.ucd.ie/linkclimate/ for users who are unfamiliar with the KG database and its involved operations (e.g. SPARQL query). Users can learn about the CA ontology through schematic diagrams presented on the website and then have some quick hands-on queries to our SPARQL endpoint by following a step-by-step beginner’s guidance. Third-party tools used in this project such as Jena Fuseki, are also detailed on the website so that users can learn how to utilize them. Finally, a usability test has been undertaken to obtain first-hand feedback from testing participants about their experience on using the website.
4.1 Interface Overview
The website’s goal is to assist users in discovering and operating our climate KG (technique perspectives) and propagate KG applications in the climate domain (project perspectives). The website (a snapshot is shown in Fig. 5) primarily gives instructions based on two subjects, one of which is a “Readme” instruction and the other is a “Beginners’ guide”. The purpose of the “Readme” is to familiarize users with the CA ontology’s key vocabulary and how the structure of climate data is modeled. Beginners should use the KG as a starting point for their practice by following the tasks specified by “Beginners’ guide”. Users are encouraged to read the “Readme” and “Beginners’ guide” to gain a basic understanding of the climate KG and to get some hands-on practice. The usability test in Section 4.2 will show how this website design meets the desired goals.
4.2 Usability Test
The purpose of usability testing is to confirm that the product can work according to the specification. A successful usable product is supposed to guarantee that the product can help users to complete their tasks in a manner which easily meet their needs (Dumas et al., 1999). We designed tasks for potential users to practice and gather their feedback after traversing the content of the web interface. This allows us to have a more in-depth understanding of the success of each functionality, as well as thoughts on how to improve the web interface in the future iterative development on the interface.
4.2.1 Methods
We perform a usability test to obtain feedback on how the features of the web interface satisfy users in exploring our climate KG. Our Human Research Ethics Committee has authorized the test with code (LS-E-20-199-Wu-Dev). The participants were recruited using advertisements on several social media platforms (e.g., Twitter, WeChat, and a standalone Web-page) as well as emails that included a link to a Google form for collecting replies. The majority of the participants have little experience with KGs but have a basic comprehension of computer science fundamentals, such as database fundamentals. For people who are not proficient in English, a translated survey form (Chinese version) is supplied for helping them readily give the answers. In total, we have received 31 user responses about their practice with the web interface.
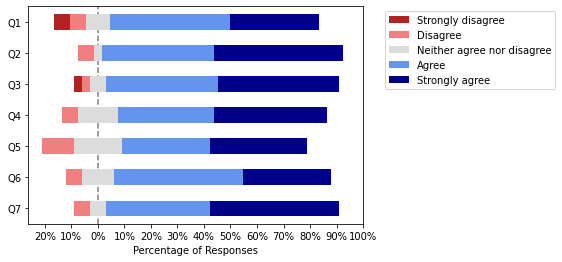
The protocol of the questionnaire is designed referring to the widely used PSSUQ (Post-Study System Usability Questionnaire) (Lewis, 1992) which particularly takes into account together the usage of pre-designed tasks and the usability of the website (Fruhling and Lee, 2005; Valadi and Broneske, ) amongst other questionnaire standards, such as the SUS (Software Usability Scale), QUIS (Questionnaire for User Interaction Satisfaction), and SUMI (Software Usability Measurement Inventory). During the usability test, participants are asked to finish a number of SPARQL query tasks posted on the website before completing the questionnaire. The questionnaire contains the following 7 Likert scale questions (1 lowest → 5 highest) and a blank area in the end for participants to leave their comments.
-
Q1.
I would agree that the website could properly spark users’ interest in getting their hands on various functions integrated on the website.
-
Q2.
I am clear about the topic of the project after reading all the descriptive information on the webpage.
-
Q3.
I thought the beginner’s guide could reduce the difficulty for non-expert users in accessing some climate data from a KG.
-
Q4.
I have a preliminary knowledge of how to get some climate data after exploring the website.
-
Q5.
I have a preliminary knowledge of how to navigate the climate data by avail of the provided GUI (step 4 in beginner’s guide).
-
Q6.
With the GUI, I would have a more comprehensive understanding of the knowledge graph structure.
-
Q7.
I am confident that the project is favorable to people who work with climate data.
The questions are designed to fall into 2-class categories, as mentioned in Section 4.1: project level and technical level. At the project level, users are asked to rate Curiousness (Q1), Understandability (Q2), and Usefulness (Q7) in terms of their experience on the application of KG in the climate domain. At the technical level, we aim at Instructiveness of SPARQL (Q3 and Q4), and Instructiveness of GUI (Q5 and Q6), which are two important essentials given by this website. The following Section 4.2.2 examines the overall evaluation results and users’ comments.
4.2.2 Results
We first calculated the mean score (M) and standard deviation (STD) of each question, as shown in Table 3, then presented the overall Likert responses in a single diagram (see Fig 6) to provide a visual perception of the statistics made on the scores graded by users. In general, the combination of Table 3 and Fig 6 demonstrates a positive attitude is received from participants towards our Web interface, both at project level and technical level. In particular, Q2 and Q7 reaches the highest average scores (M4.30, STD0.85) hence the web interface is most effective in making users easily understand the initiative of our climate KG project and is considered as a useful tool to boost the climate research in relation to climate data. For the other aspects in testing, i.e. Curiousness, Instructiveness of SPARQL, and Instructiveness of GUI, the answers are generally around (M4.00, STD1.00) which guarantee that the instructive tasks are acceptable in practice. However, some users who gave lower scores also left the following comments which are valuable for directing our future developments:
-
(1)
“I think it is an attractive project, with very concise tutorials and case demonstrations…but I may be a little strange to GUI…I tried to read the text for several times…”
-
(2)
“…the ‘Beginner’s Guide’ and ‘Sample Queries’ sections talk more about SPARQL instead…a good idea to smoothen the transition by letting him use the tool first (without any technicalities) and then gradually unfold the technical aspects.”
-
(3)
“In order to better spark users’ interest…it would be great to have an embedded interface on the home page, so that users could play around.”
-
(4)
“It would likely be more helpful if the Beginner’s Guide section showed both query and sample output rows as illustrations, to provide more context for what’s being described.”
-
(5)
“…Clicking on the "Try it on Sparql" should probably open a new tab/window as it is an example…”
The comments reflect that the GUI and SPARQL instructiveness should be more intuitive, and one of the most shared user expectations is to embed part of the application in a frame directly on the website, instead of using redirecting links. Additionally, the order of instruction and visualization is advised to be altered so to raise users’ interest immediately with a visualization tool and then unfolding the technical specifications later.
| Q1 | Q2 | Q3 | Q4 | Q5 | Q6 | Q7 | |
| M | |||||||
| STD |
5 Conclusions and Future Work
This paper proposes an approach that targets online climate data, specifically NOAA data, which contains extensive archives of 1) historical climatic observations of meteorological variables and 2) meteorological stations from throughout the world. We fetch these data archives and construct a climate KG to store them. The KG is then automatically synchronized with the dynamic data sources and published on an Open Linked Data platform, publicly available on the Web. This facilitates the local KG’s extensibility, as new datasets that observe the Linked Data protocol may be retrievable via linking with identical data instances in the Linked Data platform. As all of the stations in NOAA datasets are specified by latitude and longitude, we gather more information regarding the geographic coordinates by searching in the OpenStreetMap database. Especially, the Wikidata codes of the coordinates are used to introduce the Wikidata descriptions according to the coordinates in our climate KG. As a result, users can explore more information on the stations, beyond the NOAA online climate data, for example, identifying nearby water bodies, mountains, etc. All this information is presented to users via a Web interface exposing Linked Data in a dynamic and transparent way. Finally, we conduct a survey with real users to collect their feedback on their experience with our platform. The results show that the platform performs well in unraveling the difficulties non-expert users may encounter when they make attempts to explore the KG, and the instructions provide fundamentals of climate KG. In the future, we will first start taking into account the advice from users’ feedback, embedding applications directly in a frame on the website to strengthen the instructiveness of the climate KG platform. Then, the next phase will be to add more concepts into CA ontology for the integration of other climate-related data sources, such as remote climate data sources, such as air pollution, ocean data and NetCDF formatted data. Depending on the complexity level of the extended CA ontology, we may further apply a semi-automatic ontology alignment approach to see if it can actually expedite the establishment of compatibility with other ontologies. The anticipated outcome will boost the cross-domain climate related research(Zeng et al., 2019).
Acknowledgments
This research was partially funded by the EU H2020 research and innovation programme under the Marie Skłodowska-Curie Grant Agreement No. 713567 at the ADAPT SFI Research Centre at Trinity College Dublin. The ADAPT Centre for Digital Content Technology is funded under the SFI Research Centres Programme (Grant 13/RC/2106_P2) and is co-funded under the European Regional Development Fund.
Computer Code Availability
The source code related to this manuscript is available via https://github.com/futaoo/LinkClimate.
CRediT author statement
Jiantao Wu: Conceptualization, Methodology, Software, Data curation, Writing- Original draft preparation, Visualization, Investigation, Writing- Reviewing and Editing; Fabrizio Orlandi: Conceptualization, Methodology, Software, Data curation, Supervision, Writing- Original draft preparation, Investigation, Validation, Writing- Reviewing and Editing; Declan O’Sullivan: Methodology, Writing- Original draft preparation, Writing- Reviewing and Editing; Soumyabrata Dev: Conceptualization, Methodology, Supervision, Writing- Original draft preparation, Investigation, Validation, Writing- Reviewing and Editing.
References
- Beretta et al. (2021) Beretta, V., Desconnets, J.C., Mougenot, I., Arslan, M., Barde, J., Chaffard, V., 2021. A user-centric metadata model to foster sharing and reuse of multidisciplinary datasets in environmental and life sciences. Comput. Geosci. 154, 104807.
- Berners-Lee et al. (2001) Berners-Lee, T., Hendler, J., Lassila, O., 2001. The semantic web. Sci. Am. .
- Bizer et al. (2011) Bizer, C., Heath, T., Berners-Lee, T., 2011. Linked data: The story so far, in: Semantic services, interoperability and web applications: emerging concepts. IGI Global, pp. 205–227.
- Bojinski et al. (2014) Bojinski, S., Verstraete, M., Peterson, T.C., Richter, C., Simmons, A., Zemp, M., 2014. The concept of essential climate variables in support of climate research, applications, and policy. Bulletin of the American Meteorological Society 95, 1431–1443.
- Bonan and Doney (2018) Bonan, G.B., Doney, S.C., 2018. Climate, ecosystems, and planetary futures: The challenge to predict life in earth system models. Science 359.
- Burrows et al. (2018) Burrows, S.M., Dasgupta, A., Reehl, S., Bramer, L., Ma, P.L., Rasch, P.J., Qian, Y., 2018. Characterizing the relative importance assigned to physical variables by climate scientists when assessing atmospheric climate model fidelity. Advances in Atmospheric Sciences 35, 1101–1113.
- Car and Homburg (2022) Car, N.J., Homburg, T., 2022. GeoSPARQL 1.1: Motivations, details and applications of the decadal update to the most important geospatial LOD standard. ISPRS International Journal of Geo-Information 11, 117.
- Debruyne et al. (2022) Debruyne, C., Munnelly, G., Kilgallon, L., O’Sullivan, D., Crooks, P., 2022. Creating a knowledge graph for Ireland’s lost history: Knowledge engineering and curation in the Beyond 2022 project. J. Comput. Cult. Herit. 15, 1–25.
- Dev et al. (2017) Dev, S., Manandhar, S., Yuan, F., Lee, Y.H., Winkler, S., 2017. Cloud radiative effect study using sky camera. pp. 65–66.
- Dumas et al. (1999) Dumas, J.S., Dumas, J.S., Redish, J., 1999. A practical guide to usability testing. Intellect books.
- Escobar et al. (2020) Escobar, P., Roldán-García, M.d.M., Peral, J., Candela, G., García-Nieto, J., 2020. An ontology-based framework for publishing and exploiting linked open data: A use case on water resources management. Applied Sciences 10, 779.
- Fathima et al. (2019) Fathima, T., Nedumpozhimana, V., Lee, Y.H., Winkler, S., Dev, S., 2019. A chaotic approach on solar irradiance forecasting. pp. 2724–2728.
- Fathima et al. (2021) Fathima, T., Nedumpozhimana, V., Wu, J., Lee, Y.H., Dev, S., 2021. Role of temporal information for multi-step ahead forecasting of solar irradiance, in: 2021 Photonics & Electromagnetics Research Symposium (PIERS), IEEE. pp. 2342–2346.
- Fruhling and Lee (2005) Fruhling, A., Lee, S., 2005. Assessing the reliability, validity and adaptability of PSSUQ. AMCIS 2005 proceedings , 378.
- Gruber (2018) Gruber, T., 2018. Ontology.
- Haller et al. (2019) Haller, A., Janowicz, K., Cox, S.J., Lefrançois, M., Taylor, K., Le Phuoc, D., Lieberman, J., García-Castro, R., Atkinson, R., Stadler, C., 2019. The modular SSN ontology: A joint W3C and OGC standard specifying the semantics of sensors, observations, sampling, and actuation. Semantic Web 10, 9–32.
- Haussmann et al. (2019) Haussmann, S., Seneviratne, O., Chen, Y., Ne’eman, Y., Codella, J., Chen, C.H., McGuinness, D.L., Zaki, M.J., 2019. FoodKG: A Semantics-Driven knowledge graph for food recommendation, in: The Semantic Web – ISWC 2019, Springer International Publishing. pp. 146–162.
- Hogan et al. (2020) Hogan, A., Blomqvist, E., Cochez, M., d’Amato, C., de Melo, G., Gutierrez, C., Gayo, J.E.L., Kirrane, S., Neumaier, S., Polleres, A., et al., 2020. Knowledge graphs. arXiv preprint arXiv:2003.02320 .
- Hu et al. (2018) Hu, F., Yang, C., Schnase, J.L., Duffy, D.Q., Xu, M., Bowen, M.K., Lee, T., Song, W., 2018. ClimateSpark: An in-memory distributed computing framework for big climate data analytics. Comput. Geosci. 115, 154–166.
- Janowicz et al. (2019) Janowicz, K., Haller, A., Cox, S.J., Le Phuoc, D., Lefrançois, M., 2019. SOSA: A lightweight ontology for sensors, observations, samples, and actuators. Journal of Web Semantics 56, 1–10.
- Lacayo et al. (2021) Lacayo, M., Rodila, D., Giuliani, G., Lehmann, A., 2021. A framework for ecosystem service assessment using GIS interoperability standards. Comput. Geosci. 154, 104821.
- Lassila (1998) Lassila, O., 1998. Web metadata: a matter of semantics. IEEE Internet Computing 2, 30–37. doi:10.1109/4236.707688.
- Lewis (1992) Lewis, J.R., 1992. Psychometric evaluation of the post-study system usability questionnaire: The PSSUQ, in: Proceedings of the Human Factors Society Annual Meeting, Sage Publications Sage CA: Los Angeles, CA. pp. 1259–1260.
- Liu et al. (2021) Liu, B., Wan, W., Hong, Y., 2021. Can the accuracy of sea surface salinity measurement be improved by incorporating spaceborne GNSS-Reflectometry? IEEE Geoscience and Remote Sensing Letters 18, 3–7.
- Manandhar et al. (2019) Manandhar, S., Dev, S., Lee, Y.H., Meng, Y.S., Winkler, S., 2019. A Data-Driven approach for accurate rainfall prediction. IEEE Trans. Geosci. Remote Sens. 57, 9323–9331.
- Manandhar et al. (2018) Manandhar, S., Dev, S., Lee, Y.H., Winkler, S., Meng, Y.S., 2018. Systematic study of weather variables for rainfall detection. pp. 3027–3030.
- Martel et al. (2018) Martel, J.L., Mailhot, A., Brissette, F., Caya, D., 2018. Role of natural climate variability in the detection of anthropogenic climate change signal for mean and extreme precipitation at local and regional scales. Journal of Climate 31, 4241–4263.
- Mora-Cantallops et al. (2019) Mora-Cantallops, M., Sánchez-Alonso, S., García-Barriocanal, E., 2019. A systematic literature review on wikidata. Data Technologies and Applications .
- Orlandi et al. (2019) Orlandi, F., Meehan, A., Hossari, M., Dev, S., O’Sullivan, D., AlSkaif, T., 2019. Interlinking heterogeneous data for smart energy systems, in: 2019 International Conference on Smart Energy Systems and Technologies (SEST), IEEE. pp. 1–6.
- Pathan et al. (2021) Pathan, M.S., Wu, J., Lee, Y.H., Yan, J., Dev, S., 2021. Analyzing the impact of meteorological parameters on rainfall prediction, in: 2021 IEEE USNC-URSI Radio Science Meeting (Joint with AP-S Symposium), IEEE. pp. 100–101.
- Perera et al. (2018) Perera, A., Coccolo, S., Scartezzini, J.L., Mauree, D., 2018. Quantifying the impact of urban climate by extending the boundaries of urban energy system modeling. Applied Energy 222, 847–860.
- Poppick et al. (2020) Poppick, A., Nardi, J., Feldman, N., Baker, A.H., Pinard, A., Hammerling, D.M., 2020. A statistical analysis of lossily compressed climate model data. Comput. Geosci. 145, 104599.
- Seaborne (2011) Seaborne, A., 2011. Fuseki: serving rdf data over http.
- Stockhause et al. (2020) Stockhause, M., Greenslade, M., Hassell, D., Pascoe, C., 2020. Documentation of climate change data supporting cross-domain data reuse, in: EGU General Assembly Conference Abstracts, p. 4616.
- Tempelmeier and Demidova (2021) Tempelmeier, N., Demidova, E., 2021. Linking openstreetmap with knowledge graphs—link discovery for schema-agnostic volunteered geographic information. Future Generation Computer Systems 116, 349–364.
- (36) Valadi, S., Broneske, I.D., . Analysis of current usability and user experience questionnaires and creating an optimized usability questionnaire. bauhaus.cs.uni-magdeburg.de .
- Vermeulen et al. (2020) Vermeulen, A., Glaves, H., Pouliquen, S., Kokkinaki, A., 2020. Supporting cross-domain system-level environmental and earth science, in: Towards Interoperable Research Infrastructures for Environmental and Earth Sciences. Springer, pp. 3–16.
- Vilches-Blázquez et al. (2014) Vilches-Blázquez, L.M., Villazón-Terrazas, B., Corcho, O., Gómez-Pérez, A., 2014. Integrating geographical information in the linked digital earth. International Journal of Digital Earth 7, 554–575.
- Wick et al. (2015) Wick, M., Vatant, B., Christophe, B., 2015. Geonames ontology. URL http://www. geonames. org/ontology .
- Wu et al. (2021a) Wu, J., Chen, H., Orlandi, F., Lee, Y.H., O’Sullivan, D., Dev, S., 2021a. Automated climate analyses using knowledge graph, in: 2021 IEEE USNC-URSI Radio Science Meeting (Joint with AP-S Symposium), IEEE. pp. 106–107.
- Wu et al. (2021f) Wu, J., Chen, H., Orlandi, F., Lee, Y.H., O’Sullivan, D., Dev, S., 2021f. An interoperable open data portal for climate analysis, in: 2021 IEEE USNC-URSI Radio Science Meeting (Joint with AP-S Symposium), IEEE. pp. 104–105.
- Wu et al. (2021e) Wu, J., Orlandi, F., AlSkaif, T., O’Sullivan, D., Dev, S., 2021e. Ontology modeling for decentralized household energy systems, in: 2021 International Conference on Smart Energy Systems and Technologies (SEST), IEEE. pp. 1–6.
- Wu et al. (2022b) Wu, J., Orlandi, F., AlSkaif, T., O’Sullivan, D., Dev, S., 2022b. A semantic web approach to uplift decentralized household energy data. Sustainable Energy, Grids and Networks 32, 100891.
- Wu et al. (2021g) Wu, J., Orlandi, F., Gollini, I., Pisoni, E., Dev, S., 2021g. Uplifting air quality data using knowledge graph, in: 2021 Photonics & Electromagnetics Research Symposium (PIERS), IEEE. pp. 2347–2350.
- Wu et al. (2021b) Wu, J., Orlandi, F., Lee, Y.H., O’Sullivan, D., Dev, S., 2021b. Organizing decentralized energy data using semantic approach, in: 2021 Photonics & Electromagnetics Research Symposium (PIERS), IEEE. pp. 2213–2216.
- Wu et al. (2021c) Wu, J., Orlandi, F., O’Sullivan, D., Dev, S., 2021c. Detecting rainfall events leveraging climate knowledge graphs, in: 2021 Photonics & Electromagnetics Research Symposium (PIERS), IEEE. pp. 2336–2341.
- Wu et al. (2021d) Wu, J., Orlandi, F., O’Sullivan, D., Dev, S., 2021d. An ontology model for climatic data analysis, in: Proc. IEEE International Geoscience and Remote Sensing Symposium (IGARSS).
- Wu et al. (2022d) Wu, J., Orlandi, F., O’Sullivan, D., Dev, S., 2022d. Publishing climate data as linked data via virtual knowledge graphs, in: IEEE International Geoscience and Remote Sensing Symposium (IGARSS), IEEE.
- Wu et al. (2022e) Wu, J., Orlandi, F., O’Sullivan, D., Dev, S., 2022e. A workflow to convert live atmospheric sensor data into linked data, in: IEEE International Geoscience and Remote Sensing Symposium (IGARSS), IEEE.
- Wu et al. (2022) Wu, J., Orlandi, F., O’Sullivan, D., Pisoni, E., Dev, S., 2022. Boosting climate analysis with semantically uplifted knowledge graphs. IEEE Journal of Selected Topics in Applied Earth Observations and Remote Sensing 15, 4708–4718.
- Wu et al. (2022c) Wu, J., Orlandi, F., Pathan, M.S., O’Sullivan, D., Dev, S., 2022c. Augmenting weather sensor data with remote knowledge graphs, in: IEEE International Geoscience and Remote Sensing Symposium (IGARSS), IEEE.
- Yu et al. (2020) Yu, B., Chen, F., Xu, C., 2020. Landslide detection based on contour-based deep learning framework in case of national scale of nepal in 2015. Comput. Geosci. 135, 104388.
- Zeng et al. (2019) Zeng, Y., Su, Z., Barmpadimos, I., Perrels, A., Poli, P., Boersma, K.F., Frey, A., Ma, X., de Bruin, K., Goosen, H., John, V.O., Roebeling, R., Schulz, J., Timmermans, W., 2019. Towards a traceable climate service: Assessment of quality and usability of essential climate variables. Remote Sensing 11, 1186.
- Zouaq et al. (2017) Zouaq, A., Jovanovic, J., Joksimovic, S., Gasevic, D., 2017. Linked data for learning analytics: Potentials and challenges. Handbook of Learning Analytics , 347–355.