[style=Takeaway]takeawayTakeaway
A Deep Dive into VirusTotal:
Characterizing and Clustering a Massive File Feed
Abstract
Online scanners analyze user-submitted files with a large number of security tools and provide access to the analysis results. As the most popular online scanner, VirusTotal (VT) is often used for determining if samples are malicious, labeling samples with their family, hunting for new threats, and collecting malware samples. We analyze 328M VT reports for 235M samples collected for one year through the VT file feed. We use the reports to characterize the VT file feed in depth and compare it with the telemetry of a large security vendor. We answer questions such as How diverse is the feed? Does it allow building malware datasets for different filetypes? How fresh are the samples it provides? What is the distribution of malware families it sees? Does that distribution really represent malware on user devices?
We then explore how to perform threat hunting at scale by investigating scalable approaches that can produce high purity clusters on the 235M feed samples. We investigate three clustering approaches: hierarchical agglomerative clustering (HAC), a more scalable HAC variant for TLSH digests (HAC-T), and a simple feature value grouping (FVG). Our results show that HAC-T and FVG using selected features produce high precision clusters on ground truth datasets. However, only FVG scales to the daily influx of samples in the feed. Moreover, FVG takes 15 hours to cluster the whole dataset of 235M samples. Finally, we use the produced clusters for threat hunting, namely for detecting 190K samples thought to be benign (i.e., with zero detections) that may really be malicious because they belong to 29K clusters where most samples are detected as malicious.
1 Introduction
Online scanners analyze samples (i.e., files) submitted by users using a large number of security tools, and provide access to the analysis results through free and commercial APIs. The most popular online scanner is VirusTotal [50] (VT), which acts a de-facto central malware sharing service for the security community. According to its own last 7 days statistics VT receives over 2M daily file submissions [53] and has collected over 2.4 billion files since it started operating in 2004 [52]. Each file analysis by VT produces a report containing, among others, file metadata (e.g., hashes, size), certificate metadata for signed samples (e.g., thumbprint, subject), VT specific data (e.g., time of first submission to VT, submission filenames), and the list of detection labels assigned by up to 70 antivirus (AV) engines used to scan the file.
AV labels in VT reports are routinely used by security analysts for determining if a file is malicious by applying a threshold on the number of detections [57] and for identifying the family of a sample [42]. Similarly, malware developers often leverage VT during development to check if their samples are detected and, if so, revise them until they become fully undetected (FUD) [12, 14, 56]. VirusTotal is also commonly used as a source for collecting malware samples [14, 10, 32, 29, 3]. However, downloading specific samples from VT requires a privileged API key with a strict limit in the number of downloads and there exist other malware repositories with more lax download requirements [49, 30, 31].
Amongst its more recent commercial services, VT offers a file feed (hereafter, the VT file feed or simply the feed), a stream of analysis reports for all submissions [2]. The feed service also allows unlimited downloads of the samples submitted in the last seven days. Thus, the VT file feed could be used as a source of malware for building malware datasets such as those required by machine learning (ML) based malware detection (e.g., [4, 44, 15, 39, 17]) and family classification (e.g., [41, 15]), as well as for malware ecosystem studies (e.g., [10]). However, the VT file feed has never been characterized in depth so there remain key questions about it such as How diverse is it? Does it allow building malware datasets for different filetypes? How fresh are the samples it provides? What is the distribution of malware families it sees? Does that distribution really represent the distribution of malware on user devices?
To address these questions, we analyze one year of VT file feed reports, from December 21st, 2020 to December 20th, 2021. During the first 11 months we collect reports where the sample is detected by at least one AV engine, while in the last month we collect all feed reports, regardless of the number of detections. Our dataset comprises of 328M reports for 235M samples, of which 209M samples are new (i.e., previously unknown) to VT. To analyze how well the VT file feed represents the malware ecosystem, we intersect the feed data with telemetry data collected in a privacy-sensitive manner from tens of millions of devices of clients of a large security vendor.
VT is also a great dataset for hunting new threats, as demonstrated by previous works that detect malware developments [12, 14, 56] and perform malware triage [18]. However, the stream of VT submissions is massive, which raises questions about how to scale threat hunting to the feed contents without applying extremely aggressive filtering. This question equally applies to other massive file feeds such as those collected by security vendors [47]. To address this issue, this paper investigates scalable approaches for clustering the 235M feed samples. We posit that large-scale threat hunting requires highly scalable clustering approaches that produce high precision (i.e., high purity) clusters. High precision clusters contain a vast majority of related samples (i.e., samples belonging to the same family). They allow the analyst to examine only a few samples in the cluster and generalize the analysis results to the whole cluster. This property holds even if the clusters have low recall (i.e., a family is split among multiple clusters). On the other hand, low precision clusters are problematic for generalizing from a few to all samples in the cluster. We investigate three malware clustering approaches: hierarchical agglomerative clustering (HAC), a more scalable HAC variant for TLSH digests (HAC-T) that reduces the number of comparisons from quadratic to [34], and a simple feature value grouping (FVG) that groups samples on the value of one feature, e.g., all samples with the same import hash [1] form a cluster. Our results show that HAC-T and FVG using selected features produce high precision clusters (0.90–0.99) on ground truth datasets. However, only FVG scales to the daily influx of samples in the feed. Moreover, FVG takes 15 hours to cluster the whole dataset of 235M samples. We use the produced clusters for threat hunting, namely for detecting 190K samples thought to be benign (i.e., with zero detections) that may really be malicious because they belong to 29K clusters where most samples are detected as malicious.
The following are the most significant contributions:
-
•
We characterize the VT file feed using 328M analysis reports for 235M samples collected over one year, as well as the telemetry of a security vendor on the same time period. Among others, we show that despite having a volume 17 times lower than the telemetry, the feed observes 8 times more malware. The feed is fresh; it receives over one million new samples each day and samples appear a median of 4.4 hours after they are seen in user devices. Of the new samples, 62% are variants of known families that can be labeled on first sight, but 38% are unlabeled. 0.3% of new samples are originally FUD, i.e., they have no detections on first sight, but later multiple AV engines start flagging them. The feed is diverse containing a wealth of filetypes and 4.9K families with at least 100 samples. However, the diversity is largely due to Windows and Android families. On the negative side, the family distribution significantly differs from that observed in the telemetry indicating that VT may not be a good source to infer family impact on real users.
-
•
We explore clustering approaches that can scale to the hundreds of millions of samples in the VT file feed. We evaluate three clustering approaches: hierarchical agglomerative clustering (HAC), a more efficient HAC version for the TLSH digest (HAC-T), and a simple grouping by feature value (FVG). We first evaluate the accuracy using Windows and Android ground truth datasets. Then, we evaluate scalability showing that only FVG scales to the feed volume.
-
•
We apply FVG clustering to the problem of detecting fully undetected malware. Using FVG, we cluster 235M samples regardless if they are detectected by AV engines. We identify 29K FVG-vhash clusters with a majority of samples detected by multiple AV engines, containing 190K likely malicious samples with zero detections.
2 Data Collection
The VT file feed contains all analysis reports for samples submitted to VT. These include reports for new file samples (i.e., first submission to VT), resubmissions of previously submitted samples, and user-requested re-scans of previously submitted samples. Thus, multiple reports may appear in the feed for the same sample. Throughout the paper, we use new samples to denote samples that were first submitted to VT during our collection period (the first submission date of a sample is included in its reports). In general, we focus on the last report we collected for each sample because it should provide the most up-to-date information (e.g., updated AV labels). However, when we are interested in what happened to a sample when first submitted to VT (e.g., whether it was detected or labeled) we will focus on the first report of new samples.
| Data | All | peexe | apk | other |
| Reports | 328.3M | 220.3M | 15.9M | 92.0M |
| Samples | 235.7M | 155.5M | 8.2M | 72.0M |
| New Samples | 209.6M | 134.6M | 5.6M | 69.3M |
We collect reports from the feed every minute. Due to storage constraints we do not download the samples from the feed, only the reports. Currently, we store the complete VT reports on disk in compressed form. However, this may not be sustainable on the long run. An alternative would be to store only the parts of the VT report needed to generate our feature files, described in Section 3. To keep the storage manageable, in the first 11 months we were only collecting reports where at least one AV engine detected the file as malicious, which roughly corresponds to half of all reports in the feed. On November 19th, 2021, we scaled up our collection infrastructure and started collecting all reports in the feed regardless of the number of detections, i.e., including reports with zero detections. Overall, as summarized in Table 1, over one year between December 21st, 2020 and December 20th, 2021, we collected 328M reports for 235M samples (by unique file SHA256), of which 209.6M (89%) samples were new to VT, i.e., first seen by VT during our collection.
Telemetry.
In Section 4, we compare the VT file feed volume and collection delay to the telemetry of a large security vendor collected over the same one year period. The telemetry comes from tens of millions of real Windows devices in use by customers of the security vendor’s AV engine. The AV engine queries a central service with file hashes observed on the device to obtain file reputation information. The customers opted-in to sharing their data and the devices are anonymized to preserve customer privacy. The telemetry only contains file metadata, it does not contain the samples.
| Feature | Scope | Type | peexe | apk |
| authentihash | sample | cryptohash | ✓ | ✗ |
| cert_issuer | sample | string | ✓ | ✓ |
| cert_subject | sample | string | ✓ | ✓ |
| cert_thumbprint | sample | cryptohash | ✓ | ✓ |
| cert_valid_from | sample | timestamp | ✓ | ✓ |
| cert_valid_to | sample | timestamp | ✓ | ✓ |
| exiftool_filetype | sample | string | ✓ | ✓ |
| fseen_date | sample | timestamp | ✓ | ✓ |
| icon_hash | sample | cryptohash | ✓ | ✓ |
| imphash | sample | cryptohash | ✓ | ✗ |
| md5 | sample | cryptohash | ✓ | ✓ |
| package_name | sample | string | ✗ | ✓ |
| richpe_hash | sample | cryptohash | ✓ | ✗ |
| sha1 | sample | cryptohash | ✓ | ✓ |
| sha256 | sample | cryptohash | ✓ | ✓ |
| tlsh | sample | fuzzyhash | ✓ | ✓ |
| trid_filetype | sample | string | ✓ | ✓ |
| vhash | sample | structhash | ✓ | ✓ |
| detection_labels | scan | string list | ✓ | ✓ |
| scan_date | scan | timestamp | ✓ | ✓ |
| sig_verification_res | scan | string | ✓ | ✗ |
| vt_meaningful_name | scan | string | ✓ | ✓ |
| vt_score | scan | integer | ✓ | ✓ |
| avc2_family | derived | string | ✓ | ✓ |
| avc2_tags | derived | string list | ✓ | ✓ |
| avc2_is_pup | derived | bool | ✓ | ✓ |
| filetype | derived | string | ✓ | ✓ |
3 Features
Since we do not download the samples, we need to restrict our analysis to features available in the reports, or that can be derived from the reports. We focus on a selected set of 27 features: 23 from the VT reports and 4 derived from those (e.g., filetype and malware family). Features are summarized in Table 2. We define three scopes for a feature: sample, scan, and derived. Sample features should have the same value across all scans of a sample. On the other hand, scan features may differ across scans of the same sample, i.e., they evolve over time. For example, the hash of the certificate of a signed sample (cert_thumbprint) should always be the same. But, whether the signature of a signed sample validates (sig_verification_res) can change across scans, e.g., if the certificate expires or is revoked. Features may be extracted only for a subset of filetypes, e.g., be specific to Windows PE executables or Android APKs, and may be null for some samples (e.g., certificate features are not available for unsigned Windows executables). We detail the VT report features in Section 3.1 and the derived features in Section 3.2.
3.1 VT Report Features
Hashes.
Our features include three types of hashes: cryptographic, fuzzy, and structural. Cryptographic hashes include three hashes applied over the whole file (sha256, sha1, md5) and five hashes calculated over parts of a file: imphash covers the import table of a PE executable [1]; richpe_hash covers the optional Rich Header that contains information about the compilation chain of PE executables [54]; cert_thumbprint covers the leaf certificate for signed samples; authentihash covers a PE executable excluding Authenticode code signing fields; and icon_hash covers the icon image optionally embedded in Windows and Android files. All cryptographic hashes are compared using equality, i.e., two files have the same hash or not.
VT reports contain two fuzzy hashes calculated over the whole file: tlsh and ssdeep. We favor tlsh because prior work has shown that tlsh generally outperforms ssdeep [36] and because a scalable clustering for TLSH digests has been recently proposed [34]. tlsh uses Hamming distance on the hash value to determine if two inputs are similar.
Our features also include the VirusTotal hash (vhash), VT’s proprietary structural hash. According to VT’s minimal documentation on it [51], it takes into account sample properties such as imports, exports, sections, and file size. From our evaluation, vhash appears to be a common name for a set of structural hashes for different filetypes. VT computes vhash for many filetypes (e.g., PE executables, APKs, PDFs, Office documents), but not for all (e.g., JPEG and PNG images have no vhash). VT provides daily clusters of files using vhash. We have checked that samples in the same cluster have the same vhash value, so we use equality to compare two vhash values. While proprietary and largely undocumented, our experimental evaluation in Section 5 shows that vhash is a good feature for clustering.
Timestamps.
We obtain four timestamps from a VT report. The scan_date when the sample is analyzed, which is always within our collection period. The VT first seen date (fseen_date) when the sample was first submitted to VT. For signed samples, we also obtain the certificate’s validity period defined by the cert_valid_from and cert_valid_to dates.
AV scans.
VT scans each submitted sample with a large number of AV engines. We extract the number of engines that detected the sample (i.e., gave it a non-NULL label) (vt_score) and the list of detection_labels. The labels are used to derive three classification features, as detailed in Section 3.2.
Program names.
We use two features that capture the program a sample corresponds to. The package_name is the package identifier for Android apps and vt_meaningful_name is the most meaningful filename VT selects for a sample (e.g., among all filenames of the sample when submitted to VT).
3.2 Derived Features
Filetype.
Determining the filetype of the sample in a report is not straightforward because VT reports do not have a single field for it. Instead, there are multiple fields that provide, possibly contradictory, filetype information. We derive a unique filetype feature for each report by performing a majority voting on three fields: trid_file_type, vt_tags, and vt_meaningful_name. trid_file_type captures the filetype identified by the TrID tool [38], which has very fine-grained granularity (e.g., over 90 peexe subtypes). We build a mapping from TrID filetypes to coarser-grained filetypes such as grouping all Windows PE files (e.g., EXE, DLL, OCX, CPL) under peexe and all Word files (DOC, DOCX) under doc. vt_tags provides a list of tags assigned by VT to enable searching for samples across different dimensions. Some of the tags such as apk, peexe, and elf provide filetype information. When vt_meaningful_name is available, we extract the extension from the filename and map the extension to a filetype.
AVClass features.
We feed the detection_labels to the AvClass2 malware labeling tool [43]. AvClass2 outputs a list of tags (avc2_tags) for the sample that include its category, behaviors, file properties, and the most likely family (avc2_family). It also provides whether the sample is considered potentially unwanted or malware (avc2_is_pup). AvClass2 uses a taxonomy to identify non-family tokens that may appear in the AV labels such as malware classes (e.g., CLASS:virus), behaviors (e.g., BEH:ddos), file properties (e.g., FILE:packed:asprotect), and generic tokens (e.g., GEN:malicious). It also uses tagging rules to identify aliases between families (e.g., zeus being an alias to zbot). In this work we apply AvClass2 to 328M VT reports, eight times more than the largest to date work [43]. Thus, our AvClass2 results include a wealth of new tags, including new aliases and non-family tokens. We have used the AvClass2 update module and extensive manual validation to identify new tagging rules that capture previously unknown aliases, as well as new taxonomy entries for tokens appearing in over 100 samples. This process has resulted in doubling the AvClass2 taxonomy from 1,354 entries in the AvClass2 repository to 2,828 entries in our version and a 58% increase in tagging rules from 1,579 to 2,496 entries.
4 Feed Analysis
This section characterizes the VT file feed, answering the following questions: (1) How large is the VT file feed in comparison to the AV telemetry? (2) How fresh are samples in the feed? (3) How diverse is the feed in terms of filetypes? (4) What fraction of samples can be detected as malicious on first scan? (5) How diverse is the feed in terms of families? (6) What fraction of malicious samples are fully undetected on first scan? (7) What fraction of samples are signed? (8) What is the overlap in malicious samples between the feed and the AV telemetry? And which one sees samples faster?
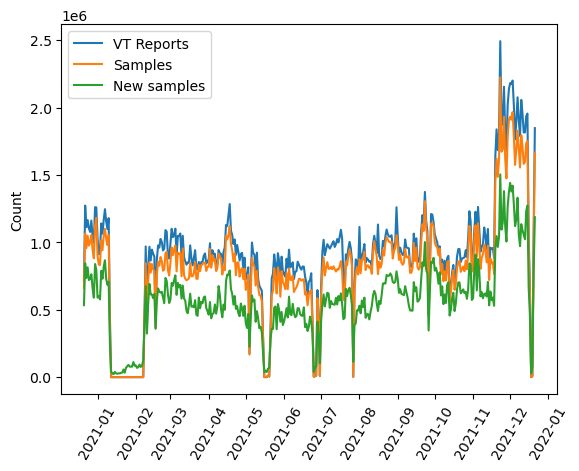
Volume.
Figure 1 shows for each day in the collection period, the number of reports in the feed, the number of unique samples in the daily reports, and the number of samples first seen by VT on that day. The figure shows a few gaps when the collection infrastructure was not working, the longest taking place between January 11th and February 7th. The volume of reports and hashes significantly increases once we started collecting samples with no detections. We compute the daily statistics, excluding days in the collection gaps, split into two periods: before November 19th, 2021 when we were collecting only reports with at least one detection, and after that date when we were collecting all reports. Table 3 shows the daily stats when collecting all reports: the average number of daily reports is nearly 1.7M, the average number of samples nearly 1.5M, and the average number of new samples 1.0M. When only collecting reports with at least one detection the averages were 811K reports, 732K samples, and 515K new samples. Thus, approximately half of the reports (48%), samples (49%), and new samples (50%) in the feed are benign.
| Mean | Median | Stdev | Max | |
| Reports | 1,681,470 | 1,879,952 | 632,366 | 2,492,454 |
| Samples | 1,493,410 | 1,680,520 | 558,895 | 2,223,638 |
| New samples | 1,028,370 | 1,120,242 | 382,196 | 1,504,174 |
We compare the feed volume when collecting all reports with the telemetry data over the same period. Over that month, the VT file feed contains reports for 39.8M samples, while the telemetry contains queries for 686.5M samples. Both numbers include all samples observed in the time period, regardless if the samples are old or new and whether they are benign or malicious. Thus, the telemetry volume is 17 times larger than the VT file feed volume. This is a lower bound with respect to the whole file volume available to the security vendor, as in addition to the Windows endpoint telemetry, the security vendor has also other datasets. On the other hand, the telemetry captures that over that month, the AV engine threw alerts for 1.9M malicious files in 905K devices. In comparison, the VT file feed contains 14.8M samples with at least four detections on the same time period, nearly eight times more detected malware. This discrepancy is likely due to two reasons. First, prior work has shown that telemetry data is largely dominated by rare benign files, i.e., 94% of files in AV telemetry are observed only in one device and the ratio of benign to malicious such files is 80:1 [26]. Second, if we assume that the telemetry represents the file distribution in the contributing devices, then the VT file feed is clearly biased towards malicious samples. This makes sense as VT is widely considered a threat sharing platform. Thus, contributors may share only suspicious samples, more likely to be malicious. Furthermore, contributors may purposefully avoid known benign samples since they are more likely to contain private data.
At the end of 2021, the VT file feed had daily averages of 1.7M reports, 1.5M samples, and 1.0M new samples. While massive, the feed volume is 17 times lower than the telemetry of a security vendor. However, despite the much lower volume, the VT file feed contains eight times more malware than the telemetry, making it a great source of malicious samples.
New samples.
Table 1 shows that 89% of the observed samples are new, i.e., are first observed by VT after we started collecting. By filetype, 61% peexe samples are new, compared to 35% for apk samples, and 81% for other samples. This indicates lower polymorphism for APKs (e.g., less versions for benign programs and/or less obfuscation for malware) making it easier for multiple users to submit the same sample to VT.
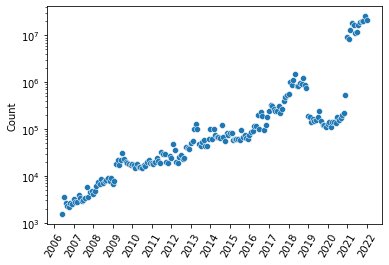
The VT first seen date provides a lower bound for a sample’s lifetime, i.e., the sample could be older if it took some time for it to be submitted to VT. The oldest sample observed in our collection period was first seen by VT on May 22nd, 2006. Figure 2 shows the number of samples (in logarithmic scale) whose VT first seen date is on each month, capturing how old are the samples already known to VT. The shape of the figure captures the volume increase in samples submitted to VT over time until 2019, followed by a decrease in 2019-2021. The reduction could be due to some vendors reducing their sharing from 2019.
Of the collected samples 89% are new, i.e., previously unknown to VT, and the feed provides over a million new samples each day. Thus, the VT file feed is a great source of fresh samples.
| Filetype | Samples | Perc |
| peexe | 155,526,594 | 65.97% |
| javascript | 21,048,404 | 8.93% |
| html | 12,540,571 | 5.32% |
| 11,346,815 | 4.81% | |
| apk | 7,992,206 | 3.40% |
| text | 5,149,050 | 2.18% |
| NULL | 4,128,183 | 1.75% |
| zip | 3,934,987 | 1.67% |
| dex | 3,015,650 | 1.28% |
| gzip | 2,926,739 | 1.24% |
| lnk | 2,718,635 | 1.15% |
| elf | 942,148 | 0.40% |
| rar | 516,514 | 0.22% |
| jar | 448,324 | 0.19% |
| doc | 429,794 | 0.18% |
| xls | 428,057 | 0.18% |
| macho | 409,399 | 0.17% |
| php | 352,143 | 0.15% |
| xml | 335,962 | 0.14% |
| powershell | 321,178 | 0.14% |
| Other | 1,233,754 | 0.52 % |
| ALL | 235,745,107 | 100.0% |
Filetypes.
Table 4 shows the top 20 filetypes for all samples observed. The feed is dominated by Windows PE files (EXE, DLL, OCX, CPL, …) that correspond to 66% of the samples. Far behind are other filetypes like JavaScript (8.9%), HTML (5.3%), PDF (4.8%), and Android applications (3.4%). These top 5 filetypes cover 88.4% of all samples. We could not obtain a filetype for 1.7% of samples as they had no TrID information, no VT filetype-related tags, were not signed, and had no most meaningful filename with extension. This highlights the lack of a unified filetype field and the limitation of the tools VT uses for filetype determination.
Ugarte-Pedrero et al. [47] reported that 51% of an AV feed were PE executables. The larger VT file feed ratio may be due to users contributing more frequently PE executables to VT, avoiding other filetypes like HTML or text files that may contain more private data.
Two thirds of feed samples are Windows PE files, but the feed is a good source of samples for a large variety of filetypes. The feed lacks a unified filetype field and filetype identification is challenging for a significant number of samples.
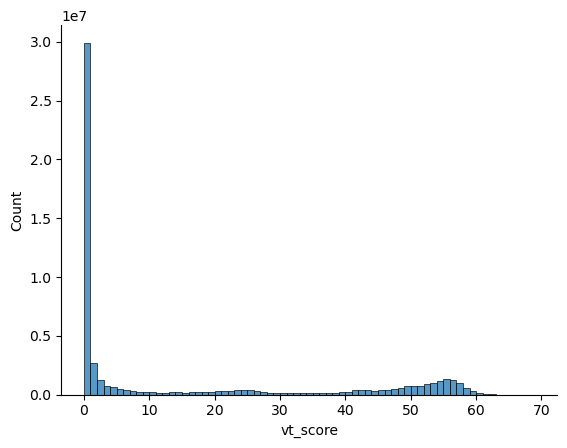
AV detections.
A common approach for detecting malicious samples is to apply a threshold on the number of detections in a VT report [57]. We use this approach to quantify the percentage of malicious samples in the feed. We focus on the last month when collecting all feed reports. Figure 3 shows the distribution of the number of AV detections for all reports collected starting 2021/11/19. The figure shows that 85% of the reports in the last month have no detections and 7% have one detection. But, there are 9.6M samples with at least 40 detections.
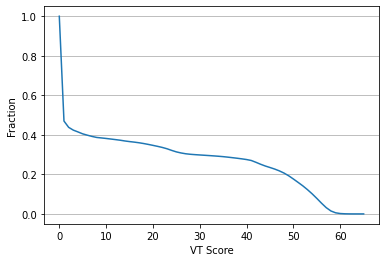
We also examine the number of detections the first time a sample is submitted to VT. Figure 4 shows the complementary CDF of VT scores for the first report of each new sample since 2021/11/19. The figure captures the fraction of malicious samples in the feed depending on the selected detection threshold. 53% of the samples have zero detections on their first observation. This percentage includes truly benign programs as well as malicious samples that go fully undetected. If we set the detection threshold on at least one detection, 47% of the samples would be considered malicious. If the threshold is set higher to minimize false positives, that reduces the fraction of malicious samples, e.g., 41% if we set it to at least four detections as done in several related works [22, 20, 21].
The VT file feed is a file feed rather than a malware feed. Half of its volume is for undetected samples and 53% of the samples have no detections on first observation. On the other hand, 41%–47% of samples can be detected as malware by the AV engines on first sight because they share traits with previously seen malware (i.e., match existing signatures).
Labeling.
We obtain a sample’s family by feeding to AvClass2 the last report of each sample in our dataset, which should have the most up-to-date labels. AvClass2 labels 151.7M (64.3%) of the samples with 74,360 distinct family names. However, many families output by AvClass2 are rare. In particular, 41.4K (56%) of all families have only one sample, 14K (19%) have at least 10 samples, 4.9K (7%) have at least 100 samples, and only 1.5K (2%) have at least 1,000 samples. Despite more than half of the families having only one sample, the fact that there are 4.9K families with more than 100 samples shows that the feed is diverse and is not dominated by a few highly polymorphic families (e.g., file infectors). However, the diversity is largely due to Windows families. By filetype, the number of families with more than 100 samples is led by peexe with 3.8K families, followed far behind by apk (447), html (129), javascript (116), doc (53), macho (52), xls (47), elf (37), and pdf (15). Thus, by monitoring the feed it is possible to build datasets with a large number of families for Windows and Android malware. But, for other filetypes like macho and elf, even after collecting for a year, we could only obtain 52 and 37 families with at least 100 samples, respectively.
AvClass2 outputs as family the top-ranked tag that is either a family in the taxonomy or unknown (i.e., not in the taxonomy). Of the 74,360 families output by AvClass2, 2,391 (3.2%) are in the updated taxonomy, which contains a total of 2,451 families (i.e., 97.5% of taxonomy families appear in one year of feed reports). However, the families in the updated taxonomy contribute 90.6% of the labeled samples, only 9.4% of the samples are labeled with unknown families. This indicates that the most popular families are in the updated taxonomy, which is expected as it is common for analysts like us to add the most popular previously unknown families to the taxonomy. In fact, of the families with at least 1M samples, only 3% are unknown, increasing to 15% for families with 100K samples, 43% for those with 1K samples, and 85% for those with 10 samples. Unknown families can be due to two main reasons. One are tags that it is unclear if they are a family name or another category such as a behavior or a file property (e.g., lnkrun, refresh). The other are tags that correspond to random-looking signature identifiers or family variants (e.g., aapw, dqan). We manually examine the top 1K families and identify that 89% of the unknown families correspond to the first case and 11% to the latter. We repeat this check on 200 randomly sampled unknown families with only one sample and the result is the opposite: 11% corresponding to the first case and 89% to the latter. Thus, for less prevalent families AvClass2 may output a name that corresponds to a signature identifier or variant. While those random-looking names are not very descriptive for analysts, they are still valid cluster identifiers, i.e., samples with the same name should belong to the same family. Based on the above, we estimate that over the whole year a total of 33.8K (41.4K * 0.11 + 32.9K * 0.89) families of all filetypes have been observed in the feed.
We also obtain the family using the first report for new samples. AvClass2 is able to label on first sight 62.3% of new samples, slightly less than the 64.3% using the last collected report. It is worth noting that the percentage of malicious samples labeled tends to increase over time as illustrated in Section 5 where AvClass2 labels 97.8% of the samples in the Malicia dataset from 2012 [33] and 98.9% of the samples in the AMD dataset from 2016 [55]. The fact that 62% of new samples can be attributed on first sight to a family indicates they they correspond to variants of known families with accurate signatures. This result shows that AvClass2 can be used as a filter to remove 62% of samples from well-detected families so that analysts can focus on the 38% unlabeled samples.
Prior work has applied AvClass2 to peexe, apk, and elf files (e.g., [43, 10]). However, AvClass2 can be applied on AV labels regardless of platform or filetype. Table 14 shows the top 10 families for the six executable and macro filetypes. The largest families overall are for Windows led by berbew with 19.4M samples, followed by dinwod (9.4M), and virlock (7.9M). We use AvClass2 to output a relations file on the whole feed. We identify a family’s class checking the strongest CLASS relation for each family with a strength of at least 0.2. The top 10 peexe families are dominated by 4 worm and 3 virus families due to their high polymorphism. However, as already discussed, overall the feed is not dominated by file infectors and worms. For Android, the top 10 families are all PUP and 8 of them are adware. The top Linux families are dominated by backdoors including mirai derivatives (gafgyt, hajime, mozi). For macOS, seven top families are PUP and five of those adware. Finally, Word and Excel macros are dominated by downloaders. Table 13 shows the top families for three other popular filetypes (JavaScript, HTML, PDF) for which we observe that top families output by AvClass2 contain many unknown tokens that may correspond instead to other categories (e.g., redir may indicate injections that redirect the user). We also observe overlaps between JavaScript and HTML families (e.g., cryxos, facelike) and that for 9/30 families AvClass2 cannot identify a class. We conclude that for these three filetypes the concept of a family is not as well defined and that AV labels for these filetypes focus instead on concepts such as phishing, injections, and exploitation.
The feed is diverse with 4.9K families with at least 100 samples. However, the diversity is largely due to peexe and apk families. For those two filetypes, the feed is a good source to build datasets for large-scale family classification. AvClass2 labels 62% of samples on first sight. Thus, it can be used as a filter to remove samples from well-detected families so that analysts can focus on the 38% unlabeled samples.
Originally FUD malware.
It is possible that a malicious sample is fully undetected when first submitted to VT, but a later report classifies it as malicious. We detect such originally FUD samples here and address the detection of FUD malware with zero detections to date in Section 6. To detect originally FUD samples, we measure the number of samples that satisfy three conditions: (1) they are new samples first observed by VT during our collection period; (2) their last report has at least 4 detections; and (3) their first report had zero detections or their VT first seen date is not in a data collection gap and is before their first observation. The last condition is a disjunction to address that we only collected reports with zero detections in the last month. During the first 11 months we can know if a sample had zero detections in their first scan because their VT first seen date is in our collection period and happens before the earliest scan date collected for the sample. The exception are samples first seen during a collection gap, for which a delayed scan date does not necessarily imply zero detections on the first scan.
We identify 637K samples satisfying those conditions. However, the time difference between the first seen date and the first report with at least four detections, indicates that 37K samples change from zero to at least four detections within 5 minutes of their first VT observation. We exclude those 37K samples as we observe that the distribution stabilizes afterwards (i.e., after 15 minutes only an extra 1K samples flip classification).
Thus, we identify 600K originally FUD samples (0.3% of all new samples) that had no detections on their first scan, but were later considered malicious by at least 4 AV engines. Increasing the detection threshold would decrease the percentage, but the detection rate of a malicious sample tends to increase over time and for 82% of samples we only have one report. Thus, we believe our FUD rate estimation is conservative. The median time to flip classification is 7 days, (mean of 23.8 days) with 12% of the samples flipping classification in less than one day.
Of the 600K originally FUD samples, 60% are peexe, followed by 11% pdf, and 8% javascript. PDFs are more than twice as likely to be FUD than expected since they comprise only 4.8% of all feed samples. Malicious PDFs typically contain exploits and are used in spearphishing attacks. These numbers point to malicious PDFs being harder to detect.
| FUD | ||||
| Family | Class | Filetype | Samp. | Ratio |
| FAM:pcacceleratepro | pup | peexe | 1,749 | 9.5% |
| FAM:sagent | down. | macro | 2,141 | 9.3% |
| FAM:dstudio | down. | peexe | 1,255 | 6.2% |
| FAM:pasnaino | down. | peexe | 613 | 5.9% |
| FAM:opensupdater | pup | peexe | 2,051 | 4.8% |
| FAM:mobtes | down. | apk | 967 | 4.6% |
| FAM:hesv | pup | peexe | 849 | 4.4% |
| FAM:asacub | infosteal | apk | 833 | 4.1% |
| UNK:agentino | down. | peexe | 649 | 4.0% |
| FAM:fakecop | pup | apk | 672 | 3.6% |
Using their last report, AvClass2 outputs a family for 62.5% of the 600K originally FUD samples, which is in line with the overall labeling rate, indicating a similar fraction of well-known families among originally FUD samples. However, some families have larger fractions of originally FUD samples, and thus are harder to detect. Table 5 shows the top 10 families with at least 10K samples sorted by the ratio of originally FUD samples over all family samples. These include 6 families for Windows, 3 for Android, and one family of Microsoft Office macros. All of them have FUD ratios 6–16 times higher than the 0.59% average over all families with at least 10K samples.
At least 0.3% of samples submitted to VT are originally FUD, i.e., they have zero detections on the first VT observation, but later are considered malicious by at least 4 engines. PDF documents are more likely to be FUD than other filetypes.
Code signing.
VT extracts code signatures from multiple filetypes. The collected reports contain 13.3M samples (5.6% of all samples) for which VT extracted code signing certificates. Of the signed samples, 55.9% are Android APKs, 43.4% are Windows PE files, and 0.7% are other filetypes such as Microsoft Installers (.msi) and patches (.msp), Mach-O executables, iOS applications, Apple image files (.dmg), and some archive formats (e.g., .zip, .cab). PDF is one popular filetype for which VT does not currently extract signatures. 91.3% of all apk samples, 3.7% peexe , 31.4% msi, and 7.6% macho are signed. APKs have to be signed in order for the Android OS to install them in a device. The 8.5% of unsigned APKs is due to apps under development being uploaded to VT, possibly to check if any AV engine detects them or as part of continuous delivery pipelines.
VT supports the extraction of code signatures for a variety of filetypes, but only a small fraction (5.6%) of all feed samples, and 3.7% of the peexe samples, have a code signing signature.
Telemetry intersection.
We intersect the hashes of feed samples with the telemetry. However, to make the telemetry query scale we had to exclude known benign samples using a curated whitelist from the security vendor. The intersection contains 3.8M samples with at least one detection (1.8% of feed samples with one detection) and 2.2M (1.2%) with at least four detections. The small intersection indicates that the telemetry and the VT file feed observe largely disjoint sets of malicious samples. Prior work has observed that public and commercial threat intelligence feeds have small overlap [48, 7]. However, those works did not evaluate VirusTotal or the telemetry of a large security vendor, which are arguably the largest datasets for indicators such as file hashes. Our results show that even the largest datasets are largely disjoint with minimal overlap. This is likely caused by a huge space of malicious samples of which each vendor only sees a small portion.
| Family | Class | Devices | Samples |
| FAM:winactivator | pup | 2.0M | 10,871 |
| FAM:tool:utorrent | pup | 1.6M | 1,366 |
| FAM:installcore | pup | 1.5M | 46,758 |
| FAM:webcompanion | pup | 1.4M | 2,569 |
| FAM:dotsetupio | pup | 1.1M | 198 |
| FAM:iobit | pup | 898K | 4,321 |
| FAM:opensupdater | pup | 692K | 14,918 |
| FAM:opencandy | pup | 579K | 9,346 |
| UNK:offercore | pup | 555K | 363 |
| FAM:driverreviver | pup | 545K | 615 |
Table 6 shows the top 10 families for feed samples in the telemetry. We observe the stark difference with the top families in the feed (peexe families in Table 14) with no families in common. All top ten families in the telemetry are PUP while the feed’s top families are dominated by virus and worm families. From the top 10 feed families, vobfus and virlock are the two families ranked highest in the telemetry found on 25.9K and 3.3K devices respectively. The remaining 8 families are ranked below the 1,000th position affecting each less than 2K devices. The fact that the distribution of malicious families in the VT file feed widely differs from that observed on real devices is important for works that may try to analyze the malware ecosystem using VT. While VT is a great source of malicious samples, its file distribution is biased towards families contributed more often (e.g., those with high polymorphism), and thus it does not capture impact on real devices.
During our collection period, there are 11.9M samples detected as malicious by the security vendor, but not observed in the VT file feed. These files are either never submitted to VT or their last VT report was before our collection start. Quantifying this requires querying the 11.9M files to VT which due to API restrictions is not possible. Instead, we estimate these figures by querying a subset of 1M randomly selected hashes. Only 10.9% of those are known to VT, while 89.1% have never been submitted. This shows that security vendors may only share a fraction of their malicious samples with VT. Sharing decisions are taken by other security vendor departments and are transparent to us.
From the telemetry, we also obtain the telemetry first seen timestamp, which is the earliest time, within our collection period, a feed sample was queried by an endpoint to obtain its reputation. This is an upper bound on the earliest time the security vendor observed the sample. For example, a sample first seen by the security vendor in 2010 may appear in the telemetry subset we analyze as first queried on December 22nd, 2020. We calculate the delay to observe a sample as the VT first seen timestamp minus the telemetry first seen timestamp, but only for the 2.1M new samples (from VT perspective) with at least one detection and in the intersection with the telemetry. Of those 2.1M samples, 2.5M (61%) are first observed by the telemetry (i.e., positive difference) while 816K (39%) are first observed by VT (i.e., negative difference). The median delay for VT to observe the sample is 4.4 hours. Thus, real devices observe the sample a few hours earlier than VT. However, the mean delay is 21 days because 12% of new samples are first submitted to VT at least 3 months after they appear in the telemetry, compared to 3% being observed by VT 3 months earlier than in the telemetry. It is important to note that since the telemetry first seen is an upper bound for the security vendor first seen, the VT delay may be actually larger.
The telemetry and VT file feed observe largely disjoint sets of malicious samples (1.2%–1.8% of feed samples in common). Thus, even the largest security vendors only see a small portion of the whole space of malicious samples. The family distribution in the VT file feed significantly differs from that observed in the telemetry indicating that VT may not be a good source to infer family impact on real users. New samples in both datasets are seen a median of 4.4 hours earlier by the devices. Thus, new malicious samples in the feed are quite recent. Furthermore, 39% of new samples are observed by VT before they are seen in user devices, so VT may provide useful early alerts to security vendors.
5 Clustering
The goal of the clustering is to group samples that belong to the same family. We require highly scalable clustering approaches, as we need to cluster 235.7M samples, more than five times the 42M samples clustered in the largest-to-date work [43]. Another property we desire is that the clustering produces high precision clusters, despite a potentially low recall. High precision means the clusters have high purity, i.e., the vast majority of samples in the cluster belong to the same family. Low recall means that a family may be split into a potentially large number of clusters. The reason to favor high precision is that it enables the analyst to gain an understanding of the cluster by analyzing one (or a small number) of samples in the cluster, thus reducing the number of threats that need analysis. Similarly, given a sample of interest, its cluster can be used to infer properties of the sample. For example, inferring that an undetected sample is malicious because it belongs to a cluster where most samples are detected. Such generalization is problematic when the precision is low.
| Values | |||||
| Feature | Samples | All | peexe | apk | other |
| tlsh | 235.6M | 204.3M | 134.0M | 7.6M | 62.7M |
| vhash | 220.1M | 17.4M | 6.4M | 1.3M | 9.7M |
| authentihash | 155.3M | 152.9M | 152.9M | 0 | 0 |
| avc2_family | 151.7M | 74.4K | 62.4K | 2.8K | 22.4K |
| imphash | 149.7M | 8.3M | 8.3M | 0 | 0 |
| richpe_hash | 65.2M | 2.1M | 2.1M | 0 | 0 |
| icon_hash | 60.5M | 15.6M | 1.9M | 2.2M | 11.5M |
| cert_thumb. | 13.3M | 1.7M | 168.7K | 1.5M | 10.6K |
| pkg_name | 7.4M | 2.8M | 0 | 2.8M | 0 |
Clustering features.
To compute sample similarity, we are limited to the features we extract from the VT reports. From the 27 features in Table 2 we examine 9 features that can identify similar samples. Table 7 shows for each feature the number of samples that have a non-NULL feature value, the number of distinct feature values, and the split of feature values for peexe, apk, and other filetypes. Two features are available in most samples regardless of filetype: tlsh is extracted for every sample save a handful of errors (99.9%) and vhash for most filetypes with some exceptions such as images (93.4%). Other features available for multiple filetypes are the AvClass2 family (63.5%), the icon’s MD5 (25.7%), and the certificate thumbprint (5.6%). Three features are specific to peexe samples: authentihash and imphash are both available for 96% of peexe samples, while 42% of peexe samples have the optional Rich PE header. The package name is specific to apk samples, being available in 90% of those.
Clustering approaches.
We evaluate three clustering approaches that do not need to define the number of clusters a priori. The first approach is what we call feature value grouping (FVG), a simple grouping of samples using equality on the values of a single feature, e.g., all samples with the same vhash value form a cluster. Samples that lack the used feature (e.g., those with a NULL vhash) are placed in a singleton cluster by themselves. To cluster using FVG the feature vectors are sorted by the triple (feature_value, sample_hash, scan_date). A change in feature value indicates a new cluster. FVG is an extremely scalable approach. We evaluate FVG with different features to understand which ones provide high precision, and what recall those features achieve.
The second approach is hierarchical agglomerative clustering (HAC) with single linkage. Our distance function is a weighted average of the feature distances where the feature distance is boolean for cryptographic hashes and vhash, and Hamming distance for tlsh. To avoid biasing the clustering towards specific features, we apply equal weight to all features. When a sample misses one feature (e.g., has no vhash), we exclude the feature from the weighted average. We also evaluate different values for the distance threshold parameter, which defines the cluster diameter. The main limitation of hierarchical clustering is that it requires computing a quadratic number of comparisons.
The third approach is the recent threshold-based hierarchical agglomerative clustering (HAC-T) [34], an scalable approach to cluster samples using their TLSH hash value. It uses vantage trees to achieve comparisons in contrast to the typical in hierarchical clustering. It has been shown to produce high purity clusters, has been applied to cluster 10M samples, and a Python version has been open sourced [46]. We also evaluate a variant called HAC-T-opt that provides optimal clusters at some performance cost [35]. Both HAC-T and HAC-T-opt use a cluster distance () parameter, which we set to the recommended value of 30 [35].
| Dataset | Plat. | Samples | Fam. | Collection |
| AMD [55] | And | 24,551 | 71 | 11/2010 - 03/2016 |
| Malicia [33] | Win | 9,908 | 52 | 03/2012 - 02/2013 |
| Feature | Algor. | Clust. | Prec. | Recall | F1 |
| authentihash | fvg | 9,909 | 100% | 0.5% | 1.1% |
| avc2_family | fvg | 284 | 97.0% | 75.4% | 84.8% |
| cert_thumb. | fvg | 9,410 | 100% | 1.8% | 3.5% |
| icon_hash | fvg | 9,766 | 99.9% | 1.0% | 1.9% |
| imphash | fvg | 1,843 | 99.7% | 5.7% | 10.7% |
| richpe_hash | fvg | 9,899 | 100% | 0.6% | 1.2% |
| vhash | fvg | 900 | 98.8% | 12.8% | 22.7% |
| tlsh | hact-opt | 3,772 | 99.9% | 6.2% | 11.8% |
| tlsh | hact | 3,899 | 99.9% | 3.8% | 7.3% |
| Feature | Algor. | Clust. | Prec. | Recall | F1 |
| avc2_family | fvg | 407 | 95.4% | 89.0% | 92.1% |
| cert_thumb. | fvg | 8,566 | 90.1% | 15.9% | 27.0% |
| icon_hash | fvg | 17,812 | 98.7% | 9.7% | 17.6% |
| pkg_name | fvg | 17,430 | 99.6% | 9.2% | 16.8% |
| vhash | fvg | 7,478 | 94.5% | 20.6% | 33.8% |
| tlsh | hact-opt | 17,515 | 98.3% | 7.6% | 14.1% |
| tlsh | hact | 17,884 | 98.4% | 6.9% | 12.9% |
Accuracy evaluation.
We measure clustering accuracy using two ground truth datasets summarized in Table 8. The Malicia dataset contains nearly 10K Windows malware collected from drive-by downloads [33]. The AMD dataset contains 24K Android samples [55]. Those are the two largest family-labeled public datasets we could find. For Malicia, we requested VT a re-scan of all samples because most samples did not have a TLSH hash value, as they had been scanned before VT introduced TLSH. For AMD, a re-scan was not needed, but we still collected the latest reports.
Tables 9 and 10 summarize the clustering accuracy on the two datasets. For FVG, on AMD we exclude PE-specific features (authentihash, imphash, richpe_hash) and on Malicia APK-specific features (pkg_name). For HAC we test different combinations of features and distance thresholds achieving a best result of 24.0% F1 score using a distance threshold of 0.8 when not including the avc2_family feature and up to 83.8% F1 score when including that feature. Samples with a NULL feature value are placed in a singleton cluster, thus increasing the number of clusters and lowering the recall. Thus, features only available for a small fraction of samples such as richpe_hash (1.0%) and icon hash (6.1%) tend to have very low recall and F1 score. Other features like authentihash are widely available (98.1%), but rarely identify similar samples. In particular, authentihash only groups samples that are the same malware variant, but signed with different certificate chains. Overall, all features achieve very high precision ranging 97.0%–100% except cert_thumbprint on AMD with 90.1%. However, recall widely differs among features. Results are consistently better on AMD and the best feature is avc2_family, which achieves 84.8% F1 score on Malicia and 92.1% on AMD, followed by vhash (22.7%–33.8%), cert_thumbprint (27.0%), and TLSH using HAC-T-opt (11.8%–14.1%). It is important to note that the AvClass2 family is the only feature that may improve over time since AV labels may be refined as AVs improve their detection signatures. Since the Malicia dataset is from 2013 and AMD from 2016 the results may overestimate the accuracy of AvClass2 on newer samples. Still, Section 4 showed that 62.3% of samples can be labeled on first sight.
Scalability.
While all three clustering approaches successfully run on the GT datasets, those datasets are pretty small. To evaluate scalability, we run the clustering approaches on different days of the feed with increasingly larger number of samples. We set an upper limit of 24 hours for the clustering to complete, so that the clustering can handle the daily influx of feed samples. We run the clustering on a server with an Intel(R) Xeon(R) CPU E5-2660 v3 @ 2.60GHz with 40 cores and 128GB RAM. The lowest number of daily samples corresponds to the first day with 620K samples. On this day, the hierarchical clustering does not complete in the allocated 24h showing that the quadratic number of comparisons it requires does not scale to the daily number of feed samples. On this first day, HAC-T takes 9.7 hours and FVG-vhash takes less than one hour (49.6 minutes for sorting and 2.6 minutes for grouping). Next, we run the clustering on an average day with 1.4M samples where HAC-T takes 22.4 hours and FVG-vhash again less than one hour. When run on the day with the highest number of samples (2.2M) HAC-T does not terminate in the allocated 24 hours, however FVG-vhash still takes less than one hour. The original HAC-T paper mentions that they are able to cluster 10M samples in 2.2h using commodity hardware similar to what we use. One possible explanation for the discrepancy is that the we use the HAC-T open source Python implementation, while the original paper used a more efficient C version.
| Clusters | Singletons | Non-NULL clusters | Runtime (h) | ||||||||
| Feature | Filetype | All | Non-NULL | All | Non-NULL | Max. | Mean | Med. | Std | Sort | Group |
| cert_thumb. | All | 224.1M | 1.7M | 223.7M | 1.2M | 1.1M | 7.8 | 1.0 | 959.4 | 5.0 | 3.5 |
| avc2_family | All | 84.1M | 74.4K | 84.1M | 41.5K | 19.4M | 2.0 | 1.0 | 100,287.4 | 3.9 | 10.3 |
| vhash | All | 33.2M | 17.4M | 29.2M | 13.4M | 3.3M | 12.7 | 1.0 | 2,138.0 | 4.2 | 11.1 |
| imphash | Peexe | 14.1M | 8.3M | 11.6M | 5.7M | 6.0M | 18.1 | 1.0 | 5,537.1 | 5.9 | 2.3 |
Clustering the whole dataset.
Since FVG is the only clustering approach that scales to the largest day, we apply it to cluster the 235.7M feed samples. We use four features: the three features that support multiple filetypes and achieved best F1 score on both Malicia and AMD (avc2_family, vhash, cert_thumprint) plus imphash that is specific to Windows samples, but performs well on those (i.e., fourth F1 on Malicia). The clustering took between 8.2 hours for imphash up to 15.3 hours for vhash. Table 11 summarizes the results. It shows the total number of clusters produced, as well as the number of clusters excluding singleton clusters created for samples that have a NULL feature value. Similarly, it lists the total number of singleton clusters and those for samples with a non-NULL feature value, which matches the number of feature values in Table 7. For example, FVG-vhash produces 33.2M clusters, of which 29.2M (88%) are singletons and 4.0M (12%) contain multiple samples. Of those singletons, 15.8M (54%) correspond to samples without a vhash value, while 13.4M (46%) correspond to samples with a vhash value not shared with any other sample. The two features that are able to cluster more samples are imphash with a mean non-NULL cluster size of 18.1 followed by vhash (12.7). Still, all features have a median of one, showing that their distribution has at least 50% of singletons for samples with a non-NULL feature value. Depending on the application, analysts may want to first filter by filetype before clustering. We opted to include all filetypes in the clustering (for those features supporting multiple filetypes) to push the clustering scalability to the limit.
6 Detecting Not-so-Benign Samples
In this section we leverage the produced clusters for detecting samples thought to be benign (i.e., with zero detections) that may really be malicious because they belong to a cluster where most samples are detected as malicious.
| Vhash | Imphash | Thumbprint | ||||
| Cluster Type | r1 | r4 | r1 | r4 | r1 | r4 |
| Fully malic. | 73% | 46% | 89% | 81% | 50% | 19% |
| Fully benign | 19% | 44% | 6% | 14% | 23% | 65% |
| Mixed | 8% | 10% | 5% | 5% | 27% | 15% |
| Mal. majority | 5% | 6% | 3% | 3% | 17% | 8% |
For each cluster that is not a singleton, we compute two ratios: the number of samples with at least one detection over all cluster samples (r1) and the number of samples with at least four detections over all cluster samples (r4). Table 12 shows the fraction of non-singleton FVD clusters that belong to four classes: fully malicious clusters that have an rx of 1 (where x is 1 or 4); fully benign clusters with an rx of 0; and mixed clusters that contain a mixture of detected and undetected samples (i.e., 0 < rx < 1). For example, of the 4.0M non-singleton FVD-vhash clusters, 46% contain only samples with at least four detections (i.e., the cluster is fully malicious) and 44% have no samples with at least four detections (i.e., the cluster is benign). Of the remaining 10% non-singleton clusters 29,786 have at least half of the samples detected by at least four AV engines. Those 29K clusters contain 190K samples with no detections, which could be identified as malicious using their context. We illustrate such clusters with two examples.
vhash:7a41a7dd4a319c77194ec2a5f6c78aa1.
This cluster has 13,172 APK samples. Of those, 13,167 (99.96%) are detected by at least one AV engine and 13,152 (99.85%) are detected by more than 4 AV engines. Thus, the cluster is clearly malicious, but there are 5 samples that no AV engine detects as malicious. Those 5 samples can be reported to an analyst to check if they are indeed malicious and why they may be undetected. Similarly, there are an additional 15 samples with a low number of detections (i.e., less than four) that may also be of interest to an analyst.
thumb:0069be5da75d35577a5b1b02810571fc72d43162.
This cluster has 12 peexe samples, all with an invalid certificate chain that contain the same self-signed leaf certificate with subject “ZIRPER\zirpe”. There are 11 (91.67%) samples detected by at least 4 AV engines, but one sample has zero detections. Samples in the cluster have 4 different vhash values, no imphash values extracted by VT, and three filenames: AntiCheatS.exe (7 samples), AntiCheat.exe (4), and AntiCheatUpdater.exe (1). The undetected sample has a vhash not shared with other samples, but it has the most popular filename.
7 Related Work
Most related is the work by Ugarte-Pedrero et al. [47] that analyzes one day of the samples a large security vendor collects through multiple sources. They analyze 172K PE executables and cluster 58K using HAC. In contrast, we examine one year of a file feed with 235M samples of multiple filetypes, compare it to the telemetry of a large security vendor, and analyze scalable approaches to cluster the 235M samples. Other works have performed large scale longitudinal analysis on Windows [6, 25], Android [28, 45], and Linux [10, 3] malware. In contrast, our work examines malware for multiple platforms including Windows, Android, Linux, macOS, Microsoft Office macros, PDF documents, and Web content.
Extensive research has addressed the problem of clustering malware samples into families [5, 37, 16, 13, 40, 27, 42, 11, 43, 34]. However, none of those works has attempted to cluster as large a dataset as ours, more than five times the 42M samples clustered in the largest-to-date work [43]. Other related works address the problem of malware triage, i.e., how to prioritize samples for analysis [9, 19, 23, 8, 24, 18]. Most related among these is Spotlight [18], which takes as input malware, applies supervised classifiers to identify samples from well-known families, clusters the remaining unlabeled samples, and ranks the clusters with an application-dependant scoring function. In contrast, we use AvClass2 to identify samples belonging to well-known families and do not rank clusters, but identify clusters of interest that contain a majority of malware together with undetected samples.
8 Conclusions
We have characterized the VirusTotal feed by analyzing 328M reports for 235M samples collected from the feed during one year, and have compared the feed with the telemetry of a large security vendor. Among others, we show that despite having a volume 17 times lower than the telemetry, the feed observes 8 times more malware. The feed is fresh; 89% samples are new and samples appear a median of 4.4 hours after they are seen in user devices. The feed is also diverse containing 4.9K families with at least 100 samples. However, the diversity is largely due to Windows and Android families. On the negative side, the family distribution significantly differs from that observed in the telemetry indicating that VT may not be a good source to infer family impact on real users. We have also evaluated three clustering approaches with the goal of producing high precision clusters that scale to the 235M samples. Our results show that a simple grouping by feature value can produce clusters with 0.90–0.99 precision for selected features, and can cluster the 235M samples in 15 hours. Using FVG-vhash, we identify 29K clusters with a majority of samples detected by multiple AV engines, containing 190K likely malicious samples with zero detections.
Acknowledgments
This work has been partially supported by the SCUM Project (RTI2018-102043-B-I00) MCIN/AEI/10.13039/501100011033/ERDF A way of making Europe. This work has been partially supported by the Madrid regional government as part of the program S2018/TCS-4339 (BLOQUES-CM), co-funded by EIE Funds of the European Union. Any opinions, findings, and conclusions or recommendations in this material are those of the authors or originators, and do not necessarily reflect the views of the sponsors.
References
- [1] Tracking malware with import hashing. https://www.mandiant.com/resources/tracking-malware-import-hashing.
- [2] Virustotal api 2.0 reference: File feed. https://developers.virustotal.com/v2.0/reference/file-feed.
- [3] Omar Alrawi, Charles Lever, Kevin Valakuzhy, Kevin Snow, Fabian Monrose, Manos Antonakakis, et al. The Circle Of Life: A Large-Scale Study of The IoT Malware Lifecycle. In USENIX Security Symposium, 2021.
- [4] Daniel Arp, Michael Spreitzenbarth, Malte Huebner, Hugo Gascon, and Konrad Rieck. Drebin: Efficient and Explainable Detection of Android Malware in Your Pocket. In Network and Distributed System Security, 2014.
- [5] Ulrich Bayer, Paolo Milani Comparetti, Clemens Hlauschek, Christopher Kruegel, and Engin Kirda. Scalable, Behavior-Based Malware Clustering. In Network and Distributed System Security, 2009.
- [6] Ulrich Bayer, Imam Habibi, Davide Balzarotti, Engin Kirda, and Christopher Kruegel. A view on current malware behaviors. In LEET, 2009.
- [7] Xander Bouwman, Harm Griffioen, Jelle Egbers, Christian Doerr, Bram Klievink, and Michel Van Eeten. A different cup of TI? the added value of commercial threat intelligence. In 29th USENIX Security Symposium (USENIX Security 20), pages 433–450, 2020.
- [8] Ahmet Salih Buyukkayhan, Alina Oprea, Zhou Li, and William K. Robertson. Lens on the Endpoint: Hunting for Malicious Software Through Endpoint Data Analysis. In International Symposium on Research in Attacks, Intrusions, and Defenses, 2017.
- [9] Saurabh Chakradeo, Bradley Reaves, Patrick Traynor, and William Enck. MAST: Triage for Market-Scale Mobile Malware Analysis. In ACM Conference on Security and Privacy in Wireless and Mobile Networks, 2013.
- [10] Emanuele Cozzi, Mariano Graziano, Yanick Fratantonio, and Davide Balzarotti. Understanding Linux Malware. In IEEE Symposium on Security and Privacy, 2018.
- [11] Houtan Faridi, Srivathsan Srinivasagopalan, and Rakesh Verma. Performance evaluation of features and clustering algorithms for malware. In IEEE International Conference on Data Mining Workshops, 2018.
- [12] Mariano Graziano, Davide Canali, Leyla Bilge, Andrea Lanzi, Elaine Shi, Davide Balzarotti, Marten van Dijk, Michael Bailey, Srinivas Devadas, Mingyan Liu, et al. Needles in a haystack: Mining information from public dynamic analysis sandboxes for malware intelligence. In USENIX Security Symposium, 2015.
- [13] Xin Hu, Kang G. Shin, Sandeep Bhatkar, and Kent Griffin. MutantX-S: Scalable Malware Clustering Based on Static Features. In USENIX Annual Technical Conference, 2013.
- [14] Heqing Huang, Cong Zheng, Junyuan Zeng, Wu Zhou, Sencun Zhu, Peng Liu, Suresh Chari, and Ce Zhang. Android malware development on public malware scanning platforms: A large-scale data-driven study. In IEEE International Conference on Big Data. IEEE, 2016.
- [15] Wenyi Huang and Jack W. Stokes. MtNet: A Multi-Task Neural Network for Dynamic Malware Classification. In Detection of Intrusions and Malware, and Vulnerability Assessment, 2016.
- [16] Jiyong Jang, David Brumley, and Shobha Venkataraman. BitShred: Feature Hashing Malware for Scalable Triage and Semantic Analysis. In ACM Conference on Computer and Communications Security, 2011.
- [17] Chani Jindal, Christopher Salls, Hojjat Aghakhani, Keith Long, Christopher Kruegel, and Giovanni Vigna. Neurlux: Dynamic Malware Analysis without Feature Engineering. In Annual Computer Security Applications Conference, 2019.
- [18] Fabian Kaczmarczyck, Bernhard Grill, Luca Invernizzi, Jennifer Pullman, Cecilia M Procopiuc, David Tao, Borbala Benko, and Elie Bursztein. Spotlight: Malware Lead Generation at Scale. In Annual Computer Security Applications Conference, 2020.
- [19] Dhilung Kirat, Lakshmanan Nataraj, Giovanni Vigna, and BS Manjunath. Sigmal: A Static Signal Processing Based Malware Triage. In Annual Computer Security Applications Conference, 2013.
- [20] Platon Kotzias, Leyla Bilge, and Juan Caballero. Measuring PUP Prevalence and PUP Distribution through Pay-Per-Install Services. In USENIX Security Symposium, 2016.
- [21] Platon Kotzias, Juan Caballero, and Leyla Bilge. How Did That Get In My Phone? Unwanted App Distribution on Android Devices. In IEEE Symposium on Security and Privacy, 2021.
- [22] Platon Kotzias, Srdjan Matic, Richard Rivera, and Juan Caballero. Certified PUP: Abuse in Authenticode Code Signing. In ACM Conference on Computer and Communication Security, 2015.
- [23] Arun Lakhotia, Andrew Walenstein, Craig Miles, and Anshuman Singh. VILO: A Rapid Learning Nearest-Neighbor Classi er forMalware Triage. Journal of Computer Virology and Hacking Techniques, 9(3):109–123, 2013.
- [24] Giuseppe Laurenza, Leonardo Aniello, Riccardo Lazzeretti, and Roberto Baldoni. Malware Triage Based on Static Features and Public APT Reports. In International Conference on Cyber Security Cryptography and Machine Learning, 2017.
- [25] Chaz Lever, Platon Kotzias, Davide Balzarotti, Juan Caballero, and Manos Antonakakis. A lustrum of malware network communication: Evolution and insights. In IEEE Symposium on Security and Privacy, 2017.
- [26] Bo Li, Kevin Roundy, Chris Gates, and Yevgeniy Vorobeychik. Large-scale identification of malicious singleton files. In ACM on Conference on Data and Application Security and Privacy, 2017.
- [27] Yuping Li, Sathya Chandran Sundaramurthy, Alexandru G Bardas, Xinming Ou, Doina Caragea, Xin Hu, and Jiyong Jang. Experimental study of fuzzy hashing in malware clustering analysis. In Workshop on Cyber Security Experimentation and Test, 2015.
- [28] Martina Lindorfer, Matthias Neugschwandtner, Lukas Weichselbaum, Yanick Fratantonio, Victor Van Der Veen, and Christian Platzer. Andrubis–1,000,000 apps later: A view on current android malware behaviors. In International Workshop on Building Analysis Datasets and Gathering Experience Returns for Security, 2014.
- [29] Lorenzo Maffia, Dario Nisi, Platon Kotzias, Giovanni Lagorio, Simone Aonzo, and Davide Balzarotti. Longitudinal study of the prevalence of malware evasive techniques. arXiv preprint arXiv:2112.11289, 2021.
- [30] malshare: A free malware repository providing researchers access to samples, malicious feeds, and yara results, 2022. https://malshare.com/.
- [31] Malwarebazaar, 2022. https://bazaar.abuse.ch/.
- [32] Alessandro Mantovani, Simone Aonzo, Xabier Ugarte-Pedrero, Alessio Merlo, and Davide Balzarotti. Prevalence and Impact of Low-Entropy Packing Schemes in the Malware Ecosystem. In Network and Distributed Systems Security Symposium, 2020.
- [33] Antonio Nappa, M. Zubair Rafique, and Juan Caballero. The MALICIA Dataset: Identification and Analysis of Drive-by Download Operations. International Journal of Information Security, 14(1):15–33, February 2015.
- [34] Jonathan Oliver, Muqeet Ali, and Josiah Hagen. HAC-T and Fast Search for Similarity in Security. In IEEE International Conference on Omni-layer Intelligent Systems (COINS), 2020.
- [35] Jonathan Oliver, Muqeet Ali, Haoping Liu, and Josiah Hagen. Fast clustering of high dimensional data clustering the malware bazaar dataset. Technical report, 2021.
- [36] Fabio Pagani, Matteo Dell’Amico, and Davide Balzarotti. Beyond precision and recall: understanding uses (and misuses) of similarity hashes in binary analysis. In ACM Conference on Data and Application Security and Privacy, 2018.
- [37] Roberto Perdisci, Wenke Lee, and Nick Feamster. Behavioral Clustering of HTTP-Based Malware and Signature Generation Using Malicious Network Traces. In USENIX Symposium on Networked Systems Design and Implementation, 2010.
- [38] Marco Pontello. TrID - File Identifier, 2021. http://mark0.net/soft-trid-e.html.
- [39] Edward Raff, Jon Barker, Jared Sylvester, Robert Brandon, Bryan Catanzaro, and Charles K Nicholas. Malware Detection by Eating a Whole EXE. In Workshops at the AAAI Conference on Artificial Intelligence, 2018.
- [40] M. Zubair Rafique and Juan Caballero. FIRMA: Malware Clustering and Network Signature Generation with Mixed Network Behaviors. In International Symposium on Research in Attacks, Intrusions and Defenses, 2013.
- [41] Konrad Rieck, Thorsten Holz, Carsten Willems, Patrick Düssel, and Pavel Laskov. Learning and Classification of Malware Behavior. In Detection of Intrusions and Malware, and Vulnerability Assessment, 2008.
- [42] Marcos Sebastian, Richard Rivera, Platon Kotzias, and Juan Caballero. Avclass: A tool for massive malware labeling. In Research in Attacks, Intrusions, and Defenses, 2016.
- [43] Silvia Sebastián and Juan Caballero. Avclass2: Massive malware tag extraction from av labels. In Annual Computer Security Applications Conference, 2020.
- [44] Charles Smutz and Angelos Stavrou. Malicious PDF Detection using Metadata and Structural Features. In Annual Computer Security Applications Conference, 2012.
- [45] Guillermo Suarez-Tangil and Gianluca Stringhini. Eight years of rider measurement in the android malware ecosystem. IEEE Transactions on Dependable and Secure Computing, 2020.
- [46] 2022. https://github.com/trendmicro/tlsh.
- [47] Xabier Ugarte-Pedrero, Mariano Graziano, and Davide Balzarotti. A close look at a daily dataset of malware samples. ACM Transactions on Privacy and Security (TOPS), 22(1):1–30, 2019.
- [48] Vector Guo Li and Matthew Dunn and Paul Pearce and Damon McCoy and Geoffrey M. Voelker and Stefan Savage. Reading the Tea leaves: A Comparative Analysis of Threat Intelligence. 2019.
- [49] Virusshare.com - because sharing is caring, 2022. https://virusshare.com/.
- [50] VirusTotal. http://www.virustotal.com/.
- [51] 2021. https://developers.virustotal.com/reference/files.
- [52] Virustotal premium services, 2022. https://assets.virustotal.com/vt-premium-services-catalog.pdf.
- [53] Virustotal last 7 days statistics, 2022. https://www.virustotal.com/gui/stats/.
- [54] George D Webster, Bojan Kolosnjaji, Christian von Pentz, Julian Kirsch, Zachary D Hanif, Apostolis Zarras, and Claudia Eckert. Finding the needle: A study of the pe32 rich header and respective malware triage. In International conference on detection of intrusions and malware, and vulnerability assessment, 2017.
- [55] Fengguo Wei, Yuping Li, Sankardas Roy, Xinming Ou, and Wu Zhou. Deep Ground Truth Analysis of Current Android Malware. In Conference on Detection of Intrusions and Malware & Vulnerability Assessment, 2017.
- [56] Lun-Pin Yuan, Wenjun Hu, Ting Yu, Peng Liu, and Sencun Zhu. Towards Large-Scale hunting for android Negative-Day malware. In International Symposium on Research in Attacks, Intrusions and Defenses, 2019.
- [57] Shuofei Zhu, Jianjun Shi, Limin Yang, Boqin Qin, Ziyi Zhang, Linhai Song, and Gang Wang. Measuring and Modeling the Label Dynamics of Online Anti-Malware Engines. In USENIX Security Symposium, 2020.
Appendix
| Filetype | Family | Class | Samples |
| javascript | FAM:faceliker | clicker | 2,288,894 |
| FAM:facelike | pup | 952,180 | |
| FAM:coinhive | miner | 766,087 | |
| FAM:cryxos | - | 744,894 | |
| FAM:smsreg | pup | 415,669 | |
| UNK:gnaeus | - | 400,570 | |
| FAM:fakejquery | downloader | 330,792 | |
| UNK:hidelink | - | 210,306 | |
| UNK:expkit | - | 96,433 | |
| UNK:agentwdcr | - | 87,101 | |
| html | UNK:refresh | - | 882,026 |
| FAM:cryxos | - | 363,821 | |
| FAM:faceliker | clicker | 312,563 | |
| FAM:smsreg | pup | 201,253 | |
| UNK:redir | downloader | 200,926 | |
| FAM:coinhive | miner | 152,968 | |
| UNK:generickdz | pup | 121,975 | |
| UNK:pushnotif | - | 120,085 | |
| FAM:ramnit | virus | 80,044 | |
| UNK:fklr | rogueware | 79,353 | |
| UNK:fakeauthent | phishing | 194,963 | |
| UNK:minerva | phishing | 15,527 | |
| FAM:pdfka | exploit | 13,618 | |
| UNK:pidief | - | 6,319 | |
| FAM:alien | downloader | 6,137 | |
| UNK:gorilla | phishing | 4,749 | |
| UNK:talu | phishing | 2,379 | |
| UNK:gerphish | phishing | 1,558 | |
| UNK:urlmal | phishing | 1,469 | |
| FAM:rozena | pup | 839 |
| Filetype | Family | Class | Samples |
| peexe | FAM:berbew | backdoor | 19,371,273 |
| FAM:dinwod | downloader | 9,398,314 | |
| FAM:virlock | virus | 7,921,534 | |
| FAM:pajetbin | worm | 7,164,373 | |
| FAM:sivis | virus | 6,222,693 | |
| FAM:lamer | virus | 4,074,441 | |
| FAM:salgorea | downloader | 3,737,865 | |
| FAM:vobfus | worm | 3,415,996 | |
| FAM:drolnux | worm | 2,858,975 | |
| FAM:griptolo | worm | 2,407,104 | |
| apk | FAM:smsreg | pup | 616,406 |
| FAM:ewind | pup:adware | 430,531 | |
| FAM:hiddad | pup:adware | 219,577 | |
| FAM:fakeadblocker | pup:adware | 82,715 | |
| FAM:adlibrary:airpush | pup:adware | 80,704 | |
| FAM:adlibrary:revmob | pup:adware | 78,495 | |
| FAM:dowgin | pup:adware | 68,522 | |
| FAM:dnotua | pup | 65,330 | |
| FAM:kuguo | pup:adware | 63,262 | |
| FAM:mobidash | pup:adware | 40,016 | |
| elf | FAM:xorddos | ddos | 287,631 |
| FAM:mirai | backoor | 163,525 | |
| FAM:mirai:gafgyt | backoor | 59,348 | |
| FAM:tsunami | backoor | 3,381 | |
| FAM:mirai:hajime | downloader | 2,499 | |
| FAM:mirai:mozi | backdoor | 1,996 | |
| FAM:setag | backdoor | 1,454 | |
| FAM:dofloo | backdoor | 890 | |
| FAM:fakecop | pup | 805 | |
| FAM:ladvix | virus | 580 | |
| macho | FAM:flashback | downloader | 33,087 |
| FAM:mackontrol | backdoor | 15,459 | |
| FAM:mackeeper | pup | 15,017 | |
| FAM:evilquest | ransomware | 7,070 | |
| FAM:cimpli | pup:adware | 5,444 | |
| FAM:gt32supportgeeks | pup | 3,453 | |
| FAM:genieo | pup:adware | 3,339 | |
| FAM:bundlore | pup:adware | 3,142 | |
| FAM:installcore | pup:adware | 1,543 | |
| UNK:fplayer | pup:adware | 905 | |
| doc | FAM:emotet | infosteal | 24,643 |
| FAM:valyria | downloader | 10,182 | |
| FAM:thus | virus | 4,917 | |
| FAM:sagent | downloader | 4,717 | |
| FAM:donoff | downloader | 2,437 | |
| FAM:sload | downloader | 1,856 | |
| FAM:marker | virus | 1,326 | |
| FAM:logan | downloader | 1,135 | |
| FAM:sdrop | downloader | 906 | |
| FAM:alien | downloader | 846 | |
| xls | UNK:sneaky | downloader | 23,521 |
| FAM:qbot | backdoor | 22,416 | |
| FAM:squirrelwaffle | downloader | 18,230 | |
| FAM:zloader | downloader | 12,371 | |
| FAM:sload | downloader | 9,067 | |
| FAM:sagent | downloader | 8,581 | |
| FAM:valyria | downloader | 6,074 | |
| UNK:encdoc | downloader | 5,703 | |
| FAM:icedid | downloader | 4,237 | |
| FAM:laroux | virus | 2,983 |