A magnified compact galaxy at redshift 9.51 with strong nebular emission lines
16Department of Astronomy, University of California, Berkeley, CA 94720-3411, USA
17Kavli Institute for the Physics and Mathematics of the Universe, The University of Tokyo, Kashiwa, Japan 277-8583
Ultraviolet light from early galaxies is thought to have ionized the intergalactic gas. However, there are few observational constraints on this epoch, due to the faintness of those galaxies and the redshifting of their light in to the infrared. We report the discovery, in JWST imaging, of a distant galaxy that is magnified by gravitational lensing. JWST spectroscopy, at rest-frame optical wavelengths, detects strong nebular emission lines that are attributable to oxygen and hydrogen. The measured redshift is , corresponding to 510 million years after the Big Bang. The galaxy has a radius of 16.2 parsecs, which is substantially more compact than galaxies with equivalent luminosity at 6 to 8, leading to a high star formation rate surface density.
Radiation from early galaxies is thought to be responsible for the reionization of the Universe, the process in which the majority of the intergalactic neutral gas was ionized by high energy photons. Observational constraints suggest that reionization was completed when the Universe was approximately one billion years old (redshift ) (?). The precise timeline of reionization, and the relative contributions of faint and bright galaxies to the ionizing photon budget, remain uncertain (?). Observations of distant galaxies that existed during the epoch of reionization are crucial to understanding the physical processes that occured during that period (?).
The intrinsic faintness and small angular sizes of galaxies at high redshifts constrain our ability to observe them in detail. Because of their very large masses, galaxy clusters act as gravitational lenses, magnifying the flux and stretching the angular extent of distant background galaxies. Gravitational lensing can therefore extend the observational limits of a telescope, probing faint and small galaxies at high redshifts that would otherwise be undetectable (?).
Near-infrared imaging has identified distant galaxy candidates at and up to (?, ?, ?), but the redshifts of those candidates have not been confirmed with spectroscopy. Among these candidates are an unexpectedly large number of galaxies with bright ultraviolet (UV) absolute magnitudes ( mag; (?, ?, ?)) and high stellar masses ( solar masses (); (?)). This population was not predicted by simulations of early galaxy formation that assumed standard cosmology (?, ?). Spectroscopy is necessary to confirm the redshifts of these galaxies and infer their physical properties from the strengths of their emission lines.
Nebular emission lines are produced by clouds of interstellar gas within a galaxy, and spectroscopic analysis of these lines can provide information about the density, temperature, and chemical composition of the gas. Spectroscopy has confirmed three high-redshift galaxies () with detections of strong nebular emission lines (?) and the temperature-sensitive [O iii] 4363 Å emission line, which has been used to make the first direct electron temperature oxygen abundance measurements in galaxies at these redshifts (?, ?, ?, ?, ?). There has been further spectroscopic confirmation of seven galaxies from – (?).
Imaging observations and analysis
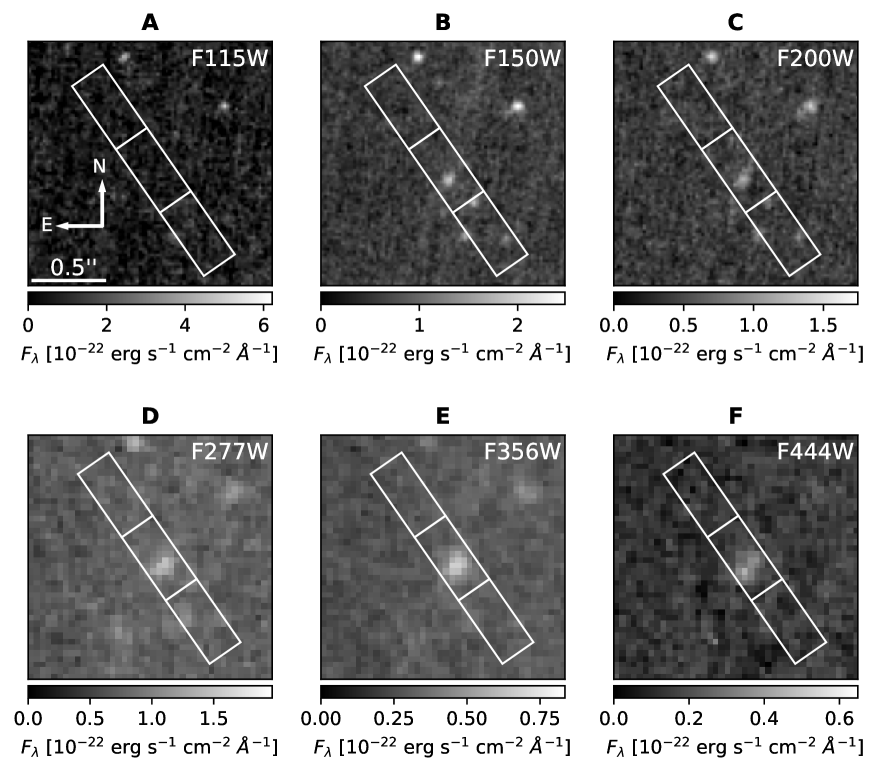
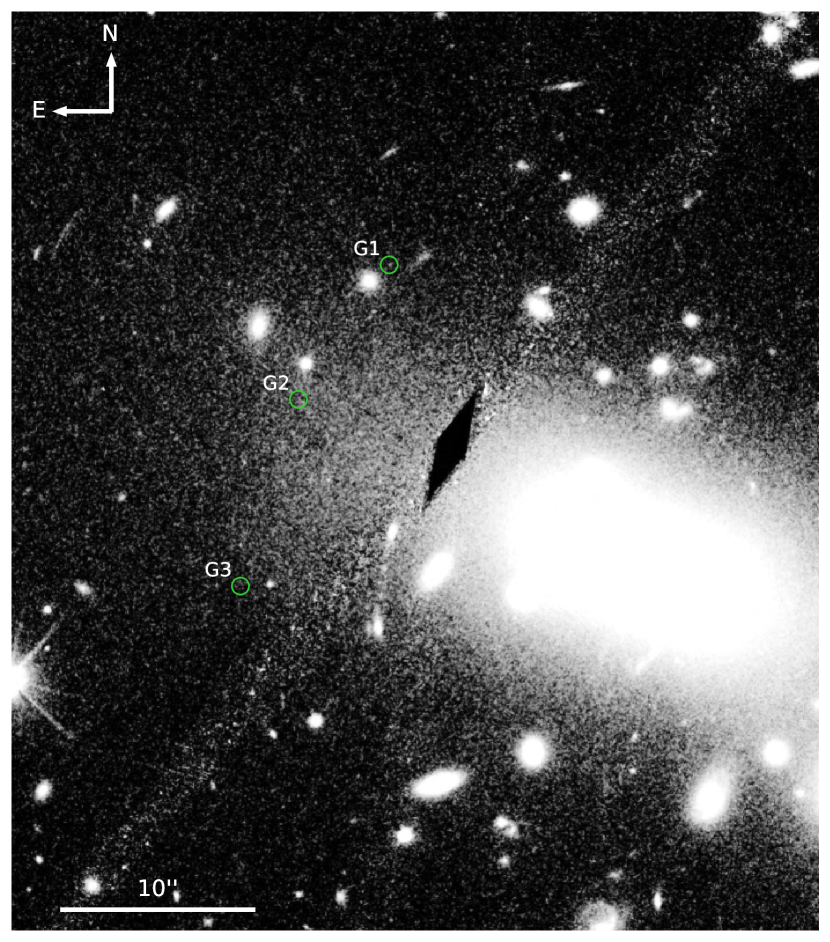
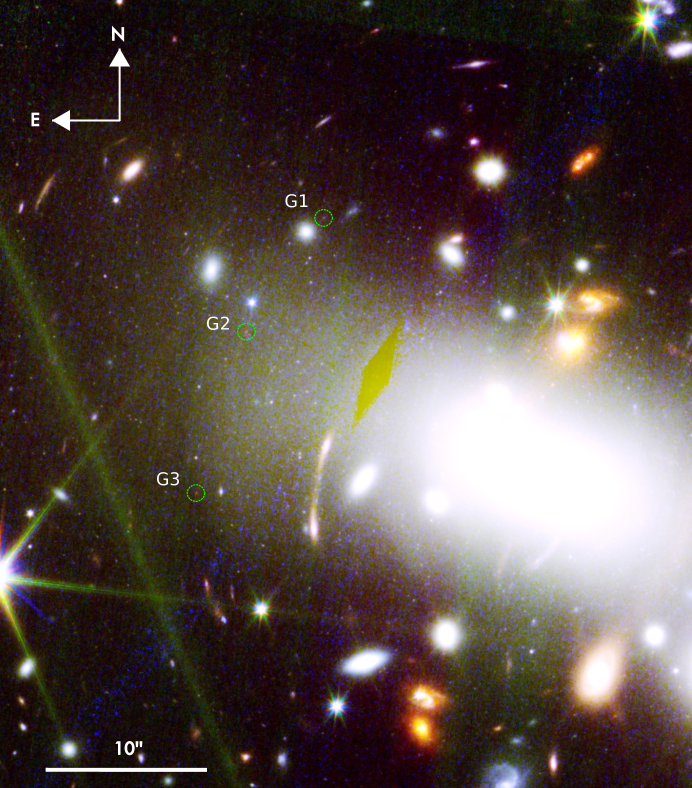
We obtained imaging of the RX J2129+0005 cluster field (hereafter RX J2129) on 2022 October 6 with the Near-Infrared Camera (NIRCam) instrument on JWST operating in imaging mode as part of a Director’s Discretionary program (DD 2767; PI P. Kelly). NIRCam spans a wavelength range of 0.6 m to 5.0 m; we obtained exposures in the F115W, F150W, F200W, F277W, F356W, and F444W filters. The name of each filter indicates its approximate central wavelength and bandwidth; for example, the central wavelength of the F115W filter is approximately 1.15 m and the bandwidth is wide (0.225 m). Our exposure times ranged from 2026 s for the F444W filter to 19927 s for the F150W filter. The astrometric alignment for the NIRCam images was performed using a catalog prepared from previous imaging taken with the Suprime-Cam instrument on the Subaru telescope (?). The color-composite NIRCam image of the RX J2129 cluster is shown in Figure 1. In this image, we identified a candidate distant galaxy (designated RX J2129-z95) which appears as three images (designated RX J2129-z95:G1, RX J2129-z95:G2, and RX J2129-z95:G3) due to the gravitational lensing of the foreground cluster. Coordinates for the three images of RX J2129-z95 are given in Table S2. Photometric measurements from the NIRCam imaging, along with measurements from previous Hubble Space Telescope (HST) imaging of the RX J2129 cluster field obtained with the Advanced Camera for Surveys (ACS) and the Wide Field Camera 3 (WFC3), are listed in Table S1 (?).
We used the eazy-py software (?) to constrain the photometric redshift (an estimate for a source’s redshift made without the use of spectroscopy) of all sources in the field detected in the NIRCam imaging (?). We obtained a photometric redshift of for image G2 of RX J2129-z95. From the NIRCam photometry, we estimate a UV spectral slope () of -1.98 0.11 (?). Using the F150W photometric flux measurement and correcting for the effect of magnification due to gravitational lensing on image G2 (magnification (?)), we calculate the absolute UV magnitude at 1500 Å mag.
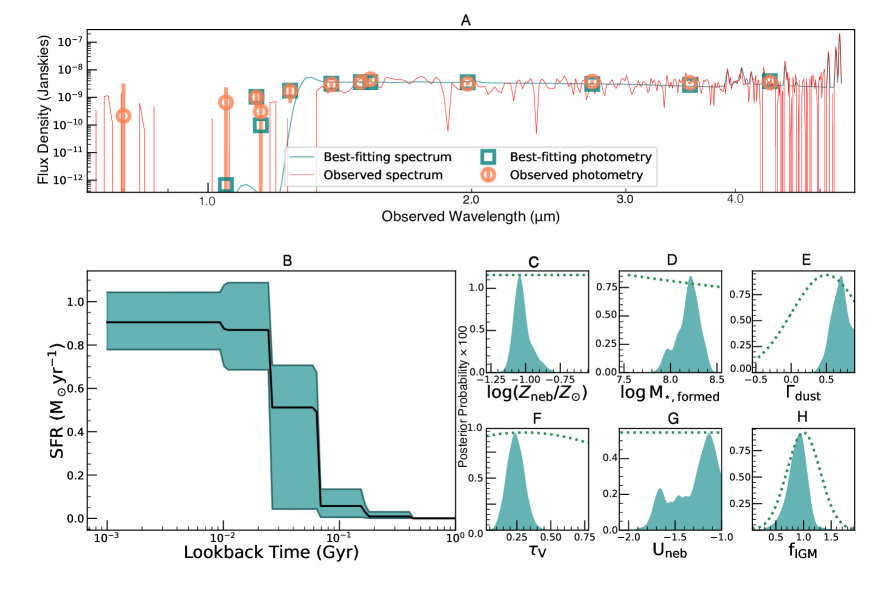
We use the prospector software (?) to infer the physical properties of the galaxy from the spectral energy distribution (SED) of image G2, using the NIRCam photometry and non-detections from archival optical HST imaging (?). Before doing so, we correct the photometry for the effect of magnification due to gravitational lensing. We find that the galaxy has a low stellar mass (uncertainty is 1 and includes the propagated uncertainty in magnification). The template fitting also indicates an oxygen abundance of . The best-fitting star formation history (SFH) has a mass-weighted age of Myrs and indicates a star formation rate (SFR) of SFR M⊙ yr-1. The observed SED of image G2 and best fitting prospector model are shown in Figure S3 (?).
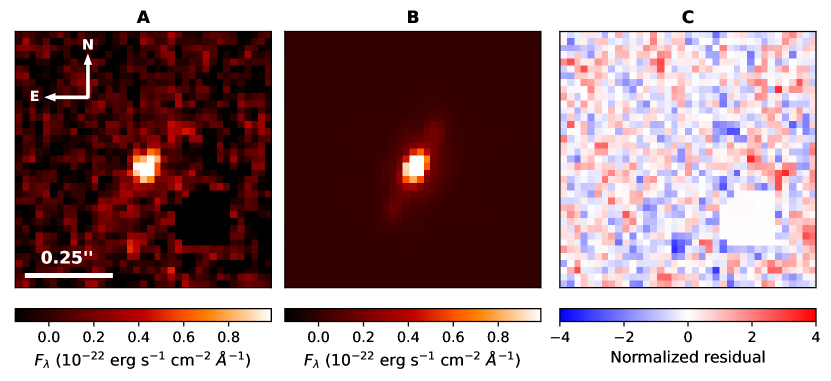
We use the Lenstruction software (?, ?) to reconstruct the F150W image G2 of the galaxy, correcting for the effects of gravitational lensing and convolution with the NIRCam point spread function (PSF). We fit the reconstructed image with a surface brightness model, consisting of an elliptical Sèrsic profile with index fixed to 0.5. determines the degree of curvature of the profile, and represents a Gaussian profile. This indicates the intrinsic half-light radius of the reconstructed source pc (Figure S7). We also fit the observed F150W image directly, using the Galight software (?), which indicates an observed angular size of arcseconds.
Spectroscopic Observations and Analysis
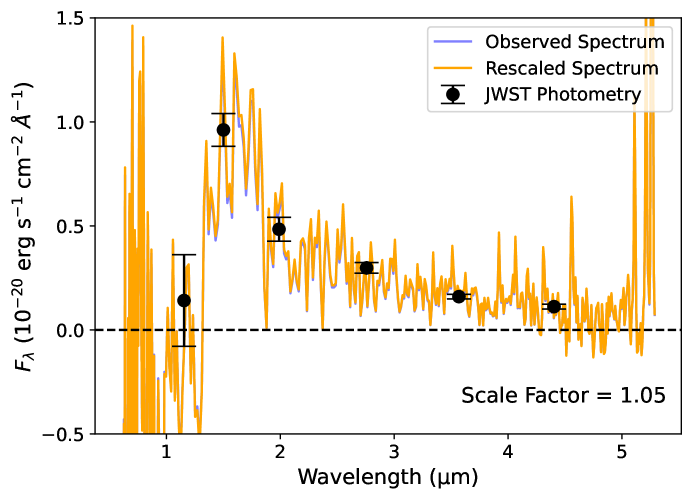
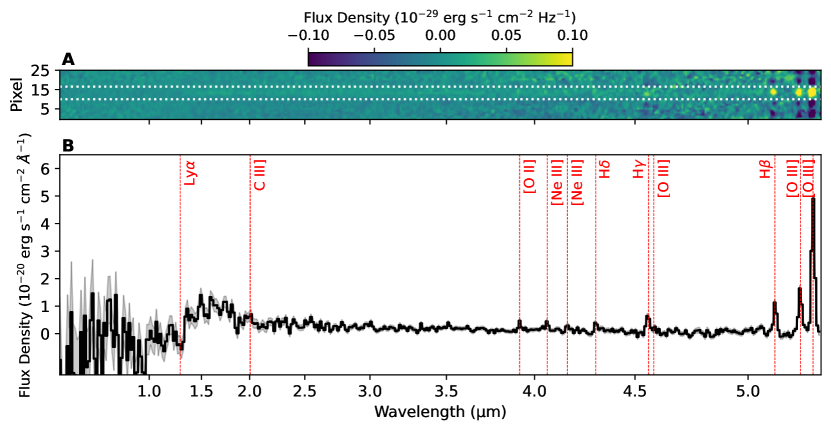
We obtained follow-up spectroscopy of the RX J2129 cluster field on 2022 October 22, using JWST’s Near Infrared Spectrograph (NIRSpec) in Multi-Object Spectroscopy (MOS) mode. Targets were selected based on photometric redshift estimates from the NIRCam imaging. We used a standard 3-shutter dither pattern and obtained a 4464 s exposure using the prism disperser. This setup provides wavelength coverage from 0.6 m to 5.3 m, with spectral resolving power ranging from to (?). The fully calibrated one-dimensional (1D) and two-dimensional (2D) spectra are shown in Figure 2 (?).
We estimate the spectroscopic redshift of the galaxy by visual identification of the emission lines H and [O iii] 4959,5007 Å. We refine our redshift measurement by modeling the emission-line profiles (see below), which yields . The spectroscopic redshift is consistent with the photometric redshift (), indicating that the lines have not been misidentified.
To constrain the fluxes of the emission lines, we use the pPXF (Penalized Pixel-Fitting) software (?), which models the stellar continuum and fits Gaussian profiles to each of the emission lines (?). Table 1 lists our measured emission-line fluxes, equivalent widths (EWs), and corresponding uncertainties. We do not detect Ly, with a 3 upper limit for its flux of approximately erg s-1 cm-2 (?). We assume negligible extinction due to dust and apply no reddening correction to the flux measurements (?).
| Rest Frame | Observed Flux | Rest Frame | |
| Emission Line | Wavelength (Å) | (10-19 erg s-1 cm-2) | EW (Å) |
| Ly | 1216 | < 39 | < 31 |
| C iii] + [C iii] | 1907, 1909 | < 20 | < 51 |
| [O ii] | 3626, 3629 | 5.9 1.6 | 44.0 11.7 |
| [Ne iii] | 3869 | 6.3 1.4 | 53.4 11.6 |
| [Ne iii] + H | 3968, 3970 | < 4.9 | < 39 |
| H | 4102 | 5.7 1.2 | 52.1 11.0 |
| H | 4340 | 11.8 1.7 | 194.9 27.0 |
| [O iii] | 4363 | < 5.0 | < 74 |
| H | 4861 | 17.8 2.5 | 248.0 35.0 |
| [O iii] | 4959 | 26.3 1.8 | 392.3 26.8 |
| [O iii] | 5007 | 79.0 2.0 | 1092.0 28.4 |
We infer the star-formation rate (SFR) of the galaxy from our H flux measurement using the relation,
| (1) |
where is the intrinsic H luminosity of the galaxy. To compute , we correct for magnification due to lensing and assume Case B recombination (?). We find SFR = M⊙ yr-1 (?). This value is approximately 50% larger than the value we derived from the SED fitting ( M⊙ yr-1), but the discrepancy is . Using the stellar mass we inferred from the SED fitting (), we compute the specific star formation rate (sSFR, the SFR per unit mass). We find yr-1.
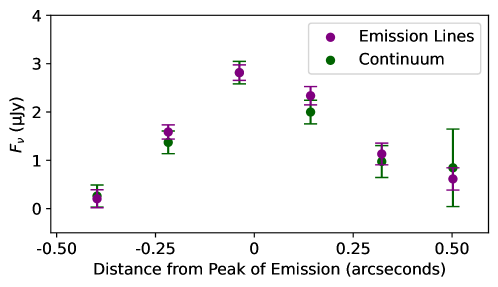
To test for a spatial offset between the nebular emission and the stellar continuum, we extract profiles along the spatial axis of the NIRSpec MOS slit. We extract spatial profiles of the strong emission lines in 0.05 m windows. For the stellar continuum, we extract the spatial profile of the spectrum at all wavelengths above 1.5 m, masking out the regions within 0.05 m of any strong emission lines. We find no evidence for an offset between the nebular emission lines and stellar continuum (Figure S6).
We use the fluxes of the strongest emission lines of oxygen and hydrogen to estimate the oxygen abundance of the galaxy. The high ratio we calculate for this galaxy is consistent with highly ionized gas with low metallicity. We therefore use an empirical calibration derived by (?) measured from low-metallicity () galaxies,
| (2) |
where . For the galaxy, we find an oxygen abundance of 12 + log(O/H) , where the uncertainty includes both line-flux and calibration uncertainties (?). Using other calibrations (?, ?) results in consistent estimates. The oxygen abundance derived from the photometry is also consistent with the emission line calibrations within 1.5 (?).
Galaxy properties in context.
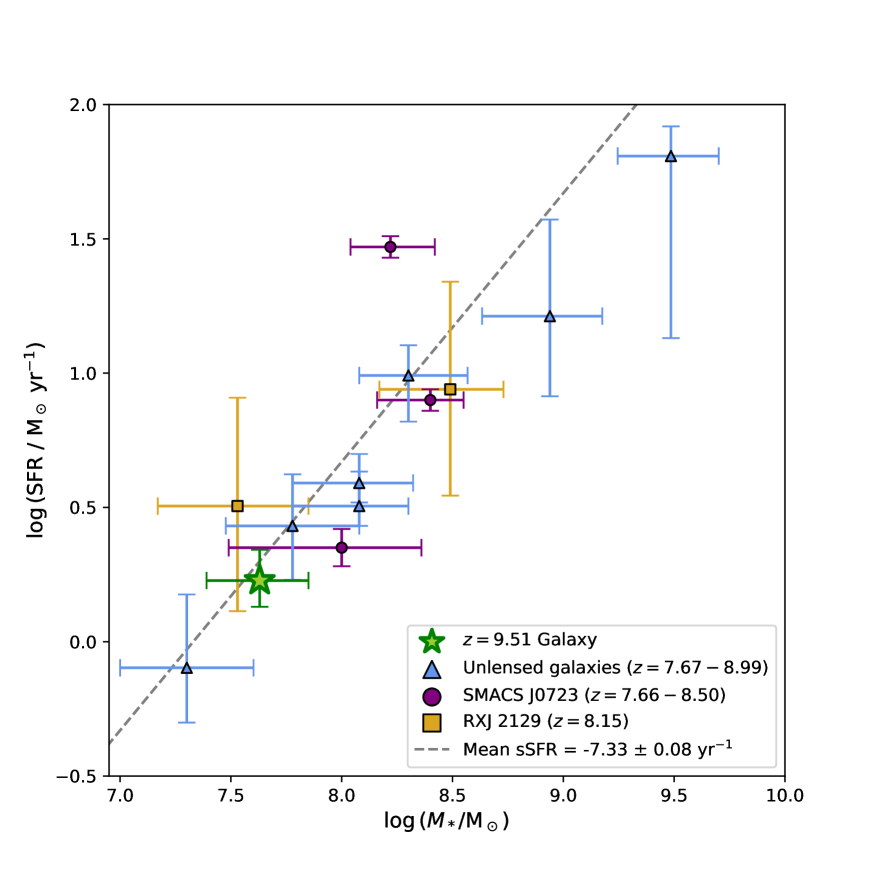
The high magnification provided by gravitational lensing enabled us to detect this intrinsically faint galaxy ( mag) with strong emission lines. Without lensing magnification, the galaxy’s apparent magnitudes would be too faint to detect in the JWST images. We measured a lower mass and luminosity than other galaxies with strong emission line detections at , but a similar sSFR (Figure S4).
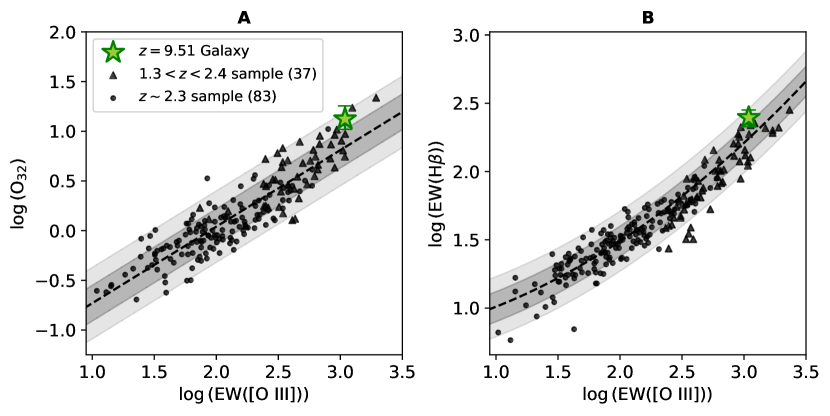
Star-forming galaxies that have emission lines with very large EWs at exhibit tight correlations between the EW of the [O III] 5007 Å emission line and the O32 ratio, and between the EWs of [O III] 5007 Å and H (?). The properties of the galaxy are consistent with both of these relations within 2 (Figure S5). The high we measure for this object is similar to that of other galaxies with high EW emission lines at high redshifts during the epoch of reionization, and of their local counterparts (?, ?). The high O32 might indicate a high escape fraction of hydrogen-ionizing radiation, . For example, using an empirical relation (?), we infer . However, there is large scatter in this relation, and other methods of inferring do not yield such high escape fractions. For example, the UV spectral slope () suggests a much smaller escape fraction, (?). Given these discrepant indicators and large uncertainties, we cannot draw any conclusions about from this galaxy.
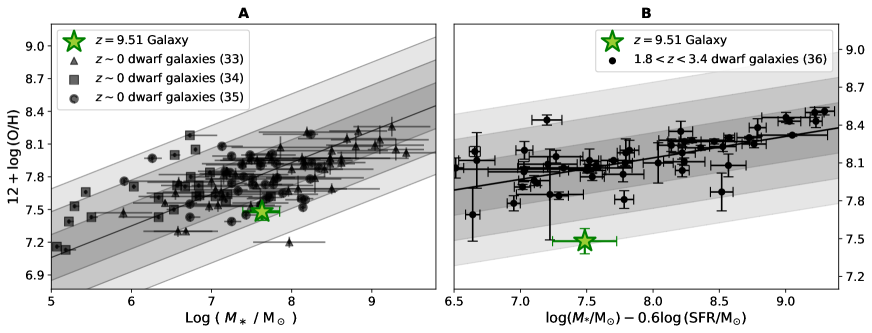
The oxygen abundance is 12 + (O/H) = dex (see above), which is consistent within 2 with the mass-metallicity relation observed in the local Universe for similar-mass galaxies (?). The galaxy’s oxygen abundance is approximately 0.6 dex lower (2.5) than the more general relation between stellar mass, SFR, and metallicity (Fundamental Metallicity Relation; FMR) for dwarf galaxies at (?) (Figure 3). The oxygen abundances at redshift are known to fall below the FMR by 0.3 - 0.6 dex (?).
To determine whether the galaxy hosts an active galactic nucleus (AGN), we compare our measurements of the stellar mass and the [O iii] 5007 Å to H emission-line flux ratio ((([O iii]) / (H))= 0.65 0.06) to measurements from a sample of local galaxies at redshifts (?). At similar stellar masses and emission line ratios to the galaxy, less than 1% of the local galaxies were classified as AGN. If this fraction does not substantially evolve with redshift, it is unlikely that the galaxy hosts an AGN.
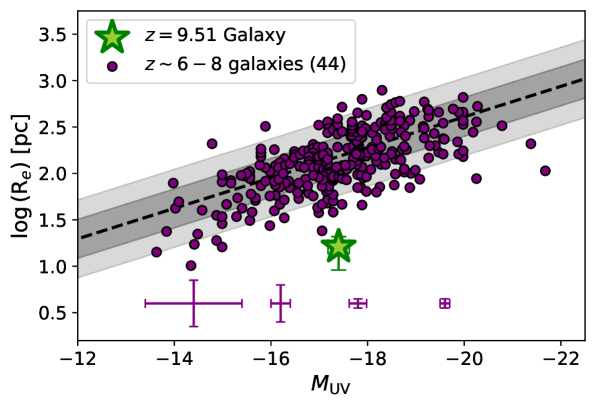
We measured a half-light radius of pc for the galaxy, which is very compact compared to galaxies with similar luminosities at redshifts (Figure 4). The half-light radius of the galaxy is a factor of 9.8 times smaller than the size-luminosity relation at those redshifts (?), a 4 difference. The galaxy is also more compact than individual star-forming clumps with similar SFRs observed at redshifts (?) (Figure S9). Star-forming clumps have been shown to have a trend of increasing SFR at a fixed size with increasing redshift (?).
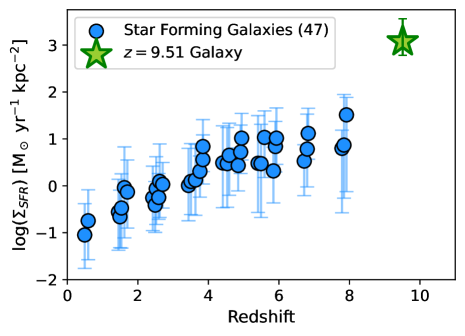
From our measurements of the SFR and half-light radius of the galaxy, we infer a very high star formation rate surface density M⊙ yr-1 kpc-2. has been observed to increase with redshift from to (?) . The of the galaxy is a factor of 38 times higher than the galaxies in the highest redshift bin () of that sample (Figure S8).
References and Notes
- 1. Planck Collaboration, et al., Planck 2018 results - VI. Cosmological parameters, Astronomy and Astrophysics, 641, A6 (2020).
- 2. S. L. Finkelstein, et al., Conditions for Reionizing the Universe with a Low Galaxy Ionizing Photon Escape Fraction, The Astrophysical Journal, 879, 36 (2019).
- 3. P. Dayal, Early galaxy formation and its large-scale effects, Proceedings of the International Astronomical Union, 15, 43–43 (2019).
- 4. B. E. Robertson, et al., New Constraints ON Cosmic Reionization from the 2012 Hubble Ultra Deep Field Campaign, The Astrophysical Journal, 768, 71 (2013).
- 5. N. J. Adams, et al., Discovery and properties of ultra-high redshift galaxies () in the JWST ERO SMACS 0723 Field, Monthly Notices of the Royal Astronomical Society, 518, 4755-4766 (2022).
- 6. M. Castellano, et al., Early Results from GLASS-JWST. III. Galaxy Candidates at *, The Astrophysical Journal Letters, 938, L15 (2022).
- 7. H. Yan, Z. Ma, C. Ling, C. Cheng, J.-S. Huang, First Batch of Candidate Objects Revealed by the James Webb Space Telescope Early Release Observations on SMACS 0723-73, The Astrophysical Journal Letters, 942, L9 (2022).
- 8. H. Atek, et al., Revealing galaxy candidates out to with JWST observations of the lensing cluster SMACS0723, Monthly Notices of the Royal Astronomical Society, 519, 1201-1220 (2022).
- 9. S. L. Finkelstein, et al., A Long Time Ago in a Galaxy Far, Far Away: A Candidate Galaxy in Early JWST CEERS Imaging, The Astrophysical Journal Letters, 940, L55 (2022).
- 10. R. P. Naidu, et al., Two Remarkably Luminous Galaxy Candidates at Revealed by JWST, The Astrophysical Journal Letters, 940, L14 (2022).
- 11. I. Labbé, et al., A population of red candidate massive galaxies 600 Myr after the Big Bang, Nature, Nature (2023).
- 12. C. A. Mason, M. Trenti, T. Treu, The brightest galaxies at cosmic dawn, Monthly Notices of the Royal Astronomical Society, 521, 497-503 (2023).
- 13. M. Boylan-Kolchin, Stress Testing CDM with High-redshift Galaxy Candidates, arXiv e-prints, arXiv e-prints p. arXiv:2208.01611 (2022).
- 14. A. C. Carnall, et al., A first look at the SMACS 0723 JWST ERO: spectroscopic redshifts, stellar masses, and star-formation histories, Monthly Notices of the Royal Astronomical Society: Letters, 518, L45–L50 (2022).
- 15. K. Z. Arellano-Córdova, et al., A First Look at the Abundance Pattern—O/H, C/O, and Ne/O—in Galaxies with JWST/NIRSpec, The Astrophysical Journal Letters, 940, L23 (2022).
- 16. M. Curti, et al., The chemical enrichment in the early Universe as probed by JWST via direct metallicity measurements at z 8, Monthly Notices of the Royal Astronomical Society, 518, 425–438 (2022).
- 17. J. E. Rhoads, et al., Finding Peas in the Early Universe with JWST, The Astrophysical Journal Letters, 942, L14 (2023).
- 18. D. Schaerer, et al., First look with JWST spectroscopy: Resemblance among galaxies and local analogs, Astronomy & Astrophysics, 665, L4 (2022).
- 19. J. R. Trump, et al., The Physical Conditions of Emission-line Galaxies at Cosmic Dawn from JWST/NIRSpec Spectroscopy in the SMACS 0723 Early Release Observations, The Astrophysical Journal, 945, 35 (2023).
- 20. S. Fujimoto, et al., CEERS Spectroscopic Confirmation of NIRCam-Selected z 8 Galaxy Candidates with JWST/NIRSpec: Initial Characterization of their Properties, arXiv:2301.09482.
- 21. Materials and methods are available as supplementary materials.
- 22. G. B. Brammer, P. G. van Dokkum, P. Coppi, EAZY: A Fast, Public Photometric Redshift Code, The Astrophysical Journal, 686, 1503-1513 (2008).
- 23. B. D. Johnson, J. Leja, C. Conroy, J. S. Speagle, Stellar Population Inference with Prospector, The Astrophysical Journal Supplement Series, 254, 22 (2021).
- 24. L. Yang, S. Birrer, T. Treu, A versatile tool for cluster lensing source reconstruction - I. Methodology and illustration on sources in the Hubble Frontier Field Cluster MACS J0717.5+3745, Monthy Notices of the Royal Astronomical Society, 496, 2648-2662 (2020).
- 25. S. Birrer, et al., lenstronomy II: A gravitational lensing software ecosystem, The Journal of Open Source Software, 6, 3283 (2021).
- 26. X. Ding, S. Birrer, T. Treu, J. D. Silverman, Galaxy shapes of Light (GaLight): a 2D modeling of galaxy images, arXiv:2111.08721 (2021).
- 27. P. Jakobsen, et al., The Near-Infrared Spectrograph (NIRSpec) on the James Webb Space Telescope, Astronomy & Astrophysics, 661, A80 (2022).
- 28. M. Cappellari, Full spectrum fitting with photometry in ppxf: non-parametric star formation history, metallicity and the quenching boundary from 3200 LEGA-C galaxies at redshift , arXiv:2208:14974 (2022).
- 29. D. E. Osterbrock, Astrophysics of gaseous nebulae and active galactic nuclei (University Science Books, 1989).
- 30. Izotov, Y. I., Guseva, N. G., Fricke, K. J., Henkel, C., Low-redshift lowest-metallicity star-forming galaxies in the SDSS DR14, Astronomy & Astrophysics, 623, A40 (2019).
- 31. R. Maiolino, et al., AMAZE. I. The evolution of the mass-metallicity relation at , Astronomy and Astrophysics, 488, 463-479 (2008).
- 32. T. Jiang, S. Malhotra, J. E. Rhoads, H. Yang, Direct Metallicity Calibration of R23 in Strong Line Emitters, The Astrophysical Journal, 872, 145 (2019).
- 33. D. A. Berg, et al., Direct Oxygen Abundances for Low-luminosity LVL Galaxies, The Astrophysical Journal, 754, 98 (2012).
- 34. T. Hsyu, R. J. Cooke, J. X. Prochaska, M. Bolte, Searching for the Lowest-metallicity Galaxies in the Local Universe, The Astrophysical Journal, 863, 134 (2018).
- 35. Y.-H. Lin, et al., Low Metallicity Galaxies from the Dark Energy Survey, arXiv:2211.02094 (2022).
- 36. M. Li, et al., The Mass-Metallicity Relation of Dwarf Galaxies at the Cosmic Noon in the JWST Era, arXiv:2211.01382 (2022).
- 37. M. Tang, D. P. Stark, J. Chevallard, S. Charlot, MMT/MMIRS spectroscopy of extreme [O iii] emitters: implications for galaxies in the reionization era, Monthly Notices of the Royal Astronomical Society, 489, 2572-2594 (2019).
- 38. N. R. Eggen, C. Scarlata, E. Skillman, A. Jaskot, Blow-away in the Extreme Low-mass Starburst Galaxy Pox 186, The Astrophysical Journal, 912, 12 (2021).
- 39. S. R. Flury, et al., The Low-redshift Lyman Continuum Survey. I. New, Diverse Local Lyman Continuum Emitters, The Astrophysical Journal Supplement Series, 260, 1 (2022).
- 40. Y. I. Izotov, et al., J1154+2443: a low-redshift compact star-forming galaxy with a 46 per cent leakage of Lyman continuum photons, Monthy Notices of the Royal Astronomical Society, 474, 4514-4527 (2018).
- 41. J. Chisholm, et al., The far-ultraviolet continuum slope as a Lyman Continuum escape estimator at high redshift, Monthy Notices of the Royal Astronomical Society, 517, 5104-5120 (2022).
- 42. P. Troncoso, et al., Metallicity evolution, metallicity gradients, and gas fractions at , Astronomy & Astrophysics, 563, A58 (2014).
- 43. S. Juneau, et al., Active galactic nuclei emission line diagnostics and the mass-metallicity relation up to redshift : The impact of selection effects and evolution, The Astrophysical Journal, 788, 88 (2014).
- 44. R. J. Bouwens, et al., Sizes of Lensed Lower-luminosity Galaxies from the Hubble Frontier Field Program, The Astrophysical Journal, 927, 81 (2022).
- 45. A. Claeyssens, et al., Star formation at the smallest scales; A JWST study of the clump populations in SMACS0723, Monthly Notices of the Royal Astronomical Society, Monthly Notices of the Royal Astronomical Society (2023).
- 46. R. C. Livermore, et al., Resolved spectroscopy of gravitationally lensed galaxies: global dynamics and star-forming clumps on 100 pc scales at 1 ¡ z ¡ 4, Monthy Notices of the Royal Astronomical Society, 450, 1812-1835 (2015).
- 47. T. Shibuya, M. Ouchi, Y. Harikane, Morphologies of 190,000 Galaxies at Revealed with HST Legacy Data. I. Size Evolution, The Astrophysical Journal Supplement Series, 219, 15 (2015).
- 48. H. Williams, Photometry and Spectroscopy of a z=9.51 galaxy in the RXJ2129 cluster field (2023), doi:10.5281/zenodo.7767677.
- 49. H. Bushouse, et al., JWST Calibration Pipeline (2023), https://doi.org/10.5281/zenodo.7038885.
- 50. M. L. Boyer, et al., The JWST Resolved Stellar Populations Early Release Science Program. I. NIRCam Flux Calibration, Research Notes of the American Astronomical Society, 6, 191 (2022).
- 51. A. M. Koekemoer, et al., CANDELS: The Cosmic Assembly Near-infrared Deep Extragalactic Legacy Survey—The Hubble Space Telescope Observations, Imaging Data Products, and Mosaics, The Astrophysical Journal Supplement Series, 197, 36 (2011).
- 52. Gaia Collaboration, et al., The Gaia mission, Astronomy and Astrophysics, 595, A1 (2016).
- 53. P. Gavras, et al., Gaia Data Release 3: Cross-match of Gaia sources with variable objects from the literature, arXiv:2207.01946 (2022).
- 54. M. Postman, et al., The Cluster Lensing and Supernova Survey with Hubble: An Overview, The Astrophysical Journal Supplement Series, 199, 25 (2012).
- 55. M. Nonino, et al., Deep U band and R imaging of GOODS-South: Observations, data reduction, and first results, The Astrophysical Journal Supplement Series, 183, 244 (2009).
- 56. E. Bertin, et al., Astronomical Data Analysis Software and Systems XI, D. A. Bohlender, D. Durand, T. H. Handley, eds. (2002), vol. 281 of Astronomical Society of the Pacific Conference Series, p. 228.
- 57. E. Bertin, Astronomical Data Analysis Software and Systems XV, C. Gabriel, C. Arviset, D. Ponz, S. Enrique, eds. (2006), vol. 351 of Astronomical Society of the Pacific Conference Series, p. 112.
- 58. G. Brammer, Grizli: Grism redshift and line analysis software (2019), Astrophysics Source Code Library, record ascl:1905.001.
- 59. K. Horne, An optimal extraction algorithm for CCD spectroscopy., Publications of the Astronomical Society of the Pacific, 98, 609-617 (1986).
- 60. P. Sánchez-Blázquez, et al., Medium-resolution Isaac Newton Telescope library of empirical spectra, Monthy Notices of the Royal Astronomical Society, 371, 703-718 (2006).
- 61. J. Falcón-Barroso, et al., An updated MILES stellar library and stellar population models, Astronomy & Astrophysics, 532, A95 (2011).
- 62. P. Virtanen, et al., SciPy 1.0: Fundamental Algorithms for Scientific Computing in Python, Nature Methods, 17, 261–272 (2020).
- 63. P. J. Storey, C. J. Zeippen, Theoretical values for the [O iii] 5007/4959 line-intensity ratio and homologous cases, Monthly Notices of the Royal Astronomical Society, 312, 813-816 (2000).
- 64. G. Chabrier, Galactic Stellar and Substellar Initial Mass Function, Publications of the Astronomical Society of the Pacific, 115, 763–795 (2003).
- 65. C. Conroy, J. E. Gunn, M. White, The Propagation of Uncertainties in Stellar Population Synthesis Modeling. I. The Relevance of Uncertain Aspects of Stellar Evolution and the Initial Mass Function to the Derived Physical Properties of Galaxies, The Astrophysical Journal, 699, 486-506 (2009).
- 66. C. Conroy, J. E. Gunn, The Propagation of Uncertainties in Stellar Population Synthesis Modeling. III. Model Calibration, Comparison, and Evaluation, The Astrophysical Journal, 712, 833-857 (2010).
- 67. J. S. Speagle, DYNESTY: a dynamic nested sampling package for estimating Bayesian posteriors and evidences, Monthy Notices of the Royal Astronomical Society, 493, 3132-3158 (2020).
- 68. D. Langeroodi, et al., Evolution of the Mass-Metallicity Relation from Redshift to the Local Universe, arXiv:2212.02491 (2022).
- 69. P. Madau, Radiative Transfer in a Clumpy Universe: The Colors of High-Redshift Galaxies, The Astrophysical Journal, 441, 18 (1995).
- 70. M. Kriek, C. Conroy, The dust attenuation law in distant galaxies: Evidence for variation with spectral type, The Astrophysical Journal Letters, 775, L16 (2013).
- 71. M. Oguri, The Mass Distribution of SDSS J1004+4112 Revisited, Publications of the Astronomical Society of Japan, 62, 1017 (2010).
- 72. M. Oguri, Fast Calculation of Gravitational Lensing Properties of Elliptical Navarro-Frenk-White and Hernquist Density Profiles, Publications of the Astronomical Society of the Pacific, 133, 074504 (2021).
- 73. T. Okabe, et al., Shapes and alignments of dark matter haloes and their brightest cluster galaxies in 39 strong lensing clusters, Monthy Notices of the Royal Astronomical Society, 496, 2591-2604 (2020).
- 74. A. Zitrin, et al., Hubble Space Telescope Combined Strong and Weak Lensing Analysis of the CLASH Sample: Mass and Magnification Models and Systematic Uncertainties, The Astrophysical Journal, 801, 44 (2015).
- 75. J. Richard, et al., LoCuSS: first results from strong-lensing analysis of 20 massive galaxy clusters at , Monthy Notices of the Royal Astronomical Society, 404, 325-349 (2010).
- 76. G. B. Caminha, et al., Strong lensing models of eight CLASH clusters from extensive spectroscopy: Accurate total mass reconstructions in the cores, Astronomy & Astrophysics, 632, A36 (2019).
- 77. J. F. Navarro, C. S. Frenk, S. D. M. White, A Universal Density Profile from Hierarchical Clustering, The Astrophysical Journal, 490, 493-508 (1997).
- 78. A Catalog of Mass Models for Gravitational Lensing, C. R. Keeton (2001).
- 79. R. Kawamata, M. Oguri, M. Ishigaki, K. Shimasaku, M. Ouchi, Precise Strong Lensing Mass Modeling of Four Hubble Frontier Field Clusters and a Sample of Magnified High-redshift Galaxies, The Astrophysical Journal, 819, 114 (2016).
- 80. L. J. Furtak, et al., UNCOVERing the extended strong lensing structures of Abell 2744 with the deepest JWST imaging, arXiv:2212.04318 (2022).
- 81. K. E. Heintz, et al., A fundamental plane of galaxy assembly and chemical enrichment within the first 700 Myr after the Big Bang, arXiv:2212.02890 (2022).
- 82. R. L. Sanders, et al., The MOSDEF survey: direct-method metallicities and ISM conditions at , Monthly Notices of the Royal Astronomical Society, 491, 1427-1455 (2019).
- 83. R. L. Sanders, et al., The MOSDEF Survey: A Stellar Mass–SFR–Metallicity Relation Exists at , The Astrophysical Journal, 858, 99 (2018).
Acknowledgements: We thank Evan Skillman, Nathan Eggen, and Alexander Criswell for very helpful comments, and Sherry Suyu for her assistance in obtaining the follow-up data. We thank program coordinator Tricia Royle, and instrument scientists Armin Rest, Diane Karakala, and Patrick Ogle of STScI for their help carrying out the HST observations.
Funding: P.K. is supported by NSF grant AST-1908823 and STScI programs GO-15936, GO-16728 and GO-17253. M.O. acknowledges support by JSPS KAKENHI grants JP20H00181, JP20H05856, JP22H01260, and JP22K21349. T.T. acknowledges the support of NSF grant AST-1906976. R.J.F is supported in part by NSF grant AST–1815935, the Gordon & Betty Moore Foundation, and by a fellowship from the David and Lucile Packard Foundation. A.V.F. is grateful for financial assistance from the Christopher R. Redlich Fund. G.B. is funded by the Danish National Research Foundation (DNRF) under grant #140. AZ acknowledges support by Grant No. 2020750 from the United States-Israel Binational Science Foundation (BSF) and Grant No. 2109066 from the United States National Science Foundation (NSF), and by the Ministry of Science & Technology, Israel. J.H. and D.L. were supported by a VILLUM FONDEN Investigator grant (project number 16599). I.P.-F. and F.P. acknowledge support from the Spanish State Research Agency (AEI) under grant number PID2019-105552RB-C43.
Author contributions: H.W. drafted the manuscript. H.W., P.K., C.S., N.R., T.T., and A.V.F. revised the manuscript. W.C. reduced the spectroscopy and H.W. analysed the spectroscopy. C.S., Y.L., N.R., T.T., W.C., D.L., A.Z, L.Y., and T.B. contributed to the interpretation. T.T., W.C., A.V.F., R.J.F., J.H., A.M.K., L.S., J.P., T.B., S.J., G.B., S.S., I.P.F., F.P., and M.N. obtained JWST imaging. G.B. measured the photometry. M.O., A.Z., and J.M.D. modeled the gravitational lensing.
Competing interests: We declare no competing interests.
Data and materials availability: HST imaging and JWST imaging and spectroscopy are available at https://mast.stsci.edu/portal (JWST proposal ID: 02767, HST proposal ID: 12457). Our measured photometry is provided in Table S1 and line fluxes in Table 1. Reduced HST imaging, JWST imaging, and JWST spectroscopy is available at https://zenodo.org/record/7767677 (?). Subaru imaging is available at http://smoka.nao.ac.jp (Object ID: RXJ2129+0005).
Supplementary Materials
Materials and Methods
Tabs. S1–S3
Figs. S1–S13
References (49–83)
Supplementary Materials for
A magnified compact galaxy at redshift 9.51 with strong nebular emission lines
Hayley Williams*, Patrick L. Kelly, Wenlei Chen, Gabriel Brammer, Adi Zitrin, Tommaso Treu, Claudia Scarlata, Anton M. Koekemoer, Masamune Oguri, Yu-Heng Lin, Jose M. Diego, Mario Nonino, Jens Hjorth, Danial Langeroodi, Tom Broadhurst, Noah Rogers, Ismael Perez-Fournon, Ryan J. Foley, Saurabh Jha, Alexei V. Filippenko, Lou Strolger, Justin Pierel, Frederick Poidevin, and Lilan Yang.
*Corresponding author. Email: will5099@umn.edu
This PDF file includes:
-
Materials and Methods
-
Figs. S1-S13
-
Tabs. S1-S3
Materials and Methods
Data Reduction: The JWST NIRCam observations were processed beyond the standard default calibration provided by the Space Telescope Science Institute (STScI) to produce mosaics for measuring the sources for the NIRSpec spectroscopy, as follows. After downloading the individual exposures in all the filters from the Barbara A. Mikulski Archive for Space Telescopes (MAST) portal, they were processed using version 1.8.2 of the public STScI calwebb software (?) with the photometric calibration zero points specified in the context file “jwst_0995.pmap”. These zero points are similar to other measurements (?). We performed astrometric alignment between all the exposures in each filter, following previous described methods (?). The absolute astrometric alignment was tied to Gaia Data Release 3 (?, ?) via a catalog prepared from previous SuprimeCam -band imaging of the field taken for the Cluster Lensing and Supernova Survey with Hubble (CLASH) (?). We obtained the SuprimeCam images from the Subaru Mitaka Okayama Kiso Archive. The SuprimeCam imaging was obtained on 2010 November 5 and consists of 32 exposures, each 150 s long. After applying the serial overscan correction, we performed flat-fielding and bias corrections to each of the exposures. We then performed background subtraction, following a previously published method (?). We used the SWarp software (?) to create the final coadded -band image of the field and performed the final astrometric solution using the SCAMP software (?). The alignment between all the JWST exposures within each filter was achieved with a typical accuracy of –4 milliarcseconds per source, and with –500 sources per exposure this therefore achieves an overall astrometric alignment between exposures to a precision of 0.2–0.3 milliarcseconds. The final mosaics were produced at a pixel scale of 20 milliarcseconds per pixel for the F115W, F150W, and F200W images, and 40 milliarcseconds per pixel for the F277W, F356W, and F440W images.
We used the MAST portal to obtain archival HST ACS and WFC3 observations taken for CLASH. Observation dates range from 2012 April 3 to 2012 August 7 and total exposure times range from 1864 s in the F475W filter to 9530 s in the F850LP filter. The HST images were reduced using version 1.6.0 of the grizli software (?), which masks image artifacts and performs flat-fielding, background subtraction, and astrometric alignment on each exposure. The astrometric alignment is tied to Gaia Data Release 3. Reduced versions of the JWST and HST imaging are available online (?).
The NIRSpec prism data were reduced using version 1.8.5 of the public STSci calwebb software (?) and the reference files from the context file “jwst_1023.pmap”. We downloaded the Level 1 data from the JWST archive. Detector-level corrections had already been applied to these data. We processed the Level 1 data through the Spec2Pipeline, which performs the background subtraction, wavelength calibration, flat-field correction, and flux calibration. The Spec2Pipeline also performs aperture corrections, assuming a point source target at a given position within the microshutters. Given the compact angular size of image G2 of the galaxy in the image plane ( arcseconds), we did not apply any additional aperture corrections. We used the Spec3Pipeline to combine the exposures. To extract the one-dimensional (1D) spectrum, we used an optimal extraction algorithm based on a previously published method (?).
To improve the flux calibration, we rescale our 1D spectrum to match the NIRCam wideband photometry. We compute the ratio of the mean flux density of the spectrum in 5000 Å windows around the central wavelength of each NIRCam filter to the photometric flux density in that filter. We use the median raito of the six NIRCam filters as the final rescaling factor (). The original and rescaled version of the spectrum are shown with the NIRCam photometry in Figure S2. The wavelength-dependent flux calibration applied in the Spec2Pipeline has not been verified, but the rescaled spectrum is consistent with the photometry (within ) for the five photometric measurements above m. Our final calibrated 1D and 2D spectra are shown in Figure 2.
Imaging analysis: To constrain the photometric redshift of the galaxy, we use the eazy-py software (?). The package compares our photometric measurements to template spectra at different redshifts and uses a likelihood function to constrain each galaxy’s redshift. We obtained a photometric redshift of for image G2. By fitting a linear model to the logarithmic photometric flux measurements and wavelengths in the F150W, F200W, F277W, F356W and F444W filters (spanning a rest-frame wavelength range from 950 Å to 4750 Å), we estimate a UV spectral slope () of -1.98 0.11.
Emission Line Flux Measurements: To constrain the fluxes of the emission lines, we use the pPXF (Penalized Pixel-Fitting) software (?) with the Medium-resolution Isaac Newton Telescope library of empirical spectra (MILES) (?, ?). pPXF uses a maximum penalized likelihood method to model the stellar continuum and fits Gaussian profiles to each of the emission lines in a given wavelength range. Since the spectral resolution of the prism data varies substantially with wavelength, we limit each run of pPXF to Å windows (observer frame) around the visible emission lines. To refine our initial redshift estimate, we model the [O iii] and H emission lines, with the line centers as a free parameter. We find . We then model each of the emission lines, with the line centers fixed to the expected wavelength of the line at redshift and line widths fixed to the spectral resolution of NIRSpec at that wavelength. Blended emission lines, such as H and [O iii] 4363 Å, are modeled simultaneously and separately using two Gaussians.
The MILES stellar library has a lower wavelength limit of 3525 Å, so we do not use pPXF to model lines with rest-frame wavelengths below this limit (Ly and C iii] 1907 Å + [C iii] 1909 Å). Instead, we use the nonlinear least-squares fitting routine curve_fit from the scipy software (version 1.7.3) (?) to fit a Gaussian profile with fixed central wavelength and width to the emission lines below 3525 Å. Using the estimate of the continuum flux density around each emission line from pPXF, we also compute the rest frame EWs.
To obtain an estimate for the upper limit of the flux of Ly, we inject Gaussian profiles into the spectrum at positions adjacent to the expected central wavelength of Ly. We repeatedly increase the flux of the injected Gaussian profile until our modeling code reports a 3 detection of the injected profile. We repeat this analysis at 20 positions within a 4000 Å window around the expected central wavelength of Ly. The average minimum flux necessary to obtain a 3 detection is 39 erg s-1 cm-2, corresponding to a rest-frame EW of approximately 31 Å.
The observed ratio of the [O iii] 4959 to [O iii] 5007 emission line fluxes can be used to test the accuracy of the flux calibration in this region of the spectrum, because this ratio is set by atomic physics to be 2.98 (?). We find a flux ratio of ([O iii]4959)/([O iii]5007) , consistent with this theoretical value.
Assuming Case B recombination and negligible extinction due to dust, the theoretical ratios of the fluxes of the Balmer emission lines are (H)/(H) = 0.47 and (H)/(H) = 0.26 (?). Ratios that are smaller than these theoretical values indicate the presence of extinction due to dust, and larger ratios are unphysical. We measure larger ratios ((H)/(H) = and (H)/(H) = ), but both are within 1.5 of the expected values for zero extinction due to dust. We proceed with our analysis assuming mag, and apply no reddening correction to the flux measurements.
Emission Line Analysis: We incorporate the dust-correction uncertainty into the error analysis when calculating properties derived from intrinsic emission line fluxes and ratios. To do so, we draw 10000 random samples from normal distributions with means set to the measured fluxes of H and H and widths set to their 1 uncertainties. At each draw, we compute A from the flux ratio (H)/(H), setting A if the flux ratio is larger than the theoretical ratio for zero extinction (see above). We find an upper 3 uncertainty for of 1.38 mag.
To compute the SFR of the galaxy from the flux of the H emission line, we assume a previously published initial mass function (IMF) (?). The calibration we use to estimate the oxygen abundance is based on direct electron temperature () measurements of star forming galaxies covering O32 values up to 40 (?).
SED Modeling: We use the prospector software (?) to simultaneously model the NIRCam + HST photometry and the emission lines from NIRSpec. prospector uses the Flexible Stellar Population Synthesis package (FSPS; (?, ?)) to construct the stellar population models. We use dynesty (?), a dynamic nested sampling method, to explore the parameter space. Our prospector setup is similar to a previous study (?), the only difference is that we include the NIRSpec emission lines in the modeling. The redshift is held fixed to the spectroscopic value of . We adopt a non-parametric model for the SFH, consisting of five independent temporal bins: the most recent bin spans 0-10 Myr in lookback time, and the remaining four bins are evenly spaced in (lookback time) up to , which is the earliest onset of star formation allowed in the FSPS code. The scaling factor for the optical depth of the intergalactic medium (IGM) is a free parameter in the model, for which we use a redshift-dependent IGM attenuation model (?).
We assume an IMF (?) and a dust attenuation curve (?). The dust attenuation is modeled with three free parameters: the optical depth at 5500Å (), the dust index which controls the strength of the UV bump in the attenuation curve, and the dust ratio which determines the ratio of the optical depth affecting young stars compared to the optical depth affecting all stars. Additional free parameters in our model include the stellar metallicity (/) where is the solar metallicity, the nebular metallicity (/), and the nebular ionization parameter (). The model fits for the total formed stellar mass ((/)), which is the integral of the SFH and does not account for stellar mass loss during evolution due to supernovae and winds. The total formed stellar mass can be converted to the current stellar mass ((/)) at each step in the parameter space. The priors and allowed ranges for each of the free parameters in our model fitting are shown in Table S3.
The emission lines from our NIRSpec data are included in the prospector modeling. The line widths are fixed to the instrumental resolution of the NIRSpec prism at their observed wavelengths. We only include emission lines above 3.7 m, a limit set by the availability of sufficiently high resolution libraries of stellar spectra used by prospector and FSPS (MILES library (?) which spans the rest-frame 3525 to 7400 Å). This wavelength range includes all of the emission lines we measured with S/N (Table 1). To account for potential uncertainties in spectroscopic calibration, following (?), at each likelihood call we multiply the model spectrum by a maximum-likelihood 12th order polynomial that describes the ratio between the model and observed spectrum.
Figure S3 compares the best-fitting spectrum to the observed SED of image G2, along with the posterior probability distributions for a selection of free parameters. To test for systematic bias, we run prospector using the same parameters but with different combinations of the observed photometry and spectroscopy (full spectroscopy + photometry, emission lines + photometry, photometry only) and with differing lower wavelength limits for the included spectroscopy. The results are consistent for the majority of the parameters, but we add additional systematic uncertainties (in quadrature) of 0.2 dex in the stellar mass, 0.15 magnitudes in the extinction due to dust, and 0.3 M⊙ yr-1 in the SFR to reflect the range of best-fitting values.
Lens Modeling: We construct a mass model of the cluster RX J2129 using the glafic software (?, ?). A previous glafic mass model for this cluster has been derived (?), in which 22 multiple images of 7 background galaxies (?, ?, ?) were used as constraints. Spectroscopic redshifts of these 7 galaxies have also been measured (?). Our mass model consist of a single elliptical dark matter (?) halo component representing the cluster, with member galaxies modeled by an ellipsoid profile (?) with their velocity dispersions and truncation radii scaled with their luminosities (?). This mass model reproduces the counterimages of G2, given its location and spectroscopic redshift of . By searching for objects that are located near the predicted counterimage positions and have colors similar to those of G2, we identify the counterimage candidates G1 and G3. We then refine our mass model by adding the positions of G1, G2, and G3 as constraints. The resulting best-fitting mass model reproduces all the positions of multiple images including G1–G3, with the root-mean square of the positional differences between observed and predicted image positions of . To estimate the uncertainties, we run a Markov chain Monte Carlo (MCMC) process for the mass model, assuming the positional error of . We use this refined mass model to calculate the magnification of G1 to , that of G2 is , and that of G3 is .
We model the photometry of the identified counterimages using prospector. The fit parameters and their respective priors are identical to those used for image G2. There is no available spectroscopy for the counterimages, so we use only the observed HST and NIRCam photometry (corrected for magnification). Because the magnification of the counterimages is a factor of smaller than that of image G2, the photometry is less constraining and the best-fitting parameters from the modeling have higher uncertainties. For image G1, we infer (M∗/M⊙) = , and for image G3, we infer (M∗/M⊙) = . These values are larger than what we inferred for image G2 ((M∗/M⊙) = ), differing by 1.5.
To verify these results, we also use a second mass model constructed using an analytic version of the Zitrin-parametric code (?). This version is not coupled to a fixed grid resolution and thus capable of high resolution results (similar or better than the spatial resolution of the JWST images). We use the same set of constraints as above, including the counterimages identified by the glafic model. Galaxies are modeled as double pseudo isothermal elliptical density profiles, based on common scaling relations, and the dark matter halo as a pseudo isothermal elliptical mass distribution (?). The minimization is performed in the source plane using a several thousand step MCMC process. For the minimization and uncertainty estimation we use a positional uncertainty of for most multiple images, but adopt for the three images of the galaxy and the system in which a multiply-imaged supernova was seen. We infer magnifications and 95% confidence intervals of , , and for G1, G2, and G3, respectively, which are consistent with the glafic model within the 1 uncertainties.
Cosmology: Throughout this paper, we assume a flat lambda-cold dark matter cosmology with matter density parameter and Hubble parameter H km s-1 Megaparsec-1. All dates are reported in universal time.
| JWST NIRCam | ||
| Filter Name | Wavelength (Å) | Flux Density (10-20 erg s-1 cm-2 Å-1) |
| F115W | 11543 | 0.14 ± 0.22 |
| F150W | 15007 | 0.96 ± 0.08 |
| F200W | 19886 | 0.48 ± 0.06 |
| F277W | 27578 | 0.30 ± 0.03 |
| F356W | 35682 | 0.16 ± 0.01 |
| F440W | 44037 | 0.11 ± 0.01 |
| HST WFC3 | ||
| Filter Name | Wavelength (Å) | Flux Density (10-20 erg s-1 cm-2 Å-1) |
| F225W | 2370 | 31.81 ± 27.64 |
| F336W | 3354 | |
| F606W | 5892 | |
| F105W | 10544 | 0.36 ± 0.45 |
| F110W | 11534 | 0.46 ± 0.20 |
| F125W | 12471 | 0.66 ± 0.32 |
| F140W | 13924 | 0.93 ± 0.25 |
| F160W | 15397 | 1.17 ± 0.19 |
| HST ACS | ||
| Filter Name | Wavelength (Å) | Flux Density (10-20 erg s-1 cm-2 Å-1) |
| F435W | 4319 | 3.54 ± 21.48 |
| F475W | 4747 | 1.18 ± 6.15 |
| F606W | 5921 | |
| F625W | 6311 | |
| F775W | 7692 | |
| F814W | 8057 | 0.20 ± 0.54 |
| F850LP | 9033 | |
| Image | Right Ascension (hh:mm:ss) | Declination (dd:mm:ss) |
|---|---|---|
| RX J2129-z95:G1 | 21:29:40.858 | +00:05:37.096 |
| RX J2129-z95:G2 | 21:29:41.175 | +00:05:30.075 |
| RX J2129-z95:G3 | 21:29:41.381 | +00:05:20.166 |
| Parameter | Prior | Allowed Range | Best-Fitting Value |
|---|---|---|---|
| (M∗/M⊙) | Log Uniform | [6, 10] | 7.63 |
| Top Hat | [-2, 0.19] | -1.70 | |
| Top Hat | [-2, 0.5] | -1.04 | |
| Top Hat | [-4, -1] | -1.24 | |
| Normal | [0, 2] | 0.90 | |
| (mean = 1.0, width = 0.3) | |||
| Normal | [0, 4] | 0.24 | |
| (mean = 0.3, width = 1.0) | |||
| Normal | [-1, 0.4] | 0.19 | |
| (mean = 0.0, width = 0.5) | |||
| r | Normal | [0, 1.5] | 1.03 |
| (mean = 1.0, width = 0.3) |