\PHyear2022 \PHnumber220 \PHdate20 October
\ShortTitleCME in Xe–Xe collisions
\CollaborationALICE Collaboration \ShortAuthorALICE Collaboration
Charge-dependent two- and three-particle correlations measured in Xe–Xe collisions at TeV are presented. Results are obtained for charged particles in the pseudorapidity range and transverse momentum interval GeV/ for different collision centralities. The three-particle correlator , calculated for different combinations of charge sign and , is expected to be sensitive to the presence of the Chiral Magnetic Effect (CME). Its magnitude is similar to the one observed in Pb–Pb collisions in contrast to a smaller CME signal in Xe–Xe collisions than in Pb–Pb collisions predicted by Monte Carlo (MC) calculations including a magnetic field induced by the spectator protons. These observations point to a large non-CME contribution to the correlator. Furthermore, the charge dependence of can be described by a blast wave model calculation that incorporates background effects and by the Anomalous Viscous Fluid Dynamics model with values of the CME signal consistent with zero. The Xe–Xe and Pb–Pb results are combined with the expected CME signal dependence on the system size from the MC calculations including a magnetic field to obtain the fraction of CME contribution in , . The CME fraction is compatible with zero for the 30% most central events in both systems and then becomes positive; averaging over the 0–70% centrality interval yields an upper limit of 2% (3%) and 25% (32%) at 95% (99.7%) confidence level for the CME signal contribution to in Xe–Xe and Pb–Pb collisions, respectively.
1 Introduction
The theory of the strong interaction applied to many-body systems predicts that, at sufficiently high densities and temperatures, the protons and neutrons that compose ordinary matter melt into a plasma where quarks and gluons are no longer confined into hadrons. This hot and dense state of matter is called the quark–gluon plasma (QGP) [1]. The transition from normal hadronic matter to a QGP is supported by Quantum Chromodynamics (QCD) calculations on the lattice [2, 3, 4, 5], where it is found to occur at a critical temperature of about 155 MeV, and at a critical energy density of about 0.5 GeV/fm3 [6, 7, 8]. Collisions between heavy ions accelerated to ultrarelativistic energies can produce the necessary conditions for such a transition to take place [9, 10, 11].
Heavy-ion collisions may also allow us to access novel QCD phenomena associated with parity violation in strong interactions [12, 13, 14, 15, 16, 17, 18, 19, 20]. Theoretical expectations indicate that the interaction of quarks with gluonic fields describing transitions between topologically different QCD vacuum states changes the quark chirality and leads to a local chiral imbalance. In the presence of the strong magnetic field produced by the colliding ions [21, 22, 23], this leads to a charge separation (electric current) relative to the reaction plane, the plane defined by the impact parameter and the beam axis. This phenomenon is known as the Chiral Magnetic Effect (CME) [20].
The effects from local parity violation are quantified via the coefficient in a Fourier decomposition of the particle azimuthal distribution [24, 25]
| (1) |
where , is the azimuthal angle of the particle of charge (+, ), and is the reaction plane angle. The coefficients characterise the anisotropic flow, i.e., the azimuthal anisotropies in particle production relative to due to initial spatial asymmetries of the collision. The degree of overlap between the two colliding nuclei is estimated by the centrality, with low percentage values corresponding to head-on collisions. The first- and second-order flow coefficients ( and ) are called directed and elliptic flow, respectively. The CME is expected to have an experimentally accessible signal imprinted in the azimuthal correlations between two particles relative to the reaction plane [25] of the form , since changes sign from event to event and the average over many events is equal to zero. The charge-dependent difference of is commonly used to search for the CME. In practice, the reaction plane angle is estimated by constructing the second harmonic symmetry plane angle using azimuthal particle distributions [26], which is why is often referred to as a three-particle correlator. The correlator measures the difference between the correlations projected onto the reaction plane and perpendicular to it. The contributions from correlations in- and out-of-plane can also be evaluated by measuring the charge-dependent two-particle correlator .
The first experimental results in Au–Au collisions at a centre-of-mass energy per nucleon–nucleon collision GeV at the Relativistic Heavy-Ion Collider (RHIC) [27, 28] were compatible with initial expectations for the existence of the CME. The subsequent first measurements at the Large Hadron Collider (LHC) in Pb–Pb collisions at TeV [29] showed a surprising agreement with the results at lower energies, despite the differences in magnitude of the magnetic field [21, 22, 23]. Considering that the charged-particle density, , at the LHC is about three times larger than at RHIC [30, 31], any signal due to CME will be considerably diluted since it is expected to follow a scaling [19]. This effect will be referred to as dilution in the following. The similarity of the two measurements was indicative of the existence of background effects, coming mostly from “flowing clusters" – charge-dependent correlations modified by elliptic flow [25]. It was shown in Refs. [32, 33] that the local charge conservation coupled to the anisotropic expansion of the medium could explain most if not all the measurements.
To study background effects, the CMS Collaboration performed measurements of charge-dependent correlations in p–Pb collisions at TeV [34] and the STAR Collaboration in p–Au and d–Au collisions at TeV [35]. The results suggest that these correlations are similar to those measured in peripheral Pb–Pb and Au–Au collisions. These results might further indicate the dominance of background effects in peripheral collisions.
These measurements highlighted the need to identify ways of isolating the CME signal from the background. A first attempt was presented by the ALICE Collaboration in Ref. [36] using the Event Shape Engineering method [37]. This method utilises the fluctuations in the shape of the initial state of the system and allows one to select events with the same centrality but different initial geometry, thus varying the background contributions. The study sets an upper limit of 26–33% at 95% confidence level for the CME signal contribution to the charge dependence of in the 10–50% centrality interval. A similar study was performed by the CMS Collaboration [38] and the results agree with the measurements in Ref. [36]. A recent study by the ALICE Collaboration [39] found that charge-dependent correlations relative to the higher harmonic symmetry planes can be used as a proxy for the background, assuming that the correlations relative to and can be factorised. An upper limit of 15–18% at 95% confidence level for the CME signal has been reported for the 0–40 centrality interval, consistent with previous measurements.
Another approach to address the large backgrounds experimentally is to compare measurements performed in collision systems where the CME contribution is expected to vary significantly, while the background is similar. The STAR Collaboration has recently reported the results of the CME search in an analysis of the three-particle correlator measured in collisions of isobar Ru–Ru and Zr–Zr nuclei at GeV [40]. No anticipated CME signature (i.e., a larger magnitude of in Ru–Ru than in Zr–Zr collisions due to a larger magnetic field in the former) was observed in that analysis. However, a quantitative analysis taking into account the small geometrical differences between the isobar nuclei is needed for the interpretation of the measurements. One can also try to separate the CME signal and background by comparing the results from Pb–Pb and Xe–Xe collisions at the LHC since the differences in are typically within 10% in the 5–70% centrality interval [41] but the magnetic field is expected to be significantly larger in Pb–Pb collisions [42], leading to a similar increase in the CME contribution.
In this article, measurements of charge-dependent azimuthal correlations from Xe–Xe collisions at = 5.44 TeV are presented. The results are compared with earlier measurements in Pb–Pb collisions at TeV [39] and calculations from a blast wave parameterisation that incorporate background effects and from the Anomalous Viscous Fluid Dynamics (AVFD) model [43, 44, 45]. Furthermore, Monte Carlo (MC) simulations of the magnetic field induced by spectator protons with different initial conditions are used to evaluate the expected change in the CME signal between the Xe–Xe and Pb–Pb collisions. This change is then employed to estimate the fraction of the CME signal in both collision systems.
2 Analysis details
The data set used for these measurements was recorded with the ALICE detector during the 2017 Xe–Xe run at TeV. A detailed overview of the ALICE detector and its performance are available in Refs. [46, 47]. The Inner Tracking System (ITS) [48], the Time Projection Chamber (TPC) [49], the V0 [50], and the Zero Degree Calorimeter (ZDC) [51], the main subsystems used in this analysis, are briefly described in the following. The ITS and TPC cover the full azimuth within the pseudorapidity range . The ITS consists of six layers of silicon detectors and is employed for tracking, vertex reconstruction, and event selection. The TPC is used to reconstruct charged-particle tracks and to identify particles via specific energy loss, . The V0 detector, two arrays of 32 scintillator tiles covering (V0C) and (V0A), is used for triggering, event selection, and the determination of centrality [52] and symmetry plane . Both V0 detectors are segmented in four rings in the radial direction with each ring divided into eight sectors in the azimuthal direction. Two tungsten-quartz neutron ZDCs, installed 112.5 meters from the interaction point on each side, are also used for event selection.
The trigger conditions and the event selection criteria can be found in Ref. [53]. Beam-induced background and pileup events are removed using an offline event selection, employing information from the V0, ZDC, and tracking detectors. The primary vertex position is determined from tracks reconstructed in the ITS and TPC as described in Ref. [47]. Approximately Xe–Xe events in the 0–70% centrality interval, with a primary vertex position within cm from the nominal interaction point along the beam direction, are used in the analysis. The centrality of the collision is estimated from the energy deposition measured in the V0 detector [52].
The charged-particle tracks reconstructed using the ITS and TPC within and GeV/ are used to measure the charge-dependent correlations. Each track is required to have a minimum number of 70 space points (out of a maximum of 159) with a per TPC space point lower than 4, to cross at least 70 TPC readout rows, and to have the ratio between the number of crossed rows and the number of findable space points in the TPC larger than 0.8. The selected tracks are also required to have at least 2 ITS hits and a per ITS hit smaller than 36. In addition, tracks are selected with a distance of closest approach (DCA) to the reconstructed vertex position smaller than 3.2 cm and 2.4 cm in the longitudinal direction () and transverse plane (), respectively. These selection criteria reduce the contamination from secondary charged particles (i.e., particles originating from weak decays, conversions, and secondary hadronic interactions in the detector material) and fake tracks (random associations of space points) and ensure a track momentum resolution better than 4% in the considered interval [53]. The charged-particle track reconstruction efficiency is estimated from simulations with the HIJING event generator [54, 55] combined with the GEANT3 transport model [56]. These simulations include a detailed description of the detector response. The averaged charge-dependent correlations are corrected for track reconstruction efficiency.
The charge-dependent correlations are measured using two- and three-particle correlators expressed as
| (2) |
| (3) |
where , and and denote background contributions projected onto and perpendicular to it, respectively. The term is expected to have negligible charge dependence at midrapidity [57]. In addition, at midrapidity is zero for a symmetric collision. While suppresses background contributions at the level of (i.e., the relative difference between the particle production in-plane and out-of-plane), is dominated by short-range correlations unrelated to (“non-flow"), such as inter-jet correlations and resonance decays.
The orientation of the symmetry plane is estimated from the azimuthal distribution of the energy deposition measured by the V0A detector, with the and components given by
| (4) |
where the index runs over the 32 sectors of the V0A detector, is the azimuthal angle of sector defined by the geometric centre, and is the amplitude of the measured signal in that sector. The symmetry plane resolution is calculated from correlations between the symmetry planes determined with the TPC, the V0A, and the V0C detectors [26]. The effect of the decorrelation of between mid and forward pseudorapidity has been estimated to be less than 3% for [58]. Any non-uniform detector response is taken into account by adjusting the components of the vector using a recentering procedure (i.e., subtraction of the vector averaged over many events from the vector of each event) [59]. The non-flow contributions to the charge-dependent azimuthal correlations are greatly suppressed by the large pseudorapidity separation between the TPC and the V0A ().
The absolute systematic uncertainties were estimated from the variation of the results with different event and track-selection criteria. The event selection contributions were determined by varying the range of the reconstructed collision vertex position from the nominal interaction point along the beam direction, estimating centrality from the number of hits in the first or second layer of the ITS, and imposing stricter pileup rejection criteria than the default selection. Systematic uncertainties related to track selection criteria were evaluated by changing the ITS hit requirements, varying the minimum number of TPC space points, changing the minimum number of crossed TPC readout rows and the ratio between the number of crossed rows and the number of findable space points in the TPC, rejecting tracks close to the TPC sector boundaries to which the sensitive readout rows do not extend, and comparing any differences between results with only positive and only negative charges for pairs of particles with same charge. Finally, changes of the results due to uncertainties in the tracking efficiency arising from an imperfect description in the simulation of the relative abundances of different particle species and their different reconstruction efficiencies [60] were considered as part of the systematic uncertainties. The largest contribution to the systematic uncertainties for and is given by the centrality estimation and track-selection criteria, respectively. The systematic uncertainties are evaluated for each centrality interval. The different sources are assumed uncorrelated and are added in quadrature as an estimate of the total systematic uncertainties if their deviations from the nominal values are significant according to the Barlow criterion [61]. The resulting systematic uncertainties increase from central to peripheral collisions and are summarised in Table 1.
| Opposite charge | Same charge | |
|---|---|---|
3 Results
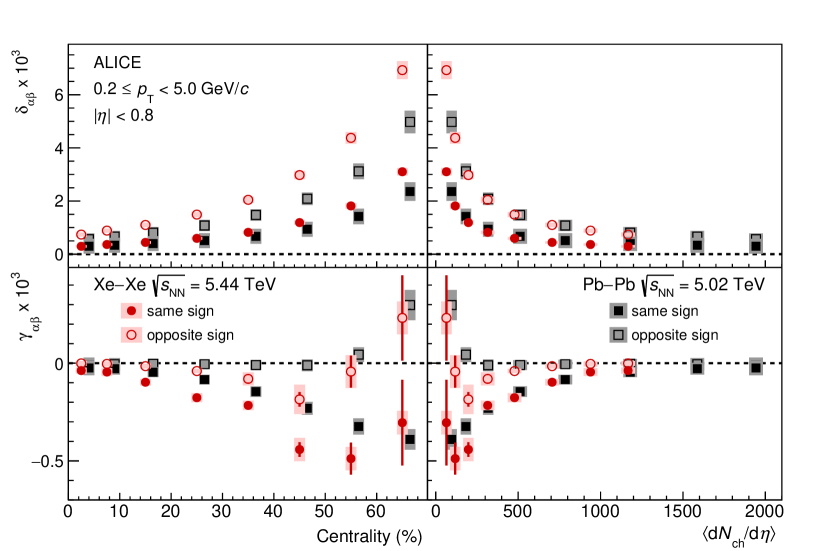
Figure 1 compares the and correlators for same- and opposite-charge pairs in Xe–Xe collisions at TeV to those measured in Pb–Pb collisions at TeV [39] as a function of centrality and average charged-particle multiplicity density at midrapidity [62, 63]. The results for same-charge pairs denote the average between pairs of particles with only positive and only negative charges since the two combinations are consistent within statistical uncertainties. Both correlators exhibit strong dependence on the charge-sign combination and qualitatively similar centrality dependence in the two systems. For , the magnitude of the same- and opposite-charge pair correlations is positive and increases from central to peripheral collisions. In contrast to the CME expectation, the correlation for the opposite-charge pairs is stronger than for the same-charge combinations, indicating that background dominates these measurements. For , the magnitude of opposite-charge pair correlations is close to zero within uncertainties for most of the centrality intervals, while it decreases from central to peripheral collisions becoming more negative for same-charge pairs. Thus, the correlation of opposite-charge pairs is weaker than for same-charge pairs. This ordering is compatible with a charge separation with respect to the reaction plane expected in the presence of the CME.
The for same-charge pairs shows small (if any) differences between Xe–Xe and Pb–Pb collisions within uncertainties, while the correlations for opposite-charge pairs have larger magnitude in Xe–Xe collisions in the 10–70% centrality interval. The for same- and opposite-charge pairs from Xe–Xe and Pb–Pb collisions have similar magnitudes within uncertainties in the 0–10% and 50–70% centrality ranges, while the correlations are stronger in Xe–Xe collisions in the 10–50% centrality interval. These observations can be attributed to the different number of particles produced in the collision within a given centrality interval between the two systems that dilutes the correlations. This is supported by the fact that the and for same- and opposite-charge pairs from Xe–Xe collisions are consistent within uncertainties with the corresponding Pb–-Pb results when reported as a function of .
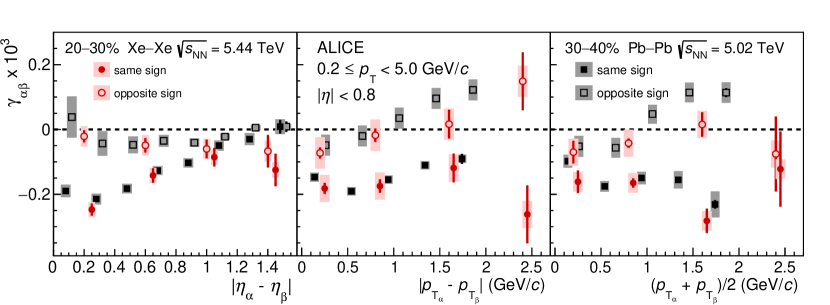
The correlator is also investigated as a function of the pseudorapidity difference , the transverse momentum difference , and the average transverse momentum of the pair. Figure 2 presents these results for same- and opposite-charge pairs in the 20–30% centrality interval compared to measurements performed in 30–40% Pb–Pb collisions [39]. Different Xe–Xe and Pb–Pb centrality intervals are selected since they have similar transverse densities ( fm-2 with being the transverse area) and transverse sizes ( fm) [41], thus the contribution from dilution effects is comparable. In addition, the value of ( is the second-order eccentricity coefficient and characterises the elliptic shape of the initial geometry) and the influence of radial flow are similar in the two systems for these centrality classes [41, 53]. The opposite-charge pair correlations from Xe–Xe collisions show a weak dependence on and , while they increase with increasing of the pair. The correlations for the same-charge pairs do not exhibit any significant dependence on and within uncertainties. These correlations show a strong dependence on with a width of approximately one unit in pseudorapidity difference. The Xe–Xe and Pb–Pb results are compatible within uncertainties demonstrating similar behaviour of this observable despite the differences in the magnetic field.
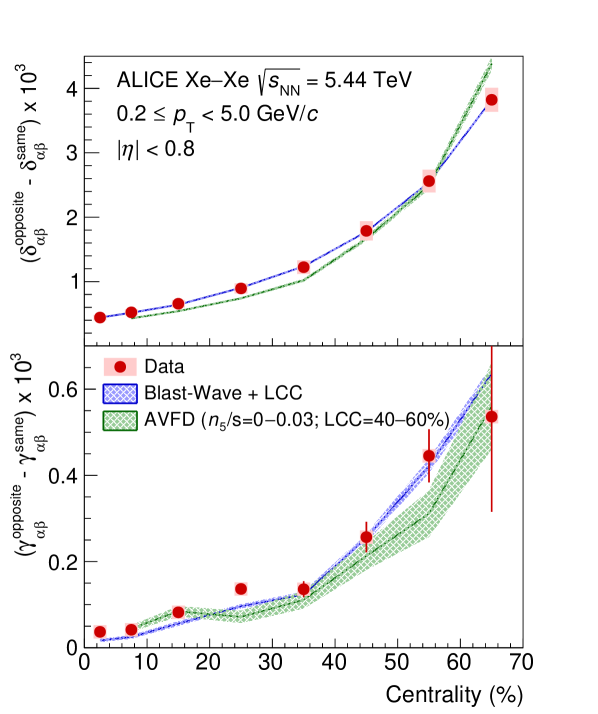
To get insight into the origin of the charge-dependent effects observed in Xe–Xe collisions, two different approaches were investigated. The first one relies on a blast wave (BW) model based on a parameterisation from Ref. [64]. Input parameters of the model are tuned to describe the spectra [65] and the -differential values [66] of charged pions and kaons, as well as of protons and antiprotons, measured in the same collision system and centre-of-mass energy. To account for the main source of background in the measurements reported in this article, the model was further extended by including effects from local charge conservation (LCC). This was done by generating sources uniformly at the surface of the ellipse that surrounds the centre of the system and allowing them to decay into particles with opposite charge. In this extension of the BW model, the number of sources that emit oppositely-charged pairs is tuned separately for each centrality interval to reproduce the centrality dependence of , the correlator that is mainly sensitive to background effects. This is illustrated in the upper panel of Fig. 3, where the BW curve is represented by the blue, solid line that goes through the experimental data points. The tuned model is then used to extract the expectation for the centrality dependence of , shown in the lower panel of Fig. 3. The width of the band reflects the uncertainty obtained by propagating the corresponding uncertainties of the model parameters using a sub-sampling method. It can be seen that the BW model describes fairly well the measured data points for all centrality intervals. This is in contrast to the picture that emerged in Pb–Pb collisions, where following a similar procedure the same model underestimated the measurements of by as much as 40 [39].
Additional insight can be obtained by comparing the results with calculations from the Anomalous Viscous Fluid Dynamics (AVFD) model [43, 44, 45]. It relies on a Glauber model description of the initial state of the collision and accounts for the development of the early-stage electromagnetic fields as well as for the propagation of anomalous fermion currents. The expanding medium is described using a 2+1 dimensional viscous hydrodynamics (VISH2+1) code [67] which is coupled to a hadron cascade model (UrQMD) [68, 69]. Within AVFD, the final-state CME signal induced by the initial chirality imbalance is controlled by the axial current density . At the same time, the relevant background in AVFD is governed by the amount of positive and negative charged partners emitted from the same fluid element relative to the total multiplicity of the event, i.e., the LCC percentage. The model was first calibrated to describe the centrality dependence of both the charged-particle density [63] and the elliptic flow [41]. As a second step, the dependence of and on both the CME signal and the background was determined, by analysing samples with either increasing values of or LCC percentage, respectively [42]. These results made it possible to extract the combination of and LCC percentage that describes the data and led to a quantitative simultaneous description of the centrality dependence of and [42]. This is illustrated in the two panels of Fig. 3. Also in this case, the width of the band reflects the uncertainty obtained by propagating the corresponding uncertainties of the model parameters using a sub-sampling method. The experimental data points can be described by large values of LCC contribution, between 40 and 60 for peripheral and more central Xe–Xe collisions, respectively. In addition, the values of extracted from this procedure did not exhibit any significant centrality dependence and were compatible with zero within uncertainties [42]. Similar to the conclusion extracted from the BW model, the study within the AVFD framework indicates that the experimental measurements in Xe–Xe collisions are dominated by background.
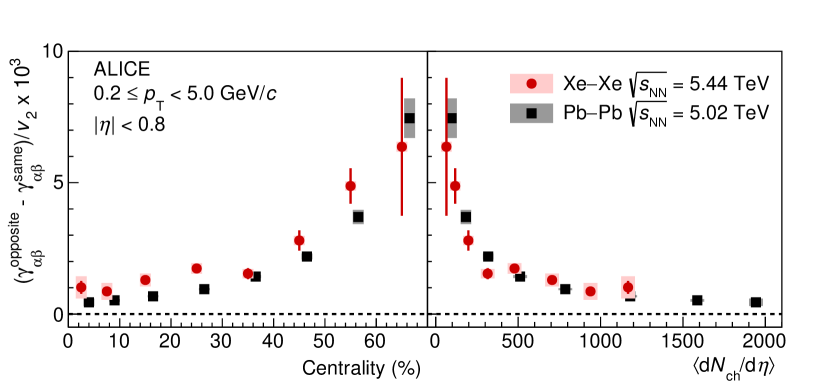
The charge separation effect can be further studied using the difference between opposite- and same-charge pair correlations and the CME signal expectations from MC calculations employed as guidance. A comparison between divided by [41] in Xe–Xe collisions and that measured in Pb–Pb collisions [39] is presented as a function of centrality and charged-particle density [62, 63] in Fig. 4. The value of is positive for all centralities and its magnitude increases from central to peripheral collisions. Furthermore, it is slightly higher in Xe–Xe than Pb–Pb collisions in the 10–60% centrality interval. However, the Xe–Xe and Pb–Pb data points fall approximately onto the same curve when reported as a function of .
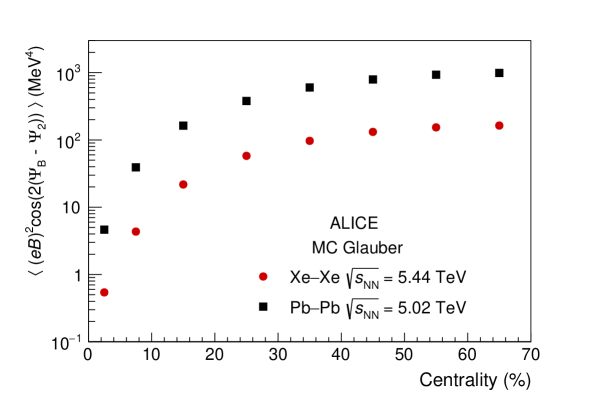
The expected centrality dependence of the CME signal in Xe–Xe and Pb–Pb collisions is estimated from MC Glauber [70] simulations including a magnetic field [36]. In these calculations, the 208Pb nucleus is spherical while the 129Xe nucleus is deformed with a deformation parameter [52]. The centrality classes are determined from the multiplicity of charged particles in the acceptance of the V0 detector, which is generated according to a negative binomial distribution with parameters taken from Ref. [71]. The magnetic field is calculated at the origin from the number of spectator protons using Eq. (A.6) from Ref. [19] with the proper time fm/. Figure 5 shows the centrality dependence of ( is the direction of the magnetic field ), which is the expected CME signal contribution in , for the two collision systems. The expected CME signal is stronger in Pb–Pb than Xe–Xe collisions in a given centrality interval due to the smaller magnetic field strength and a larger decorrelation between and in Xe–Xe collisions. Similar results are found using TRENTo [72] initial conditions. This observation coupled to the agreement of between the two collision systems (see Fig. 4) points to a large background contribution to in Xe–Xe collisions.
The large differences in the CME signal expectations and the small variations in (% for the 5–70% centrality interval) [41] between the two collision systems can be used to disentangle the potential CME signal from the background in Xe–Xe and Pb–Pb collisions. Assuming that both the CME signal and the background scale with , the charge dependence of for the two collision systems can be expressed using a two-component approach similar to the one proposed in Ref. [73]
| (5) | ||||
| (6) |
where , , and is taken from Ref. [41] and from Ref. [39]. The and parameters quantify the signal and background contributions, respectively, and do not depend on collision system as a result of the assumption that both scale with . While this scaling is expected for since it is dominated by flowing clusters [25], the domains responsible for are small and thus they can be considered as “usual" clusters which scale with . These parameters can be used to calculate the fractions of the CME signal (denoted as ) in Xe–Xe and Pb–Pb collisions as
| (7) |
The smaller CME signal in Xe–Xe collisions also results in a tighter limit on in Xe–Xe than in Pb–Pb collisions. It is worth noting that the CME fractions in the two collision systems are correlated because both are calculated with the same and parameters, extracted from the data using Eqs. 5 and 6.
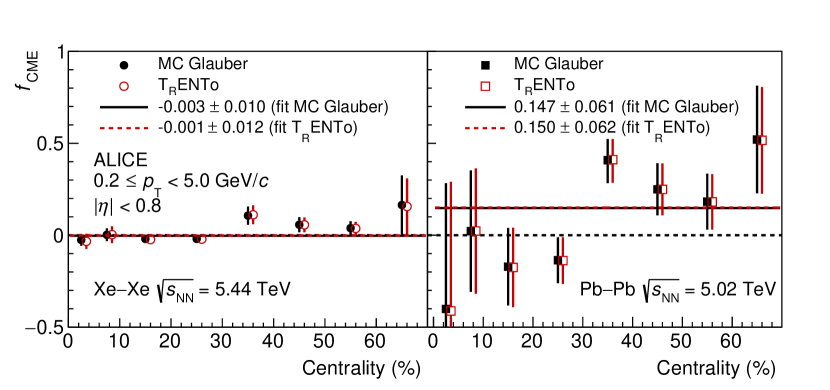
Figure 6 presents the centrality dependence of in Xe–Xe and Pb–Pb collisions for the two models used in this study. The uncertainties in the CME fractions are obtained adding in quadrature the statistical and systematic uncertainties in Eqs. 5 and 6. The does not depend significantly on the proper time used to calculate the magnetic field since varying the value from 0.1 fm/ to 0.01 fm/, 0.5 fm/, and 1 fm/ yields similar CME fractions. The is compatible with zero up to 30% centrality in both systems and then becomes positive for midcentral and peripheral collisions with larger values in Pb–Pb than in Xe–Xe. The CME fraction for the 0–30% centrality interval in Pb–Pb collisions agrees with the one reported in Ref. [39]. Fitting the data points in the centrality range 0–70% with a constant function neglecting any centrality dependence gives () and () for MC Glauber (TRENTo) initial conditions in Xe–Xe and Pb–Pb collisions, respectively. These results are consistent with zero CME fraction in Xe–Xe collisions and correspond to upper limits on of 2% (3%) and 25% (32%) at 95% (99.7%) confidence level for the 0–70% centrality interval in Xe–Xe and Pb–Pb collisions, respectively. The limits are estimated assuming Gaussian uncertainties.
4 Summary
The charge-dependent two- and three-particle correlators and have been measured in Xe–Xe collisions at TeV. The charge dependence of these correlators is strongly correlated with centrality, increasing from central to peripheral collisions, and is qualitatively similar to those reported in Pb–Pb collisions. The difference between the Xe–Xe and Pb–Pb results mostly arises from dilution effects since the data points from both collision systems fall approximately onto the same curve when presented as a function of charged-particle density. Monte Carlo simulations with different initial state models predict a significantly larger magnitude of the CME signal in Pb–Pb than Xe–Xe collisions, which implies that the dominant contribution to in Xe–Xe collisions is due to background effects. The magnitude of the charge dependence of is described over the entire centrality range by a blast wave parameterisation that incorporates local charge conservation tuned to reproduce the components of the background. This magnitude is also reproduced by Anomalous Viscous Fluid Dynamics calculations with large contributions from local charge conservation effects and values of the CME signal close to zero, thus indicating that the background is the dominant contribution to the three-particle correlator. In order to get a quantitative estimate of the signal and background contributions, the measured values of in Xe–Xe and Pb–Pb collisions are compared using a two-component approach. This procedure allows one to estimate the fraction of the CME signal in both collision systems. Averaging over the 0–70% centrality interval, an upper limit of 2% (3%) and 25% (32%) is estimated at 95% (99.7%) confidence level for the CME contribution to the charge dependence of in Xe–Xe and Pb–Pb collisions, respectively.
References
- [1] F. Karsch and E. Laermann, “Thermodynamics and in medium hadron properties from lattice QCD”, World Scientific (2004) 1–59, arXiv:hep-lat/0305025.
- [2] F. Karsch, E. Laermann, and A. Peikert, “Quark mass and flavor dependence of the QCD phase transition”, Nucl. Phys. B 605 (2001) 579–599, arXiv:hep-lat/0012023.
- [3] F. Karsch, E. Laermann, and A. Peikert, “The Pressure in two flavor, (2+1)-flavor and three flavor QCD”, Phys. Lett. B 478 (2000) 447–455, arXiv:hep-lat/0002003.
- [4] F. Karsch, “Lattice results on QCD thermodynamics”, Nucl. Phys. A 698 (2002) 199–208, arXiv:hep-ph/0103314.
- [5] C. R. Allton et al., “The QCD thermal phase transition in the presence of a small chemical potential”, Phys. Rev. D 66 (2002) 074507, arXiv:hep-lat/0204010.
- [6] A. Bazavov et al., “Equation of state and QCD transition at finite temperature”, Phys. Rev. D 80 (2009) 014504, arXiv:0903.4379 [hep-lat].
- [7] A. Bazavov et al., “The chiral and deconfinement aspects of the QCD transition”, Phys. Rev. D 85 (2012) 054503, arXiv:1111.1710 [hep-lat].
- [8] S. Borsanyi et al., “The QCD equation of state with dynamical quarks”, JHEP 11 (2010) 077, arXiv:1007.2580 [hep-lat].
- [9] CMS Collaboration, S. Chatrchyan et al., “Measurement of the pseudorapidity and centrality dependence of the transverse energy density in PbPb collisions at TeV”, Phys. Rev. Lett. 109 (2012) 152303, arXiv:1205.2488 [nucl-ex].
- [10] ALICE Collaboration, J. Adam et al., “Direct photon production in Pb–Pb collisions at TeV”, Phys. Lett. B 754 (2016) 235–248, arXiv:1509.07324 [nucl-ex].
- [11] ALICE Collaboration, J. Adam et al., “Measurement of transverse energy at midrapidity in Pb–Pb collisions at TeV”, Phys. Rev. C 94 no. 3, (2016) 034903, arXiv:1603.04775 [nucl-ex].
- [12] T. Lee, “A Theory of Spontaneous T Violation”, Phys. Rev. D 8 (1973) 1226–1239.
- [13] T. Lee and G. Wick, “Vacuum Stability and Vacuum Excitation in a Spin 0 Field Theory”, Phys. Rev. D 9 (1974) 2291–2316.
- [14] P. Morley and I. Schmidt, “Strong P, CP, T Violations in Heavy Ion Collisions”, Z. Phys. C 26 (1985) 627.
- [15] D. Kharzeev, R. Pisarski, and M. H. Tytgat, “Possibility of spontaneous parity violation in hot QCD”, Phys. Rev. Lett. 81 (1998) 512–515, arXiv:hep-ph/9804221.
- [16] D. Kharzeev and R. D. Pisarski, “Pionic measures of parity and CP violation in high-energy nuclear collisions”, Phys. Rev. D 61 (2000) 111901, arXiv:hep-ph/9906401.
- [17] D. E. Kharzeev, “Topology, magnetic field, and strongly interacting matter”, Ann. Rev. Nucl. Part. Sci. 65 (2015) 193–214, arXiv:1501.01336 [hep-ph].
- [18] D. Kharzeev and A. Zhitnitsky, “Charge separation induced by P-odd bubbles in QCD matter”, Nucl. Phys. A 797 (2007) 67–79, arXiv:0706.1026 [hep-ph].
- [19] D. E. Kharzeev, L. D. McLerran, and H. J. Warringa, “The Effects of topological charge change in heavy ion collisions: ’Event by event P and CP violation”’, Nucl. Phys. A 803 (2008) 227–253, arXiv:0711.0950 [hep-ph].
- [20] K. Fukushima, D. E. Kharzeev, and H. J. Warringa, “The Chiral Magnetic Effect”, Phys. Rev. D 78 (2008) 074033, arXiv:0808.3382 [hep-ph].
- [21] V. Skokov, A. Illarionov, and V. Toneev, “Estimate of the magnetic field strength in heavy-ion collisions”, Int. J. Mod. Phys. A 24 (2009) 5925–5932, arXiv:0907.1396 [nucl-th].
- [22] A. Bzdak and V. Skokov, “Event-by-event fluctuations of magnetic and electric fields in heavy ion collisions”, Phys. Lett. B 710 (2012) 171–174, arXiv:1111.1949 [hep-ph].
- [23] W.-T. Deng and X.-G. Huang, “Event-by-event generation of electromagnetic fields in heavy-ion collisions”, Phys. Rev. C 85 (2012) 044907, arXiv:1201.5108 [nucl-th].
- [24] S. Voloshin and Y. Zhang, “Flow study in relativistic nuclear collisions by Fourier expansion of Azimuthal particle distributions”, Z. Phys. C70 (1996) 665–672, arXiv:hep-ph/9407282.
- [25] S. A. Voloshin, “Parity violation in hot QCD: How to detect it”, Phys. Rev. C70 (2004) 057901, arXiv:hep-ph/0406311.
- [26] A. M. Poskanzer and S. A. Voloshin, “Methods for analyzing anisotropic flow in relativistic nuclear collisions”, Phys. Rev. C58 (1998) 1671–1678, arXiv:nucl-ex/9805001.
- [27] STAR Collaboration, B. I. Abelev et al., “Azimuthal Charged-Particle Correlations and Possible Local Strong Parity Violation”, Phys. Rev. Lett. 103 (2009) 251601, arXiv:0909.1739 [nucl-ex].
- [28] STAR Collaboration, B. I. Abelev et al., “Observation of charge-dependent azimuthal correlations and possible local strong parity violation in heavy ion collisions”, Phys. Rev. C 81 (2010) 054908, arXiv:0909.1717 [nucl-ex].
- [29] ALICE Collaboration, B. Abelev et al., “Charge separation relative to the reaction plane in Pb–Pb collisions at TeV”, Phys. Rev. Lett. 110 no. 1, (2013) 012301, arXiv:1207.0900 [nucl-ex].
- [30] ALICE Collaboration, K. Aamodt et al., “Charged-particle multiplicity density at mid-rapidity in central Pb–Pb collisions at TeV”, Phys. Rev. Lett. 105 (2010) 252301, arXiv:1011.3916 [nucl-ex].
- [31] ALICE Collaboration, K. Aamodt et al., “Centrality dependence of the charged-particle multiplicity density at mid-rapidity in Pb–Pb collisions at TeV”, Phys. Rev. Lett. 106 (2011) 032301, arXiv:1012.1657 [nucl-ex].
- [32] S. Schlichting and S. Pratt, “Charge conservation at energies available at the BNL Relativistic Heavy Ion Collider and contributions to local parity violation observables”, Phys. Rev. C 83 (2011) 014913, arXiv:1009.4283 [nucl-th].
- [33] S. Pratt, S. Schlichting, and S. Gavin, “Effects of Momentum Conservation and Flow on Angular Correlations at RHIC”, Phys. Rev. C 84 (2011) 024909, arXiv:1011.6053 [nucl-th].
- [34] CMS Collaboration, V. Khachatryan et al., “Observation of charge-dependent azimuthal correlations in -Pb collisions and its implication for the search for the chiral magnetic effect”, Phys. Rev. Lett. 118 no. 12, (2017) 122301, arXiv:1610.00263 [nucl-ex].
- [35] STAR Collaboration, J. Adam et al., “Charge-dependent pair correlations relative to a third particle in + Au and + Au collisions at RHIC”, Phys. Lett. B 798 (2019) 134975, arXiv:1906.03373 [nucl-ex].
- [36] ALICE Collaboration, S. Acharya et al., “Constraining the magnitude of the Chiral Magnetic Effect with Event Shape Engineering in Pb–Pb collisions at = 2.76 TeV”, Phys. Lett. B777 (2018) 151–162, arXiv:1709.04723 [nucl-ex].
- [37] J. Schukraft, A. Timmins, and S. A. Voloshin, “Ultra-relativistic nuclear collisions: event shape engineering”, Phys. Lett. B719 (2013) 394–398, arXiv:1208.4563 [nucl-ex].
- [38] CMS Collaboration, A. M. Sirunyan et al., “Constraints on the chiral magnetic effect using charge-dependent azimuthal correlations in and PbPb collisions at the CERN Large Hadron Collider”, Phys. Rev. C 97 no. 4, (2018) 044912, arXiv:1708.01602 [nucl-ex].
- [39] ALICE Collaboration, S. Acharya et al., “Constraining the Chiral Magnetic Effect with charge-dependent azimuthal correlations in Pb–Pb collisions at = 2.76 and 5.02 TeV”, JHEP 09 (2020) 160, arXiv:2005.14640 [nucl-ex].
- [40] STAR Collaboration, M. Abdallah et al., “Search for the chiral magnetic effect with isobar collisions at =200 GeV by the STAR Collaboration at the BNL Relativistic Heavy Ion Collider”, Phys. Rev. C 105 no. 1, (2022) 014901, arXiv:2109.00131 [nucl-ex].
- [41] ALICE Collaboration, S. Acharya et al., “Anisotropic flow in Xe–Xe collisions at TeV”, Phys. Lett. B 784 (2018) 82–95, arXiv:1805.01832 [nucl-ex].
- [42] P. Christakoglou, S. Qiu, and J. Staa, “Systematic study of the chiral magnetic effect with the AVFD model at LHC energies”, Eur. Phys. J. C 81 no. 8, (2021) 717, arXiv:2106.03537 [nucl-th].
- [43] S. Shi, Y. Jiang, E. Lilleskov, and J. Liao, “Anomalous Chiral Transport in Heavy Ion Collisions from Anomalous-Viscous Fluid Dynamics”, Annals Phys. 394 (2018) 50–72, arXiv:1711.02496 [nucl-th].
- [44] Y. Jiang, S. Shi, Y. Yin, and J. Liao, “Quantifying the chiral magnetic effect from anomalous-viscous fluid dynamics”, Chin. Phys. C 42 no. 1, (2018) 011001, arXiv:1611.04586 [nucl-th].
- [45] S. Shi, H. Zhang, D. Hou, and J. Liao, “Signatures of Chiral Magnetic Effect in the Collisions of Isobars”, Phys. Rev. Lett. 125 (2020) 242301, arXiv:1910.14010 [nucl-th].
- [46] ALICE Collaboration, K. Aamodt et al., “The ALICE experiment at the CERN LHC”, JINST 3 (2008) S08002.
- [47] ALICE Collaboration, B. B. Abelev et al., “Performance of the ALICE Experiment at the CERN LHC”, Int. J. Mod. Phys. A 29 (2014) 1430044, arXiv:1402.4476 [nucl-ex].
- [48] ALICE Collaboration, K. Aamodt et al., “Alignment of the ALICE Inner Tracking System with cosmic-ray tracks”, JINST 5 (2010) P03003, arXiv:1001.0502 [physics.ins-det].
- [49] J. Alme et al., “The ALICE TPC, a large 3-dimensional tracking device with fast readout for ultra-high multiplicity events”, Nucl. Instrum. Meth. A 622 (2010) 316–367, arXiv:1001.1950 [physics.ins-det].
- [50] ALICE Collaboration, E. Abbas et al., “Performance of the ALICE VZERO system”, JINST 8 (2013) P10016, arXiv:1306.3130 [nucl-ex].
- [51] R. Arnaldi et al., “The zero degree calorimeters for the ALICE experiment”, Nucl. Instrum. Meth. A 581 (2007) 397–401. [Erratum: Nucl.Instrum.Meth.A 604, 765 (2009)].
- [52] ALICE Collaboration, S. Acharya et al., “Centrality determination using the Glauber model in Xe–Xe collisions at TeV”, ALICE-PUBLIC-2018-003 (2018) 1–23. {http://cds.cern.ch/record/2315401}.
- [53] ALICE Collaboration, S. Acharya et al., “Transverse momentum spectra and nuclear modification factors of charged particles in Xe–Xe collisions at = 5.44 TeV”, Phys. Lett. B 788 (2019) 166–179, arXiv:1805.04399 [nucl-ex].
- [54] X.-N. Wang and M. Gyulassy, “HIJING: A Monte Carlo model for multiple jet production in pp, pA and AA collisions”, Phys. Rev. D44 (1991) 3501–3516.
- [55] M. Gyulassy and X.-N. Wang, “HIJING 1.0: A Monte Carlo program for parton and particle production in high-energy hadronic and nuclear collisions”, Comput. Phys. Commun. 83 (1994) 307, arXiv:nucl-th/9502021.
- [56] R. Brun et al., “GEANT Detector Description and Simulation Tool”, CERN-W5013 1 (1994) 1. https://cds.cern.ch/record/1082634.
- [57] U. Gürsoy, D. Kharzeev, E. Marcus, K. Rajagopal, and C. Shen, “Charge-dependent Flow Induced by Magnetic and Electric Fields in Heavy Ion Collisions”, Phys. Rev. C 98 no. 5, (2018) 055201, arXiv:1806.05288 [hep-ph].
- [58] ATLAS Collaboration, G. Aad et al., “Longitudinal Flow Decorrelations in Xe+Xe Collisions at TeV with the ATLAS Detector”, Phys. Rev. Lett. 126 no. 12, (2021) 122301, arXiv:2001.04201 [nucl-ex].
- [59] I. Selyuzhenkov and S. Voloshin, “Effects of non-uniform acceptance in anisotropic flow measurement”, Phys. Rev. C 77 (2008) 034904, arXiv:0707.4672 [nucl-th].
- [60] ALICE Collaboration, S. Acharya et al., “Transverse momentum spectra and nuclear modification factors of charged particles in pp, p–Pb and Pb–Pb collisions at the LHC”, JHEP 11 (2018) 013, arXiv:1802.09145 [nucl-ex].
- [61] R. Barlow, “Systematic errors: Facts and fictions”, in Conference on Advanced Statistical Techniques in Particle Physics, pp. 134–144. 7, 2002. arXiv:hep-ex/0207026.
- [62] ALICE Collaboration, J. Adam et al., “Centrality dependence of the charged-particle multiplicity density at midrapidity in Pb–Pb collisions at = 5.02 TeV”, Phys. Rev. Lett. 116 no. 22, (2016) 222302, arXiv:1512.06104 [nucl-ex].
- [63] ALICE Collaboration, S. Acharya et al., “Centrality and pseudorapidity dependence of the charged-particle multiplicity density in Xe–Xe collisions at = 5.44 TeV”, Phys. Lett. B 790 (2019) 35–48, arXiv:1805.04432 [nucl-ex].
- [64] F. Retiere and M. A. Lisa, “Observable implications of geometrical and dynamical aspects of freeze out in heavy ion collisions”, Phys. Rev. C70 (2004) 044907, arXiv:nucl-th/0312024.
- [65] ALICE Collaboration, S. Acharya et al., “Production of pions, kaons, (anti-)protons and mesons in Xe–Xe collisions at TeV”, arXiv:2101.03100 [nucl-ex].
- [66] ALICE Collaboration, S. Acharya et al., “Anisotropic flow of identified hadrons in Xe–Xe collisions at = 5.44 TeV”, JHEP 10 (2021) 152, arXiv:2107.10592 [nucl-ex].
- [67] H. Song and U. W. Heinz, “Suppression of elliptic flow in a minimally viscous quark-gluon plasma”, Phys. Lett. B 658 (2008) 279–283, arXiv:0709.0742 [nucl-th].
- [68] S. A. Bass et al., “Microscopic models for ultrarelativistic heavy ion collisions”, Prog. Part. Nucl. Phys. 41 (1998) 255–369, arXiv:nucl-th/9803035.
- [69] M. Bleicher et al., “Relativistic hadron–hadron collisions in the ultrarelativistic quantum molecular dynamics model”, J. Phys. G 25 (1999) 1859–1896, arXiv:hep-ph/9909407.
- [70] M. L. Miller, K. Reygers, S. J. Sanders, and P. Steinberg, “Glauber modeling in high energy nuclear collisions”, Ann. Rev. Nucl. Part. Sci. 57 (2007) 205–243, arXiv:nucl-ex/0701025.
- [71] ALICE Collaboration, S. Acharya et al., “Centrality determination in heavy ion collisions”, ALICE-PUBLIC-2018-011 (2018) 1–28. {https://cds.cern.ch/record/2636623}.
- [72] J. S. Moreland, J. E. Bernhard, and S. A. Bass, “Alternative ansatz to wounded nucleon and binary collision scaling in high-energy nuclear collisions”, Phys.Rev. C92 no. 1, (2015) 011901, arXiv:1412.4708 [nucl-th].
- [73] W.-T. Deng, X.-G. Huang, G.-L. Ma, and G. Wang, “Test the chiral magnetic effect with isobaric collisions”, Phys. Rev. C 94 (2016) 041901, arXiv:1607.04697 [nucl-th].