2Millennium Institute of Astrophysics (MAS), Nuncio Monseñor Sótero Sanz 100, Providencia, Santiago, Chile
3 Núcleo de Astronomía de la Facultad de Ingeniería, Universidad Diego Portales, Av. Ejército Libertador 441, Santiago, Chile
4 Kavli Institute for Astronomy and Astrophysics, Peking University, Beijing 100871, China
5 George Mason University, Department of Physics & Astronomy, MS 3F3, 4400 University Drive, Fairfax, VA 22030, USA
6 Eureka Scientific, 2452 Delmer Street Suite 100, Oakland, CA 94602-3017, USA
7 Instituto de Radioastronomía and Astrofísica (IRyA-UNAM), 3-72 (Xangari), 8701, Morelia, Mexico
8 Yale Center for Astronomy & Astrophysics, 52 Hillhouse Avenue, New Haven, CT 06511, USA
9 Department of Physics, Yale University, P.O. Box 208120, New Haven, CT 06520, USA
10 Cahill Center for Astronomy and Astrophysics, California Institute of Technology, Pasadena, CA 91125, USA
11 OAS-INAF, Via P. Gobetti 101, 40129 Bologna, Italy
11email: yaherlyn.diaz@postgrado.uv.cl
Constraining the X-ray reflection in low accretion rate AGN using XMM-Newton, NuSTAR and Swift
Abstract
Context. An interesting feature in active galactic nuclei (AGN) accreting at low rate is the weakness of the reflection features in their X-ray spectra, which can result from the gradual disappearance of the torus with decreasing accretion rates. It has been suggested that low luminosity AGN (LLAGN) would have a different reflector configuration compared with high luminosity AGN, either covering a smaller fraction of the sky or simply having less material. Additionally, we note that the determination of the spectral index () and the cut-off energy of the primary power-law emission is affected by the inclusion of reflection models, showing the importance of using them to study the accretion mechanism, especially in the case of the LLAGN that have previously shown a high dispersion on the relation between and the accretion rate.
Aims. Our purpose is to constrain the geometry and column density of the reflector in a sample of LLAGN covering a broad X-ray range of energy combining data from XMM-Newton+ NuSTAR + Swift. The spectral analysis also allows us to investigate the accretion mechanism in LLAGN.
Methods. We use XMM-Newton+ NuSTAR + Swift observations of a hard X-ray-flux limited sample of 17 LLAGN from BASS/DR2 with accretion rates =LBol/LEdd¡10-3. We fit all spectra using the reflection model for torus (BORUS) and accretion disk (XILLVER) reflectors.
Results. We found a tentative correlation between the torus column density and the accretion rate, LLAGN shows a lower column density compared with the high-luminosity objects. We also confirm the relation between and , with a smaller scatter than previously reported, thanks to the inclusion of high-energy data and the reflection models. Our results are consistent with a break at , suggestive of a different accretion mechanism compared with higher accretion AGN.
Key Words.:
Galaxies: active – Galaxies: nuclei – X-rays: galaxies – Accretion, accretion disks1 Introduction
Active galactic nuclei (AGN) emit over the entire electromagnetic spectrum and are powered by accretion onto a supermassive black hole (Rees 1984). The central engine emits UV photons which interact with energetic electrons in the so-called corona (Nandra & Pounds 1994) producing the X-ray emission (e.g., Haardt & Maraschi 1993). This emission interacts with the circumnuclear dust and gas, producing the obscuration observed in the spectra. The dust emission can be observed in the infrared energy range, as a result of the thermalization of the UV photons by the dust. In the optical, the nuclear emission will be obscured, removing the continuum and the broad components in the emission lines (Osterbrock 1981). On the other hand, the gas will absorb and scatter the X-ray continuum producing the X-ray absorption, most noticeable at energies below 10 keV in the X-ray spectrum (Brightman & Nandra 2011). Note that in general, the absorption in the optical and in the X-rays occurs together (Mainieri et al. 2007; Malizia et al. 2012; Merloni et al. 2014; Davies et al. 2015; Koss et al. 2017).
Obscuration gives evidence of material in the line of sight, which could be associated with the torus. Gas that is not in the line of sight of the observer can also imprint some features on the X-ray spectrum. Between 10 keV and up to hundreds of keV there is a reflection hump created by X-rays being reflected at the accretion disk (Fabian 2006) or more distant material, like the torus (Brightman & Nandra 2011). Furthermore, the most robust emission line seen in the X-rays, the Fe K emission line (e.g., Fabian 2006), can be related to circumnuclear material, being broad and exhibiting relativistic effects due to its creation close to the supermassive black hole (SMBH), and narrow, presumably originating from more distant material. These reflection features are therefore a useful tool to study the configuration of the accretion disk and the torus. To better understand the properties of the reflector, many models have been developed, like BORUS (Baloković et al. 2018) where the reprocessing medium is assumed to be a sphere with a conical cut-off at both poles, approximating a torus with variable covering factor, cTORUS (Liu & Li 2014), similar to BORUS but clumpy and with the half-opening angle of the torus fixed at 60 degrees, MYTORUS (Murphy & Yaqoob 2009) that proposes a toroidal geometry where the covering fraction is fixed to 0.5, RXTorus (Paltani & Ricci 2017) a model that assumes absorption and reflection from a torus with a varying ratio of the minor to major axis or XILLVER (García et al. 2013) that calculates the reflected spectrum from the surface of an X-ray illuminated, ionized accretion disk by solving the equations of radiative transfer, energy balance, and ionization equilibrium in a Compton-thick and plane parallel medium.
It is not clear how the reflecting structure is formed, but clues can be gathered from the relation between reflection strength and the nuclear accretion rate. From the observational point of view, the torus in the infrared (IR) becomes weaker in the low luminosity regime (i.e., for low accretion rates - below 10-3, González-Martín et al. 2017). Furthermore, in the X-rays, it has been seen that the Compton thin absorption (NH¡1.5x1024 cm-2) is less frequent in objects with low accretion rates: the fraction of Compton-thin obscured sources (1022¡NH¡1024 cm-2) decreases in the low luminosity regime (Ricci et al. 2017b; Osorio-Clavijo et al. 2022), while the fraction of Compton thick sources apparently remains constant. Both Compton thick and thin absorbers can produce reflection features, with different shapes and strengths. In addition, Osorio-Clavijo et al. (2022) found that in a sample of 81 AGN, 13 of the objects are lacking reflection signatures and the remaining galaxies (with a detected reflection component) should be highly obscured. In the following, in this work, we attempt to measure the global distribution of gas around the nucleus, whether in the line of sight or not, through their contribution to the reflection. In particular, we aim to establish whether the changes in the gas configuration become flattered or overall optically thinner as the accretion rate goes down.
Additionally, by modeling the X-ray reflection we are able to study the continuum emission, estimating the coronal parameters: the power-law () and the high energy cut-off (Ecut). It has been shown that the slope of the power law depends on the accretion rate with changes at intermediate accretion rates (= 10-3), pointing to a change in the accretion mechanism, for example between a corona on a thin disk to an advection dominated accretion flow (ADAF, Narayan et al. 1994). The relationship toward low accretion rates is usually seen with a lot of scattering, which can be intrinsic or due to observational uncertainties (Shemmer et al. 2006; Gu & Cao 2009; Younes et al. 2011; Yang et al. 2015a; She et al. 2018). Our second objective is to re-evaluate this relationship in the low accretion rate range, through detailed modeling of the reflection and broadband X-ray data, using observations from XMM-Newton+NuSTAR+Swift).
This paper is organized as follows: in Sect. 2 we present details of the observations and sample. The data reduction is reported in Sect. 3. The methodology followed during this work is shown in Sect. 4. All the results are reported in Sect. 5. The implications of our X-ray spectral analysis are discussed in Sect. 6. Finally, a summary of our findings is presented in Sect. 7.
2 Sample and data
Hard X-rays (E10 keV) are not significantly affected by obscuration, at least up to (Ricci et al. 2015), which allows us to obtain a highly complete AGN sample. Our work focuses on LLAGN selected through their hard-band X-ray emission as identified in the Swift/BAT 70-month catalogue (Baumgartner et al. 2013) on board the Neil Gehrels Swift Observatory (Gehrels et al. 2004). BAT operates in the 14–195 keV energy band. The BAT AGN Spectroscopic Survey (BASS) is a survey that provides high-quality multi-wavelength data for the BAT AGN, including black hole mass measurements (Koss et al. 2017) and X-ray spectroscopy modeling (Ricci et al. 2017a). The first data release (DR1) of the BASS project (Koss et al. 2017) includes 642 of Swift/BAT AGN and the second release of optical spectroscopy (BASS/DR2) will also soon be publicly available (Koss et al. 2022; Oh et al. 2022).
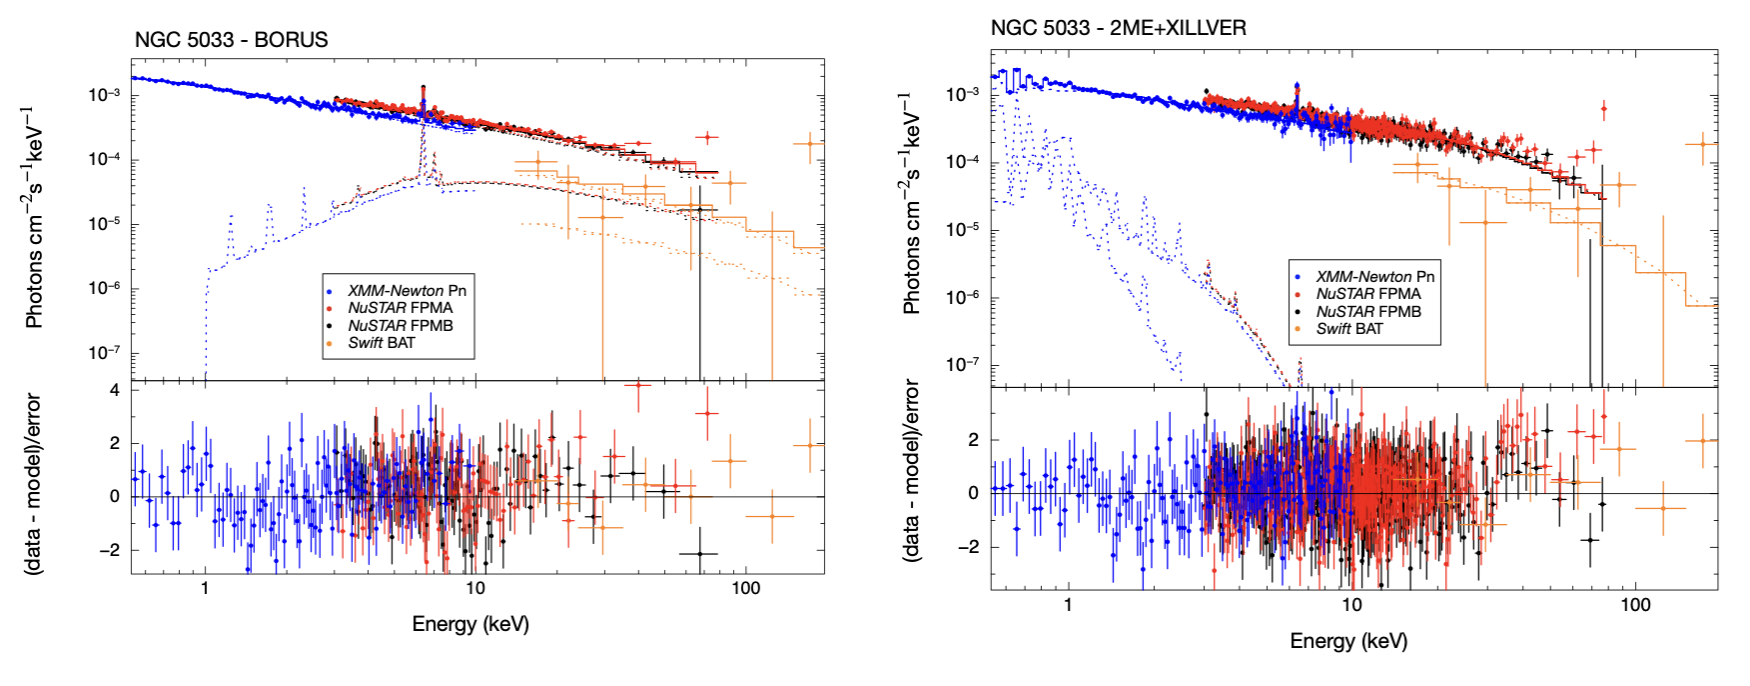
Our sample of galaxies was selected from the BASS/DR2 with accretion rates -3.0 obtaining in total a sample of 24 AGN. We used the HEASARC111http://heasarc.gsfc.nasa.gov/ archive to search simultaneous and not simultaneous NuSTAR and XMM–Newton data public until August 2020. This analysis provided data with both telescopes for 16 sources. We include the proprietary data of the galaxy NGC 5033 (PI: Diaz Y.; -4.0), an AGN also contained in the BASS/DR2.
Our final sample of LLAGN contains 17 objects, 11 of which are classified as Seyfert 2 (i.e. only narrow lines are visible in the optical spectrum), and six are classified as Seyfert 1.9 (a broad component is visible in H but not in H) in the BASS/DR2. Table 1 shows the general properties of our sample. Notes for the individual galaxy are in the Appendix A and Table 5 shows the log of the observations.
| Name | RA | DEC | Type | Redshift | Ngal | ||||
|---|---|---|---|---|---|---|---|---|---|
| (J2000) | (J2000) | (1020 cm-2) | M⊙ | () | () | ||||
| (1) | (2) | (3) | (4) | (5) | (6) | (7) | (8) | (9) | |
| NGC 3998 | 179.484 | 55.454 | Sy1.9 | 0.003 | 20.09 | 8.93L | 42.29 | -4.74 | |
| NGC 3718 | 173.145 | 53.068 | Sy1.9 | 0.003 | 20.03 | 8.14 | 41.74 | -4.49 | |
| NGC 4258* | 184.740 | 47.304 | Sy1.9 | 0.001 | 20.08 | 7.56L | 41.39 | -4.28 | |
| NGC 5033 | 198.364 | 36.593 | Sy1.9 | 0.002 | 20.00 | 7.68 | 41.78 | -4.00 | |
| ESO 253-G003* | 81.325 | -46.00 | Sy2 | 0.042 | 20.62 | 9.84+ | 43.89 | -3.95 | |
| NGC 1052 | 40.270 | -8.256 | Sy2 | 0.005 | 20.49 | 8.67 | 42.83 | -3.94 | |
| NGC 2655 | 133.907 | 78.223 | Sy2 | 0.004 | 20.32 | 8.20 | 42.43 | -3.87 | |
| NGC 3147* | 154.223 | 73.400 | Sy2 | 0.009 | 20.54 | 8.81 | 43.10 | -3.81 | |
| NGC 2110* | 88.047 | -7.456 | Sy2 | 0.007 | 21.27 | 9.38 | 43.81 | -3.67 | |
| LEDA 96373* | 111.610 | -35.906 | Sy2 | 0.029 | 21.47 | 9.21 | 43.80 | -3.51 | |
| NGC 2992 | 146.425 | -14.326 | Sy1.9 | 0.007 | 20.72 | 8.33 | 43.13 | -3.30 | |
| M 51 | 202.484 | 47.230 | Sy2 | 0.001 | 20.19 | 6.59 | 41.40 | -3.29 | |
| NGC 2273* | 102.536 | 60.845 | Sy2 | 0.006 | 20.84 | 7.99 | 42.84 | -3.25 | |
| HE 1136-2304 | 174.713 | -23.360 | Sy1.9 | 0.027 | 20.63 | 9.39 | 44.28 | -3.21 | |
| IGRJ 11366-6002 | 174.175 | -60.052 | Sy1 | 0.014 | 21.81 | 8.56 | 43.51 | -3.15 | |
| IC 4518A | 224.421 | -43.132 | Sy2 | 0.016 | 20.96 | 8.79 | 43.83 | -3.06 | |
| NGC 7674* | 351.986 | 8.779 | Sy2 | 0.028 | 20.70 | 9.18 | 44.28 | -3.0 |
3 Data Reduction
Data reduction was performed following the methodology explained in this section. Details on the observations can be found in Table 5.
3.1 XMM-Newton data
This satellite has two X-ray instruments, a grating spectrometer, and the European Photon Imaging Camera (EPIC). The EPIC instrument has three detectors, two MOS (Turner et al. 2001) and one PN CCDs (Strüder et al. 2001), we only used the observations from the EPIC-PN because of its higher throughput (Strüder et al. 2001) and because of inclusion of the EPIC-MOS spectra resulted in too much statistical weight to the low energy range data points compared to the NuSTAR and Swift/BAT data. We processed the Observation Data Files (ODFs) from the European Photon Imaging Camera (EPIC) PN detector using the Science Analysis System (SAS version 17.0.0). We followed standard procedures to obtain calibrated and concatenated event lists, filter them for periods of high background flaring activity, and extract light curves and spectra. Source events were extracted using a circular region of 49 arcsec centered on the target, and background events were extracted from a circular region of 98 arcsec on the same chip far from the source. We verified the photon pile-up is negligible in the filtered event list with the XMMSAS task epatplot. We generated response matrix files (RMFs) and ancillary response files (ARFs) and rebinned the spectra in order to include a minimum of 25 counts in each background-subtracted spectral channel and to not oversample the intrinsic energy resolution by a factor larger than 3.
3.2 NuSTAR data
Nuclear Spectroscopic Telescope Array (NuSTAR) was successfully launched in 2012 June, Harrison et al. (2013). NuSTAR has two identical co-aligned telescopes, each consisting of an independent set of X-ray mirrors and a focal-plane detector, referred to as focal plane modules A and B (FPMA and FPMB) that operate in the energy range 3–79 keV. The data reduction was performed with nustardas v1.6.0, available in the NuSTAR Data Analysis Software. The event data files were calibrated with the nupipeline task using the response files from the Calibration Database caldb v.20180409 and HEASOFT version 6.25. With the nuproducts script, we generated both the source and background spectra, plus the ARF and RMF files. For both focal plane modules (FPMA, FPMB), we used a circular extraction region of radius 49 arcsec centered on the position of the source. The background selection was made, taking a region free of sources of twice the radius of the target and located in the same detector quadrant. Spectral channels were grouped with the ftools task grppha to have a minimum of 20 counts per spectral bin in the 3.0 – 79.0 keV energy range.
3.3 Swift data
The Neil Gehrels Swift Observatory was launched on November 20, 2004. It carries three instruments to enable the most detailed observations: the Swift Burst Alert Telescope (BAT; Barthelmy et al. 2005; bandpass: 15-350 keV), the X-ray Telescope (XRT; Burrows et al. 2005; bandpass: 0.3-10 keV), and the UV/Optical Telescope (UVOT 170–650 nm). In this work, we are focusing on Swift/BAT and Swift/XRT instruments.
-
•
Swift/BAT:
We retrieved the binned and calibrated spectra, together with the response matrices for our targets, from the Swift/BAT 105-month All-sky Hard X-Ray Catalog reported in Oh et al. (2018b). The observations were taken with the Burst Alert Telescope (BAT) on board the Swift observatory. This survey has a sensitivity of 8.410-12 erg s-1 cm-2 in the 14 – 195 keV bands over 90 of the sky, with eight-channel spectra averaged over the 105-month duration of the survey. The complete analysis pipeline is described in the Swift/BAT 22 All-sky Hard X-Ray Survey (Tueller et al. 2010).
-
•
Swift/XRT:
For three sources (NGC 7674, ESO 253-G003, and IGRJ 11366-6002) there are no simultaneous XMM-Newton and NuSTAR observations. We explored the Swift/XRT archived and found simultaneous observations for the three of them. The data reduction of the Swift/XRT in the Photon Counting mode was performed by following standard routines described by the UK Swift Science Data Centre (UKSSDC) and using the software in HEASoft version 6.30.1. Calibrated event files were produced using the routine xrtpipeline, accounting for bad pixels and effects of vignetting, and exposure maps were also created. Source and background spectra were extracted from circular regions with 25 arcsec and 50 arcsec radius. The xrtmkarf task was used to create the corresponding ancillary response files. The response matrix files were obtained from the HEASARC CALibration DataBase. The spectra were grouped to have a minimum of 20 counts per bin using the grppha task.
After the data reduction, we find that both NGC 7674 and ESO 253-G003 present very low counts, preventing us from doing a proper spectral fit, so these will not be used in the analysis.
4 Methodology
The analysis of the data comprises two steps: (1) a Combination of XMM-Newton and NuSTAR observations; and (2) homogeneous spectral fitting of the sample. All the spectra have been fitted using xspec version 12.10.0 (Arnaud 1996) and all the errors reported throughout the paper correspond to 90 of confidence level.
4.1 Combination of the XMM-Newton and NuSTAR observations
In this work, we have NuSTAR observations, with an energy range from 3 to 79 keV, vital to study the Compton hump which is a key signature of the reflection. Additionally, we have XMM-Newton data, which provides the best combination of sensitivity, bandpass, and spectral resolution at energies ranging from 0.5 - 10.0 keV. Objects with simultaneous observations with XMM-Newton and NuSTAR were fitted with all model parameters tied between the different spectra, except for a free cross-normalization factor. Objects with non-simultaneous observations (denoted with the symbol * in our work) were tested for spectral variability between the observation epochs. In order to detect spectral variability, we simultaneously fitted the XMM-Newton + NuSTAR spectra in the overlapping 3.0 – 10.0 keV range for each object with a power-law model under neutral absorption. In cases where the spectrum was not well-fitted with this model, we added a Gaussian component centered at 6.4 keV and studied the improvement of the fit.
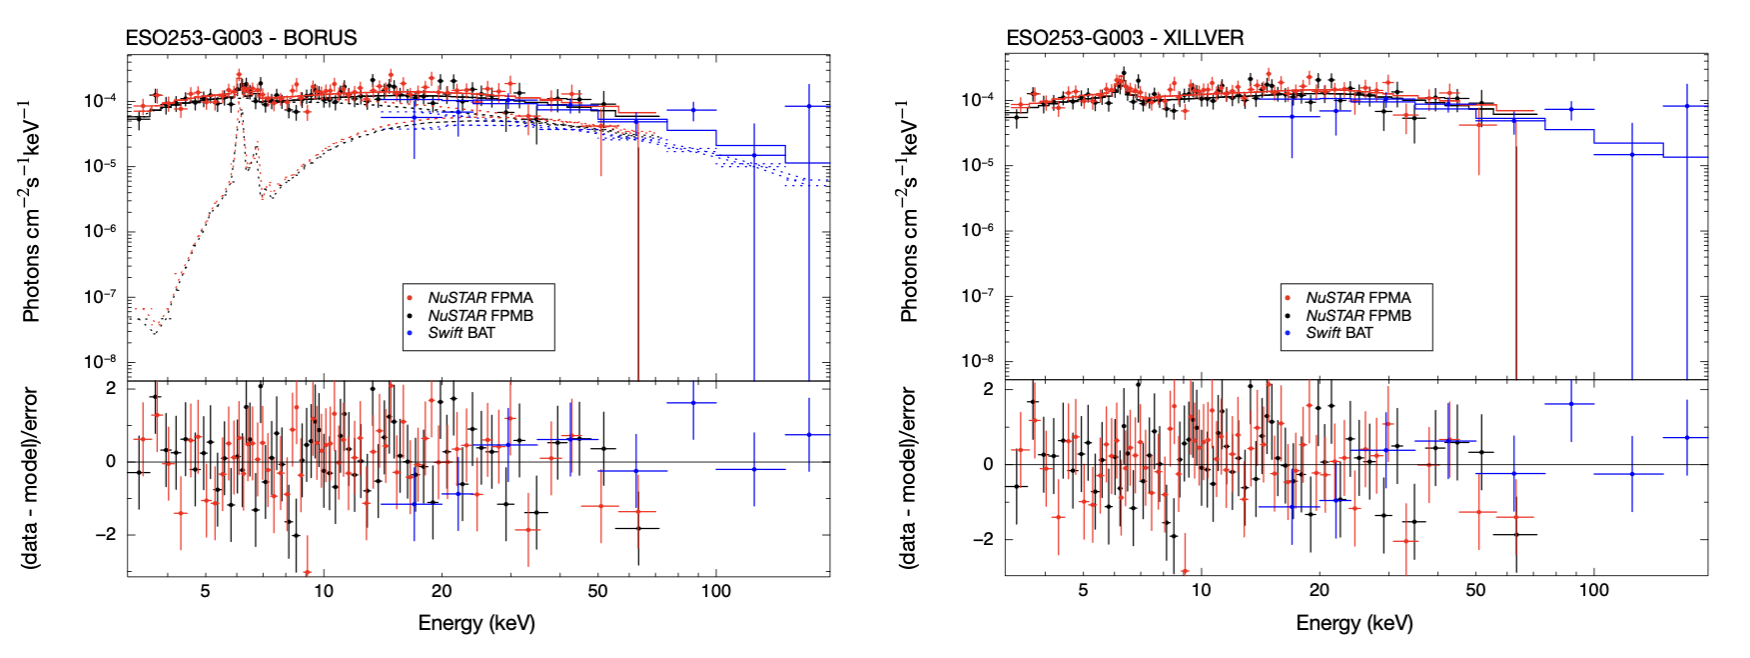
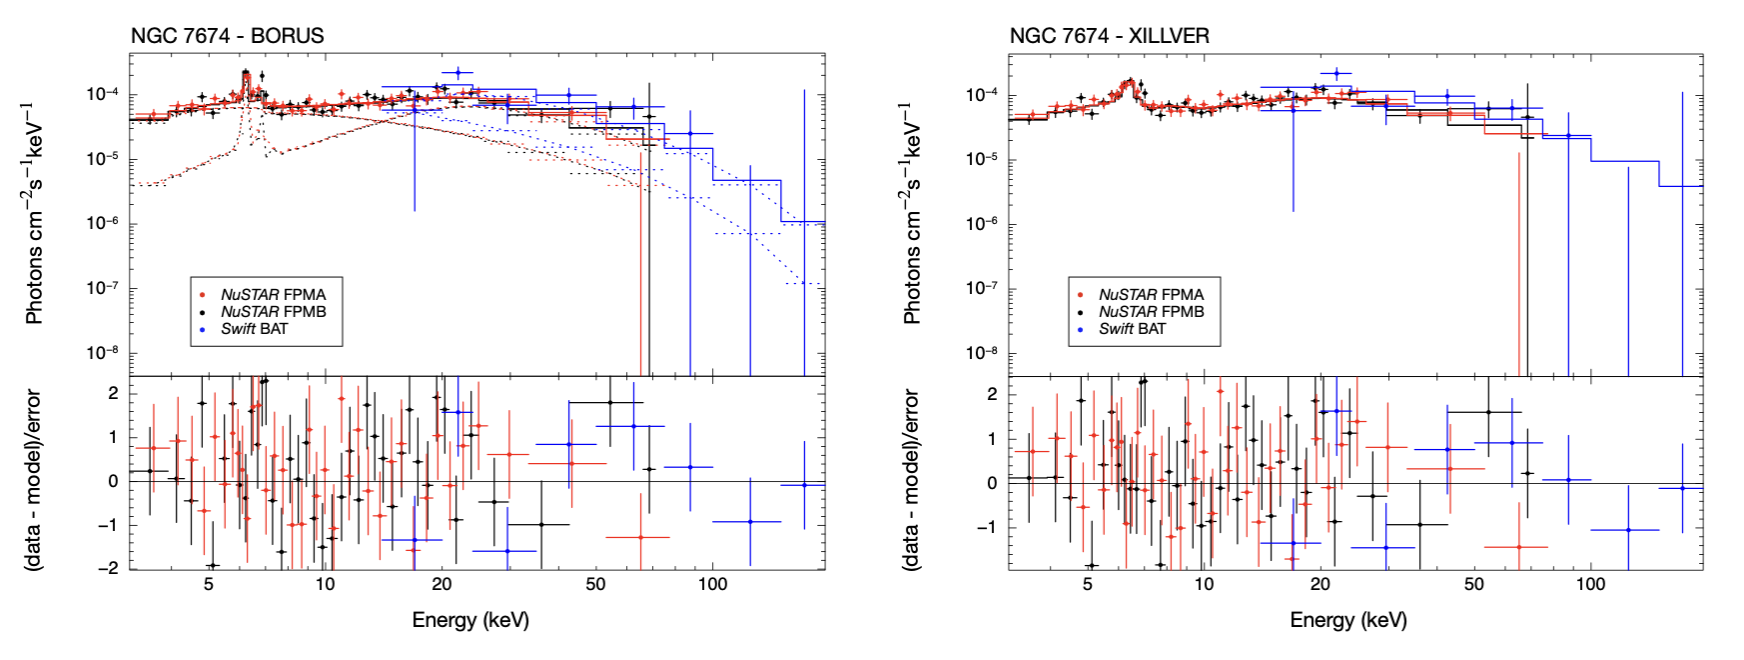
At first, all parameters were tied between the spectra of the different epochs/instruments. If this model produced a satisfactory fit (1.2) the source is considered non-variable and treated in the same way as the objects with simultaneous observations. Two objects are well-fitted with a tied normalization of the power law (LEDA 96373* and NGC 2273*). For the remaining objects (NGC 4258*, NGC 3147*, NGC 2110* and IC 4518A*) we found that the normalization of the power-law varying between epochs resulted in a satisfactory fit. For these objects, in the subsequent fitting, the normalization of the power law was left free between the epochs, but the remaining parameters were tied. For one object, (ESO 253-G003*) allowing the slope of the power law to vary freely improved the fit significantly according to the F-test. Given the spectral variability in this source, we had to leave most parameters untied between the epochs, and therefore the inclusion of the lower energy spectrum would not constrain the reflection model further. For this reason, in this source, we used the high-energy spectra only. Finally, one object (NGC 7674) could not be fitted well with a free slope and normalization, as this is a known changing look AGN and its spectrum changed significantly in shape between observations (Bianchi et al. 2005), so we retained only the NuSTAR spectrum for the following analysis. The best model and the final configuration for each object are summarized in Table 7.
4.2 Spectral analysis
The aim of our spectral analysis is to quantify how much reflecting material can exist around the central engine. For this purpose, we allow different types of reflectors and maximize the freedom of the fitted parameters of all required models, even if the fit results in unconstrained values for many of them. We tested the significance of the reflection component in the 3–195 keV band in all objects, returning significant detections in most of them. These tests are summarized in Appendix B.
For all spectral fits, we included a multiplicative constant normalization between FPMA, FPMB, EPIC-PN, and Swift/BAT to account for calibration uncertainties between the instruments. We started with a baseline model and added different components until a satisfactory fit was obtained. We have selected three broad components in order to parametrize three scenarios:
-
1.
Cut off Power-law model (cPL) obscured by neutral material: a single power law model, which corresponds to the primary emission of a non-thermal source. The column density, NH,los, is added as a free parameter to take the absorption by matter along our line of sight to the target into account. The free parameters in this model are the column density, NH,los, the slope of the power law, , the high energy cut-off, Ecut and the normalization.
-
2.
Reflection models (Refl): When the X-ray continuum is scattered by the surrounding gas, it can produce fluorescent emission lines (most notably Fe K 6.4 keV) and a broad hump-like continuum peaking around 10–30 keV. The reflection was modeled with three possible scenarios:
-
•
A neutral reflector with a semi-infinite column density modelled with PEXMON (Nandra et al. 2007). This model assumes the existence of optically thick and cold material, distributed in a slab and covering a given fraction of the X-ray source. The PEXMON model includes fluorescence, adding some spectral features, such the emission lines FeK and Fek, following the Monte Carlo calculations by George & Fabian (1991). This model represents both the reflected and intrinsic emission defined with and the high energy cut-off (Ecut) and the reflection fraction, Rf. The free parameters in this model are the reflection fraction, Rf (to account for the reflection component and the contribution from the intrinsic power-law continuum), the spectral index, , the high energy cut-off, Ecut, the inclination and the normalization.
-
•
A smooth spherical distribution of neutral gas, with conical cavities along the polar direction, is modeled with BORUS (Baloković et al. 2018). This model calculates the reprocessed continuum of photons that are propagated through a cold and static medium. BORUS is similar to the torus model BNtorus of Brightman & Nandra (2011) but it has additional free parameters (Ecut, ), additional chemical elements included, calculation extending to higher energies and line-of-sight component separated out. Furthermore, this model has a variable covering factor which is an advantage compared with other models, as MYTORUS (Murphy & Yaqoob 2009) that proposes a toroidal geometry where the covering fraction is fixed to 0.5. In this work, we used the geometry of a smooth spherical distribution of gas, with conical cavities along the polar directions (borus02). The column density and the inclination of the torus are free parameters in this model. borus02 includes fluorescent emission lines, according to fluorescent yields for K and K lines from Krause & Oliver (1979), for all elements up to zinc (Z ¡ 31). The reflected spectrum of this torus is calculated for a cut-off power-law illuminating continuum, where Ecut, and normalization are free parameters. We modeled the direct coronal emission separately with a cut-off power law under a neutral absorber as described above. We have set as free parameters the column densities along the line-of-sight, NH,los, the inclination, Cos(), the covering factor, CF, the column density of the reflector, , the spectral index of the primary emission, , the high energy cut off, Ecut and the normalization of the reflector tied to the primary emission.
-
•
The accretion disk reflection modeled with XILLVER (García et al. 2013) where the coronal spectrum is a power-law with an exponential cut-off described by the photon index, and the high energy cut-off, . Another important parameter is the ionization parameter, , defined as the incident flux divided by the density of the disk. This parameter is described by ranging from 0 for a neutral disk to 4.7 erg cm-2 s-1 for a heavily ionized disk (see García et al. 2013, for a more detailed description). Other parameters in this model are the iron abundance, relative to the solar value (assumed to be solar in this work), redshift, reflection fraction, Rf, and the inclination. Also, this model takes into account both the reflected continuum and the FeK. The free parameters in this model are the spectral index, , the high energy cut-off, Ecut, the ionization degree, , the inclination, incl, the reflection fraction, Rf (to normalize the reflection component relative to the intrinsic power-law continuum) and the normalization.
-
•
-
3.
Soft X-ray emission (SE): When the combination of the above models does not produce a good fit, we explore if the addition of spectral component(s) improves the fit. The following spectral components are considered:
-
•
An absorbed scattered power-law: an absorbed power-law PL to model the scattered emission that is deflected by ionized gas. The photon index, , of the scattered component is tied to the primary power law. We set as free parameters the column density, NH,ext and the normalization of the scattered component but restricted to be less than 5 of the main one.
-
•
Thermal emission: An optically-thin thermal component, modeled by MEKAL in xspec, to model the soft excess observed below 1 keV, and potentially due to either star formation processes and/or thermal emission from a hot interstellar medium. We kept the hydrogen column density, abundance, and switch at their default values (1, 1, and 1 respectively) and we let the temperature, ionization, and normalization free to vary.
-
•
An ionized absorber (ab): a warm absorber was modelled with zxipcf within xspec. This model uses a grid of xstar photoionized absorption models (calculated assuming a microturbulent velocity of 200 km s-1) for the absorption, and it assumes an absorbent covering some fraction of the source, cfW (Reeves et al. 2008). zxipcf has as free parameters the column density, NH,W, the ionization state, , the covering fraction, cfW, and redshift. We set the covering fraction to cfW=1 to mimic an absorber covering all the sky. We let as a free parameter NH,W and .
-
•
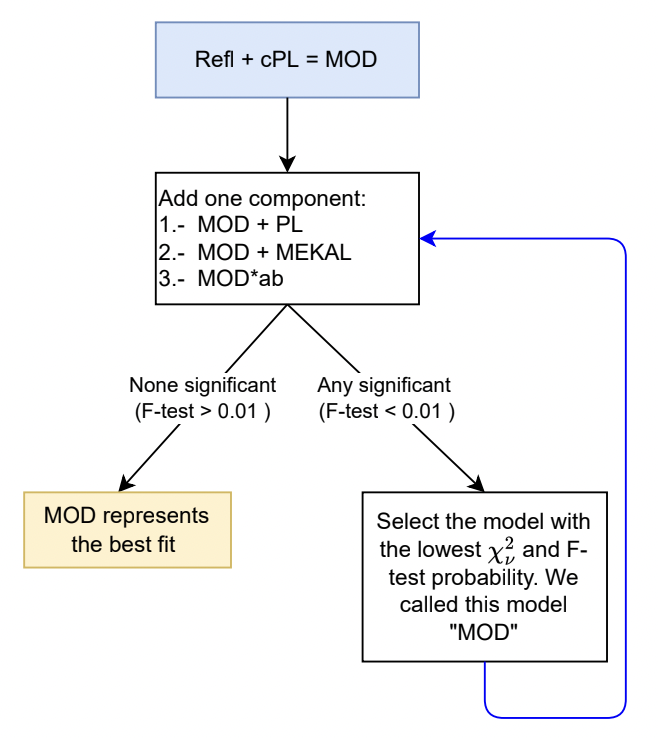
We started our analysis by fitting a baseline model that is defined as MOD = Refl + cPL to the data. Then we added one SE emission or absorption component (we tested one by one: MOD + PL, MOD + MEKAL and MOD*ab) and explore if the inclusion of these components improves the fit (using an F-test in the case of the scattered power-law and MEKAL, and we evaluate the improvement of the fit using the values of the and a visual inspection of the residuals in the case of the ionized absorber). If any of the improvements was significant, we selected the model that returned the lowest value of d.o.f.333d.o.f. means the degree of freedom and select it as the new baseline model and the process of including and testing an additional SE component was repeated. When none of the additional SE components provided a significant improvement, the iteration stopped. Up to 4 iterations were necessary for each object and reflection model. The method is represented in Fig. 1. The process was repeated separately for each reflection model. Thus, we report up to three best-fitting models for each object.
The models that were selected to fit the data are represented in xspec as:
Where represents the cross-calibration constant between different instruments, NH,Gal is the Galactic absorption (phabs in xspec) predicted using NH tool within FTOOLS (Dickey & Lockman 1990; Kalberla et al. 2005). “ab” is the ionized absorption component modelled with zxipcf, in cases where this component is used, otherwise is equal to unity. Two absorbing column densities are used, which will be called here NH,ext and NH,los (zphabs in xspec). NH,los is assumed to cover the nuclear components (power-law and disk reflection)444In case of a torus-like reflection, the absorber is not acting in the torus-like reflector and NH,ext covers the SE component555In case of MEKAL, the absorber is not acting in this component. Moreover, cPL is a cut-off power-law (cutoffpl in xspec) representing the primary X-ray emission and “Refl” represents the different reflection models used.
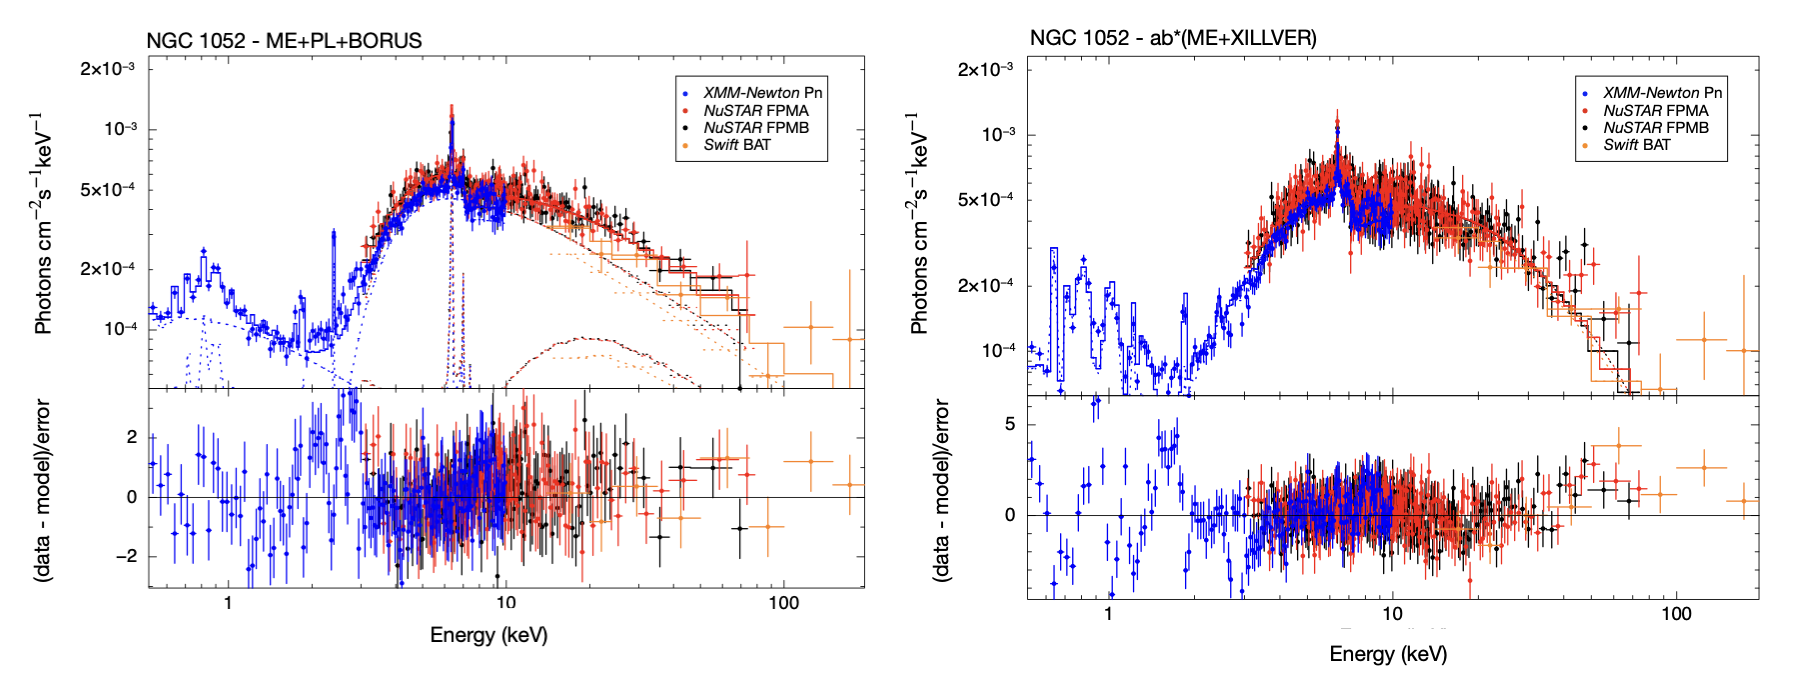
Note that we imposed the following conditions to the resulting best-fit ¿0.5, N NH,ext and NH,los¿NH,ext. In the case of NGC 1052, additional Gaussian lines were required at soft energies from a visual inspection, we included S XIV at 2.4 keV and Si XIII at 1.85 keV, also in agreement with (Osorio-Clavijo et al. 2020a). They were added as a narrow Gaussian line with fixed centroid energy and a width fixed at 0.01 keV.
5 Results
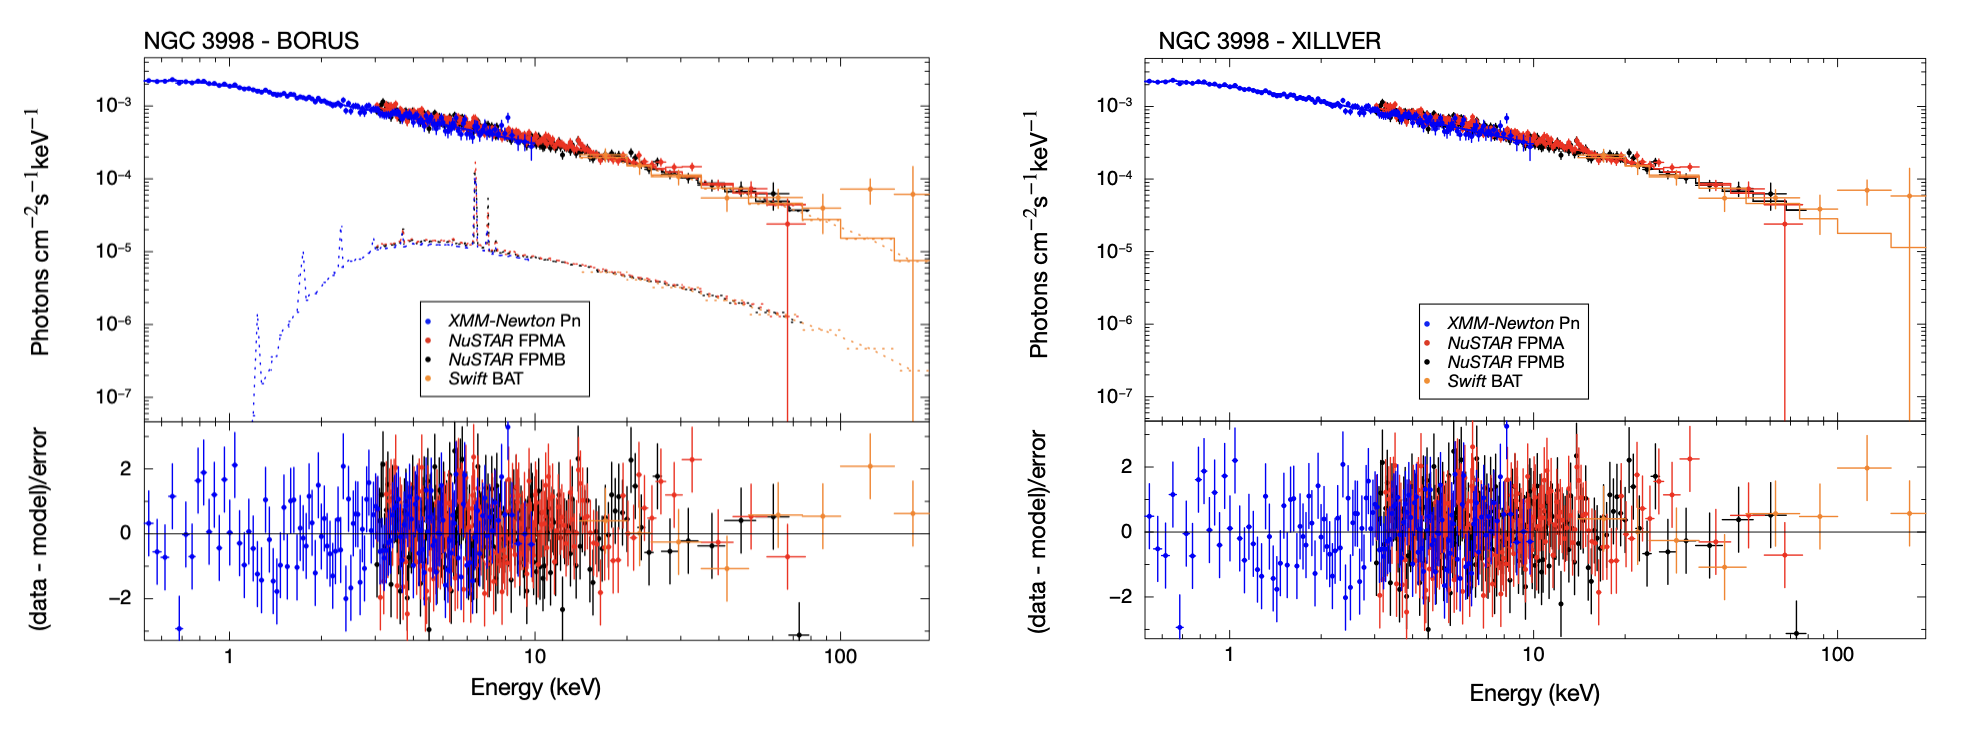
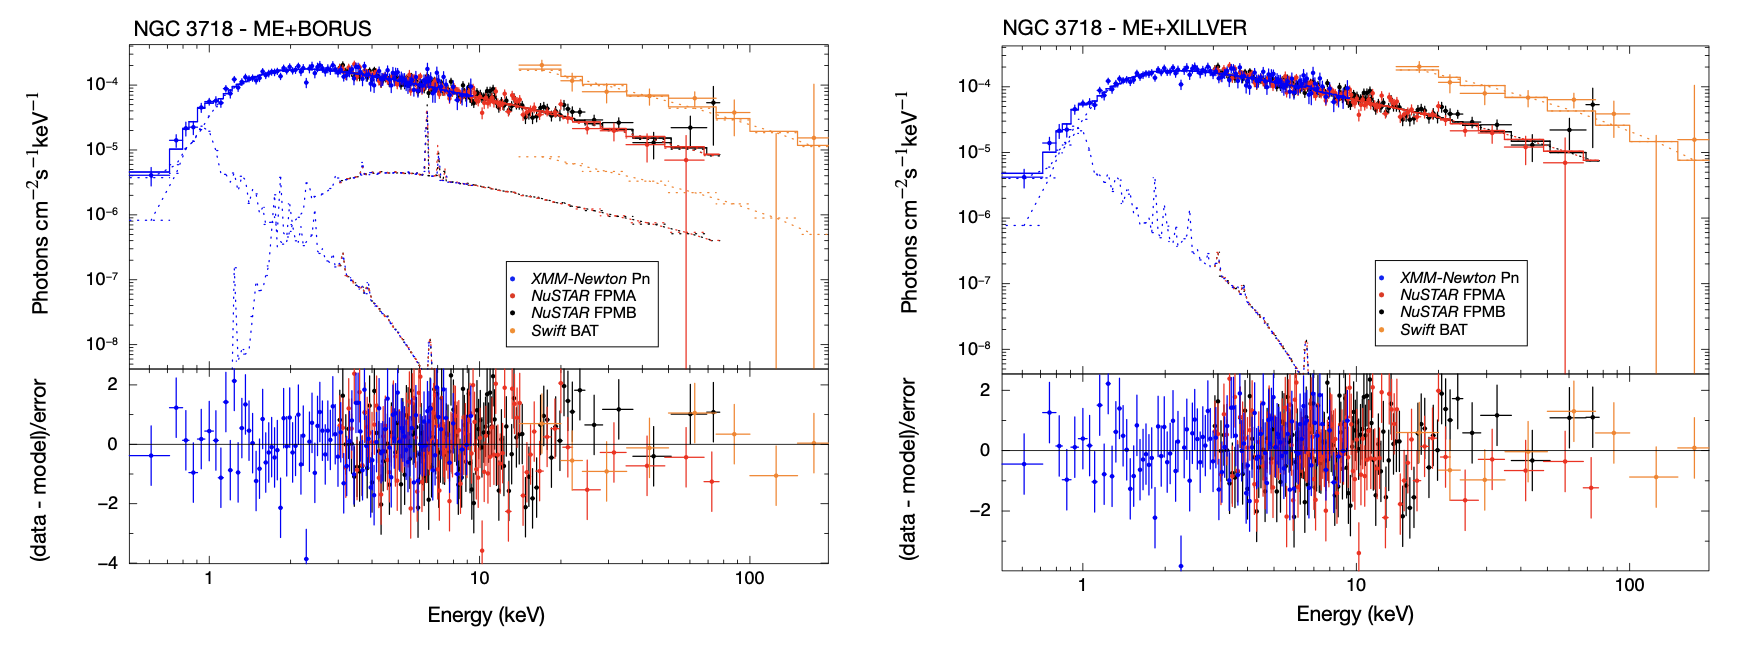
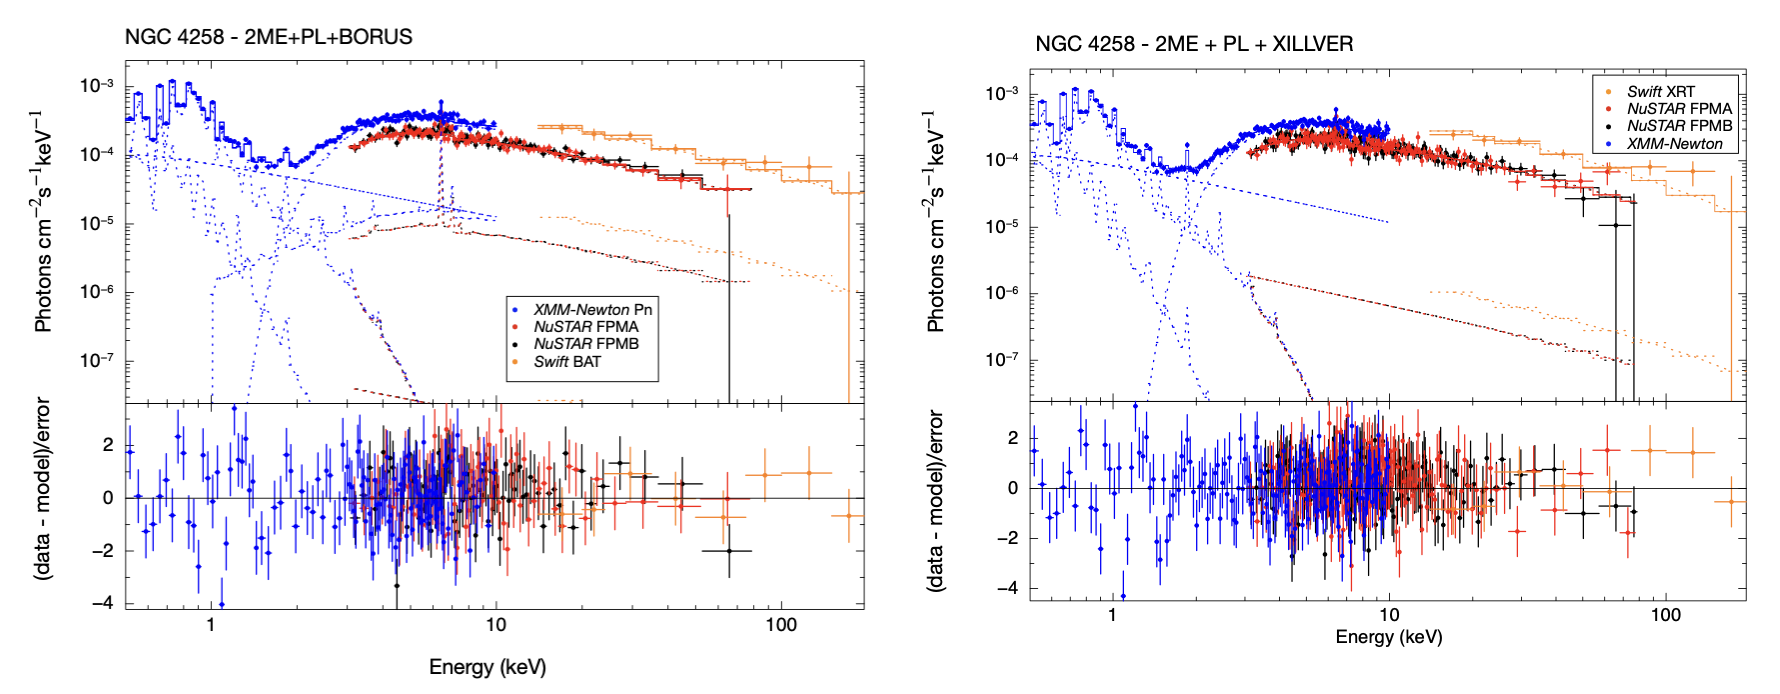
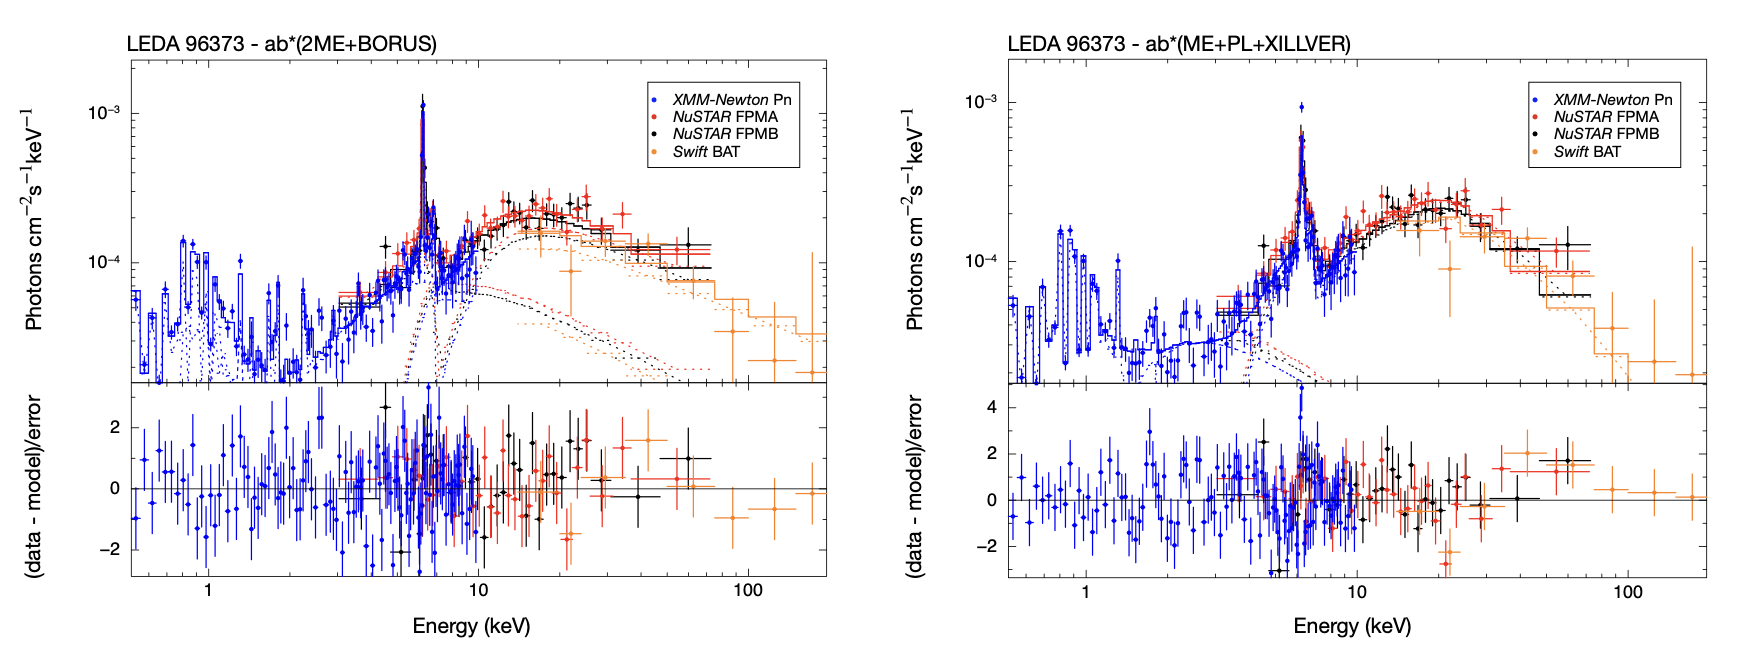
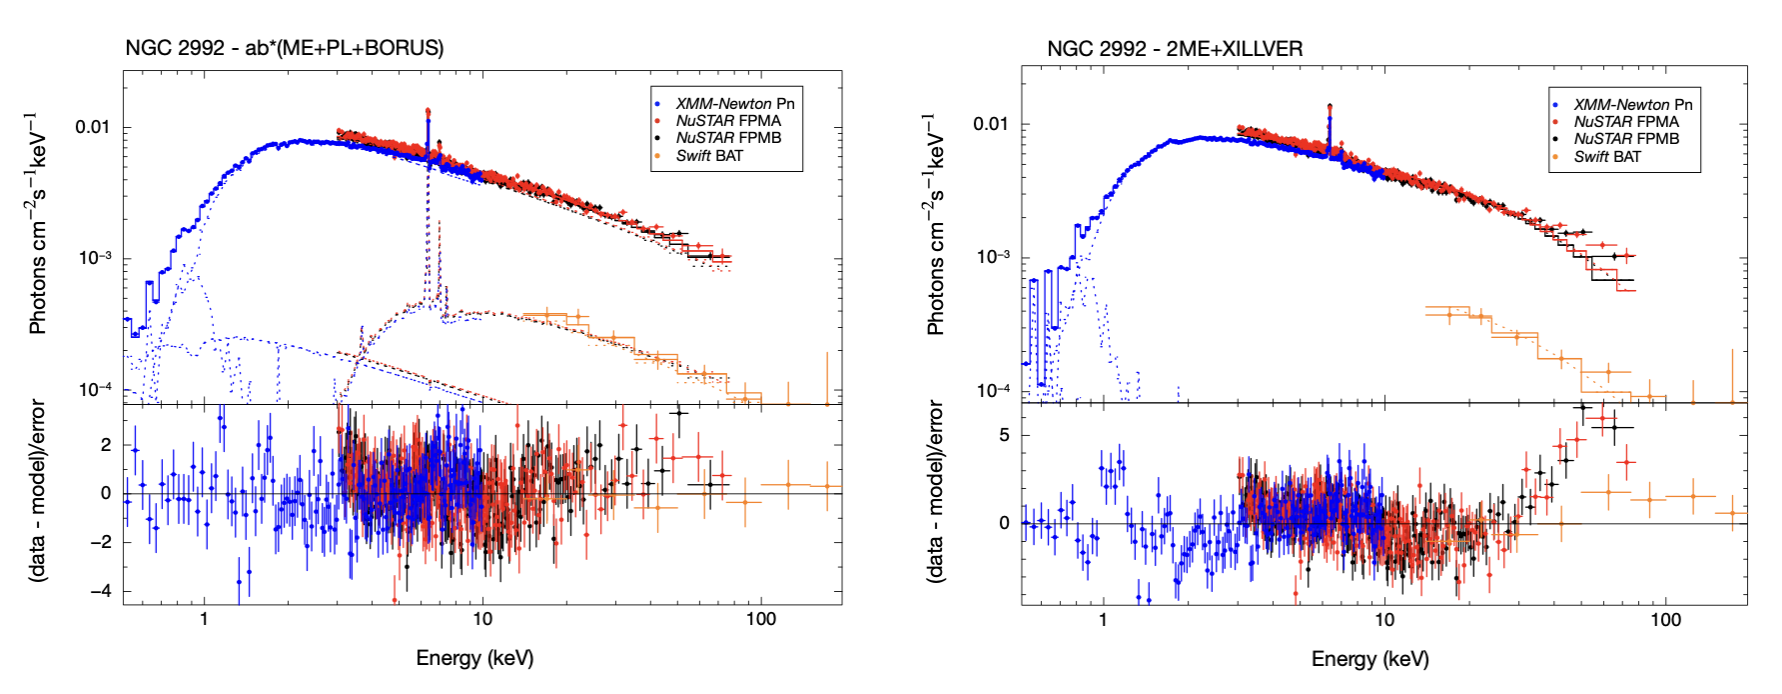
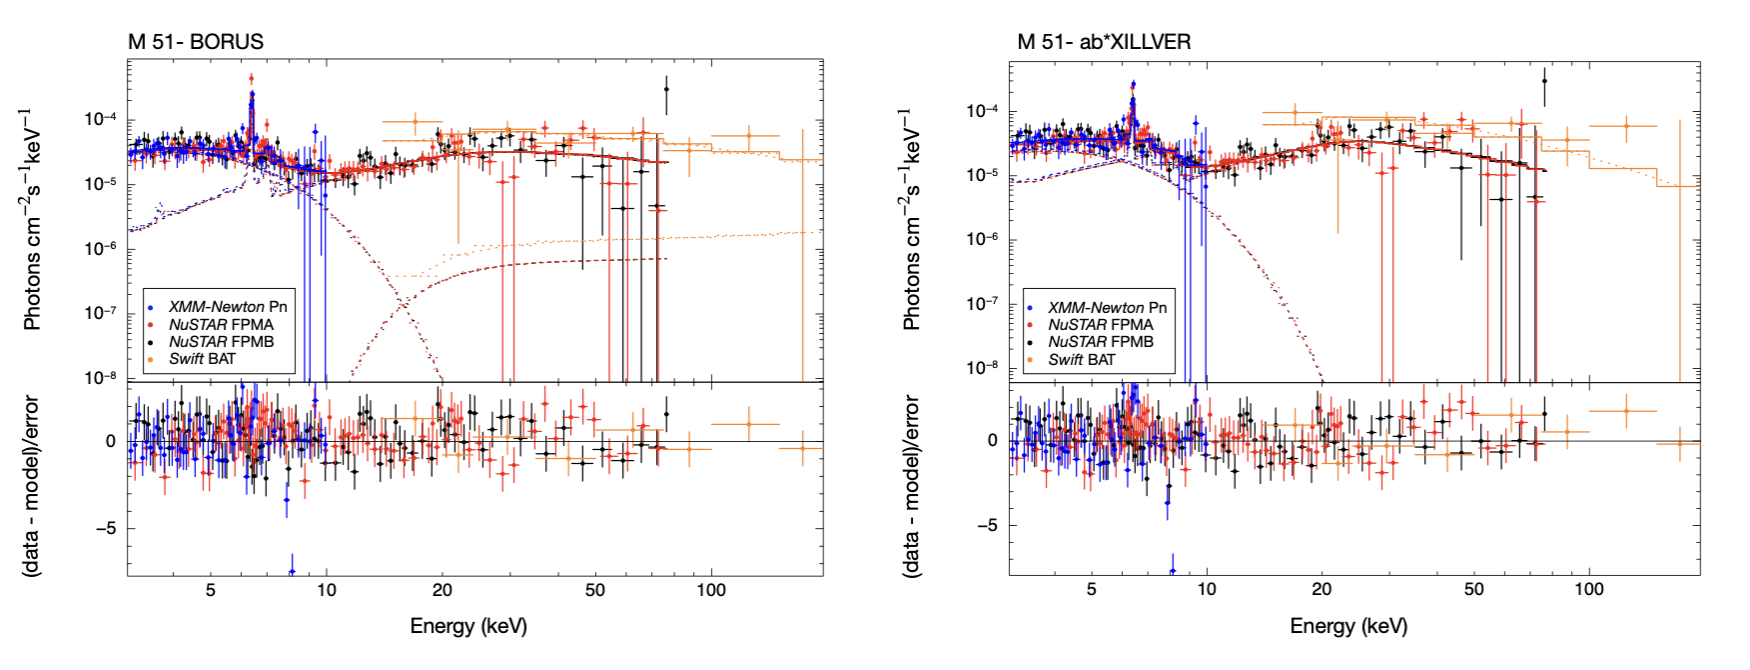
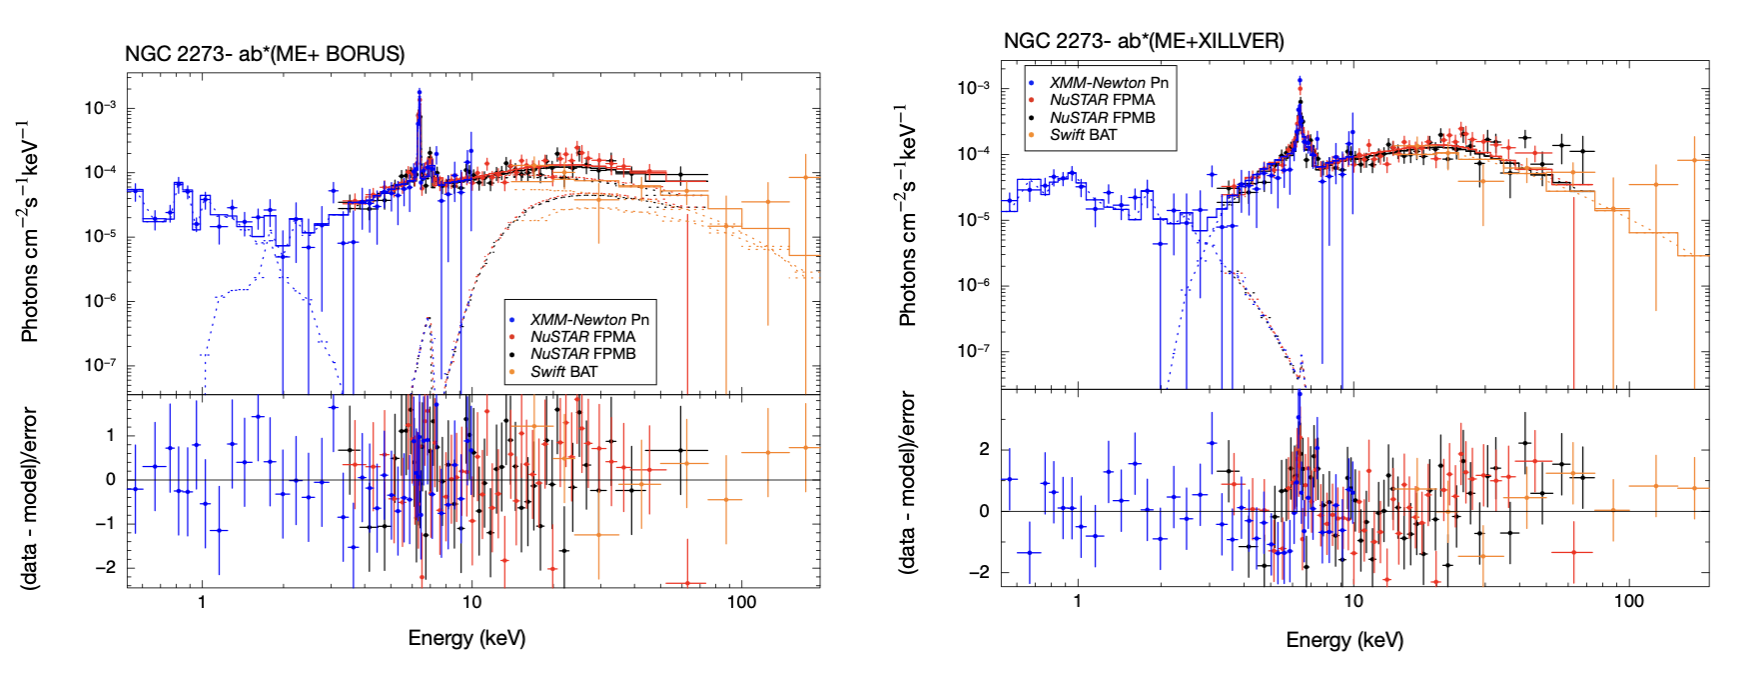
We refer the reader to the following sections and tables for details on the analysis. Comparison with previous works and our results on individual objects can be found in Appendix A. The coronal parameters (i.e., , Ecut, and ) are listed in Table 9. The reflection parameters, i.e., Rf and inclination for PEXMON; , CF and inclination for borus02; , Rf and inclination for XILLVER are listed in Table 10. In Table 11 we show all the additional components required for the fit with each of the reflection models, i.e., the column density of the neutral absorbers in the line of sight to the extended and nuclear components and the temperature of the optically thin thermal emission components. Additional parameters, i.e., the column density and ionization parameter of the ionized absorbers in the line of sight and the normalization of the scattered power law can be seen in Table 12. All cross-calibration constants are listed in Table 13. The plots of the spectra with the best-fit models and their residuals can be found in Appendix E.
5.1 Models
In this work, we used three reflection models (PEXMON, borus02, and XILLVER) that were used to fit the spectrum of each of the sources in the sample, i.e., each of the sources is fitted by three different models.
The simplest model used in our work (PEXMON) is a good representation of the data, however, we will focus on models that can explore different reflector geometries as borus02 and XILLVER. To decide which model provides the best description of the observations, we estimate the “evidence ratio” using the Akaike information criterion (AIC) for both models. This evidence ratio allows us to compare if one model is better than another one, it is defined using as =W(AICtorus)/W(AICdisk) where W(AICtorous) and W(AICdisk) are the “Akaike weight” (see Emmanoulopoulos et al. 2016 for more details). The evidence ratio is a measure of the relative likelihood of the torus versus the disk model. The torus model is 200 times more likely than the disk model when 0.0067. The disk model is 200 times more likely than the torus model when 150. The evidence ratio is listed in Table 2.
| Name | Model | |
|---|---|---|
| NGC 3998 | 8.06E-01 | T/D |
| NGC 3718 | 1.68E+00 | T/D |
| NGC 4258* | 2.57E-16 | Torus |
| NGC 5033 | 5.67E-04 | Torus |
| ESO 253-G003* | 1.20E+00 | T/D |
| NGC 1052 | 3.86E-59 | Torus |
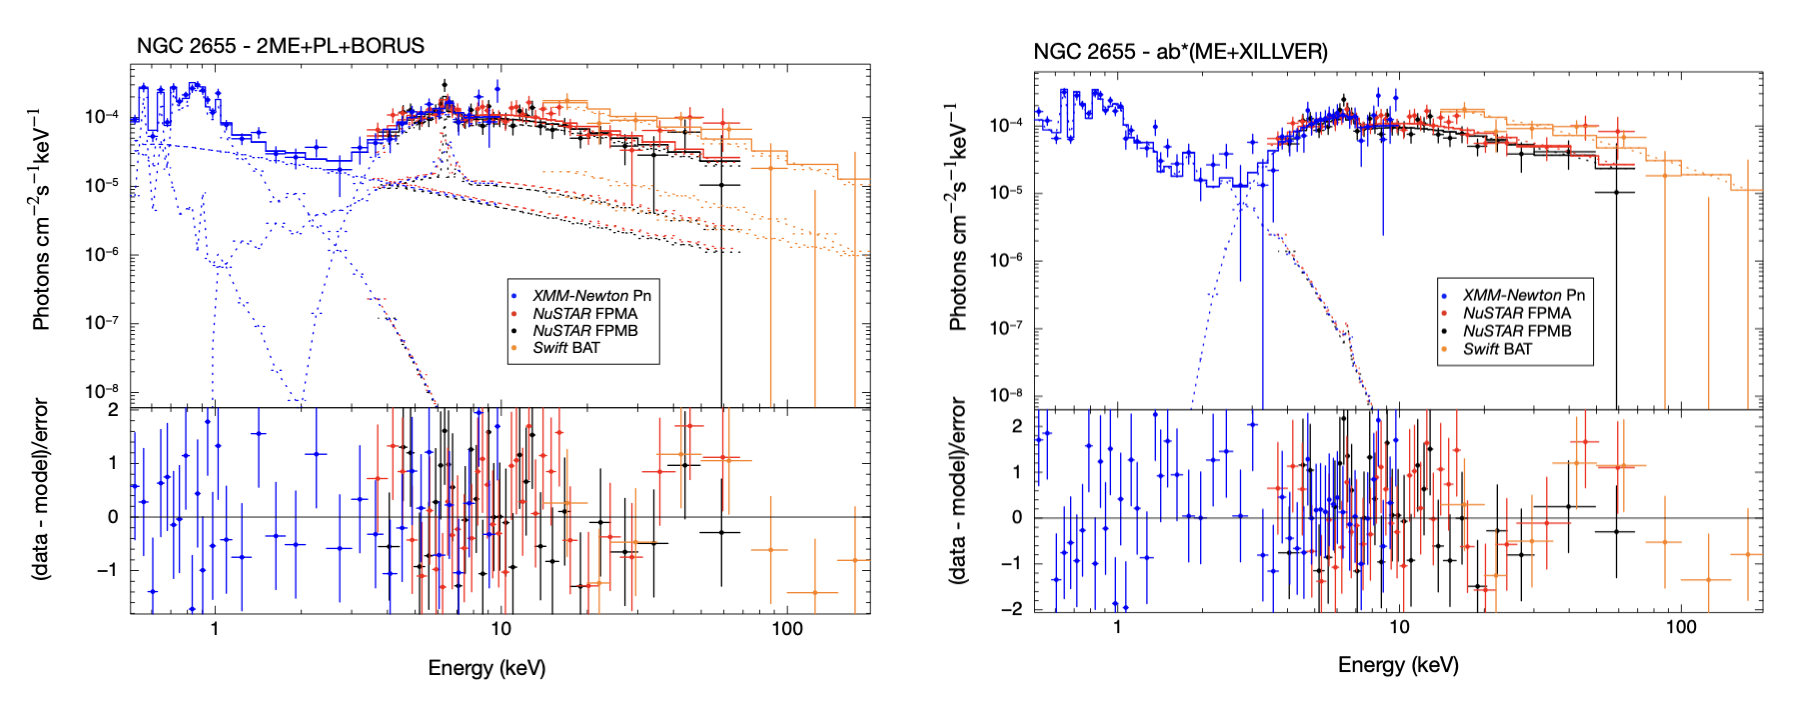
| NGC 2655 | 3.86E-02 | T/D |
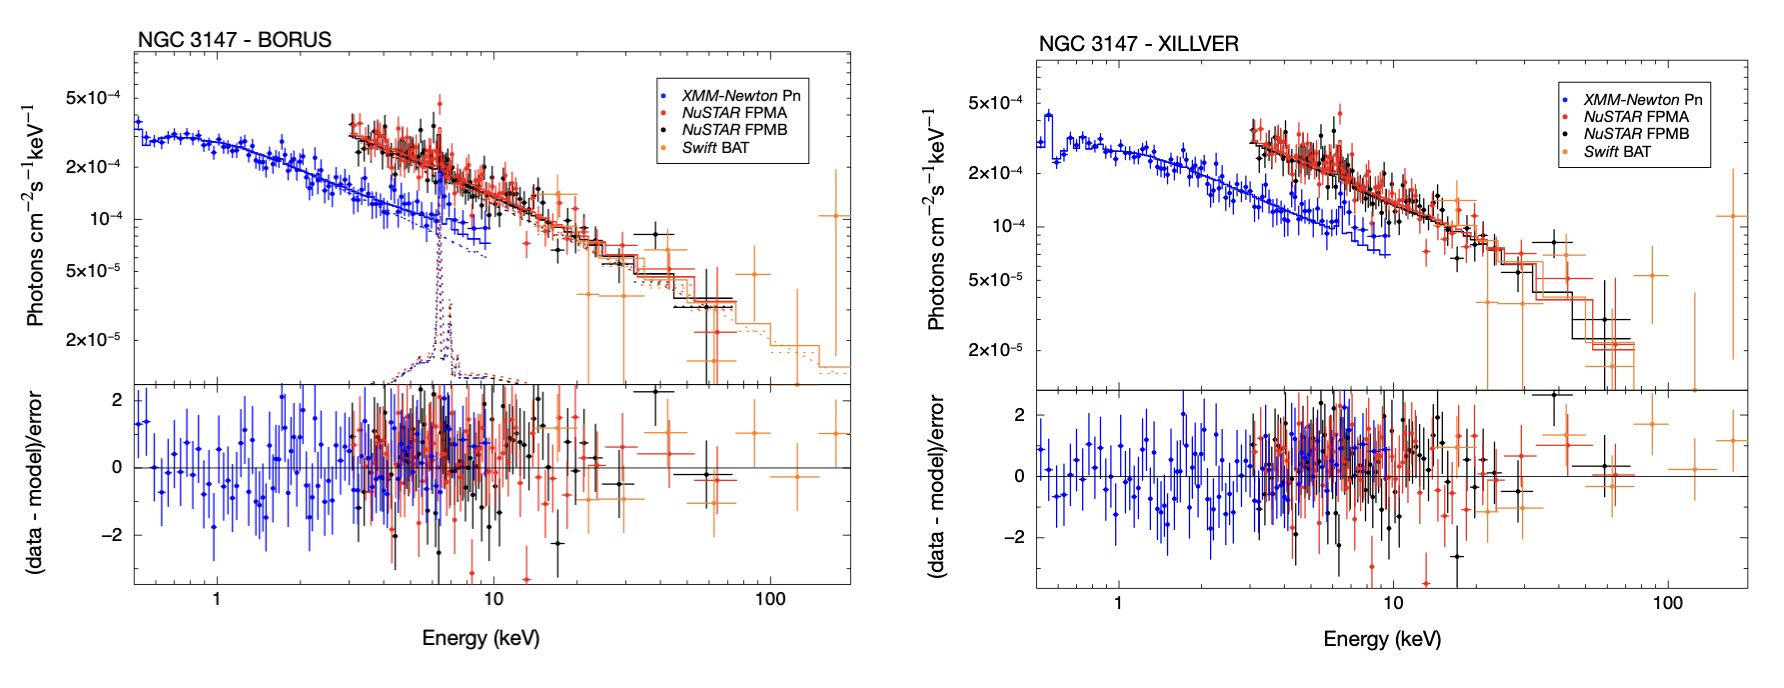
| NGC 3147* | 6.44E-02 | T/D |
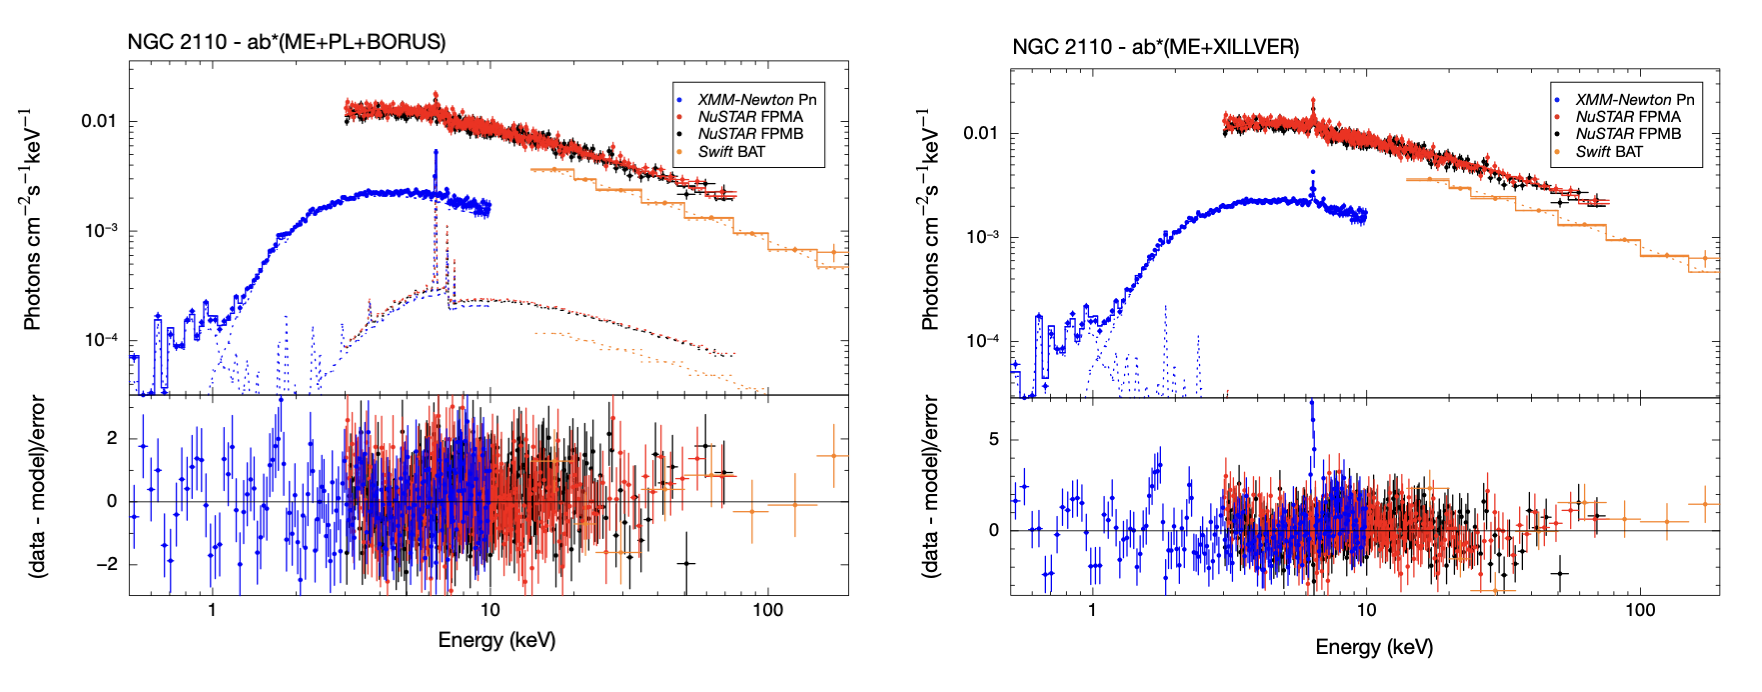
| NGC 2110* | 1.65E-53 | Torus |
| LEDA 96373* | 8.97E-26 | Torus |
| NGC 2992 | 1.77E-74 | Torus |
| M 51 | 1.68E-04 | Torus |
| NGC 2273* | 4.41E+07 | D |
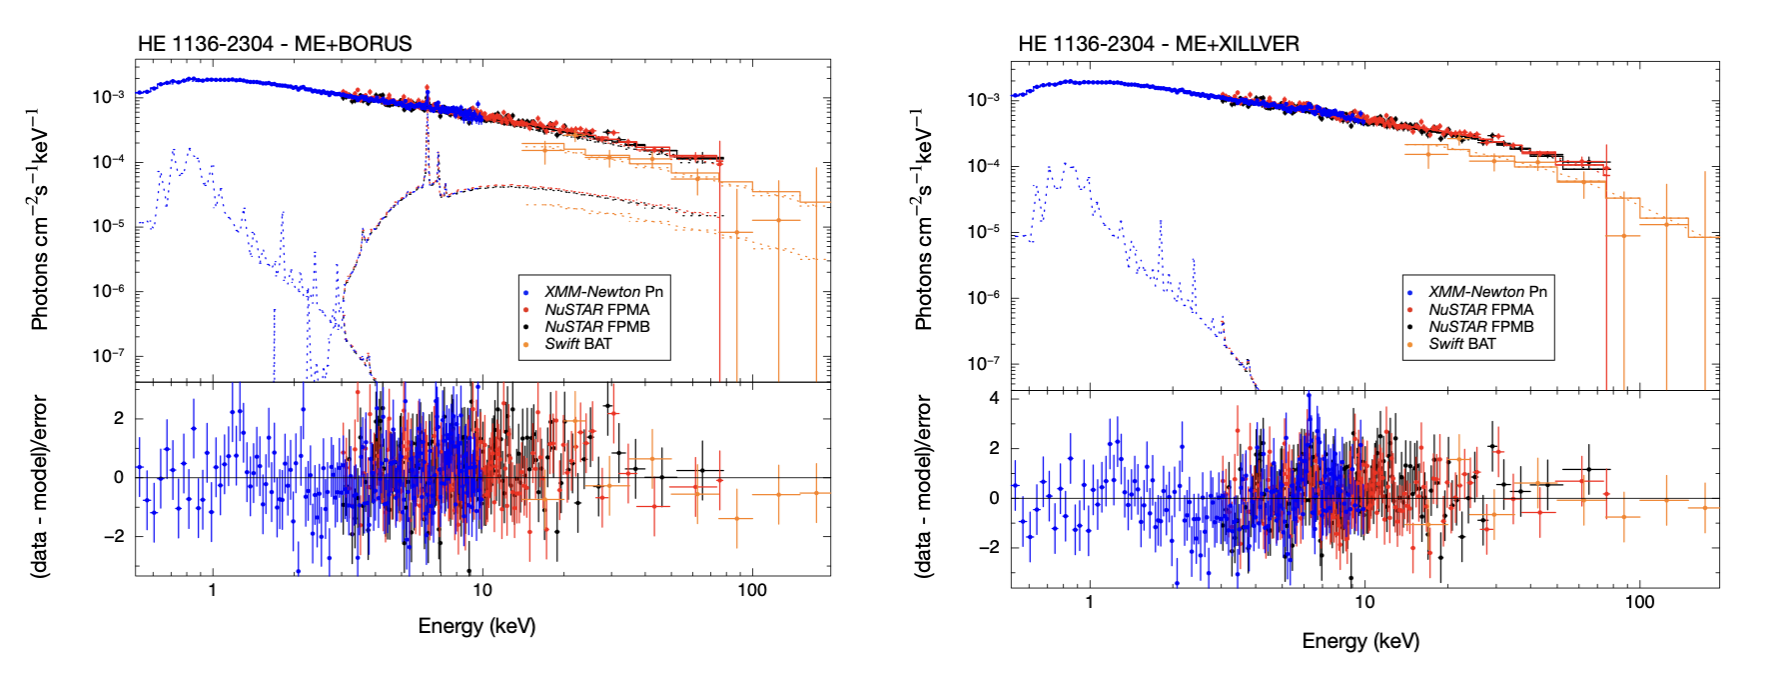
| HE 1136-2304 | 5.31E-15 | Torus |
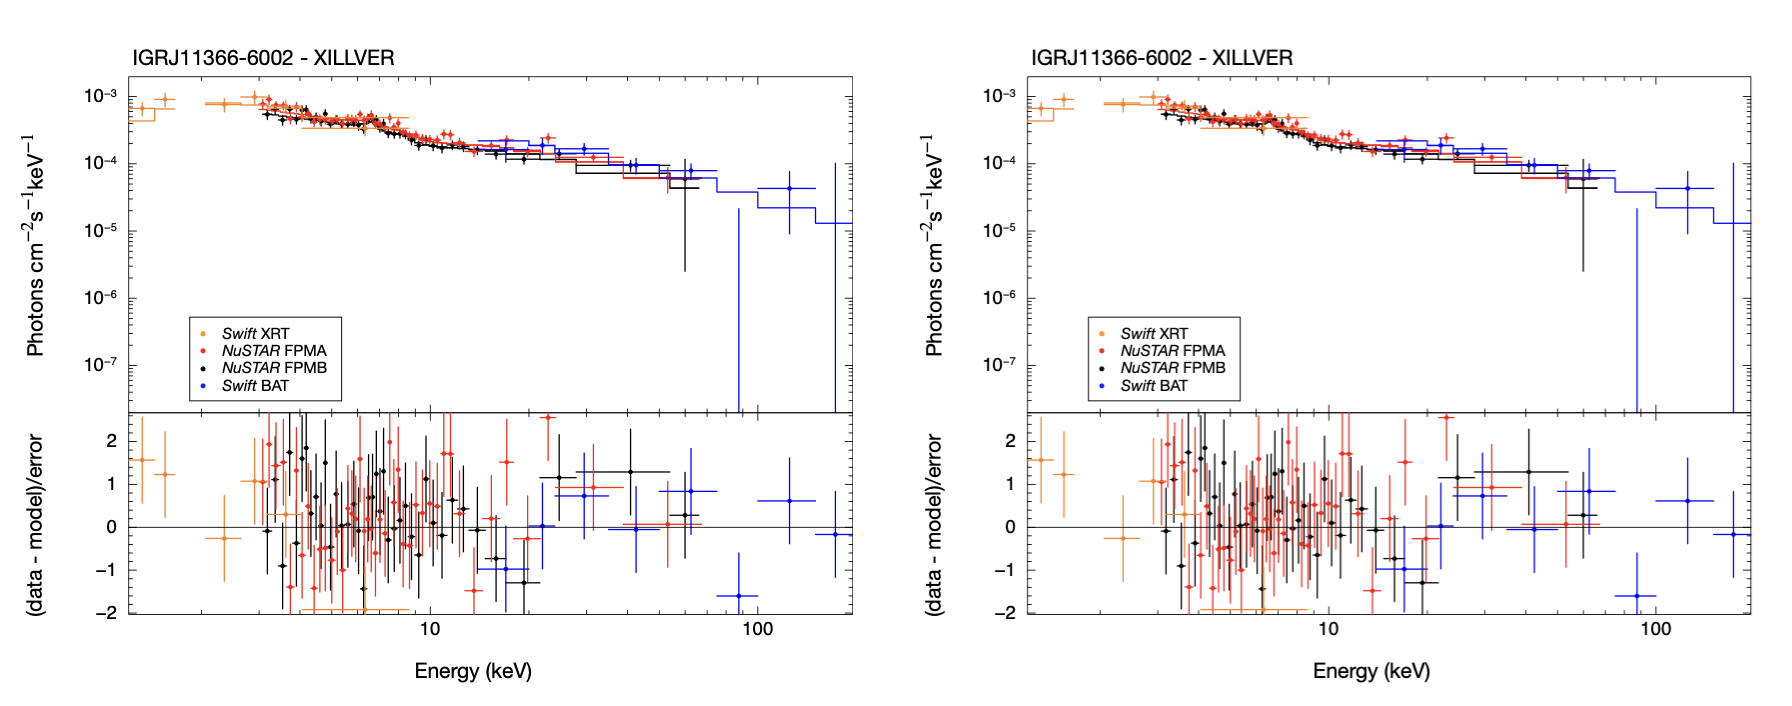
| IGRJ 11366-6002 | 2.49E+00 | T/D |
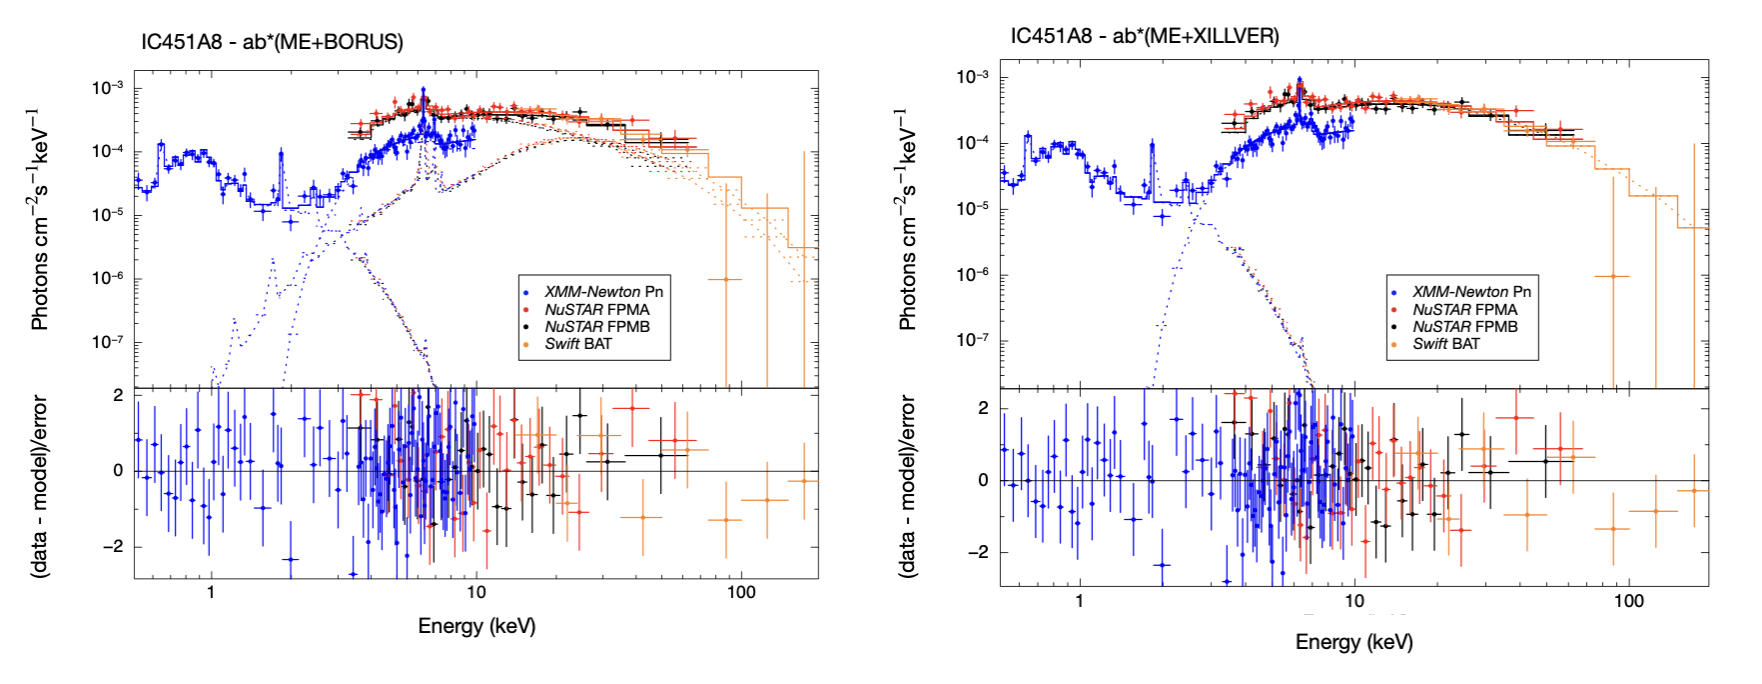
| IC 4518A | 1.18E-06 | Torus |
| NGC 7674* | 2.23E+02 | D |
For nine (53) objects (NGC 4258,NGC 1052, NGC 2110, LEDA 96373, NGC 2992, M 51, HE 1136-2304, IC 451A, and NGC 5033) borus02 is preferred. Then in the following sections, we choose this model as the best representation of the data in these objects. On the other hand, two (12) objects (NGC 2273 and NGC 7674) are well fitted with a disk (XILLVER) model and in six (35) objects (NGC 3998, NGC 3718, ESO 253-G003, NGC 2655, NGC 3147, and IGRJ 11366-6002) both models fit similarly well the data.
Since it is not possible to distinguish between a reflection dominated by a torus or a disk, we will treat them separately in the following sections. When referring to the torus case, we refer to all borus02 models for the whole sample (15 galaxies: indistinguishable and distinguishable cases). In the disk case, we refer to the XILLVER model, considering the indistinguishable cases and the cases where the disk is a good representation of the data (8 galaxies in total), since in the other cases a torus model is not a good representation of the data.
5.1.1 X-Ray Continuum Properties
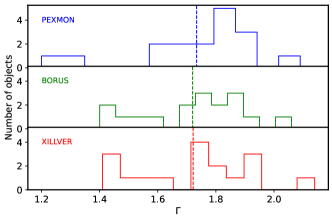
The X-ray continuum of AGN is described by a power law with a high-energy cutoff. The free parameters of this component are the spectral index () and the high energy of the cut-off (Ecut). In Fig. 2 we show the histogram derived from the broadband spectral analysis with each reflection model. Note that the spectral index between both the reflected and intrinsic emission are tied. We find that the mean values (dashed vertical lines) of for the sample using PEXMON, borus02 and XILLVER are consistent (1.730.21, 1.720.17 and 1.720.20 respectively). Note that the simplest model used in our analysis is PEXMON, which shows values of the photon index consistent with more geometrical models.
Considering the torus model (15 galaxies), we found median values of = 1.76 and =0.16, with values ranging between [1.40, 2.06]. Another important parameter that could be estimated with the NuSTAR data is the high energy cut-off (Ecut). This parameter can be considered as an indicator of the temperature of the X-ray corona. Consequently, its knowledge provides information about the dynamics of the corona and the physical processes occurring within it. Nevertheless, this parameter is poorly constrained. A lower (upper) limit of Ecut could be determined for eight (two) sources. The five AGN for which Ecut could be determined (NGC 3998, ESO 253-G003, NGC 2110, NGC 2992, and NGC 5033) have a mean value of Ecut=193.28 keV with a standard deviation of =99.19 keV.
Furthermore, taking into account the disk model (8 galaxies), we found median values of =1.71 and =0.23, with values ranging between [1.40, 2.06]. Regarding the high energy cut-off, we could find five (one) lower (upper) limits and for six objects we obtained a mean value of Ecut=371.47.58 keV with a standard deviation of =619.99 keV.
5.1.2 Soft band spectral fit
In the soft (0.3 – 10.0 keV) energy band, we added a thermal (MEKAL in xspec), scattered power-law, absorption by ionized gas (also referred to as “warm absorption”) (modelled with zxipcf in xspec) or a combination of these components to improve the spectral fit.
When considering the torus model (15 objects), six objects (NGC 3998, ESO 253-G003, NGC 3147, M 51, IGRJ 11366-6002, and NGC 5033) do not require an additional component to improve the fit. Two objects (NGC 3718 and HE 1136-2304) required a MEKAL component (with kT=0.88 keV and kT=0.59 keV, respectively). Two objects are well-fitted with a combination of MEKAL, power-law, and warm absorber (NGC 1052 with MEKAL+PL and NGC IC 451A with MEKAL*ab). Composite models are needed for five galaxies (NGC 4258, NGC 2655, NGC 2110, LEDA 96373, and NGC 2992). In the cases where two MEKAL were required, the values of the temperatures are in the range kT1 = [0.58 - 0.62] keV with a mean value of kT1=0.60 keV and =0.02 keV, and kT2 = [0.15 - 0.22] keV with a mean value of KT2=0.19 keV and =0.03 keV. The mean value of the ionized absorber is NH,W=1.66 1022 cm-2 and =1.41 1022 cm-2 The degree of ionization is in the range [-1.14, 4.30] with the mean =1.31 and =1.99.
In relation to the disk model (8 objects), five galaxies do not require any component to improve the spectral fit (NGC 3998, ESO 253-G003, NGC 3147, IGRJ 11366-6002 and NGC 7674). One galaxy (NGC 3718) require a MEKAL component to improve the fit. Two galaxies (NGC 2655 and NGC 2273) are well-fitted with a composite model, MEKAL*ab.
5.1.3 Line-of-sight column density
Absorption of X-rays by neutral material is the result of the combined effect of Compton scattering and photoelectric absorption. The Compton scattering and the photoelectric absorption were modelled using CABS and ZPHABS in xspec respectively. In ZPHABS, we fixed the redshift at the value of each source. The only free parameter is the column density, which is tied in all fits (i.e., ).
According to the torus model, we can classify six galaxies as unobscured (¡22) (NGC 3998, NGC 3147, NGC 2992, HE 1136-2304, IGRJ 11366-6002 and NGC 5033) with values between =[20.0, 21.89] and eight galaxies (NGC 3718, NGC 4258, ESO 253-G003, NGC 1052, NGC 2655, NGC 2110, IC 451A, and LEDA 96373) as obscured (22¡()¡24.18) with values ranging =[22.01, 24.09]. According to our spectral analysis, one galaxy (M 51) in our sample can be classified as Compton thick (CT) (using as a threshold Ncm-2, or =24.18). The mean values of spectral index, column density in the line of sight, and column density of the torus are reported in Table 7. All the parameters are consistent between the groups. Note that the values of the cross-calibration constant between the groups are consistent.
Regarding the disk model, two galaxies (NGC 3998 and IGRJ 11366-6002) can be classified as unobscured. Six galaxies (NGC 3718, ESO 253-G003, NGC 2655, NGC 3147, NGC 2273, and NGC 7674) as obscured with values =[22.03, 23.36]. The mean values of the spectral index, the column density in the line of sight, the ionization degree of the accretion disk, and the reflection fraction are reported in Table 7 and showed values consistent between the categories. Note that according to a reflection dominated by an accretion disk, none of the galaxies in our sample can be classified as CT.
| Group | |||
|---|---|---|---|
| Unobscured (6) | 1.800.12 | 20.850.56 | 23.450.68 |
| Obscured (8) | 1.740.17 | 22.990.65 | 23.650.58 |
| Group | R | |||
|---|---|---|---|---|
| Unobscured (2) | 1.850.05 | 21.901.32 | 3.610.47 | 3.970.12 |
| Obscured (6) | 1.740.26 | 22.900.44 | 2.430.77 | 6.593.29 |
5.1.4 The reflection component
The reflection features observed in the hard X-ray spectra of AGN may be caused by neutral and distant material such as the torus or by the ionized material of the accretion disk.
For the case where the reflection is dominated by the torus, the mean value of our sample for the column density for this structure is =23.69 and =0.76 with values between [22.50, 25.40]. Four objects (NGC 1052, M 51, IGRJ 11366-6002, and IC451A) show a column density of the torus consistent with a Compton thick structure. Another important parameter derived from the torus reflector model is the covering factor. We were only able to determine a lower (upper) limit for three (six) objects (a lower limit for NGC 3998, NGC 2655, and IC451A, and an upper limit for NGC 3718, NGC 4258, ESO 253-G003, NGC 3147, NGC 2992, and M 51). This parameter was determined for six () objects (NGC 1052, NGC 2110, LEDA 96373, HE 1136-2304, IGRJ 11366-6002, and NGC 5033) with a mean value of CF =0.59 and =0.25. The half-opening angle of the polar cutouts, cos(), is also measured with the torus model. However, we obtain only lower (upper) limits for seven (three) objects and properly constrained it for five sources.
To the disk-like reflection, we constrain the value of the ionization degree of the accretion disk in six galaxies (NGC 3718, ESO 253-G003, NGC 3147, NGC 2273, IGRJ 11366-6002 and NGC 7674), we found median values of ionization degree of the disk of =2.44 and =0.81. In one (one) objects, we only obtain upper (lower) limit (NGC 3998 a lower limit and NGC 2655 an upper limit). Regarding the reflection fraction, Rf, we performed a test by fixing the value of to 0 and comparing the reflection fraction obtained with this XILLVER configuration and PEXMON. For the sample, we found consistent values between both models. However, since our goal is to restrict the accretion disk features, we left the ionization degree as a free parameter. We obtain six lower limits, one upper limit (NGC 2655) and it is constrained in one case (NGC 7674). This model also allows us to estimate the inclination, and this parameter is constrained in five sources with mean value Incl=70.10 deg and =27.23 deg and four upper limits.
5.1.5 Flux and Luminosity
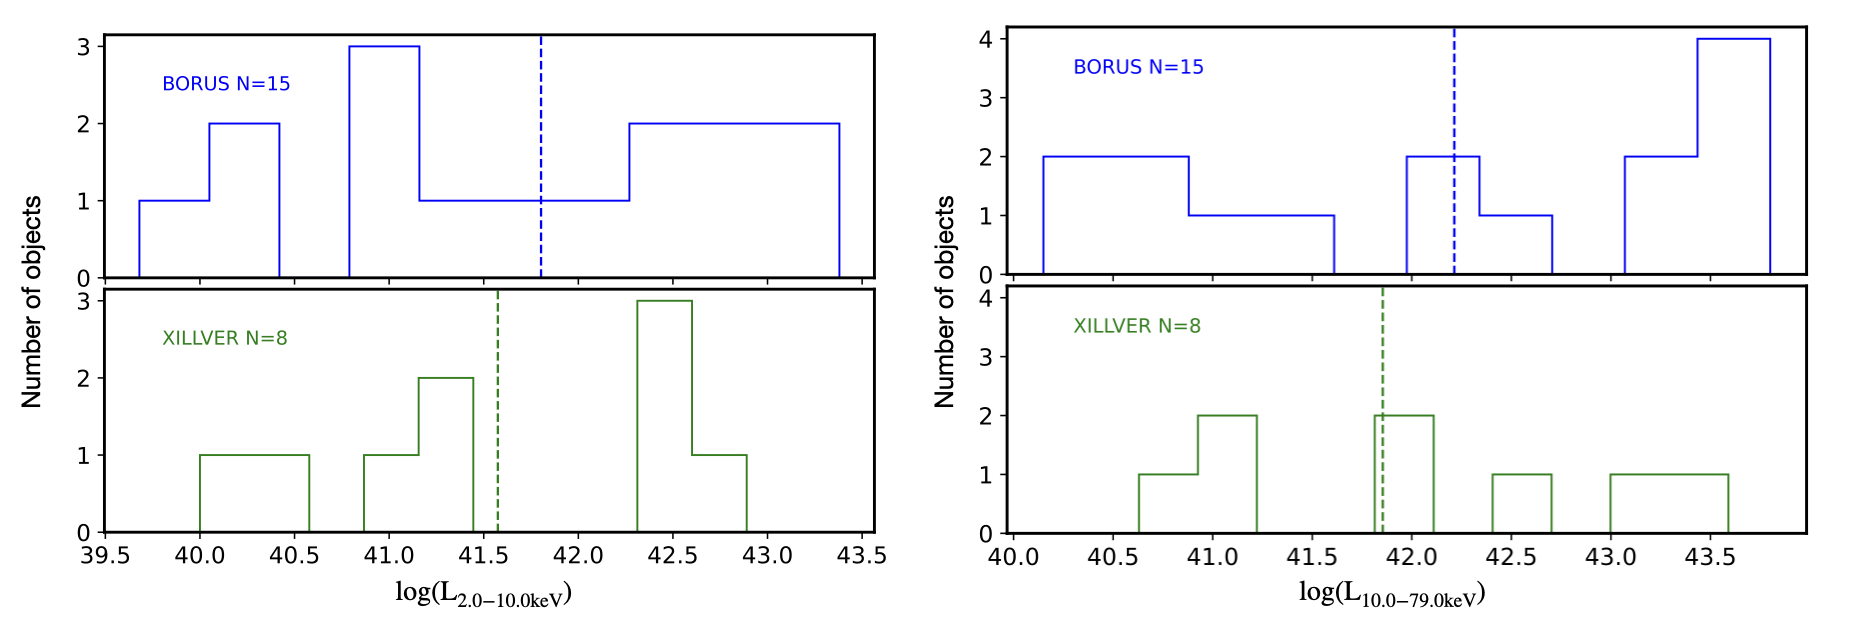
We computed the X-ray flux and luminosity in two energy bands: 2.0 – 10.0 keV and 10.0– 79.0 keV using xspec. Note that the redshift of the sources was taken from NASA/IPAC Extragalactic Database (NED). The values can be seen in Table 14. Taking into account a torus model, the mean value of the intrinsic luminosities in the borus02 case are =41.73 and =1.16 =42.14 with =1.29. In the XILLVER case, we found =41.57 with =1.06 and =41.85 with =1.24, and they are equivalent. The distribution of the intrinsic luminosity obtained in both cases can be seen in Fig. 3.
6 Discussion
We have performed the X-ray spectral analysis of an AGN sample with accretion rates, -3 selected from the BASS/DR2 that have available NuSTAR + XMM-Newton + Swift data. Models from a neutral reflector (PEXMON), reflection from an ionized accretion disk (XILLVER) and from the torus (borus02) have been used to fit the data. This sample is composed of 17 objects, and our main results are summarized as follows:
-
1.
In our sample, six (35) objects are equally well-fitted with a disk or with a torus-like reflector. For nine (53) galaxies, the torus reflection model is the best representation of the data. In two cases (12) the disk model well fits the data.
-
2.
When modeling the reflection with borus02, seven objects are well-fitted by a single neutrally-absorbed cut-off power-law plus reflection (i.e., no components are required in the soft band). When modeling the reflection with XILLVER instead, five objects can be well modeled in the same way. The remaining objects require the addition of a MEKAL and/or scattered power law, an ionized absorber, or a combination of two or more of these components.
-
3.
According to the torus model, six sources can be classified as unobscured ((NH)¡22), eight galaxies as obscured (22¡(NH)¡24.18) and one object have a column density in the line of sight consistent with a Compton thick source ((NH)¿24.18). According to the disk reflection, two (six) objects can be classified as unobscured (obscured). These classifications are consistent among the models, except in the case of NGC 3147 (unobscured according to the torus and obscured with the disk).
The high quality and broad spectral coverage available combining XMM-Newton +NuSTAR +Swift allowed us to put constraints on spectral parameters related to the accretion mechanism and reflection of LLAGN. Our analysis covers energies above 10.0 keV, where the reflection has an important role in the spectral fit, and considering this feature in the X-ray spectral analysis can affect the estimation of the coronal parameters (see Diaz et al. 2020). In the following, we discuss the physical interpretations of the results presented in this paper.
6.1 Determination of the
The selection of the sample presented in this work was based on sources with -3 according to those values reported in BASS/DR2. However, because variability is one of the properties that characterize AGN, we will estimate these accretion rates using the data that have been analyzed here.
To estimate , we follow the relation given in Eracleous et al. (2010), which uses the black hole mass and bolometric luminosities. According to Koss et al. (2017), the black hole masses available for the BASS sources were determined using different methods. For 14 of our sources, these were estimated using the velocity dispersion method, from the MBH- relation by Kormendy & Ho (2013). Two galaxies have MBH taken from the literature (NGC 3998 via the M- relation and NGC 4258 by a rotating H2O maser disk) and for one source it was estimated from the MgII emission line (ESO 253-G003). The uncertainties on these MBH determinations are 0.3-0.4 dex (as explained in the BASS/DR1 paper - Koss et al. 2017). We conservatively assume that the typical uncertainty on MBH is 0.4 dex.
The other key parameter is the bolometric luminosity; the best method to estimate it is by the integrated area under the spectral energy distribution (SED). However, observations from a variety of telescopes are necessary in order to build up a complete and detailed SED. The bolometric correction is another way to estimate it, which depends on the X-rays luminosity, and it is the one we will be using in this work. For instance, BASS/DR1 (Koss et al. 2017) focused on the bolometric correction derived by Vasudevan & Fabian (2007, 2009), where Lbol/L2-10keV = 20 for 0.4, and LBol/L2-10keV = 70 for 0.4.
As the bolometric luminosity is fundamental in the estimation of the accretion rate, we examine an alternative determination of based on the available X-ray luminosity estimated using the data of our sample of AGN.
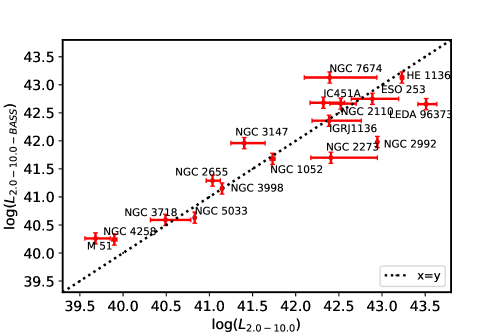
We use the intrinsic luminosity in the 2–10 keV rest-frame energy range, L2.0-10.0keV, derived from the best-fitting spectral models of the X-ray data. Note that in the case of indistinguishable cases, we use the values from the borus02 model. Using the XILLVER model, the results are the same. A comparison between our calculation and the BASS/DR2 is presented in Fig. 4, showing differences in the luminosity, possibly related with variability. The difference between the fluxes measured by BASS/DR2 integrated 70 months and the flux measured in the short exposures with NuSTAR that we use here can be quite large for highly variable sources such as NGC 2992 (Gilli et al. 2000; Shu et al. 2010; Hernández-García et al. 2017; Marinucci et al. 2018, 2020) and LEDA 96373 (Landi et al. 2009).
To be consistent between the state of each AGN when measuring and other parameters, we recalculate using the fluxes measured here and refine it by changing the bolometric correction as described below.
We use our L2.0-10.0keV calculation in combination with the bolometric correction K(2.0-10.0 keV) from Duras et al. (2020), who used a sample of 1000 type 1 and type 2 AGN from five different AGN surveys for which they performed a SED -fitting. They reported a bolometric correction as a function of 2.0-10.0 keV X-ray luminosity. The resulting K(2.0-10.0 keV) are slightly smaller than those used previously (Lbol/L2-10keV = 20), with a median value of K(2.0-10.0 keV)= 15.60 with a scatter of 0.37 dex (Duras et al. 2020). The values of bolometric luminosity and Eddington ratio are given in table 19. The errors in the bolometric luminosity correspond to the error propagation of MBH (0.4 dex), K(2.0-10.0 keV) (0.37 dex), and L2-10keV (estimated with xspec). In the following analysis, we will use these values to minimize the effects of source variability.
6.2 Accretion mechanism: The vs relation
It has been suggested that the accretion mechanism in LLAGN (¡10-3) is different from that in more powerful AGN (e.g., Seyferts) and similar to that of X-ray binaries (XRB) in their low/hard state (Yamaoka et al. 2005; Gu & Cao 2009; Younes et al. 2011; Xu 2011; Yuan & Narayan 2014; Hernández-García et al. 2016).
Some authors, following the relations obtained for XRB, have studied the accretion mechanism using the relation between the spectral index and the accretion rate , finding a positive correlation between these quantities at high accretion rates, suggesting a geometrically thin and optically thick disk, known as the standard model for accretion disks (Shakura & Sunyaev 1973; Koratkar & Blaes 1999). A negative correlation has also been found at low accretion rates, indicating radiatively inefficient accretion (e.g., Yuan et al. 2007). In this configuration, the accretion disk becomes truncated near the SMBH, with a geometrically thick and optically thin disk at lower radii and a thin disk at higher radii. However, these correlations show a large scatter (Shemmer et al. 2006; Gu & Cao 2009; Younes et al. 2011; Yang et al. 2015a; Trakhtenbrot et al. 2017; She et al. 2018), with values between [1,3] (Gu & Cao 2009; Younes et al. 2011) and [0.5, 3.5] (She et al. 2018). The high scatter in the spectral index estimate is still not understood - it could be due to the sensitivity of the measurements or to the intrinsic properties of the galaxies.
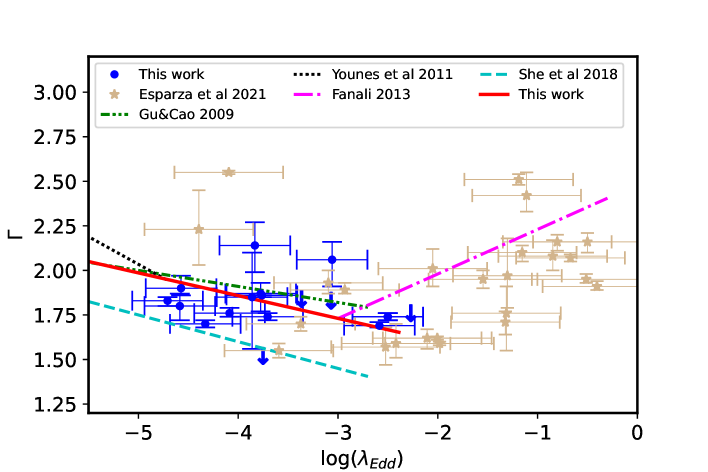
Thanks to the excellent statistics of NuSTAR in combination with XMM-Newton , we were able to better constrain the spectral index in our low accretion rate sample. In Fig. 5 we show the relation between and using the best fitting reflection model (borus02). We have added data from Esparza-Arredondo et al. (2021), who studied the torus configuration of 36 AGN using NuSTAR and Spitzer data and estimated the spectral parameters using the same reflection model used in this work (borus02). We applied the same bolometric correction to these data (see Sect. 6.1). In Fig. 5, the blue points correspond to this work and the light yellow stars represent the data points from Esparza-Arredondo et al. (2021).
In order to check whether there exists a break in this relation, as in XRB, we will test different scenarios. We started fitting a 1st-degree polynomial to the data, using the polyfit tool in python to perform this analysis. However, previous works reported a break in the correlation (see, for example, She et al. 2018), where a 1st-degree polynomial with a negative slope is found on one side and a positive slope on the other. Then, we used piecewise-regression888https://github.com/chasmani/piecewise-regression tool in python (Pilgrim 2021), to test the existence of the breakpoint. This package fits breakpoint positions and linear models for the different fit segments, and it gives confidence intervals for all the model estimates (see Muggeo 2003 for more details). We found a breakpoint at =-2.39 with 0.45, in agreement with what was previously obtained by She et al. (2018), who proposed a break at -2.5. To determine which model (with a breakpoint or not) best represents the data, we use the Bayesian information criterion (BIC), where the model with the lowest BIC value is considered the best. With no break, BIC is -113.2, and with a break, it is -115.5. This suggests that the model with a breakpoint at represents well the data, i.e., AGN seems to follow the same relation as XRB. We also explored, the possibility of more breakpoints, and it does not change the previous result.
In Figure 5 we also plot the relations given by other authors for comparison. For high luminosity AGN ( ¿-2.39), we compare with Fanali et al. (2013), who studied a sample of 71 type 1 AGN using XMM-Newton data (purple dashed line). In the low luminosity branch ( ¡ -2.39), we compare with Gu & Cao (2009), which used a sample of 55 LLAGN using Chandra and XMM-Newton data (green dashed line); She et al. (2018) used a sample of 314 AGN with Chandra (cyan dashed line); and Younes et al. (2011) used Chandra and XMM-Newton data from a sample of 13 LINER with accretion rates below -4.5 (black dashed line).
In this work, we have shown that the inclusion of XMM-Newton + NuSTAR data and reflection models in the spectral fit improves the estimation of the spectral index - as also reported in Hinkle & Mushotzky (2021) - which could improve the scatter compared to what was previously found by Gu & Cao (2009); Younes et al. (2011); She et al. (2018). For details on the improvement of the uncertainties in the spectral index estimation, see Appendix C. Indeed, in Fig. 5 can be seen that our results, when compared with previous studies, seem to agree with the correlations found by Gu & Cao (2009), She et al. (2018), and Younes et al. (2011), but the effect of the large scatter in previous studies can be appreciated. The same is true for the high-accretion branch, where the relation of Fanali et al. (2013) (at ¿ -2.39) fits well the data of Esparza-Arredondo et al. (2021).
To determine whether there is a relation between and , we use the tool pymccorrelation in Python (Isobe et al. 1986; Curran 2014; Privon et al. 2020) to test the relationship between two variables. This tool is able to calculate Pearson’s r, Spearman’s , and Kendall’s correlation coefficients. In this work, we use the Kendall correlation test, a non-parametric method for measuring the degree of association of two variables in censored data (upper/lower limits) and taking into account the uncertainties in the parameters (see Akritas & Siebert 1996; Isobe et al. 1986 for a detailed explanation of the calculus). A Kendall’s close to zero indicates that there is no trend, and if they are perfectly related, Kendall’s becomes 1.0 (or -1.0 for an anti-correlation). For the LLAGN, ) ¡ -2.39, Kendall’s correlation coefficient is =-0.27. However, possibly because of the small number of sources, the associated p-value is 0.06, so the correlation is not formally significant and confirmation would require a larger sample. Note that our result is also consistent with a flat correlation for these objects. In the high luminosity branch ( ¿ -2.39), we obtain =0.39 and a corresponding p-value of check 0.02, consistent with a positive correlation for high accreting sources. Thus, it appears that our sample provides evidence of a - relation that is consistent with previous studies, although at lower statistical significance. In any case, the change in correlation between these parameters at -2.39 highlights the change in accretion physics between high- and low-luminosity AGN, consistent with previous studies (Shemmer et al. 2006; Younes et al. 2011 and reference therein).
Despite the small number of sources in our sample, we study the anti-correlation of the sample presented here using the tool linregress in Python. Then, for the low-luminosity branch where ¡ -2.39:
Our work allowed us to identify the change in correlation between the spectral index and the accretion rate at -2.39, which is highly suggestive of a change in accretion physics in AGN. We recall that a larger sample of sources combining XMM–Newton and NuSTAR data and fitting physical reflection models would be very useful to confirm this relation.
6.3 Reflection
An important feature in the spectra of AGN is the reflection that imprints its mark at X-ray energies. The shape of this reflection component is characterized by the FeK emission line and the Compton hump, peaking at 30 keV (Pounds et al. 1990). The gas producing the X-ray reflection in AGN could be related to the accretion disk, a neutral reflector such as the torus, or a combination of both emissions. Because we cannot separate these scenarios, in the following we will analyze the scenarios in which each of the structures dominates the X-ray spectra.
We started our analysis, by studying the torus-like reflector. Previous studies suggest a relation between the torus properties and the accretion rate. For example, Müller-Sánchez et al. (2013), used observations of VLT/SINFONI AO-assisted integral-field spectroscopy of H2 1–0 S(1) emission of four LLAGN (NGC 1052, NGC 2911, NGC 3169 and NGC 1097), and found that on scales of 50–150 pc, the spatial distribution and kinematics of the molecular gas are consistent with a rotating thin disk, where the ratio of rotation (V) to dispersion () exceeds the unity. However, in the central 50 pc in their sample, the observations reveal a geometrically and optically thick structure of molecular gas (V/¡1 and ¿1023 cm-2). This can be associated with the outer extent of any smaller-scale obscuring structure. In contrast to Seyfert galaxies, the molecular gas in LLAGN has V/¡1 over an area that is nine times smaller and column densities that are on average three times smaller. They interpret these results as evidence for a gradual disappearance of the nuclear-obscuring structure, also in agreement with what was previously found by González-Martín et al. (2017) using a sample of 109 AGN using IRS/Spitzer observations.
Later, Ricci et al. (2017b) found that the probability of a source being obscured in the X-rays (covering factor of gas) depends primarily on the Eddington ratio instead of on absolute luminosity. They propose that the radiation pressure on dusty gas is responsible for regulating the distribution of obscuring material around the central black hole. At high accretion rates, radiation pressure expels the obscuring material in the form of outflows (Fabian 2006). However, this work was made for the line of sight (LOS) column density, which is different from the torus column density (NH-LOS ). Here we will analyze, the relation between the column density of the torus-like reflector and the Eddington ratio. We plot this relation in Fig. 6 and the values obtained in this work are presented in Table 10. The pink circles and light yellow stars are the data points of the best fit model (borus02 in the indistinguishable cases) in this work and the ones obtained by Esparza-Arredondo et al. (2021), respectively. The blue points represent the binned data points for a bin size equal to 0.5 dex in .
Using Kendall’s tau correlation coefficient we found a correlation coefficient of =0.22 and p-value of 0.04 for a torus-like reflector and , suggestive of a correlation – but confirmation is required using a larger sample. As the parameters seem to be positively correlated, we perform a linear regression of the data using polyfit in python, and we found the following relation:
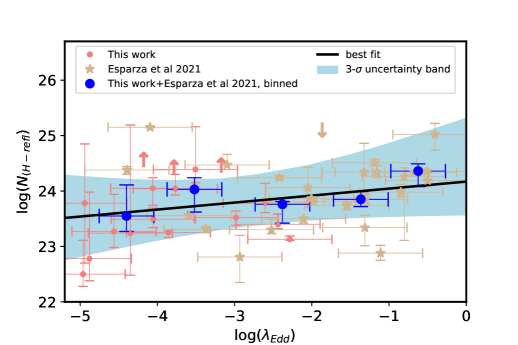
Therefore, we find that our data is consistent with the scenario where lower accretion rate objects have, on average, lower column density material in their surroundings. However, due to the size of the sample, our correlation shows a high dispersion, then it is also consistent with being flat at 3. We note that our torus fits allow for a free covering factor, so the lower column densities are not a consequence of a fixed covering factor in the model and a geometrically thinner reflector in lower accretion rate objects. For the LLAGN (¡-2.39) we obtain a mean value of the torus column density cm=23.76 with =0.74 and in the high luminosity regime, cm=24.09 with a standard deviation =0.56. Consequently, our result is in line with the results in the infrared, which suggested a gradual disappearance of the torus (Müller-Sánchez et al. 2013; González-Martín et al. 2017) and in agreement with the scenario proposed by Ricci et al. (2022), where it is expected that LLAGN has lower column density. They proposed a model in which AGN move in the obscuration–accretion rate plane during their life cycle. The growth of AGN begins with an unobscured AGN accreting at -4. Then, an accretion event then takes place, in which the SMBH is fueled, and as a result the accretion rate, column density, and covering fraction all increase. As a consequence, obscured AGN are preferentially observed. When the Eddington limit for dusty gas is reached, the covering factor and the column density will decrease, leading to an unobscured AGN being typically observed. As the remaining fuel is depleted, the SMBH goes back into a quiescent phase (see Ricci et al. 2022 for more details). Even with small statistics, our results can be interpreted within the framework of this evolutionary model, in which radiation pressure regulates their evolution.
Then, we compare the column density of the reflector and the column density in the line of sight (LOS). Zhao et al. (2021), using all AGN in the 100-month Palermo Swift/BAT catalog with line-of-sight column density between 1023 and 1024 cm-2 with available NuSTAR data shows that the average torus column density is similar for both Compton thin and CT-AGN, independent of the observing angle, with cm 24.15. In Fig. 7 we compare the column density of the torus and the absorption in the line of sight of our work. The black dotted line represents the mean value of cm previously found by Zhao et al. (2021), and the green zone the interval of (N of their work. Note that our data points and their fit are in agreement in the interval of (LH-LOS) of their work, i.e. for the moderately obscured sources in our sample. The majority of galaxies with (LH-LOS)¡23.0 in our sample are clearly below the value previously obtained, with a mean value of cm 23.36 and .
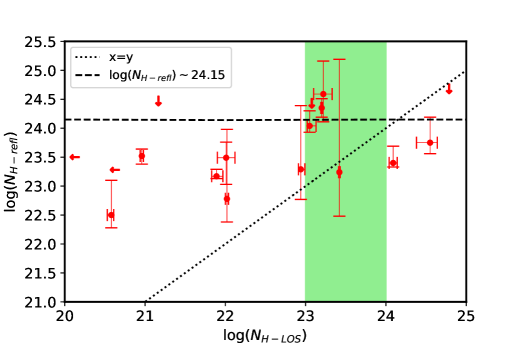
In order to explore any correlation between these parameters, we calculate the Kendall correlation coefficient, and we found =-0.17 and p-value of 0.51, suggestive of a negative correlation but compatible with a lack of correlation as well between them. Therefore, more data points are necessary to establish any correlation between these parameters. The majority of the objects show a larger (NH-refl) than (LH-LOS), suggesting that the torus is not seen through its densest part, consistent with what was reported by Zhao et al. (2021).
Regarding the covering factor of the torus-like reflector, we obtain a mean value of CF=0.64 and =0.26. Note that this parameter could be constrained for seven sources. For another seven sources, the best fitting value and an upper limit could be placed, and for an additional three, the best fitting value and lower limit could be placed. In addition, we analyze the correlation between this parameter and the accretion rate by the Kendall correlation test. We find a correlation coefficient =-0.06 and p-value of 0.73, suggesting that these parameters are not correlated.
Considering a disk-like reflector, we could constrain Rf only for one object (NGC 7674), while for the others we only obtain lower limits. Also, this model allows us to study the ionization degree of the disk, however, this parameter is also unconstrained with only six galaxies with well-constrained values and one upper limit and five lower limits.
The results presented in this paper suggest that the distribution of the gas in the torus in AGN is a dynamic and very complex structure, showing changes in the physical properties of the torus linked to the luminosity of the AGN, in agreement with what was previously found in the literature in the X-rays and the infrared. Certainly, combining XMM-Newton + NuSTAR is key to exploring the structure and distribution of the reflector and constraining its physical and geometrical parameters, especially in the low luminosity range.
7 Conclusions
In this work, we study the reflection of LLAGN by analyzing the broadband X-ray spectra of a BASS/DR2 sample with ¡ -3 (17 objects) using XMM-Newton +NuSTAR +Swift observations and characterizing the reflection features using the borus02 model to represent torus reflection and XILLVER to model accretion disk emission. The goal was to investigate the accretion mechanism by the relation between the spectral index and the accretion rate, as well as constraining the properties of the potential reflector. The main results are summarized below:
-
1.
All objects in our sample are well-fitted with a torus-like reflector. Of these, eight objects are equally well-fitted with a torus and a disk (they are indistinguishable from a statistical point of view and visual inspection). These eight objects have consistent values for the spectral index and luminosities when modeled with a torus or a disk reflector.
-
2.
In our sample we can classify six objects as unobscured ((NH)¡22), nine galaxies as obscured (22¡(NH)¡24.18) and two as Compton-thick (using as a threshold Ncm-2, according to the torus model). According to the disk case, all the galaxies can be classified as Compton thin.
-
3.
Combining XMM-Newton + NuSTAR and considering the reflection component in the spectral fitting, the uncertainties on the spectral index and the scatter in the relation between this parameter and the accretion rate are reduced when compared to previous works over similar ranges in accretion rate.
-
4.
Our work is consistent with the negative slope found in previous works at -3, and also consistent with the change in the relation at -3, where in high accretion rates sources, the slope is known to be positive.
-
5.
We found a tentative correlation between the torus properties (column density) and the accretion rate, suggesting that the torus has a decreasing column density with decreasing accretion rate. Consequently, AGN at ¡-3 has a lower torus column density compared with more luminous AGN. This column density is derived from reflection as opposed to absorption in the line of sight, so it is representative of the global column density of gas around the X-ray corona.
-
6.
All AGN in our sample with a column density in the line of sight, (NH-LOS) ¡ 23.0 have a torus with a column density higher than their (NH-LOS), then the torus could be observed through an underdense region.
In the future, new X-ray missions such as HEX-P (Madsen et al. 2019)999https://hexp.org/ facilities will detect a large sample of LLAGN, which could help us further constrain the evolution of the AGN reflection and the accretion physics behind SMBH.
Acknowledgements.
We thank the referee for the valuable comments that improved the manuscript. D.Y. acknowledges financial support from the Doctorate Fellowship program FIB-UV of the Universidad de Valparaíso and the Max Planck Society by a Max Planck partner group. LHG acknowledges funds by ANID – Millennium Science Initiative Program – ICN12009 awarded to the Millennium Institute of Astrophysics (MAS). ELN acknowledges financial support from ANID Beca 21200718. CR acknowledges support from the Fondecyt Iniciacion grant 11190831 and ANID BASAL project FB210003. MB acknowledges support from the YCAA Prize Postdoctoral Fellowship. NOC acknowledges support from CONACyT. J.A.G. acknowledges support from NASA grant 80NSSC21K1567.References
- Akritas & Siebert (1996) Akritas, M. G. & Siebert, J. 1996, MNRAS, 278, 919
- Arnaud (1996) Arnaud, K. A. 1996, in Astronomical Society of the Pacific Conference Series, Vol. 101, Astronomical Data Analysis Software and Systems V, ed. G. H. Jacoby & J. Barnes, 17
- Awaki et al. (2009) Awaki, H., Terashima, Y., Higaki, Y., & Fukazawa, Y. 2009, PASJ, 61, S317
- Balmaverde & Capetti (2014) Balmaverde, B. & Capetti, A. 2014, A&A, 563, A119
- Baloković et al. (2018) Baloković, M., Brightman, M., Harrison, F. A., et al. 2018, ApJ, 854, 42
- Baloković et al. (2021) Baloković, M., Cabral, S. E., Brenneman, L., & Urry, C. M. 2021, ApJ, 916, 90
- Barth et al. (1999) Barth, A. J., Filippenko, A. V., & Moran, E. C. 1999, ApJ, 525, 673
- Barthelmy et al. (2005) Barthelmy, S. D., Barbier, L. M., Cummings, J. R., et al. 2005, Space Sci. Rev., 120, 143
- Bassani et al. (1999) Bassani, L., Dadina, M., Maiolino, R., et al. 1999, ApJS, 121, 473
- Baumgartner et al. (2013) Baumgartner, W. H., Tueller, J., Markwardt, C. B., et al. 2013, The Astrophysical Journal Supplement Series, 207, 19
- Beckmann et al. (2007) Beckmann, V., Gehrels, N., & Tueller, J. 2007, ApJ, 666, 122
- Bianchi et al. (2019) Bianchi, S., Antonucci, R., Capetti, A., et al. 2019, MNRAS, 488, L1
- Bianchi et al. (2005) Bianchi, S., Guainazzi, M., Matt, G., et al. 2005, A&A, 442, 185
- Bianchi et al. (2017) Bianchi, S., Marinucci, A., Matt, G., et al. 2017, MNRAS, 468, 2740
- Bianchi et al. (2012) Bianchi, S., Panessa, F., Barcons, X., et al. 2012, MNRAS, 426, 3225
- Bradley et al. (2004) Bradley, L. D., Kaiser, M. E., & Baan, W. A. 2004, ApJ, 603, 463
- Brightman et al. (2018) Brightman, M., Baloković, M., Koss, M., et al. 2018, ApJ, 867, 110
- Brightman & Nandra (2011) Brightman, M. & Nandra, K. 2011, MNRAS, 413, 1206
- Burrows et al. (2005) Burrows, D. N., Hill, J. E., Nousek, J. A., et al. 2005, Space Sci. Rev., 120, 165
- Cazzoli et al. (2018) Cazzoli, S., Márquez, I., Masegosa, J., et al. 2018, MNRAS, 480, 1106
- Curran (2014) Curran, P. A. 2014, arXiv e-prints, arXiv:1411.3816
- Davies et al. (2015) Davies, R. I., Burtscher, L., Rosario, D., et al. 2015, ApJ, 806, 127
- de Rosa et al. (2008) de Rosa, A., Bassani, L., Ubertini, P., et al. 2008, A&A, 483, 749
- de Vaucouleurs (1991) de Vaucouleurs, G. 1991, MNRAS, 249, 28P
- Diaz et al. (2020) Diaz, Y., Arévalo, P., Hernández-García, L., et al. 2020, MNRAS, 496, 5399
- Dickey & Lockman (1990) Dickey, J. M. & Lockman, F. J. 1990, ARA&A, 28, 215
- Doi et al. (2013) Doi, A., Asada, K., Fujisawa, K., et al. 2013, ApJ, 765, 69
- Dumas et al. (2011) Dumas, G., Schinnerer, E., Tabatabaei, F. S., et al. 2011, AJ, 141, 41
- Duras et al. (2020) Duras, F., Bongiorno, A., Ricci, F., et al. 2020, A&A, 636, A73
- Emmanoulopoulos et al. (2016) Emmanoulopoulos, D., Papadakis, I. E., Epitropakis, A., et al. 2016, MNRAS, 461, 1642
- Eracleous et al. (2010) Eracleous, M., Hwang, J. A., & Flohic, H. M. L. G. 2010, ApJS, 187, 135
- Esparza-Arredondo et al. (2021) Esparza-Arredondo, D., Gonzalez-Martín, O., Dultzin, D., et al. 2021, A&A, 651, A91
- Fabian (2006) Fabian, A. C. 2006, in ESA Special Publication, Vol. 604, The X-ray Universe 2005, ed. A. Wilson, 463
- Fanali et al. (2013) Fanali, R., Caccianiga, A., Severgnini, P., et al. 2013, MNRAS, 433, 648
- Filho et al. (2002) Filho, M. E., Barthel, P. D., & Ho, L. C. 2002, A&A, 385, 425
- Frank et al. (2016) Frank, B. S., Morganti, R., Oosterloo, T., Nyland, K., & Serra, P. 2016, A&A, 592, A94
- Gandhi et al. (2017) Gandhi, P., Annuar, A., Lansbury, G. B., et al. 2017, MNRAS, 467, 4606
- García et al. (2013) García, J., Dauser, T., Reynolds, C. S., et al. 2013, ApJ, 768, 146
- Gehrels et al. (2004) Gehrels, N., Chincarini, G., Giommi, P., et al. 2004, ApJ, 611, 1005
- George & Fabian (1991) George, I. M. & Fabian, A. C. 1991, MNRAS, 249, 352
- Gilli et al. (2000) Gilli, R., Maiolino, R., Marconi, A., et al. 2000, A&A, 355, 485
- González-Martín et al. (2017) González-Martín, O., Masegosa, J., Hernán-Caballero, A., et al. 2017, ApJ, 841, 37
- González-Martín et al. (2009) González-Martín, O., Masegosa, J., Márquez, I., Guainazzi, M., & Jiménez-Bailón, E. 2009, A&A, 506, 1107
- Greenhill et al. (1995) Greenhill, L. J., Henkel, C., Becker, R., Wilson, T. L., & Wouterloot, J. G. A. 1995, A&A, 304, 21
- Gu & Cao (2009) Gu, M. & Cao, X. 2009, MNRAS, 399, 349
- Guainazzi et al. (2005) Guainazzi, M., Matt, G., & Perola, G. C. 2005, A&A, 444, 119
- Haardt & Maraschi (1993) Haardt, F. & Maraschi, L. 1993, ApJ, 413, 507
- Harrison et al. (2013) Harrison, F. A., Craig, W. W., Christensen, F. E., et al. 2013, ApJ, 770, 103
- Hayashi et al. (1996) Hayashi, I., Koyama, K., Awaki, H., & Yamauchi, S. U. S. 1996, PASJ, 48, 219
- Heckman (1980) Heckman, T. M. 1980, A&A, 87, 152
- Hernández-García et al. (2014) Hernández-García, L., González-Martín, O., Masegosa, J., & Márquez, I. 2014, A&A, 569, A26
- Hernández-García et al. (2015) Hernández-García, L., Masegosa, J., González-Martín, O., & Márquez, I. 2015, A&A, 579, A90
- Hernández-García et al. (2017) Hernández-García, L., Masegosa, J., González-Martín, O., et al. 2017, A&A, 602, A65
- Hernández-García et al. (2016) Hernández-García, L., Masegosa, J., González-Martín, O., Márquez, I., & Perea, J. 2016, ApJ, 824, 7
- Herrnstein et al. (2005) Herrnstein, J. R., Moran, J. M., Greenhill, L. J., & Trotter, A. S. 2005, ApJ, 629, 719
- Hinkle & Mushotzky (2021) Hinkle, J. T. & Mushotzky, R. 2021, MNRAS, 506, 4960
- Ho et al. (1997) Ho, L. C., Filippenko, A. V., Sargent, W. L. W., & Peng, C. Y. 1997, in Bulletin of the American Astronomical Society, Vol. 29, American Astronomical Society Meeting Abstracts #189, 735
- Ho & Ulvestad (2001) Ho, L. C. & Ulvestad, J. S. 2001, ApJS, 133, 77
- Hummel et al. (1984) Hummel, E., van der Hulst, J. M., & Dickey, J. M. 1984, A&A, 134, 207
- Isobe et al. (1986) Isobe, T., Feigelson, E. D., & Nelson, P. I. 1986, ApJ, 306, 490
- Kalberla et al. (2005) Kalberla, P. M. W., Burton, W. B., Hartmann, D., et al. 2005, VizieR Online Data Catalog, 8076
- Kawamuro et al. (2016) Kawamuro, T., Ueda, Y., Tazaki, F., Terashima, Y., & Mushotzky, R. 2016, ApJ, 831, 37
- Koratkar & Blaes (1999) Koratkar, A. & Blaes, O. 1999, PASP, 111, 1
- Kormendy & Ho (2013) Kormendy, J. & Ho, L. C. 2013, ARA&A, 51, 511
- Koss et al. (2017) Koss, M., Trakhtenbrot, B., Ricci, C., et al. 2017, ApJ, 850, 74
- Koss et al. (2016) Koss, M. J., Assef, R., Baloković, M., et al. 2016, ApJ, 825, 85
- Koss et al. (2022) Koss, M. J., Trakhtenbrot, B., Ricci, C., et al. 2022, ApJS, 261, 1, publisher: American Astronomical Society
- Krause & Oliver (1979) Krause, M. O. & Oliver, J. H. 1979, Journal of Physical and Chemical Reference Data, 8, 329
- Krips et al. (2006) Krips, M., Eckart, A., Neri, R., et al. 2006, A&A, 446, 113
- Krivonos et al. (2007) Krivonos, R., Revnivtsev, M., Lutovinov, A., et al. 2007, A&A, 475, 775
- Landi et al. (2009) Landi, R., Stephen, J. B., Masetti, N., et al. 2009, A&A, 493, 893
- Liu & Li (2014) Liu, Y. & Li, X. 2014, ApJ, 787, 52
- Madsen et al. (2019) Madsen, K., Hickox, R., Bachetti, M., et al. 2019, in Bulletin of the American Astronomical Society, Vol. 51, 166
- Mainieri et al. (2007) Mainieri, V., Hasinger, G., Cappelluti, N., et al. 2007, ApJS, 172, 368
- Malaguti et al. (1999) Malaguti, G., Bassani, L., Cappi, M., et al. 1999, A&A, 342, L41
- Malaguti et al. (1998) Malaguti, G., Palumbo, G. G. C., Cappi, M., et al. 1998, A&A, 331, 519
- Malizia et al. (2012) Malizia, A., Bassani, L., Bazzano, A., et al. 2012, MNRAS, 426, 1750
- Maoz (2007) Maoz, D. 2007, MNRAS, 377, 1696
- Marinucci et al. (2020) Marinucci, A., Bianchi, S., Braito, V., et al. 2020, MNRAS, 496, 3412
- Marinucci et al. (2018) Marinucci, A., Bianchi, S., Braito, V., et al. 2018, MNRAS, 478, 5638
- Marinucci et al. (2014) Marinucci, A., Matt, G., Kara, E., et al. 2014, MNRAS, 440, 2347
- Merloni et al. (2014) Merloni, A., Bongiorno, A., Brusa, M., et al. 2014, MNRAS, 437, 3550
- Moran et al. (2000) Moran, E. C., Barth, A. J., Kay, L. E., & Filippenko, A. V. 2000, ApJ, 540, L73
- Muggeo (2003) Muggeo, V. M. 2003, Statistics in medicine, 22, 3055
- Müller-Sánchez et al. (2013) Müller-Sánchez, F., Prieto, M. A., Mezcua, M., et al. 2013, ApJ, 763, L1
- Murphy & Yaqoob (2009) Murphy, K. D. & Yaqoob, T. 2009, MNRAS, 397, 1549
- Nandra et al. (2007) Nandra, K., O’Neill, P. M., George, I. M., & Reeves, J. N. 2007, MNRAS, 382, 194
- Nandra & Pounds (1994) Nandra, K. & Pounds, K. A. 1994, MNRAS, 268, 405
- Narayan et al. (1994) Narayan, R., Yi, I., & Mahadevan, R. 1994, arXiv Astrophysics e-prints [astro-ph/9411060]
- Oh et al. (2018a) Oh, K., Koss, M., Markwardt, C. B., et al. 2018a, ApJS, 235, 4
- Oh et al. (2018b) Oh, K., Koss, M., Markwardt, C. B., et al. 2018b, ApJS, 235, 4
- Oh et al. (2022) Oh, K., Koss, M. J., Ueda, Y., et al. 2022, ApJS, 261, 4, publisher: American Astronomical Society
- Osorio-Clavijo et al. (2020a) Osorio-Clavijo, N., González-Martín, O., Papadakis, I. E., Masegosa, J., & Hernández-García, L. 2020a, MNRAS, 491, 29
- Osorio-Clavijo et al. (2020b) Osorio-Clavijo, N., González-Martín, O., Papadakis, I. E., Masegosa, J., & Hernández-García, L. 2020b, MNRAS, 491, 29
- Osorio-Clavijo et al. (2022) Osorio-Clavijo, N., González-Martín, O., Sánchez, S. F., et al. 2022, MNRAS, 510, 5102
- Osterbrock (1981) Osterbrock, D. E. 1981, ApJ, 249, 462
- Paltani & Ricci (2017) Paltani, S. & Ricci, C. 2017, A&A, 607, A31
- Parker et al. (2015) Parker, M. L., Fabian, A. C., Matt, G., et al. 2015, MNRAS, 447, 72
- Parker et al. (2016) Parker, M. L., Komossa, S., Kollatschny, W., et al. 2016, MNRAS, 461, 1927
- Pérez-Torres & Alberdi (2007) Pérez-Torres, M. A. & Alberdi, A. 2007, MNRAS, 379, 275
- Pian et al. (2010) Pian, E., Romano, P., Maoz, D., et al. 2010, MNRAS, 401, 677
- Pilgrim (2021) Pilgrim, C. 2021, Journal of Open Source Software, 6, 3859
- Pogge et al. (2000) Pogge, R. W., Maoz, D., Ho, L. C., & Eracleous, M. 2000, ApJ, 532, 323
- Pounds et al. (1990) Pounds, K. A., Nandra, K., Stewart, G. C., George, I. M., & Fabian, A. C. 1990, Nature, 344, 132
- Privon et al. (2020) Privon, G. C., Ricci, C., Aalto, S., et al. 2020, ApJ, 893, 149
- Rees (1984) Rees, M. J. 1984, ARA&A, 22, 471
- Reeves et al. (2008) Reeves, J., Done, C., Pounds, K., et al. 2008, MNRAS, 385, L108
- Reeves et al. (2006) Reeves, J. N., Fabian, A. C., Kataoka, J., et al. 2006, Astronomische Nachrichten, 327, 1079
- Reynolds et al. (2009) Reynolds, C. S., Nowak, M. A., Markoff, S., et al. 2009, ApJ, 691, 1159
- Ricci et al. (2022) Ricci, C., Ananna, T. T., Temple, M. J., et al. 2022, arXiv e-prints, arXiv:2209.00014
- Ricci et al. (2017a) Ricci, C., Trakhtenbrot, B., Koss, M. J., et al. 2017a, ApJS, 233, 17
- Ricci et al. (2017b) Ricci, C., Trakhtenbrot, B., Koss, M. J., et al. 2017b, Nature, 549, 488
- Ricci et al. (2015) Ricci, C., Ueda, Y., Koss, M. J., et al. 2015, ApJ, 815, L13
- Risaliti et al. (1999) Risaliti, G., Maiolino, R., & Salvati, M. 1999, ApJ, 522, 157
- Rivers et al. (2014) Rivers, E., Markowitz, A., Rothschild, R., et al. 2014, ApJ, 786, 126
- Shakura & Sunyaev (1973) Shakura, N. I. & Sunyaev, R. A. 1973, in IAU Symposium, Vol. 55, X- and Gamma-Ray Astronomy, ed. H. Bradt & R. Giacconi, 155
- She et al. (2018) She, R., Ho, L. C., Feng, H., & Cui, C. 2018, ApJ, 859, 152
- Shemmer et al. (2006) Shemmer, O., Brandt, W. N., Netzer, H., Maiolino, R., & Kaspi, S. 2006, ApJ, 646, L29
- Shu et al. (2010) Shu, X. W., Yaqoob, T., Murphy, K. D., et al. 2010, ApJ, 713, 1256
- Strüder et al. (2001) Strüder, L., Briel, U., Dennerl, K., et al. 2001, A&A, 365, L18
- Takáts & Vinkó (2006) Takáts, K. & Vinkó, J. 2006, MNRAS, 372, 1735
- Terashima et al. (2000) Terashima, Y., Ho, L. C., & Ptak, A. F. 2000, ApJ, 539, 161
- Terashima et al. (2002) Terashima, Y., Iyomoto, N., Ho, L. C., & Ptak, A. F. 2002, ApJS, 139, 1
- Terashima et al. (1999) Terashima, Y., Kunieda, H., & Misaki, K. 1999, PASJ, 51, 277
- Terashima & Wilson (2002) Terashima, Y. & Wilson, A. S. 2002, in X-ray Spectroscopy of AGN with Chandra and XMM-Newton, ed. T. Boller, S. Komossa, S. Kahn, H. Kunieda, & L. Gallo, 279
- Trakhtenbrot et al. (2017) Trakhtenbrot, B., Ricci, C., Koss, M. J., et al. 2017, MNRAS, 470, 800
- Tueller et al. (2010) Tueller, J., Baumgartner, W. H., Markwardt, C. B., et al. 2010, ApJS, 186, 378
- Tully (1988) Tully, R. B. 1988, AJ, 96, 73
- Turner et al. (2001) Turner, M. J. L., Abbey, A., Arnaud, M., et al. 2001, A&A, 365, L27
- Ulvestad & Ho (2001) Ulvestad, J. S. & Ho, L. C. 2001, ApJ, 558, 561
- Vasudevan & Fabian (2007) Vasudevan, R. V. & Fabian, A. C. 2007, MNRAS, 381, 1235
- Vasudevan & Fabian (2009) Vasudevan, R. V. & Fabian, A. C. 2009, MNRAS, 392, 1124
- Véron-Cetty & Véron (2006) Véron-Cetty, M. P. & Véron, P. 2006, A&A, 455, 773
- Véron-Cetty & Véron (2010) Véron-Cetty, M. P. & Véron, P. 2010, A&A, 518, A10
- Voges et al. (2000) Voges, W., Aschenbach, B., Boller, T., et al. 2000, IAU Circ., 7432, 3
- Watson & Wallin (1994) Watson, W. D. & Wallin, B. K. 1994, ApJ, 432, L35
- Wilson et al. (2001) Wilson, A. S., Yang, Y., & Cecil, G. 2001, ApJ, 560, 689
- Wrobel (1984) Wrobel, J. M. 1984, ApJ, 284, 531
- Xu (2011) Xu, Y.-D. 2011, ApJ, 729, 10
- Yamaoka et al. (2005) Yamaoka, K., Uzawa, M., Arai, M., Yamazaki, T., & Yoshida, A. 2005, Chinese Journal of Astronomy and Astrophysics Supplement, 5, 273
- Yang et al. (2015a) Yang, Q.-X., Xie, F.-G., Yuan, F., et al. 2015a, MNRAS, 447, 1692
- Yang et al. (2015b) Yang, Q.-X., Xie, F.-G., Yuan, F., et al. 2015b, MNRAS, 447, 1692
- Younes et al. (2011) Younes, G., Porquet, D., Sabra, B., & Reeves, J. N. 2011, A&A, 530, A149
- Younes et al. (2019) Younes, G., Ptak, A., Ho, L. C., et al. 2019, ApJ, 870, 73
- Young et al. (1996) Young, S., Hough, J. H., Efstathiou, A., et al. 1996, MNRAS, 281, 1206
- Yuan & Narayan (2014) Yuan, F. & Narayan, R. 2014, Annual Review of Astronomy and Astrophysics, 52, 529
- Yuan et al. (2007) Yuan, F., Taam, R. E., Misra, R., Wu, X.-B., & Xue, Y. 2007, ApJ, 658, 282
- Zaw et al. (2009) Zaw, I., Farrar, G. R., & Greene, J. E. 2009, ApJ, 696, 1218
- Zetzl et al. (2018) Zetzl, M., Kollatschny, W., Ochmann, M. W., et al. 2018, A&A, 618, A83
- Zhao et al. (2021) Zhao, X., Marchesi, S., Ajello, M., et al. 2021, A&A, 650, A57
Appendix A Notes and comparisons with previous results for individual objects
A.1 NGC 3998
This object is spectroscopically classified as a LINER (Heckman 1980; Ho et al. 1997), and no significant broad-line polarization (Barth et al. 1999). HST/WFPC2 optical images revealed an unobscured nucleus and the presence of a bright circumnuclear ionized gas disk (Pogge et al. 2000; Cazzoli et al. 2018).
In radio, it contains a nucleus (Hummel et al. 1984) displaying a weak jet-like northern structure (Filho et al. 2002) and according to Frank et al. (2016), the radio source in NGC 3998 shows two S-shaped lobes.
Pian et al. (2010) found that the spectra of NGC 3998 is better fitted with a simple absorbed power-law model, allowing the overall normalization of the model fit to each detector to be independent. Later, Kawamuro et al. (2016) found the same result using Suzaku and Swift/BAT and fitting the reflection with PEXRAV reflection model. They found that the reflection strength is very weak with an upper-limit of Rf¡0.10 and no significant iron K line emission is detected, either. They suggest that there is little surrounding matter around the nucleus.
Later, Younes et al. (2019), using XMM-newton and NuSTAR data found that it is an unabsorbed AGN and its spectrum in the energy range 0.5–60 keV using NuSTAR data is best fit with a power-law and cutoff energy. They also studied the reflection hump and found only an upper limit for the reflection fraction, with value Rf¡0.3 at 3.
In the present work, the data were fitted with PEXMON and the result is consistent with a reflection fraction Rf¡0.15. Using borus02 we found that the data is consistent with a Compton thin torus (with =22.50) covering more than 20 of the sky. The inclination in this model is unconstrained. In case of XILLVER we found a model consistent with a disk with ¿3.99 and Rf¿0.26. From a statistical point of view, borus02 and XILLVER models are indistinguishable. All the models are consistent with a column density in the line of sight to classify this galaxy as a Compton-thin source with .
A.2 NGC 3718
NGC 3718 was optically classified as a type 1.9 LINER (Ho et al. 1997). Cazzoli et al. (2018) showed that its broad H line is produced in the BLR rather than an outflow. The X-ray spectrum shows a small Fe K line, indicative of a reflection component (Younes et al. 2011; Hernández-García et al. 2014; Diaz et al. 2020).
Modelling the reflection with PEXMON we found R. This low reflection signature can be produced by a torus like neutral reflector (borus02), if it is Compton thin (), with an unconstrained covering factor (CF¡0.99). Fitting a disk like reflector instead, using XILLVER requires high levels of ionization with and a R. A (MEKAL) component was necessary to improve the fit at low energies in all the models. The XILLVER and borus02 are indistinguishable. All the models are consistent with a Compton-thin absorber in the line of sight to the primary coronal emission with .
A.3 NGC 4258*
NGC 4258* is a SABbc spiral galaxy, spectroscopically classified as a 1.9 Seyfert (Ho et al. 1997) and as LINER (Balmaverde & Capetti 2014). This source has a highly obscured central X-ray source and is well known for its anomalous arms, discovered on the basis of H imaging (Wilson et al. 2001) and for its nuclear H2O megamaser, which traces a dense, edge-on disk on sub-parcsec scales (Watson & Wallin 1994; Greenhill et al. 1995). The nucleus of NGC 4258* also contains a relativistic radio jet (Doi et al. 2013).
Reynolds et al. (2009) combined Suzaku, XMM-Newton and Swift, and detected robust flux variability of the 6.4 keV iron line and suggested a model in which the line originates from the surface of a warped accretion disk. Also, during their Suzaku observation, they detected high amplitude intraday variability, with fluctuations on timescales as short as 5 ksec. Herrnstein et al. (2005) found that the absorption may well arise in the outer layers of the warped geometrically thin accretion disk, further reducing the need for any cold structure other than the accretion disk itself.
NuSTAR and XMM–Newton observations of this object are not simultaneous, so we explored possible spectral variability. We found variations in the normalization of the power-law, so we let the normalizations of the power-law free. We then fitted the models. Using PEXMON we found Rf=0.78. Using borus02 we found =23.29, so borderline Compton-thin/thick torus. The torus covers less than 81 of the sky. Fitting with XILLVER we found a disk with ¡1.77 and Rf¿3.80. In order to improve the fit in the soft energy band, it was necessary to add three components, modelled with two MEKAL plus a scattered power-law in all the models. Note that in case of XILLVER , was necessary to use a cut-off power law in the scattered component as in this component, dominate above 70 keV. The borus02 model is the best representation of the data. All the models are consistent with a Compton-thin absorber in the line of sight to the primary coronal emission with .
A.4 ESO 253-G003
This source is spectroscopically catalogued as a Seyfert 2 in Véron-Cetty & Véron (2006). The XMM-Newton and NuSTAR observations of this object are separated by 3 days, so we fit the overlapping 3.0–10.0 keV range of both instruments with a simple absorbed power-law model and checked whether they were consistent. This test showed there was spectral variability between both epochs, with a significant change in the slope . Due to its complexity, the XMM-Newton data was excluded for our analysis. We performed a simultaneous fit of the NuSTAR and Swift/BAT data with PEXMON and significant reflection was detected with Rf¿1.59. Modelling this reflection with borus02 instead of PEXMON results in a marginally Compton thin torus reflector (=24.04) covering more than 73 of the sky. Fitting the reflector using XILLVER instead of borus02 results in a highly ionized disk with and R. The PEXMON model shows the lowest although all models show similar quality fits (=0.905 for borus02 and =0.903 for XILLVER). All the models are. indistinguishable, and they are consistent with a Compton-thin absorber in the line of sight to the primary coronal emission with .
A.5 NGC 1052
NGC 1052 is the brightest elliptical galaxy in the Cetus I group. It was optically classified as a LINER by Heckman (1980), then it was classified as LINER type 1.9 (Ho et al. 1997). Cazzoli et al. (2018) proposed that this object presents signs of outflowing winds by using optical 2D spectra.
This source is a radio loud galaxy (Maoz 2007). At 1.4 GHz Very Large Array (VLA) image of NGC 1052 shows a core-dominated radio structure, with only about 15 of the flux density in extended emission: there are two lobes spanning 3 kpc, possibly with hot spots (Wrobel 1984).
At X-rays, Osorio-Clavijo et al. (2020b) presented an extensive study of NGC 1052 using observations from Chandra, XMM-Newton, NuSTAR, and Suzaku. They reported variability in the nucleus and found variations both in the intrinsic continuum flux, photon index, and in the obscuration along the line of sight. The reflection component is a steady emission both in flux and shape, fully consistent with reflection in a distant structure, perhaps the torus. They argue that NGC 1052 is in the regime of Compton-thin sources, consistent with the fact that the flux of the reflection component is not dominant in the hard band. In addition, Baloković et al. (2021) using NuSTAR, XMM-Newton, Suzaku and BeppoSAX observations and fitting the borus02 model, found covering factor of 80-100 and a column density in the range (1-2)1023 cm-2 which is well-matched with line-of-sight column density.
In this work, we fit the data with PEXMON, and it is consistent with Rf=1.26. Using borus02 model it has (=24.35) so a borderline Compton-thin/thick torus, and CF=0.50. Using XILLVER we found =1.88 and Rf¿9.18. In case of borus02 it was necessary to add a MEKAL and a scattered power-law to improve the fit. In case of XILLVER, it was necessary to add two components to improve the fit (an absorber and a MEKAL) and in case of PEXMON three components were necessary (MEKAL, power-law and an absorber). From a visual inspection, we had to add two Gaussian emission lines centered at: S XIV at 2.4 keV and Si XIII at 1.85 keV. The borus02 model is the best representation of the data. All the models are consistent with a Compton-thin absorber in the line of sight to the primary coronal emission with .
A.6 NGC 2655
NGC 2655 is the brightest member of a group NBGG 12-10 in the Nearby Galaxy Groups catalog of Tully (1988). It is classified as Seyfert 2 in Swift/BAT 70 month catalog (Baumgartner et al. 2013) and as a Type-2 LINER according to the optical classification done by Ho et al. (1997); Véron-Cetty & Véron (2010).
In the X-rays, (González-Martín et al. 2009) found that the 0.2–10 keV XMM-Newton spectrum is well modelled by a MEKAL plus 2 power-law components. Kawamuro et al. (2016) fit 2 APEC models to the Suzaku spectrum of this galaxy and obtained a line of sight cm-2 and , which are consistent with earlier fits to ASCA data (Terashima & Wilson 2002). Kawamuro et al. (2016) also detected a Fe K line at 6.4 keV, which was not detected in the previous ASCA and XMM-Newton observations Terashima et al. (2002); González-Martín et al. (2009).
We fitted the data with PEXMON placing an upper limit on Rf¡0.52. Modeling the reflector with a torus instead, using borus02, we found a column density of the reflector of =23.24 and CF¿0.11. Modeling the reflection with an ionized disk instead of a torus, using XILLVER results in a highly ionized disk with a large reflection fraction and Rf=9.84. In the case of borus02 it was necessary to add two MEKAL and scattered power-law to improve the fit. In case of XILLVER it was necessary to add a MEKAL and an absorber (modelled with zxipcf) components to improve the fit at low energies. In the case of PEXMON an additional MEKAL component was required. The three reflection models showed similar quality fits with for PEXMON, for both borus02 and XILLVER, they are indistinguishable.
All the models are consistent with a heavy but Compton-thin absorber in the line of sight to the primary coronal emission with . We note that if a torus is producing the reflection, then its average column density is lower than the absorber column density in the line of sight.
A.7 NGC 3147*
NGC 3147* is an isolated Seyfert 2 galaxy (Ho et al. 1997) of Hubble morphological type SA(rs)bc. It was suggested as a true type 2 Seyfert candidate (Bianchi et al. 2012), but later confirmed as an AGN accreting at low rate (Bianchi et al. 2019). In the radio, it shows a point-like structure (Ulvestad & Ho 2001; Krips et al. 2006).
At X-rays, Bianchi et al. (2017) using NuSTAR data, shows that spectrum of NGC 3147* can be simply modelled by a power-law with a standard 1.7 and an iron emission line. These spectral properties, together with significant variability on time-scales as short as weeks, strongly support a line-of-sight free of absorption for this source. They suggested that NuSTAR data adds further evidence in favor of an X-ray spectrum completely unaffected by absorption, confirming NGC 3147 as one of the best cases of true Type 2 Seyfert galaxies, intrinsically characterized by the absence of a BLR.
NuSTAR and XMM-Newton observations of these objects are not simultaneous, then we explored possible spectral variability. We found variations in the normalization of the power-law, so this parameter was left free. We perform a simultaneous fit with this configuration of the data with PEXMON and found Rf=3.99. We also fitted the data using borus02 model and found that the data is consistent with a Compton thin torus with density =23.27 covering less than 89 of the sky. Using the XILLVER model, the fit was consistent with =0.79 and an Rf¿0.91. In case of PEXMON, it was necessary to add one component to improve the fit (a warm absorber modelled with zxipcf). All the models are indistinguishable and consistent with a Compton-thin absorber in the line of sight to the primary coronal emission with .
A.8 NGC 2110*
NGC 2110* is a nearby S0 galaxy, (de Vaucouleurs 1991) Seyfert 2 AGN. NGC 2110* shows a prominent Fe K line accompanied by variable intrinsic emission (Hayashi et al. 1996).
Marinucci et al. (2014) report the X-ray spectral analysis of NGC 2110* observed by NuSTAR in 2012, when the source was at the highest flux level ever observed, and in 2013, when the source had more typical flux levels. They found an upper limit on Rf ¡ 0.14, confirming results from past high-energy BeppoSAX and Suzaku observations (Malaguti et al. 1999; Reeves et al. 2006; Rivers et al. 2014). Using MyTorus (Murphy & Yaqoob 2009) to model the reflection, they found a CF of 0.5 with equatorial NH = 2.0 1.1 1023 cm-2.
We re-examine the 2013 NuSTAR observations together with the 2003 XMM-Newton observation in the overlapping 3–10 keV band, finding a consistent slope and variable normalization. We therefore fit jointly the broad band spectra with untied normalization for the cutoff power-law component between instruments. Modelling the reflection with PEXMON gives Rf=1.01. Modeling the reflection with a torus instead, using borus02 we found a Compton thin reflector with =23.49 covering 13 of the sky, consistent with Baloković et al. (2018). Modeling the reflection with a disk instead of the torus, with XILLVER, we obtain =1.99 and Rf¿7.80. In the case of XILLVER it was necessary to add two components to improve the fit at low energies: a MEKAL and zxipcf. In case of borus02 three components were necessary to improve the fit: a scattered power-law, MEKAL and a zxipcf, and in the other case, four components were necessary: 2 zxipcf + 2*MEKAL. The torus reflector produces the best fit.
All the models are consistent with a Compton-thin absorber in the line of sight to the primary coronal emission with .
A.9 LEDA 96373*
LEDA 96373 (also 2MASX J07262635–3554214 or IGR J07264–3553) was first observed at high energies during the all-sky hard X-ray IBIS survey (Krivonos et al. 2007) and reported in the Palermo Swift/BAT survey. This galaxy is classified in NED as a Seyfert 2 and as a Compton thick galaxy (Koss et al. 2016).
Landi et al. (2009) observed this galaxy with SwiftXRT data and reports an excess emission below 2 keV and found that a double power law model is a good fit. They found an intrinsic column density of 7 1022 cm-2 and a photon index 2.5. The source seems to vary by a factor of 2 within a timescale of few days, with an average 2–10 keV flux of 4.2 10-13 erg cm-2 s-1.
Simultaneous NuSTAR and XMM-Newton data are not available for this source, so we explored possible variability. We found variations in the normalization of the power-law, so this parameter was left free. Using PEXMON we found Rf¿9.38. Using borus02 we found that the data is consistent with a Compton thin torus (=23.40) covering 59 of the sky. Then we fitted XILLVER and found =2.08 and Rf¿9.37. In case of PEXMON and borus02, it was necessary to add three components to improve the fit (two MEKAL*zxipcf), and in case of XILLVER, (MEKAL + a scatter power-law)*zxipcf components were necessary. The borus02 model is the best representation of the data. The fit with borus02 requires Compton thick absorption in the line of sight to the coronal emission with = 24.09.
A.10 NGC 2992
NGC 2992 is a spiral galaxy classified as a Seyfert 1.9 in the optical. This Seyfert galaxy is a changing-look AGN that varies from type 2 to intermediate type sometimes accompanied by extreme X-ray activity and back, over the span of a few years, (Shu et al. 2010) which is attributed to intrinsic variations of the powerlaw flux and to changes in the absorption in the line of sight (Parker et al. 2015; Hernández-García et al. 2017).
At higher X-ray energies, a combined study with INTEGRAL, Swift and BeppoSAX data published by Beckmann et al. (2007) showed that variations in the normalization of the power law were needed when using an absorbed broken power law model to fit the data simultaneously. They found a constant and flux variations by a factor of 11 in timescales of months to years.
We used only the XMM-Newton data that overlaps in time with the NuSTAR exposure and perform a simultaneous fit. Modelling the reflection with PEXMON results in Rf=0.37. Using borus02 model for the reflection instead of PEXMON we found a Compton thin torus reflector with =23.17 covering more than 75 of the sky. Then we fit XILLVER instead of borus02 and the fit was consistent with a disk with ¡0.08 producing Rf¿8.80. In the case of PEXMON and borus02, it was necessary to add a MEKAL, a scattered power-law and zxicpf components; in the case of XILLVER, two MEKAL components were required. The borus02 model is the best representation of the data.
All the models are consistent with a Compton-thin absorber in the line of sight to the primary coronal emission with .
A.11 M 51
M 51 (also known as Messier 51a, M 51a, and NGC 5194) is a very nearby (7.1 Mpc; Takáts & Vinkó 2006) Compton-thick AGN. It hosts a Seyfert 2 nucleus (Ho et al. 1997; Dumas et al. 2011) and shows two radio lobes that are filled with hot X-ray gas (Terashima et al. 2000) and an outflow of ionised gas (Bradley et al. 2004). This is an interacting spiral galaxy and lies in the constellation Canes Venatici.
Brightman et al. (2018) reported a ULX located close enough to the nucleus of M 51 that NuSTAR cannot resolve it. They modelled this emission with a cut-off power-law model where and E keV. We included the emission from the ULX using the same model setting and Ecut frozen to the parameters already obtained by them. Here we perform a simultaneous fit of the XMM-Newton , NuSTAR and Swift/BAT data. Using PEXMON reflection model we find R. Using borus02 we found a Compton thick torus reflector () covering less than 57 of the sky. Then we fit XILLVER and the fit was consistent with an accretion disk with and with R. In case of PEXMON and XILLVER one additional component was needed (modelled with zxipcf). The torus model gives a good representation of the data. The fit with this model requires Compton thick absorption in the line of sight to the coronal emission with otherwise with the other models, a Compton thin column density is a good representation of the data.
A.12 NGC 2273*
NGC 2273* is a Seyfert 2 galaxy (Risaliti et al. 1999) considered a Compton-thick due to the detection of a strong Fe K line with an equivalent width keV and a low ratio of LX/L[OIII] Guainazzi et al. (2005). Observations with Suzaku suggested that the nucleus of NGC 2273 is obscured by a Compton thick column of cm-2 (Awaki et al. 2009). A hidden nucleus is also suggested by the detection of polarized broad lines (Moran et al. 2000).
We explore the spectral variability in this galaxy between the 2003 XMM-Newton observation and the 2014 NuSTAR observation by fitting an absorbed power-law plus 6.4 keV Gaussian model to the overlapping 3–10 keV spectra. we find that allowing only the power-law normalization to vary between instruments/epochs produced an acceptable fit with and with consistent values of the normalization, so we will fit these spectra with all the parameters tied. We perform a simultaneous fit of the XMM-Newton , NuSTAR and Swift/BAT data with PEXMON reflection model and the result is consistent with Rf¿9.02. We modeled the reflection using borus02 instead of PEXMON finding a Compton thin torus () with a covering factor lower than 59% of the sky. Modeling the reflection withXILLVER instead produced moderately ionized disk with and Rf¿8.80. In all the models it was necessary to add two components (MEKAL and absorber). The disk like reflector modelled with XILLVER is the best representation of the data. The fit with this model requires Compton thick absorption in the line of sight to the coronal emission with .
A.13 HE 1136-2304
HE 1136-2304 changed its optical spectral classification from 1994 (Seyfert 2) to 2014 (Seyfert 1.5) and can be considered an optical changing look AGN (Zetzl et al. 2018). HE 1136-2304 has been detected as a variable X-ray source by the XMM-Newton slew survey in 2014 (Parker et al. 2016). The 0.2–-2 keV flux increased by a factor of about 30 in comparison to the 1990 ROSAT All-Sky Survey flux (RASS; Voges et al. (2000)). However, no clear evidence of X-ray absorption variability has been seen.
Parker et al. (2016) found an absorbing column density on the X-ray spectrum around cm-2 in addition to Galactic absorption. This spectrum shows a moderate soft excess and a narrow Fe line at 6.4 keV and a high energy cut-off at 100 keV.
Although the X-ray flux is highly variable in this source, a joint spectral fitting with XMM-Newton and NuSTAR could be made since the observations were simultaneous. Using PEXMON reflection model we found Rf=3.99. We also fit the data using borus02 model instead of PEXMON, and we found that reflection features can be produced by a Compton thin torus with =23.52 covering 59 of the sky. Modelling the reflection with a disk instead, using XILLVER results in a highly ionized disk with =3.78 and Rf¿1.45. To improve the fit in the low energy range, it was necessary to add one MEKAL component in all the models. The borus02 model is the best representation of the data.All models required a Compton-thin absorber on the line of sight to the primary coronal emission, with .
A.14 IGRJ 11366-6002:
We did not find previous information about this galaxy in the literature.
Here we perform the fit of the NuSTAR and Swift/BAT and Swift/XRT data. When using PEXMON reflection model, we find Rf=0.72. We also fit the data using borus02 model, and we found that the data is consistent with a Compton thick reflector torus (¿24.47) covering of the sky. Using XILLVER, the fit was consistent with =3.14 and Rf¿1.12. All the models are indistinguishable, and they are consistent with a Compton-thin absorber in the line of sight to the primary coronal emission with .
A.15 IC 4518A
This galaxy was optically classified as a type 2 Seyfert galaxy (Zaw et al. 2009) and it is classified as a Compton-thin source (Bassani et al. 1999; de Rosa et al. 2008; Hernández-García et al. 2015).
de Rosa et al. (2008) presented a 0.2–200 keV broad-band study of this galaxy with INTEGRAL, XMM-Newton, Chandra and ASCA to investigate the continuum shape and the absorbing/reflecting medium properties. They fitted PEXRAV the reflection model and found that in this object the presence of the reflection component above 10 keV is statistically required by the data. However, they found the best fit value larger than 1 that they suggested that could be related with the geometry of the reflector, which should be more complex than that used in their work.
Hernández-García et al. (2015) studied XMM–Newton data of this galaxy and found variations in an eight-day period, that correspond to a flux variation of 40 (41) in the soft (0.5 - 2 keV) (hard - 5 - 10.0 keV) energy band.
for this work, NuSTAR and XMM-Newton data were not simultaneous, thus we explored possible spectral variability. The best fit resulted when the normalization of the power-law is a free parameter. Using PEXMON we found Rf=3.41. Using borus02 we find a Compton-thick reflector torus with =24.59, covering more than 39 of the sky. Using XILLVER we found a model consistent with ¡1.73 and Rf¿2.94. To improve the fit, three additional components are necessary (MEKAL + scatter power-law)*zxipcf for PEXMON, MEKAL + zxipcf for borus02) and XILLVER). The borus02 model is the best representation of the data. In all the models, the absorption in the line of sight is consistent with being Compton-thin ( 23.22).
A.16 NGC 7674*
NGC 7674* (Mrk 533) is a nearby luminous infrared galaxy (LIRG). This galaxy is the brightest member of the Hickson 96 interacting galaxy groups and it is a known as a Seyfert 2 galaxy with broad H and H components in polarized light (Young et al. 1996). Later, Bianchi et al. (2005) classified it as a changing look AGN in the X-ray range, switching between Compton-thin and Compton thick absorption in the line of sight.
In the X-rays, NGC 7674* was first reported to be a reflection-dominated AGN by Malaguti et al. (1998) from BeppoSAX X-ray observations carried out in 1996, with the direct (intrinsic) continuum being fully absorbed by a Compton-thick gas column. Bianchi et al. (2005) studied the XMM-Newton spectra of this galaxy, finding a reflection fraction R1.5 and argue that the changes on the CT regimes in this galaxy is associated with material in the line of sight. Later, Gandhi et al. (2017) present NuSTAR, Suzaku and Swift reporting a flat X-ray spectrum, suggesting that it is obscured by Compton-thick gas. Based upon long-term flux dimming, previous work suggested the alternate possibility that the source is a recently switched-off AGN with the observed X-rays being the lagged echo from the torus. Their data show the source to be reflection-dominated in hard X-rays, but with a relatively weak neutral Fe K emission line and a strong Fe XXVI ionised line. Also, they construct an updated long term X-ray light curve of NGC 7674* and find that the observed 2–-10 keV flux has remained constant for the past 20 years.
As this galaxy is a changing look galaxy and the XMM-Newton and NuSTAR observations are separated by several years, we do not attempt a joint fit and exclude the XMM-Newton observation for our analysis. Using PEXMON we found that the data is consistent with Rf¿2.21. Using borus02 to model the reflection instead of PEXMON we found a torus with ¿24.43 covering 70 of the sky. Modelling the reflection with a disk instead of a torus, using XILLVER the fit was consistent with =2.82 and Rf=3.25. The XILLVER model is the best representation of the data.
We find heavy but Compton thin absorption in the line of sight to the primary coronal emission with for all the models used.
A.17 NGC 5033
NGC 5033 is a nearby spiral galaxy with a low-luminosity Seyfert 1.8 type nucleus (Véron-Cetty & Véron 2010) with a point-like central X-ray source (Terashima et al. 1999). This galaxy has been alternatively classified as a Seyfert of type 1.5 (Ho et al. 1997). This object has a giant neighbor within a short distance: NGC 5005, a Seyfert SAB(rs) galaxy.
In the radio, it is predominated by a compact core (Ho & Ulvestad 2001), and showing extended jet-like features to the East-West (Pérez-Torres & Alberdi 2007).
In the X-rays, Terashima et al. (1999) using ASCA observations found a point-like X-ray source in the 2–10 a keV band. Their X-ray light curve showed variability on a timescale of 104 s with an amplitude of 20.
In this work, we combine the NuSTAR observations and perform a simultaneous fit of the XMM-Newton , NuSTAR and Swift/BAT data. Using PEXMON reflection model results in Rf¿1.0. Using borus02, we found that the data is consistent with a Compton thin torus (=23.49) covering 77 of the sky. Then we fit XILLVER instead of borus02 and the fit was consistent with ¡1.0 and Rf¿4.88. To improve the fit, it was necessary to two MEKAL to XILLVER. The borus02 model is the best representation of the data. In all the models, the required line of sight absorption is compatible with being Compton-thin (21.0).
Appendix B Existence of the reflection component
The aim of our spectral analysis is to quantify how much reflecting material can exist around the central engine, assuming that there must be material around the SMBH. In this section, we fit the nuclear continuum with and without reflection to probe that this component is usually required by the data. We based our analysis on the statistical significance of the reflection component compared to the model without reflection (i.e. F-test10-3), we examine the existence of the reflection component.
We start the analysis by fitting the spectra to the following model: constant*phabs*zphabs*cutoffpl. This model represents a power-law component (cutoffpl - associated with the intrinsic continuum) absorbed by the material along the LOS to the observer (phabs). The cross normalization constant and the galactic absorption are denoted by constant and zphabs respectively. The column density (NH), photon index (), high energy cut off (Ecut), and normalization of the power-law are the free parameters for this model. In order to avoid including the soft emission in this section of the analysis, we omit the spectra below 3.0 keV.
Then, we use constant*phabs*zphabs*(cutoffpl+pexmon), to study the case considering the reflection. We will use the pexmon model to fit the data. This model assumes Compton reflection from neutral X-ray photons in an optically thick material with plane-parallel geometry. The photon index, high energy cut-off, reflection fraction (Rf), metal and iron abundances, inclination angle, and normalization are all free parameters in pexmon. We have set the photon index of the pexmon to be the same as that of the power-law. The iron abundance was assumed to be solar. The high energy cut off and normalization are free parameters. To take into account the reflection component and exclude the intrinsic power-law continuum in pexmon model, we have set Rf to -1. Then, we fit the spectra with this model and test if reflection is required by the data using the F-test tool within Xspec.
We present the results of this analysis in Table 4, the addition of a reflection component improves the spectral fit for 14 out of the 17 sources (82 of the sample). Statistically, the reflection component is not required in three galaxies in our sample. NGC 2655 which has the lowest number of counts, and NGC 3998 and NGC 3718 which have the lowest Eddington ratios in our sample. Due to their luminosity, the contribution of the reflection could be very small, and as a consequence we are not able to quantify the reflection component. Because most of the sources do require a reflection component, we will use reflection models to fit all the sources in order to put constraints on this component.
| PL | PL+Pexmon (Rf=-1) | |||||||
| Name | /d.o.f. | /d.o.f. | F-test | Counts | ||||
| (3.0-79.0 keV) | ||||||||
| NGC 3998 | 1.89 | 763.2/836 | 0.913 | 1.92 | 763.1/835 | 0.914 | 0.741 | 16468.15 |
| NGC 3718 | 1.94 | 360.2/325 | 1.108 | 1.98 | 358.6/324 | 1.107 | 0.230 | 6998.24 |
| NGC 2655 | 1.84 | 118.6/132 | 0.898 | 1.73 | 117.9/131 | 0.900 | 0.379 | 568.62 |
| NGC 4258* | 1.77 | 649.4/617 | 1.053 | 1.83 | 631.4/615 | 1.027 | 1.76310-4 | 6593.104 |
| NGC 3147* | 1.70 | 556.2/328 | 1.696 | 1.81 | 505.0/326 | 1.549 | 1.45810-7 | 3054.63 |
| ESO 253-G003*(Nu) | 1.00 | 124.8/122 | 1.023 | 1.12 | 110.3/121 | 0.912 | 1.14310-4 | 1086.49 |
| NGC 5033 | 1.81 | 1247.8/1001 | 1.247 | 1.86 | 1114.6/1000 | 1.115 | 2.35010-26 | 25072.32 |
| NGC 1052 | 1.67 | 932.2/822 | 1.134 | 1.93 | 895.6/821 | 1.091 | 9.88310-9 | 11515.75 |
| NGC 2110* | 1.71 | 1668.5/1209 | 1.380 | 1.87 | 1414.0/1208 | 1.171 | 2.25710-45 | 44137.44 |
| LEDA 96373* | 1.04+ | 768.8/233 | 3.299 | 1.20+ | 512.5/232 | 2.209 | 3.34010-22 | 1407.078 |
| NGC 2992 | 1.72 | 2502.1/1566 | 1.598 | 1.79 | 1771.0/1565 | 1.132 | 1.34510-119 | 110668.25 |
| M 51 | 1.0 | 669.1/346 | 1.934 | 1.40 | 609.5/345 | 1.767 | 1.43410-8 | 1856.124 |
| NGC 2273* | 1.80+ | 397.2/165 | 2.407 | 1.71 | 303.8/164 | 1.852 | 3.57710-11 | 930.36 |
| HE 1136-2304 | 1.63 | 1027.3/930 | 1.105 | 1.68 | 973.6/929 | 1.048 | 1.65910-12 | 19806.78 |
| IGRJ 11366-6002(Nu) | 1.90 | 271.7/242 | 1.122 | 2.10 | 255.2/241 | 1.059 | 1.03710-4 | 2269.164 |
| IC 4518A | 1.42 | 305.2/189 | 1.615 | 1.64 | 222.9/188 | 1.186 | 2.2610-5 | 1238.75 |
| NGC 7674*(Nu) | 1.20 | 277.9/171 | 3.914 | 1.26 | 209.0/170 | 1.229 | 3.65910-12 | 1640.08 |
Appendix C Effect of the inclusion of the NuSTAR data and reflection models in the spectral index estimation
In this work we use NuSTAR+XMM-Newton+Swift observations of a sample of LLAGN from BASS /DR2. We fit all our data with reflection models such as borus02 to model a torus-like reflector and XILLVER to model a disk-like emission. This may affect the best-fit parameters we obtain compared to results in the literature that use data from other instruments and with other reflection models.
In previous studies, the parameter has large error bars (see, for example, She et al. 2018). To investigate the improvement in the spectral index estimation, we will compare the error bars of the present work using PEXMON and NuSTAR+XMM-Newton+Swift observations, with those obtained by Ricci et al. (2017a) using PEXRAV of the same sample with Swift/XRT, Swift/ BAT , ASCA, Chandra, and Suzaku observations. In Fig. 8 we compare these error bars, with the blue stars representing the lower limits and the red circles the upper limits of the parameter. The black dotted line represents x=y. We found that the errors in this work are smaller compared to Ricci et al. (2017a). Then, the uncertainties in the photon index improve by including NuSTAR data and/or using models such as borus02 or XILLVER .
Moreover, the - relation shows a high scatter (especially in the case of LLAGN), which is still not understood - it could be due to the sensitivity of the measurements or the intrinsic diversity of the nuclei (see Gu & Cao 2009; Younes et al. 2011; Yang et al. 2015b; She et al. 2018). In this work, we found a significant decrease in the scatter in this correlation. To understand this improvement, the natural question is whether this is related to the inclusion of NuSTAR data or could be an effect of using more physical models than borus02 to perform the spectral analysis. In the upper panel in Fig. 9, the spectral index is plotted against the accretion rate previously determined by Ricci et al. (2017a) using PEXMON. In the middle, we plot the relation between the same sample and the values determined in this work with PEXMON including the NuSTAR data. Note that we have not indicated the error bars in the accretion rate for illustrative purposes only. There is an improvement in the scatter and error bars, with smaller uncertainties in the photon index than in the results without including the NuSTAR data. Thus, the inclusion of the NuSTAR data is crucial for the determination of one of the fundamental parameters describing the X-ray emission, like the spectral index . We also investigate the improvement of the estimate of the parameter by including the borus02 model. Comparing the lower panel in Fig. 9 with the middle panel in the same figure, we see that there is a significant improvement in the scatter of the relation and the uncertainties of the parameter have improved significantly.
We found that we get lower uncertainties with a more physical model like borus02 Ṫhe process of combining NuSTAR data with more physical models like borus02 is key to improve the scatter previously observed in this relationship. With our small error bars and improved constraints on the parameters, we can continue the search for the expected correlations in detail.
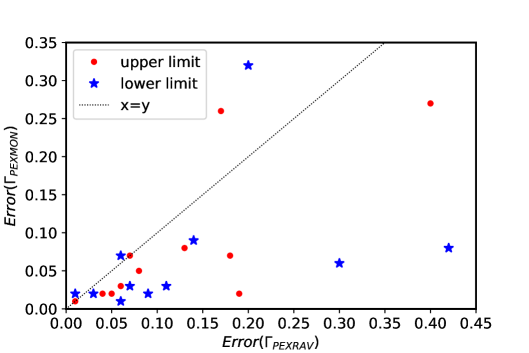
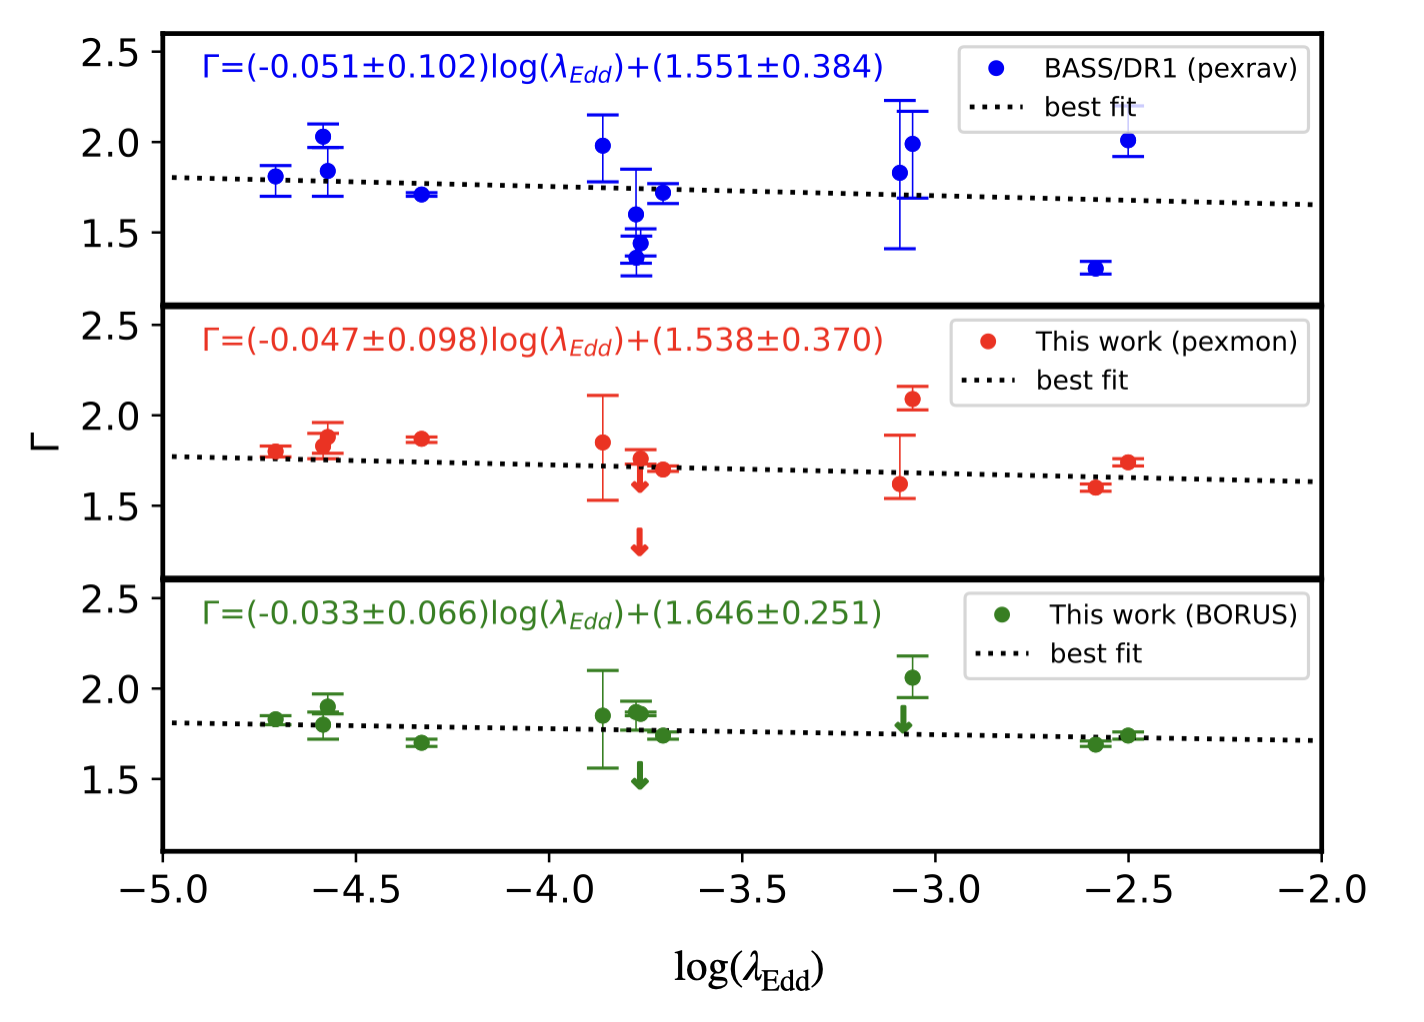
Appendix D Tables
| Name | Instrument | ObsID | Date | R | Exp. Time |
| (”) | (ks) | ||||
| (1) | (2) | (3) | (4) | (5) | (6) |
| NGC 3998 | XMM-Newton | 0790840101 | 2016-10-26 | 49 | 25 |
| NuSTAR | 60201050002 | 2016-10-25 | 49 | 103 | |
| NGC 3718 | XMM-Newton | 0795730101 | 2017-10-24 | 49 | 38 |
| NuSTAR | 60301031002 | 2017-10-24 | 49 | 24 | |
| NGC 4258* | XMM-Newton | 0400560301 | 2006-11-17 | 49 | 64 |
| NuSTAR | 60101046004 | 2016-01-10 | 49 | 103 | |
| ESO 253-G003* | XMM-Newton | 0762920501 | 2015-08-19 | 49 | 27 |
| NuSTAR | 60101014002 | 2015-08-21 | 49 | 22 | |
| NGC 1052 | XMM-Newton | 0790980101 | 2017-01-17 | 49 | 70 |
| NuSTAR | 60201056002 | 2017-01-17 | 49 | 59 | |
| NGC 2655 | XMM-Newton | 0301650301 | 2016-11-10 | 49 | 11 |
| NuSTAR | 60160341004 | 2016-11-10 | 49 | 15 | |
| NGC 3147* | XMM-Newton | 0405020601 | 2006-10-06 | 49 | 17 |
| NuSTAR | 60101032002 | 2015-12-27 | 49 | 49 | |
| NGC 2110* | XMM-Newton | 0145670101 | 2003-03-05 | 49 | 59 |
| NuSTAR | 60061061002 | 2012-10-05 | 49 | 15 | |
| 60061061004 | 2013-02-14 | 49 | 12 | ||
| LEDA 96373* | XMM-Newton | 0674940101 | 2012-04-09 | 49 | 56 |
| NuSTAR | 60061073002 | 2014-07-31 | 49 | 22 | |
| NGC 2992 | XMM-Newton | 0840920201 | 2019-05-07 | 49 | 134 |
| 0840920301 | 2019-05-09 | 49 | 134 | ||
| NuSTAR | 90501623002 | 2019-05-10 | 49 | 57 | |
| M 51 | XMM-Newton | 0852030101 | 2019-07-11 | 49 | 77 |
| NuSTAR | 60501023002 | 2019-07-10 | 49 | 169 |
| Name | Instrument | ObsID | Date | R | Exptime |
| (”) | (ks) | ||||
| (1) | (2) | (3) | (4) | (5) | (6) |
| NGC 2273* | XMM-Newton | 0140951001 | 2003-09-05 | 49 | 13 |
| NuSTAR | 60001064002 | 2014-03-23 | 49 | 23 | |
| HE 1136-2304 | XMM-Newton | 0741260101 | 2014-07-02 | 49 | 110 |
| NuSTAR | 80002031003 | 2014-07-02 | 49 | 63 | |
| 80002031002 | 2014-07-02 | 49 | 23 | ||
| IC 4518A | XMM-Newton | 0401790901 | 2006-08-07 | 11 | 134 |
| 0406410101 | 2006-08-15 | 49 | 25 | ||
| NuSTAR | 60061260002 | 2013-08-02 | 49 | 7 | |
| NGC 7674* | XMM-Newton | 0200660101 | 2004-06-02 | 49 | 10 |
| NuSTAR | 60001151002 | 2014-09-30 | 49 | 51 | |
| IGRJ 11366-6002 | NuSTAR | 60061213002 | 2014-10-29 | 49 | 21 |
| Swift/XRT | 00080058001 | 2014-10-29 | 25 | 1.6 | |
| NGC 5033 | XMM-Newton | 0871020101 | 2020-12-10 | 49 | 21 |
| NuSTAR | 60601023002 | 2020-12-08 | 49 | 104 | |
| 60601023004 | 2020-12-12 | 49 | 53 |
| Name | Instrument | ObsID | Model | NH | Norm PL | Norm G | Flux | /d.o.f | Notes | ||
|---|---|---|---|---|---|---|---|---|---|---|---|
| ( cm-2) | () | () | ( erg cm-2 s-1) | ||||||||
| (1) | (2) | (3) | (4) | (5) | (6) | (7) | (8) | (9) | (10) | (11) | (12) |
| NGC 4258* | XMM-Newton | 0400560301 | PL | 1.48 | - | 3.84 | - | - | We select | ||
| NuSTAR | 60101046004A | 1.61 | 7.67 | 0.84 | - | 2.18 | 443.2/387 | 1.145 | PL norm | ||
| 60101046004B | - | - | - | - | variable | ||||||
| ESO 253-G003* | XMM-Newton | 0762920501 | PL | 1.76 | - | 0.45 | - | - | variable, | ||
| NuSTAR | 60101014002A | 1.23 | 2.29 | 0.19 | - | 1.07 | 119.4/86 | 1.389 | We select only | ||
| 60101014002B | - | - | - | - | NuSTAR observations | ||||||
| NGC 3147* | XMM-Newton | 0405020601 | PL | 0.53 | - | 1.14 | - | - | We select | ||
| NuSTAR | 60101032002A | 1.79 | 2.98 | 1.05 | - | 2.19 | 243.5/217 | 1.122 | PL norm | ||
| 60101032002B | - | - | - | - | variable | ||||||
| NGC 2110* | XMM-Newton | 0145670101 | PL+G | 6.78 | 25.00 | - | - | We select | |||
| NuSTAR | 60061061004A | 1.53 | 3.84 | 37.08 | 0.049 | 134.85 | 527.3/453 | 1.164 | PL norm | ||
| 60061061004B | - | - | - | variable | |||||||
| LEDA 96373* | XMM-Newton | 0674940101 | PL+G | 0.13 | 1.14 | - | - | We select PL norm tied, they | |||
| NuSTAR | 60061073002A | 0.93 | 13.59 | 0.17 | 0.022 | 1.40 | 245.2/141 | 1.739 | are consistent. The model | ||
| 60061073002B | - | - | - | is not enough to fit the data | |||||||
| NGC 2273* | XMM-Newton | 0140951001 | PL+G | 0.49 | 0.93 | - | - | We select | |||
| NuSTAR | 60001064002A | 1.56 | 30.04 | 0.53 | 0.037 | 0.98 | 109.7/102 | 1.075 | PL norm tied, they | ||
| 60001064002B | - | - | - | are consistent |
| Name | Instrument | ObsID | Model | NH | Norm PL | Norm G | Flux | /d.o.f | Notes | ||
|---|---|---|---|---|---|---|---|---|---|---|---|
| ( cm-2) | () | () | ( erg cm-2 s-1) | ||||||||
| (1) | (2) | (3) | (4) | (5) | (6) | (7) | (8) | (9) | (10) | (11) | (12) |
| NGC 7674* | XMM-Newton | 0200660101 | PL+G | 0.20 | 0.052 | - | - | Is a changing look, we | |||
| NuSTAR | 60001151002A | 1.71 | 18.28 | 0.49 | 0.0059 | 0.79 | 12.4/76 | 1.479 | did not combine the data. | ||
| 60001151002B | - | - | |||||||||
| IC 451A* | XMM-Newton | 0406410101 | PL+G | 0.97 | 1.64 | - | - | We select | |||
| NuSTAR | 60061260002A | 1.70 | 21.57 | 2.64 | 0.015 | 4.29 | 143.4/123 | 1.166 | PL norm | ||
| 60061260002B | - | - | - | variable |
| PEXMON | borus02 | XILLVER | |||||||||||
|---|---|---|---|---|---|---|---|---|---|---|---|---|---|
| Name | (keV) | /d.o.f | (keV) | /d.o.f | (keV) | /d.o.f | BM | ||||||
| NGC 3998 | 1.80 | 81.78 | 840.7/896 | 0.938 | 1.83 | 119.02 | 837.6/895 | 0.936 | 1.79 | 568.75 | 838.0/895 | 0.936 | T/D |
| NGC 3718 | 1.88 | 111.57 | 408.2/371 | 1.100 | 1.90 | 252.99 | 405.9/369 | 1.100 | 1.86 | 142.89 | 404.8/369 | 1.097 | T/D |
| NGC 4258* | 1.83 | 142.15 | 740.0/666 | 1.111 | 1.80 | 371.07 | 731.5/665 | 1.100 | 1.86 | 208.36 | 739.3/668 | 1.187 | Torus |
| ESO 253-G003* | 1.30 | 79.45 | 107.1/121 | 0.885 | 1.40 | 90.08 | 108.6/120 | 0.905 | 1.41 | 228.04 | 108.37/120 | 0.903 | T/D |
| NGC 1052 | 1.76 | 134.55 | 956.7/872 | 1.097 | 1.86 | 2000.0 | 949.9/872 | 1.089 | 1.45 | 40.39 | 1286.0/872 | 1.4747 | Torus |
| NGC 2655 | 1.85 | 209.70 | 171.8/168 | 1.022 | 1.85 | 221.28 | 171.2/167 | 1.025 | 1.90 | 230.86 | 178.1/169 | 1.054 | T/D |
| NGC 3147* | 1.71 | 65.65 | 394.3/378 | 1.043 | 1.76 | 2000 | 379.3/377 | 1.006 | 1.72 | 71.68 | 384.7/377 | 1.020 | T/D |
| NGC 2110* | 1.87 | 3000.0 | 1600.4/1261 | 1.269 | 1.70 | 354.86 | 1293.2/1260 | 1.026 | 1.82 | 1870.56 | 1564.3/1263 | 1.239 | Torus |
| LEDA 96373* | 1.20 | 38.02 | 403.1/276 | 1.460 | 1.87 | 2000.0 | 309.9/275 | 1.127 | 1.77 | 114.47 | 461.0/276 | 1.670 | Torus |
| NGC 2992 | 1.60 | 55.28 | 2092.1/1619 | 1.2922 | 1.69 | 259.51 | 1738.7/1618 | 1.075 | 1.65 | 64.80 | 2140.5/1620 | 1.3213 | Torus |
| M 51 | 1.90 | 3000 | 482.9/341 | 1.416 | 1.56 | 2000 | 470.5/343 | 1.372 | 1.90 | 3000 | 493.8/341 | 1.448 | Torus |
| NGC 2273* | 1.80 | 57.86 | 226.8/197 | 1.151 | 1.44 | 60.41 | 173.0/196 | 0.882 | 2.14 | 575.64 | 246.3/196 | 1.257 | D |
| HE 1136-2304 | 1.74 | 97.20 | 1066.0/987 | 1.080 | 1.74 | 394.08 | 1054.5/986 | 1.069 | 1.567 | 1014.66 | 1126.3/986 | 1.142 | Torus |
| IGRJ 11366-6002 | 2.10 | 2999.36 | 261.9/245 | 1.069 | 2.06 | 206.76 | 252.3/244 | 1.034 | 1.92 | 2000 | 250.49/244 | 1.026 | T/D |
| IC 4518A* | 1.62 | 50.0 | 245.7/215 | 1.143 | 1.57 | 34.19 | 222.6/217 | 1.026 | 1.76 | 73.03 | 250.4/217 | 1.154 | Torus |
| NGC 7674* | 1.82 | 180.88 | 189.0/169 | 1.118 | 1.47 | 30 | 190.7/168 | 1.135 | 1.42 | 95.68 | 179.4/168 | 1.068 | D |
| NGC 5033 | 1.70 | 50 | 1215.4/1059 | 1.148 | 1.74 | 142.95 | 1177.4/1058 | 1.113 | 1.77 | 61.35 | 1193.8/1054 | 1.133 | Torus |
| PEXMON | borus02 | XILLVER | |||||||||||||
|---|---|---|---|---|---|---|---|---|---|---|---|---|---|---|---|
| Name | Rf | Incl | /d.o.f. | CF | Cos() | /d.o.f. | Rf | Incl (deg) | /d.o.f. | BM | |||||
| NGC 3998 | 0.07 | 0.01 | 840.7/896 | 0.938 | 22.50 | 1.00 | 0.18 | 837.6/895 | 0.936 | 4.07 | 4.1 | 18.33 | 837.95/895 | 0.936 | T/D |
| NGC 3718 | 0.01 | 0.02 | 408.2/371 | 1.100 | 22.78 | 0.99 | 0.30 | 405.9/369 | 1.100 | 3.12 | 4.91 | 88.74 | 404.8/369 | 1.097 | T/D |
| NGC 4258* | 0.78 | 80.14 | 740.0/666 | 1.111 | 23.29 | 0.38 | 0.95 | 731.5/665 | 1.100 | 0.48 | 5.39 | 87.97 | 739.3/668 | 1.187 | Torus |
| ESO 253-G003 | 10.00 | 86.60 | 107.1/121 | 0.885 | 24.04 | 0.73 | 0.76 | 108.6/120 | 0.905 | 2.68 | 2.08 | 65.99 | 108.3/120 | 0.903 | T/D |
| NGC 1052 | 1.26 | 74.71 | 956.7/872 | 1.097 | 24.35 | 0.50 | 0.55 | 949.9/872 | 1.089 | 1.88 | 10.00 | 88.12 | 1286.0/872 | 1.4747 | Torus |
| NGC 2655 | 0.07 | 0.01 | 171.8/168 | 1.022 | 23.24 | 0.83 | 0.85 | 159.4/167 | 0.954 | 1.85 | 9.84 | 89.09 | 178.1/169 | 1.054 | T/D |
| NGC 3147* | 3.99 | 87.11 | 394.3/378 | 1.043 | 23.27 | 0.89 | 0.90 | 379.3/377 | 1.006 | 0.79 | 9.48 | 87.61 | 384.7/377 | 1.020 | T/D |
| NGC 2110* | 1.01 | 79.58 | 1600.4/1261 | 1.2691 | 23.49 | 0.13 | 0.45 | 1293.2/1260 | 1.026 | 1.99 | 10.00 | 88.94 | 1564.3/1263 | 1.236 | Torus |
| LEDA 96373* | 10.00 | 65.49 | 403.1/276 | 1.460 | 23.40 | 0.59 | 0.95 | 309.9/275 | 1.127 | 2.08 | 10.00 | 19.10 | 461.0/276 | 1.670 | Torus |
| NGC 2992 | 0.37 | 0 | 2092.1/1619 | 1.292 | 23.17 | 0.75 | 0.85 | 1738.7/1618 | 1.075 | 0.006 | 10.00 | 88.41 | 2140.5/1620 | 1.3213 | Torus |
| M 51 | 10.00 | 0.06 | 482.9/341 | 1.416 | 25.40 | 0.34 | 0.95 | 470.5/343 | 1.372 | 0.05 | 10.00 | 18.00 | 493.8/341 | 1.448 | Torus |
| NGC 2273* | 10.00 | 0.09 | 226.8/197 | 1.151 | 23.75 | 0.15 | 0.94 | 173.5/196 | 0.882 | 2.14 | 9.99 | 8.90 | 246.3/196 | 1.257 | D |
| HE 1136-2304 | 3.99 | 87.77 | 1066.0/987 | 1.080 | 23.52 | 0.59 | 0.05 | 1054.5/986 | 1.069 | 3.78 | 9.93 | 0.05 | 1126.3/986 | 1.142 | Torus |
| IGRJ 11366-6002 | 0.68 | 18.37 | 261.9/245 | 1.069 | 24.75 | 0.93 | 0.94 | 252.3/244 | 1.034 | 3.19 | 3.68 | 63.99 | 250.49/244 | 1.026 | T/D |
| IC 4518A* | 3.41 | 75.58 | 245.7/215 | 1.143 | 24.59 | 0.56 | 0.55 | 222.6/217 | 1.026 | 1.35 | 9.99 | 82.47 | 250.4/217 | 1.154 | Torus |
| NGC 7674* | 3.22 | 18.17 | 189.0/169 | 1.118 | 25.40 | 0.70 | 0.95 | 190.7/168 | 1.135 | 2.82 | 3.25 | 0.0001 | 179.4/168 | 1.068 | D |
| NGC 5033 | 1.35 | 78.47 | 1232.9/1058 | 1.165 | 23.49 | 0.77 | 0.95 | 1177.4/1058 | 1.113 | 0.45 | 10.00 | 87.41 | 1193.8/1054 | 1.133 | Torus |
| PEXMON | borus02 | XILLVER | |||||||||||||
|---|---|---|---|---|---|---|---|---|---|---|---|---|---|---|---|
| Name | kT1 | kT2 | BM | kT1 | kT2 | BM | kT1 | kT2 | BM | ||||||
| NGC 3998 | 20.54 | - | - | - | - | 20.58 | - | - | - | - | 20.51 | - | - | - | - |
| NGC 3718 | 22.03 | - | 0.89 | - | ME | 22.02 | - | 0.88 | - | ME | 22.03 | - | 0.89 | - | ME |
| NGC 4258* | 22.94 | 20.08 | 0.58 | 0.20 | 2ME+PL | 22.94 | 20.08 | 0.58 | 0.20 | 2ME+PL | 22.94 | 20.08 | 0.58 | 0.20 | 2ME+PL |
| ESO 253-G003* | 22.78 | - | - | - | - | 23.05 | - | - | - | - | 22.94 | - | - | - | - |
| NGC 1052 | 23.16 | 20.53 | 0.65 | - | ab*(ME+PL) | 23.20 | 20.71 | 0.63 | - | ME+PL | 23.83 | - | 0.86 | - | ab*ME |
| NGC 2655 | 23.31 | - | 0.65 | 0.09 | ab*2ME | 23.42 | 20.32 | 0.62 | 0.15 | 2ME+PL | 23.29 | - | 0.66 | - | ME*ab |
| NGC 3147* | 20.54 | - | - | - | ab | 20.54 | - | - | - | - | 22.78 | - | - | - | - |
| NGC 2110* | 21.76 | - | 0.65 | 0.09 | 2ME*2ab | 22.01 | 21.27 | 0.71 | - | (ME+PL)*ab | 21.88 | - | 0.70 | - | ME*ab |
| LEDA 96373* | 22.67 | - | 0.63 | 0.22 | 2ME*ab | 24.09 | - | 0.59 | 0.22 | 2ME*ab | 23.56 | 23.11 | 0.79 | - | (ME+PL)*ab |
| NGC 2992 | 21.89 | 21.20 | 0.81 | - | (PL+ME)*ab | 21.89 | 20.00 | 0.79 | - | (PL+ME)*ab | 21.90 | - | 0.63 | 0.19 | 2ME |
| M 51 | 22.36 | - | - | - | ab | 24.77 | - | - | - | - | 21.93 | - | - | - | ab |
| NGC 2273* | 23.15 | - | 0.71 | - | ME*ab | 24.55 | - | 0.26 | - | ME*ab | 23.36 | - | 0.71 | - | ME*ab |
| HE 1136-2304 | 20.97 | - | 0.59 | - | ME | 20.96 | - | 0.59 | - | ME | 20.96 | - | 0.65 | - | ME |
| IGRJ 11366-6002 | 21.81 | - | - | - | - | 21.99 | - | - | - | - | 21.81 | - | - | - | - |
| IC 4518A* | 23.22 | 20.96 | 0.70 | - | (ME+PL)*ab | 23.22 | - | 0.71 | - | ME*ab | 23.21 | - | 0.70 | - | ME*ab |
| NGC 7674* | 23.09 | - | - | - | - | 23.06 | - | - | - | - | 22.99 | - | - | - | - |
| NGC 5033 | 20 | - | - | - | - | 20 | - | - | - | - | 20.99 | - | 0.82 | 0.23 | 2ME |
| PEXMON | borus02 | XILLVER | ||||||||||
| Name | NH,W | Norm PLXMM | Norm PLNu | NH,W | Norm PLXMM | Norm PLNu | NH,W | Norm PLXMM | Norm PLNu | |||
| ( cm-2) | () | () | ( cm-2) | () | () | ( cm-2) | () | () | ||||
| NGC 3998 | - | - | 2.33 | - | - | 2.35 | - | - | 2.05 | |||
| NGC 3718 | - | - | 0.53 | - | - | 0.52 | - | - | 0.08 | |||
| NGC 4258* | - | - | 1.70 | 1.13 | - | - | 1.60 | 1.04 | - | - | 0.032 | 0.021 |
| ESO 253-G003* | - | - | - | 0.17 | - | - | - | 0.30 | - | - | - | 0.02 |
| NGC 1052 | 0.05 | 6 | 2.79 | - | - | 3.46 | 19.25 | 2.032 | 0.043 | |||
| NGC 2655 | 2.11 | 1.32 | 0.91 | - | - | 0.80 | 2.57 | 1.36 | 0.02 | |||
| NGC 3147* | - | - | 1.89 | 0.68 | - | - | 0.34 | 0.71 | - | - | 0.0066 | 0.012 |
| NGC 2110*w | 0.17 | -0.55 | 10.80 | 59.40 | 1.53 | 4.30 | 8.38 | 4.44 | 5.23 | 1.36 | 0.30 | 1.54 |
| LEDA 96373* | 0.79 | -0.93 | 0.12 | 0.80 | -0.55 | 5.93 | 7.94 | 2.01 | 0.005 | |||
| NGC 2992 | 0.49 | 2.53 | 18.58 | 0.64 | 2.48 | 20.80 | - | - | 0.40 | |||
| M 51 | 499.96 | 4.25 | 0.056 | - | - | 0.36 | 488.99 | 4.18 | 0.0012 | |||
| NGC 2273* | 2.95 | 1.24 | 0.29 | 0.94 | -1.14 | 5.14 | 2.97 | 1.23 | 0.006 | |||
| HE 1136-2304 | - | - | 2.53 | - | - | 2.53 | - | - | 0.0042 | |||
| IGRJ 11366-6002 | - | - | - | 2.42 | - | - | - | 2.26 | - | - | - | 1.43 |
| IC 4518A* | 3.79 | 1.37 | 0.77 | 1.65 | 4.41 | 1.44 | 0.65 | 2.13 | 3.97 | 1.39 | 0.015 | 0.032 |
| NGC 7674* | - | - | - | 0.36 | - | - | - | 0.24 | - | - | - | 0.003 |
| NGC 5033 | - | - | 1.93 | - | - | 1.90 | - | - | 0.032 | |||
| PEXMON | borus02 | XILLVER | |||||||
|---|---|---|---|---|---|---|---|---|---|
| Name | |||||||||
| NGC 3998 | 1.04 | 0.91 | 0.98 | 1.04 | 0.91 | 0.96 | 1.04 | 0.92 | 0.96 |
| NGC 3718 | 0.99 | 0.98 | 4.53 | 1.00 | 0.99 | 4.42 | 0.99 | 0.98 | 4.46 |
| NGC 4258* | 0.99 | 1.09 | 2.64 | 0.99 | 1.07 | 2.56 | 0.99 | 1.09 | 2.60 |
| ESO 253-G003* | 1.14 | - | 0.89 | 1.14 | - | 0.88 | 1.14 | - | 0.85 |
| NGC 1052 | 1.00 | 0.89 | 0.86 | 1.00 | 0.87 | 0.83 | 1.00 | 0.89 | 0.90 |
| NGC 2655 | 1.16 | 1.09 | 2.21 | 1.15 | 1.07 | 2.22 | 1.15 | 1.07 | 2.18 |
| NGC 3147* | 1.04 | 0.95 | 1.08 | 1.04 | 0.99 | 1.00 | 1.04 | 0.92 | 1.08 |
| NGC 2110* | 1.03 | 1.03 | 0.58 | 1.04 | 0.90 | 0.60 | 1.03 | 0.97 | 0.58 |
| LEDA 96373* | 1.12 | 0.84 | 0.87 | 1.13 | 0.87 | 0.85 | 1.12 | 0.86 | 0.88 |
| NGC 2992 | 1.027 | 0.91 | 0.127 | 1.026 | 0.909 | 0.122 | 1.026 | 0.915 | 0.13 |
| M 51 | 0.99 | 1.06 | 2.67 | 1.00 | 1.06 | 2.08 | 0.99 | 1.07 | 2.67 |
| NGC 2273* | 1.09 | 1.15 | 0.84 | 1.08 | 1.04 | 0.65 | 1.09 | 1.09 | 0.84 |
| HE 1136-2304 | 1.07 | 1.03 | 0.63 | 1.064 | 1.03 | 0.58 | 1.065 | 1.023 | 0.62 |
| IGRJ 11366-6002 | 1.15 | - | 1.46 | 1.15 | - | 1.42 | 1.15 | - | 1.46 |
| IC 4518A* | 1.12 | 0.97 | 1.11 | 1.11 | 1.10 | 1.09 | 1.11 | 0.90 | 1.09 |
| NGC 7674* | 1.02 | - | 1.58 | 1.02 | - | 1.60 | 1.02 | - | 1.57 |
| NGC 5033 | 1.05 | 0.75 | 0.28 | 1.05 | 0.76 | 0.27 | 1.05 | 0.76 | 0.28 |
| Observed | Intrinsic | ||||
| Name | Model | ||||
| NGC 3998 | 41.14 | 41.33 | 41.15 | 40.67 | borus02 |
| 41.28 | 41.46 | 41.28 | 41.16 | XILLVER | |
| NGC 3718 | 40.45 | 40.64 | 40.49 | 40.64 | borus02 |
| 40.45 | 40.63 | 40.49 | 40.63 | XILLVER | |
| NGC 4258* | 39.93 | 40.14 | 40.15 | 40.15 | borus02 |
| ESO 253-G003 | 42.66 | 43.56 | 42.92 | 43.59 | borus02 |
| 42.70 | 43.62 | 42.89 | 43.62 | XILLVER | |
| NGC 1052 | 41.44 | 42.13 | 41.76 | 42.15 | borus02 |
| NGC 2655 | 40.61 | 41.18 | 41.03 | 41.19 | borus02 |
| 40.60 | 40.19 | 40.96 | 41.20 | XILLVER | |
| NGC 3147* | 41.40 | 42.01 | 41.40 | 42.01 | borus02 |
| 40.39 | 41.95 | 41.39 | 41.95 | XILLVER | |
| NGC 2110* | 42.44 | 43.61 | 42.52 | 43.61 | borus02 |
| LEDA 96373* | 42.34 | 43.41 | 43.48 | 43.80 | borus02 |
| NGC 2992 | 42.911 | 43.318 | 42.95 | 43.32 | borus02 |
| M 51 | 38.94 | 39.81 | 39.68 | 40.25 | borus02 |
| NGC 2273* | 40.89 | 41.76 | 42.33 | 41.99 | XILLVER |
| HE 1136-2304 | 43.23 | 43.54 | 43.23 | 43.54 | borus02 |
| IGRJ 11366-6002 | 42.35 | 42.59 | 42.39 | 42.59 | borus02 |
| 42.33 | 42.58 | 42.39 | 42.58 | XILLVER | |
| IC 4518A* | 41.97 | 43.08 | 42.38 | 43.10 | borus02 |
| NGC 7674 | 42.17 | 43.03 | 42.42 | 43.07 | XILLVER |
| NGC 5033 | 41.04 | 41.43 | 41.04 | 41.43 | borus02 |
| Name | k2.0-10.0 | LBol | |
|---|---|---|---|
| (1) | (2) | (3) | (4) |
| NGC 3998 | 15.35 | 42.33 | -4.71 |
| NGC 3718 | 15.33 | 41.68 | -4.67 |
| NGC 4258* | 15.33 | 41.08 | -4.59 |
| NGC 5033 | 15.34 | 42.02 | -4.00 |
| ESO 253-G003* | 15.82 | 44.09 | -3.76 |
| NGC 1052 | 15.39 | 42.92 | -3.86 |
| NGC 2655 | 15.34 | 42.22 | -4.09 |
| NGC 3147* | 15.36 | 42.59 | -4.33 |
| NGC 2110* | 15.59 | 43.71 | -3.78 |
| LEDA 96373* | 16.74 | 44.73 | -2.59 |
| NGC 2992 | 15.88 | 44.15 | -2.29 |
| M 51 | 15.33 | 40.87 | -3.83 |
| NGC 2273* | 15.54 | 43.60 | -2.50 |
| HE 1136-2304 | 16.22 | 44.44 | -3.06 |
| IGRJ11366 | 15.53 | 43.58 | -3.09 |
| IC 4518A | 15.51 | 43.51 | -3.39 |
| NGC 7674* | 15.53 | 43.59 | -3.70 |
Appendix E Spectral models