*[ page=1, angle=0, scale=.75, xpos=0, ypos=130 ]
11email: {sbhambr1, prchauha, doupe, rao}@asu.edu
22institutetext: IBM Research, Yorktown Heights, NY, USA
22email: frederico.araujo@ibm.com
Using Deception in Markov Game to Understand Adversarial Behaviors through a Capture-The-Flag Environment
Abstract
Identifying the actual adversarial threat against a system vulnerability has been a long-standing challenge for cybersecurity research. To determine an optimal strategy for the defender, game-theoretic based decision models have been widely used to simulate the real-world attacker-defender scenarios while taking the defender’s constraints into consideration. In this work, we focus on understanding human attacker behaviors in order to optimize the defender’s strategy. To achieve this goal, we model attacker-defender engagements as Markov Games and search for their Bayesian Stackelberg Equilibrium. We validate our modeling approach and report our empirical findings using a Capture-The-Flag (CTF) setup, and we conduct user studies on adversaries with varying skill-levels. Our studies show that application-level deceptions are an optimal mitigation strategy against targeted attacks—outperforming classic cyber-defensive maneuvers, such as patching or blocking network requests. We use this result to further hypothesize over the attacker’s behaviors when trapped in an embedded honeypot environment and present a detailed analysis of the same.
Keywords:
Adversarial Behavior Markov Games Capture-The-Flag.1 Introduction
Cybersecurity research, particularly that focused on finding optimal decision strategies for a system defender, when faced by an adversarial threat, has almost always involved a strong dependence on the assumptions made over the adversary’s capabilities and the associated threat posed on the system vulnerabilities. Assuming a rational adversary, who will always choose the action or strategy that rewards highest returns, does not typically map to real-world situations [1]. However, this assumption has been a part of a common staple of approaches that model attacker-defender interactions to compute an optimal strategy for the defender, motivated by its practical performance [2].
Such adversarial interactions become more interesting and complex when defenders use cyber-deceptive techniques to respond to and thwart attacks. Deception strategies in cybersecurity frameworks, such as installing honeypot configurations to misdirect attackers, have been shown to be effective tools to disrupt attack kill chains and perform attacker reconnaissance [3, 4, 5, 6, 7]. Understanding an adversary’s behavior can aid cybersecurity defenders to optimally use the available resources to deploy deceptions and mitigate potential threats, while optimizing over the system constraints. Such knowledge can substantially aid a decision-making model, reducing the magnitude of the assumptions a defender must provide about the adversary to make the model operational.
In this paper, we build on the insight that an embedded honeypot [8]—a decoy environment that is inlined with genuine service functionality—can be configured in a way that is invisible to attackers while providing the defender with essential knowledge about the attacker’s techniques in real operational settings. Moreover, we show that the expected payoffs for the defender may vary when compared to the real-world scenario where the attacker’s behaviors may not meet the defender’s expectations or prior beliefs.
Our contributions are summarized as follows:
-
•
To ground this problem, we created a real-world Capture-The-Flag (CTF) environment hosting three system vulnerabilities, and we conduct studies using human subjects with varying system and attack skill levels who try to capture the corresponding (real) flags. Each of these vulnerabilities are protected by different real and practical mitigation strategies, one of which is a deception-based honey-patch [4], which misdirects an adversary to an embedded honeypot configuration that yields the attacker a fake, or as we refer to it in this work, a honeypot flag.
-
•
In parallel to these studies, we model this attacker-defender system interaction as a Markov Game and find its Bayesian Stackelberg Equilibrium. We start with the assumption of inputs to this Markov Game being set by a system expert.
-
•
Later, by varying these inputs, especially for cases when the attacker may be trapped in a honeypot configuration, we leverage the statistical results received from the conducted user studies, which further allows us to understand the differences between the obtained equilibria and the empirical setting.
The paper is structured as follows: we begin in Section 2 by providing a background on the CTF environment, Markov Games, and the system vulnerabilities with the corresponding mitigations used in this work. We present our hypotheses over the adversary behaviors and explain our user study setup along with the Markov Game modeling in Section 3. Experimental details and results, particularly involving a case-by-case evaluation and discussion on the observations is presented in Section 4. We then talk about related work in Section 5, with the conclusion discussing future directions for this work in Section 6.
2 Background
In this section, we first present a brief overview of the Capture-The-Flag style setup that we employed to host our user studies. Then, we introduce the real-world vulnerabilities that we used to design the user study test-bed and game-theoretic model evaluations, followed by the defense mechanisms deployed as mitigation strategies. We also describe the Markov Game formalism used for finding an optimal strategy for the defender.
2.1 Capture-The-Flag Setup
The primary goal of conducting the user studies is to gather realistic data on attacker behaviors using CTF environments, rather than artificially generating the data based on commonly accepted assumption over adversaries [9]. One way to achieve this is through creating prototype components to run CTF style experiments. We further integrate them into an existing open-source framework known as the iCTF framework [10, 11]†††https://github.com/shellphish/ictf-framework. This infrastructure allowed experiments to be run with a sizable number of human subjects to gather enough data for our desired analysis.
The iCTF framework is the core framework used for conducting user studies. It is primarily used to host attack-and-defense style CTF competitions every year†††https://shellphish.net/ictf/. For the purpose of collecting data for this study, we made several modifications to the existing implementation of the framework. Most of these modifications include deploying defense mechanisms and data collection tools. Since our goal is to simulate real-life scenarios, we choose three vulnerabilities (which are still prominent in current software applications) and develop three corresponding vulnerable applications for this purpose. The vulnerabilities are selected and deployed in a manner that it is possible to exploit them in a reasonable amount of time (which we verified through pilot studies), therefore faithfully representing typical large-scale cyber-attacks. The vulnerabilities selected include command injection and buffer overflow. The vulnerable applications are written in C and dockerized to isolate them from the host machine. Also, all modern security mitigations, including Position Independent Executable (PIE), Data Execution Prevention (DEP), and Address Space Layer Randomization (ASLR) are disabled.
2.2 Vulnerabilities and Exploits
We developed three different vulnerable applications. backup is the first application which allows users to store and retrieve data that is stored as files on the host system. One of the functions in this application concatenates a string with the user input and passes that string to the C function system(), and the user’s input is not sanitized, thus resulting in a command injection vulnerability.
The second application, sampleak, allows users to store and retrieve notes which are also stored as files, but unlike the backup application, a password is stored in the files, so that the user is required to provide a password when creating a note and needs to enter the correct password when retrieving them. The user input is stored in the application’s memory using buffers, but the function read() unintentionally reads in more bytes than the buffer can hold, thus resulting in a buffer overflow vulnerability.
The third vulnerable application is exploit-market, which allows users to store, retrieve, and list payloads, which are stored in the memory of the program. The vulnerability in this application is due to buffers being initialized with different sizes in separate functions, so when the function strcpy() is called to copy the contents of the buffer, a carefully crafted payload can result into a buffer overflow vulnerability. Another intentional bug is also placed in the form of a memory disclosure which leaks heap addresses of the string buffers.
2.3 Defense Strategies and Analysis Tools
The defense mitigations are selected for protecting the vulnerable applications. The mitigations include deploying Snort, an intrusion detection system on a router machine acting as a gateway between the attacker machine and the defender machine. Snort uses a rule-based configuration file for setup, and this rule filter has a list of commonly used shellcodes for exploiting various applications running on multiple architectures. We also extended a live-patching framework [12] to enable cyber-deceptive attack countermeasures.
To collect valuable attacker and defender information, we further deploy tools on our host machines that include: tcpdump, which is a network packet analyzer to capture network traffic for further analysis, and SysFlow [13, 14], an open-source system-call monitoring framework that encodes the representation of system activities into a compact entity-relational format that captures the interactions of processes with system resources, including file and network activity. This provides a richer context for post-exploitation analysis [15].
2.4 Attack Graph
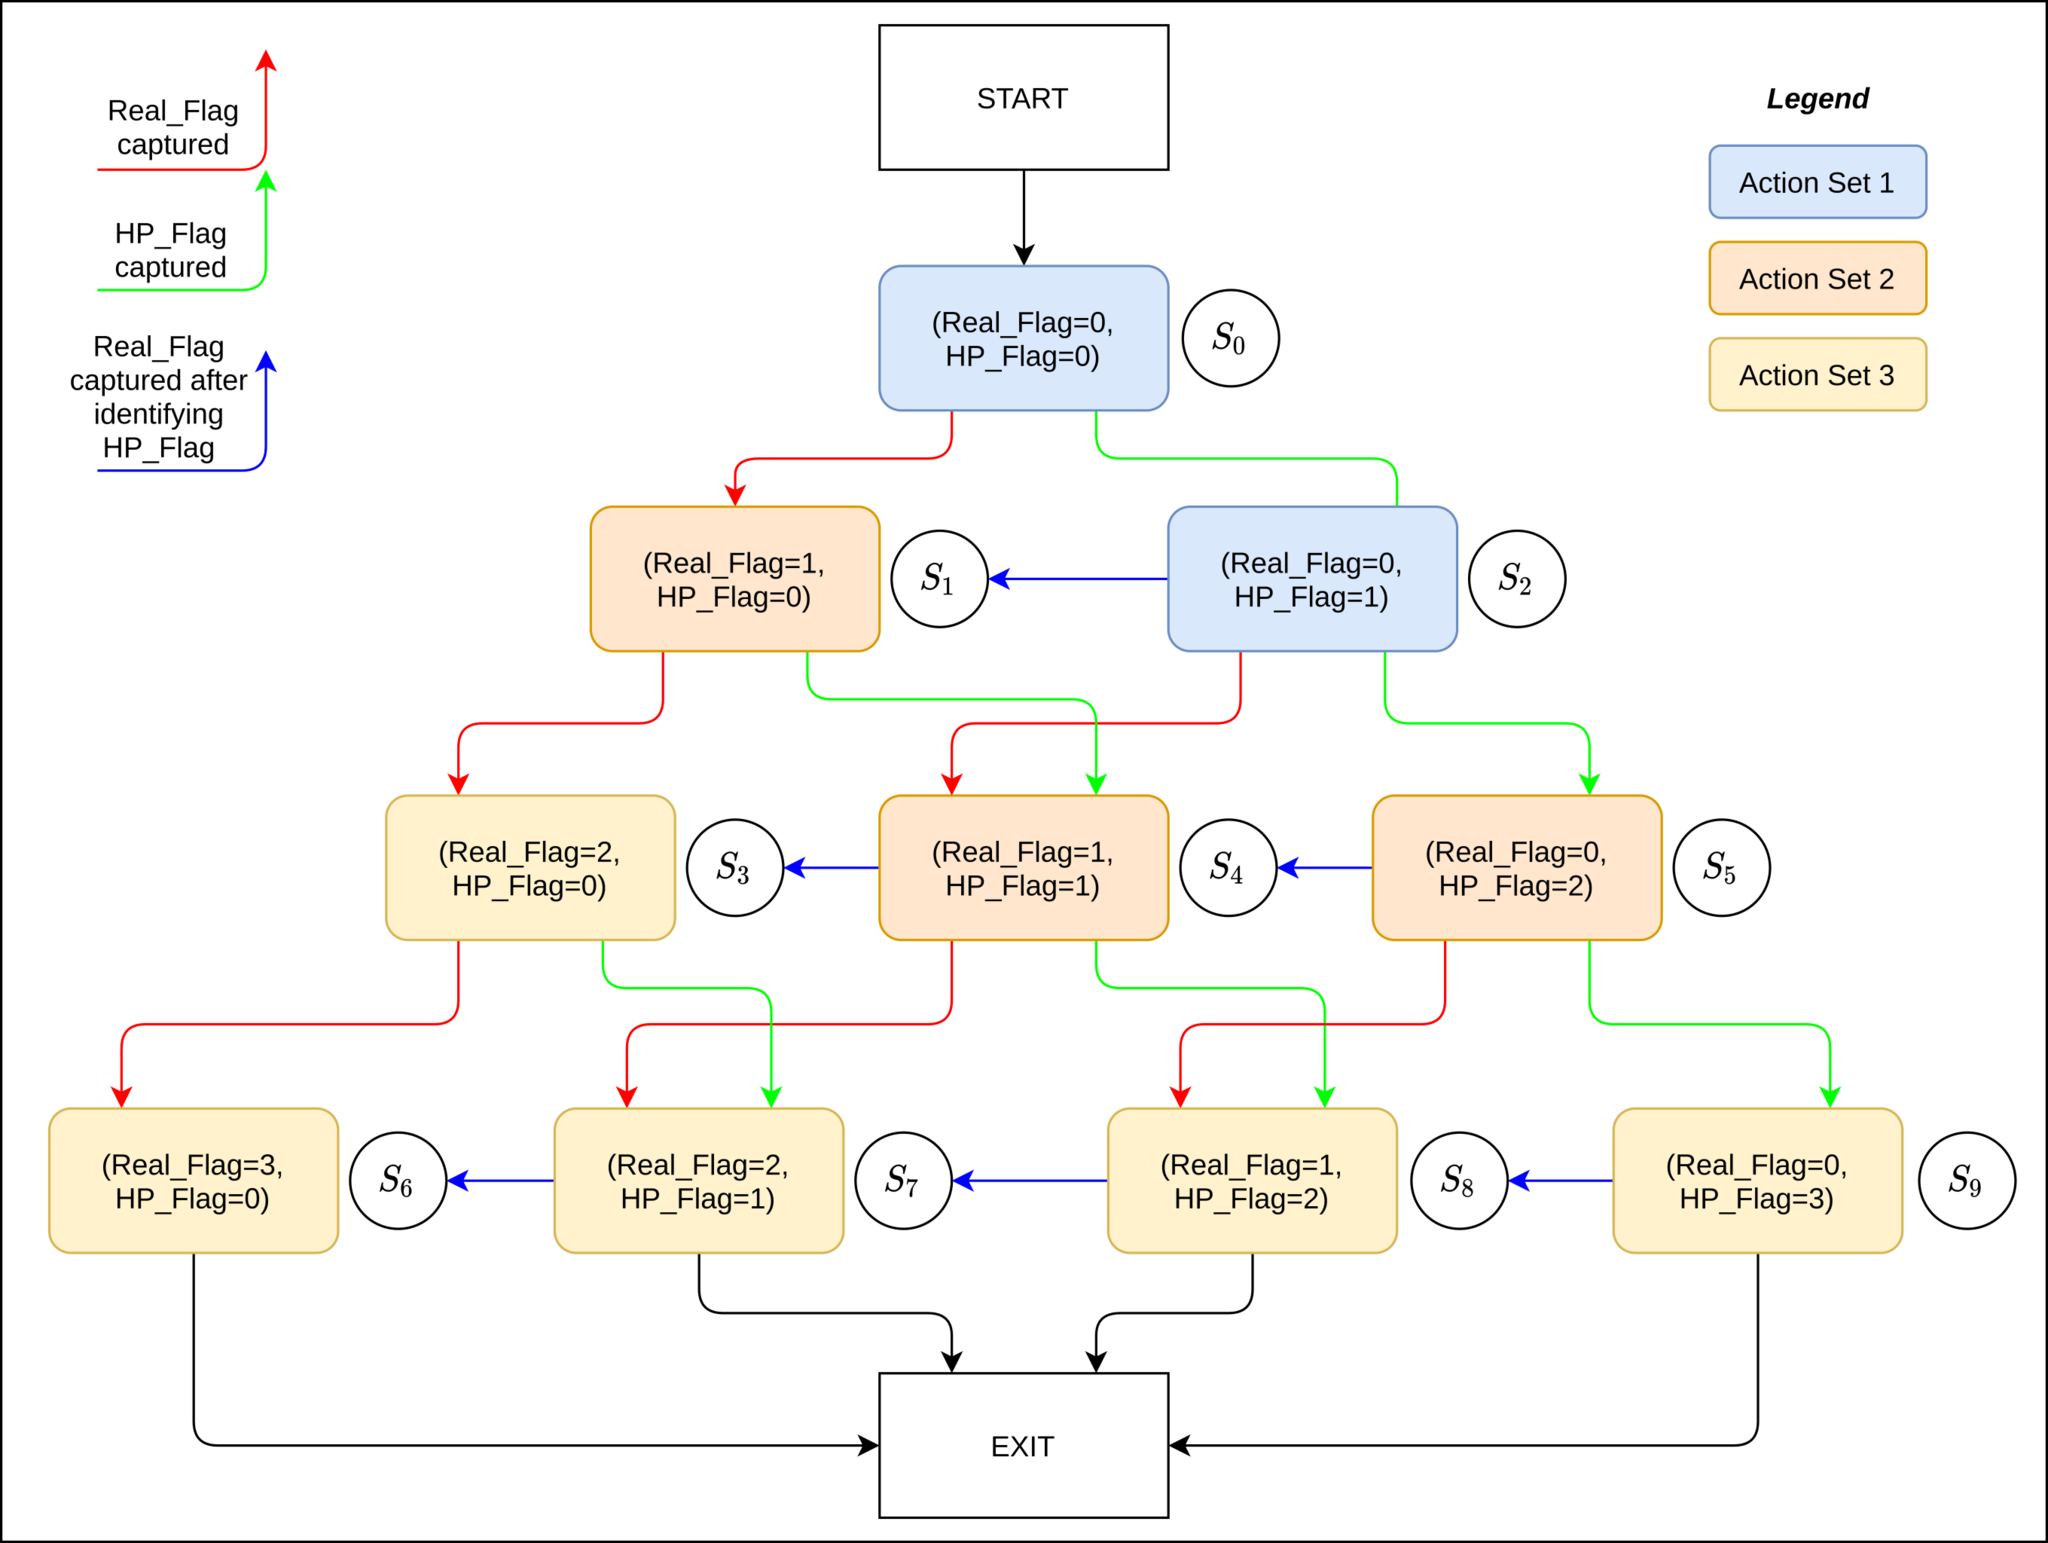
Attack graphs (AGs) have been established as useful structures to represent exploit possibilities and derive attack behaviors for an adversary [16, 17]. An attack graph is represented as , where denotes vertices or nodes representing the different states the adversary can be in, and denotes the edges between these nodes that represent the actions the adversary can take to move one from one state of the exploit to another.
Figure 1 is an example of an attack graph for an attacker trying to exploit the vulnerabilities present in the environment with the possibility of one or more of them being honey-patched, i.e., deceiving and misdirecting the attacker into a honeypot configuration where the system defender can extract useful insights about attacker behavior.
As noted in [18], an attack graph can be represented as the tuple , where:
-
•
is the finite set of states or nodes, in our case a total of 10, on one of which the attacker will be present during the exploit,
-
•
represents the transition function which defines the probabilities of the attacker taking an available action in a state and reaching another state,
-
•
represents the set of initial states, and in our case, it is the state where the attacker has captured 0 real or honeypot flags,
-
•
represents the set of final states (success or failure) for the attacker, and in our case, states where the attacker has tried exploiting each of the three vulnerabilities and has either captured the real flag or the honeypot flag,
-
•
represents the atomic propositions used for labeling these states or nodes, which in our case correspond to the number of real flags and honeypot flags captured by the attacker,
-
•
and, finally, represents a finite set of actions, such as shown by different colored nodes representing different sets of actions available to the attacker in our attack graph. We talk about the different action sets corresponding to each of the states separately in Section 3.3.
2.5 Markov Game
We define a Markov Game, and the associated notations, between the attacker () and defender () as:
-
•
a set of states representing the collection of states,
-
•
action set which comprises of the cross-product between the action sets of the attacker () and that of the defender (),
-
•
represents the transition probability matrix from a state to when the attacker takes an action and the defender takes an action ,
-
•
denotes the utility or the rewards received by the player ( or ) in state when action is taken, and
-
•
to take discounted future rewards into consideration, we define for both the players and .
Basak et al. [19] highlight that it is not straightforward to make the assumption that the would be the same for both and . Following the limitations or the absence of a formal study as shown in [9], we take a similar approach and assume for the time being that .
For the zero-sum game that we assume in this work, an optimal policy for the defender’s strategy can be computed [20], and can be updated to induce a min-max strategy for the two players [9], by calculating the -value or the expected return for an actor ( or ) in state and taking action for as:
| (1) |
where the defender takes action against the attacker’s action and reaches another state . The value-function for the defender’s mixed policy for the probability of choosing action is defined as:
| (2) |
We use this to compute the optimal mixed strategy for our defender for the different experimental settings, as explained in more detail in Section 4. Given the components of our Markov Game for a fixed set of utilities, which are dependent on the exploitable vulnerabilities and available mitigations used, the transition probability matrix may vary based on the threat level posed by an adversary. This motivates us to test our Markov Game modeling by varying these input parameters, and we discuss these variations further in detail in Section 3.3.
3 Methodology
In the current setup, we assumed that the system contains 3 vulnerabilities, for . One or more of these vulnerabilities may be honey-patched by the system defender. Honey-patches [4] are software security patches that are modified to avoid alerting adversaries when their exploit attempts fail. Instead of blocking the attempted exploit, the honey-patch transparently redirects the attacker session to an isolated honeypot environment. Adversaries attempting to exploit a honey-patched vulnerability observe software responses that resemble unpatched software, even though the vulnerability is actually patched. This allows defenders to observe attack actions until the deception is uncovered.
Figure 1 shows a scenario where all three vulnerabilities are honey-patched. Note that the attack graph for a case where one or more vulnerabilities are not honey-patched will be a special case of the attack graph shown in the figure, with those particular vulnerabilities leading to a real flag, and not to a honeypot flag.
In the beginning of the game, the attacker has the option to exploit one of the vulnerabilities, denoted by starting state . To illustrate how the game advances, assuming that the initial target is the honey-patched vulnerability , the resulting attacker state would be , denotation the state where the attacker is trapped into a decoy and fails to capture the real flag. The attacker then progresses through the game and eventually reaches a terminal state , where & and , since an attacker can obtain at most either of the two flags for each exploit, or none at all. Section 3.1 details our hypotheses about the dynamics of the game.
3.1 Hypotheses
We design our study to test two different sets of strategies that can be adopted by an attacker once trapped into a honeypot configuration. We also state here the assumptions behind each hypothesis that we test.
-
H1
Once trapped in a honeypot environment, the attacker chooses to continue with the existing strategy to exploit the remaining vulnerabilities.
-
H2
Once trapped in a honeypot environment, the attacker chooses to change the current strategy to exploit the remaining vulnerabilities.
Hypothesis 1 assumes that the attacker did not discover the deception, i.e., a state where a honeypot flag was obtained. Hence, the attacker chooses to to continue with the existing strategy without worrying about subsequent traps.
Hypothesis 2, on the other hand, assumes that the attacker becomes aware of the new state, i.e., a state where a honeypot flag is discovered. Hence, the attacker chooses to change the current strategy (i.e., attempts to escape the honeypot environment). This would allow the attacker to retry exploiting the honey-patched vulnerability while avoiding getting trapped in the honeypot. In case the attempt to escape the particular honeypot configuration is unsuccessful, the attacker awareness of the deception will influence the attack strategy to be more cautious and observant of subsequent honey-patches.
Next, we discuss the user study that allows us to track the varying attack behaviors generated by each of the adversaries, followed by our Markov Game modeling used for running the experiments.
3.2 User Study
The ictf framework is intended to be used for hosting multi-team (over 100 have been accomplished) attack-defense style CTFs. In our user studies, the goal is to have a human participant assuming the role of an attacker and several security defense mechanisms assuming the role of defenders. The attacker’s machine has identical copies of the vulnerable applications to enable attackers to analyze the application, identify vulnerabilities, and develop working exploits. On the defender’s machines, the vulnerable applications are deployed with either one of the security mitigations or no mitigation.
A pre-generated string called the flag is placed inside the root directory of the docker containers running the vulnerable applications. The goal of the attacker is to successfully exploit the vulnerabilities and read the flag, which is only accomplished by successfully exploiting the vulnerable application.
Figure 2 shows the infrastructure setup. The router serves as a gateway between all of the team virtual machines (VMs). The attacker participant is granted SSH access to the team-VM1 machine. They can only interact with the vulnerable services through the team-VM1 machine. All team-VMs run the same environment (Ubuntu 18.04) and have copies of docker images for all vulnerable applications, which will be referred to as services. As a result, the attacker has access to copies of all the services used in the experiment in order to analyze and develop exploits for them.
Once the infrastructure is created, a random setup of services and defenses is selected. The service-defense relationship is one-to-one. Figure 3 shows one randomly selected setup wherein backup has no defense mitigation, sampleak has honey-patching as a mitigation and exploit-market has a Snort filter as a mitigation. One participant at a time assumes the role of an attacker and we describe that their goal is to identify vulnerabilities in the vulnerable service and write an exploit for the vulnerability that reads the flag. The participant is given sufficient time to work on each service. Whether they successfully exploit it or run out of time, they try to exploit one service at a time, in the consistent order of: backup, sampleak, exploit-market. Once the experiment concludes, the data is collected and stored for further analysis.
3.3 Markov Game Modeling
The different stages of the attack graph in Figure 1 represent the diverse scenarios that an attacker might be in, when trying to exploit the different vulnerabilities present on the defender’s system. In each of these unique stages, the attacker has a set of actions available to execute on the system. Intuitively, as the game progresses, the number of possible actions for both the attacker and the defender decreases, which limits their control over the game. Hence, we formulate the model which can recommend the action probabilities for the defender at each of these stages. We further analyze what varying costs the defender incurs when taking each of these actions and how the future expectations of the defender’s actions can influence the adopted mitigation strategies.
3.3.1 State space
for the Markov Game is defined by the nodes of the attack graph. The attacker enters the system to begin exploits without any real or honeypot flags, represented by state . Similarly, after attempting exploits on each of the three vulnerabilities, the attacker may end up with a set of real and honeypot flags and be end in one of the terminal states from to , after which the attacker exits the system. The blue, orange, and yellow colors in these nodes represent the action sets available to the agent in each of these states, and we explain these action states in more detail next.
3.3.2 Action space
for the Markov Game comprises of the action sets , i.e., of both the players. Intuitively, as the game progresses and the number of vulnerabilities remaining to exploit for the attacker reduce, the possible action set also minimizes for the attacker, and also for the defender given the naturally assumed resource constraints. Note that the defender takes actions before the game begins and assigns the desired set of mitigations on one or more of the existing system vulnerabilities.
In the example attack graph shown in Figure 1, Action Set 1 comprises of four actions for the attacker: do nothing, exploit vulnerability 1, exploit vulnerability 2 or exploit vulnerability 3. For the defender, the four actions available are: no mitigation, honey-patch vulnerability 1, honey-patch vulnerability 2 or honey-patch vulnerability 3.
Further in the game for Action Set 2, the attacker has three actions remaining as the attacker cannot return to exploiting the first vulnerability. Similarly, the defender has all the actions available except deploying honey-patch for the first vulnerability for which an exploit was attempted.
Lastly, for Action Set 3, the attacker has two actions remaining: do nothing, and exploit vulnerability 3. Similarly, the defender has two actions remaining: no mitigation, and honey-patch vulnerability 3.
| Defender’s actions () | |||||
|---|---|---|---|---|---|
| no_mon | hp_1 | hp_2 | hp_3 | ||
| no_op | 0 | -3 | -3 | -3 | |
| Attacker’s actions () | exp_1 | -5.9 | 2.9 | -8.9 | -8.9 |
| exp_2 | -5.9 | -8.9 | 2.9 | -8.9 | |
| exp_3 | -5.9 | -8.9 | -8.9 | 2.9 | |
3.3.3 Utility Matrices:
for states and comprises of the actions, along with the corresponding utilities shown in Table 1. Similarly, Table 2 and Table 3 represent the actions for both the attacker and the defender for states , , and , and, states , - respectively. By running some initial experimental studies comparing the payoffs received, we conclude that honey-patching offers the highest returns to the defender against any vulnerability exploit, as compared to deploying no mitigation or using Snort. We further analyze the cases where the defender has an option of honey-patching one or more vulnerabilities present in the system. Hence, Tables 1, 2 and 3 only comprise of the honey-patching actions for the defender, and the scores for which have been computed using the scoring system of CVSS v3.1†††https://www.first.org/cvss/v3.1/specification-document. These CVSS scores determine the exploitability and severity of the three exploits used in this study.
|
||||||
|---|---|---|---|---|---|---|
| no_mon | hp_2 | hp_3 | ||||
| no_op | 0 | -3 | -3 | |||
| Attacker’s actions() | exp_2 | -5.9 | 2.9 | -8.9 | ||
| exp_3 | -5.9 | -8.9 | 2.9 | |||
|
|||||
| no_mon | hp_3 | ||||
| Attacker’s actions () | no_op | 0 | -3 | ||
| exp_3 | -5.9 | 2.9 | |||
3.3.4 Transition Matrices
vary based on the modeling of the game. We model three different scenarios to evaluate the results from our user studies. We begin with the assumption that the system defender either does not have any prior knowledge on the threat level posed by the adversary, in which case the transition probabilities can either be set randomly with non-zero probabilities assigned to all feasible state transitions, or, as an expert with the knowledge of the state transitions for any attacker interacting with the environment. The transition matrix for the Naive Model thus comprises of preset probabilities to the different possible transitions. This model can also assume that the defender incurs an equal cost of deploying a honey-patch for each of the three vulnerabilities. Later, we also relax this assumption and assign relatively higher costs to mitigations which are more difficult to deploy by the defender on the system. We randomly generate probabilities for all feasible transitions for the former case, and for the latter, the different probabilities associated with the model are shown in Table 4.
| Observation | Probability | ||
|---|---|---|---|
|
0.75 | ||
|
0.4 | ||
| Trapped in honeypot | 0.4 |
Note, that the probability of not capturing any flag for any vulnerability is 0.2 in the case where honeypot is present, and 0.25 when it is not deployed.
For the third model which is the Updated Model with Tuned Parameters using the data collected through the successful iCTF user studies and observations drawn from the attacker participants’ behavior, we update the transition matrix for the model to better emulate the real-life scenario. The different probability inputs associated with this model are shown in Table 5.
| Observation | Vulnerable Application | Probability |
|---|---|---|
| Real flag captured if no honeypot | backup | 1.0 |
| sampleak | 0.43 | |
| exploit-market | 0.4 | |
| Trapped in honeypot | backup | 1.0 |
| sampleak | 0.5 | |
| exploit-market | 0.6 |
We also remove the assumption that the defender incurs equal cost of deploying the honeypot configuration as a mitigation, since configuring a honeypot is harder for a stronger suite of vulnerabilities that may be targeted by a system adversary. For all the above-mentioned modeling scenarios, we vary the costs of honey-patching these vulnerabilities accordingly and thus have a uniform and a non-uniform mitigation cost scenario for all three the models. In the non-uniform variants, the minimum cost of 1 is associated with honey-patching backup and the maximum cost of 3 is associated with honey-patching exploit-market. On the other hand, for the uniform cost variants, a cost of 3 is associated with deploying a honey-patch against each of the three vulnerabilities.
4 Experimental Evaluation and Results
4.1 iCTF User Studies
After running six pilot studies, and making necessary infrastructure changes to gather data on the adversary’s behavior, we conducted 18 user studies. Participants were recruited from a pool of people known to have prerequisite skill-set (vulnerability analysis and software exploitation) and were rewarded $50 USD for their participation. Prior to this, we obtained an IRB approval from our institution for conducting the user studies.
Table 6 shows the summary of these user studies. The first column represents each service used in the experiments. The second column represents the total number of experiments conducted, and the third column represents the number of times the participant timed out without being able exploit a particular service. The last column is broken down by the defense mechanism deployed, the numerator represents successful exploitation of the service, and the denominator represents the total number of times the service is deployed with the particular defense.
| Flag Captured w/ Defense Mechanism | ||||||
| None | Snort | Honeypatch | ||||
| Challenge | Total Experiments | Timed Out | Real Flag | Real Flag | Honeypot Flag | |
| backup | 18 | 0 | 6/6 | 6/6 | 0/6 | 6/6 |
| sampleak | 18 | 9 | 4/6 | 2/5 | 0/7 | 3/7 |
| exploit-market | 15 | 6 | 3/5 | 3/5 | 0/5 | 3/5 |
4.2 Markov Game Strategy Evaluation
We first discuss the performance of our zero-sum Markov Game model against Uniform Random Strategy (URS), which has been shown to be effective in similar attacker-defender settings [21, 22, 23], and Min-Max Pure (MMP) Strategy. The utility payoffs in our results correspond to the payoffs of the defender. As it has been previously shown [9], Optimal Mixed Strategy outperforms the other two algorithms with respect to returns gained by the system defender. By testing the three algorithms for the Naive Model with both randomly set and expertly assumed set of transition probabilities with uniform costs of deploying honeypots, we establish a baseline that would later help us understand how additional knowledge of the attacker that the system defender gained, can improve upon the decision making model.
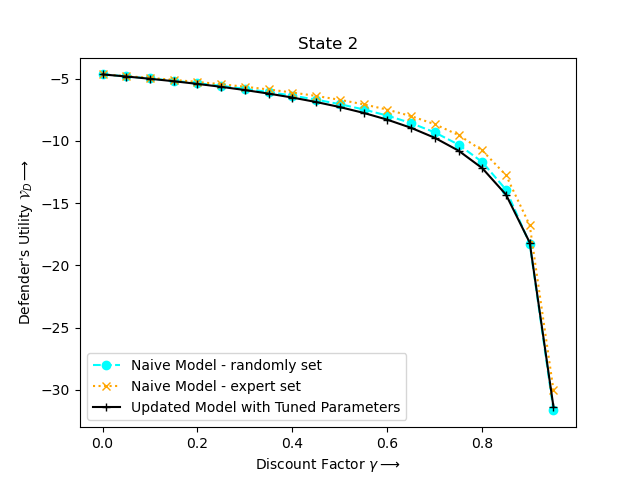
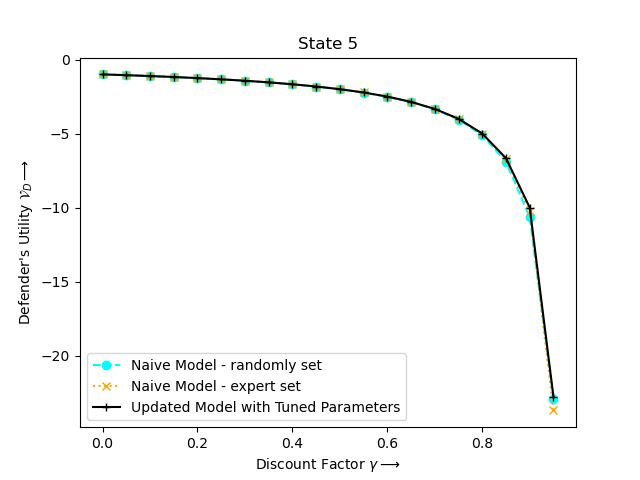
With reference to the state space represented in Figure 1, we show the results for state where the attacker is trapped in the first honeypot, state (similar to ) where the attacker is trapped in the second honeypot, and finally state (similar to state and state ) where the attacker is trapped in the honeypot set for the third vulnerability. We are more interested to analyze these states where deception is successful for the defender, and thus we would want to compare the usefulness gained by the user-studies later, particularly for these states.
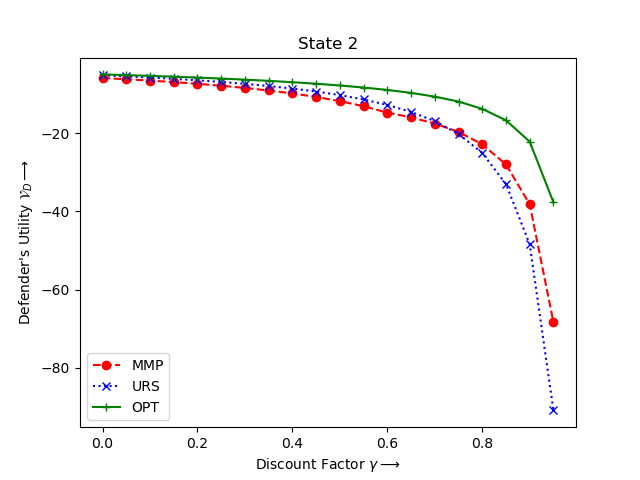
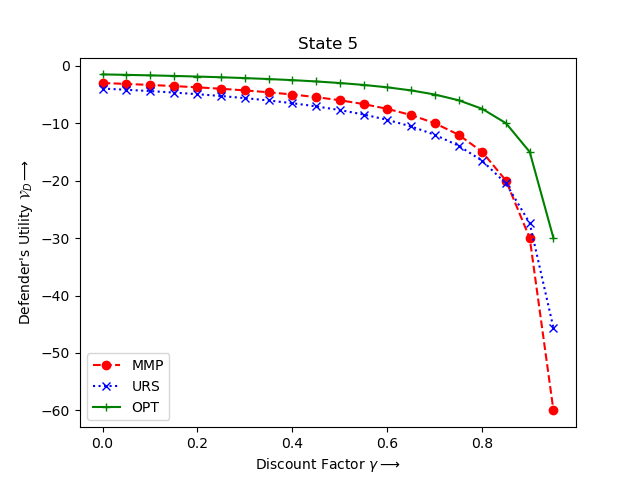
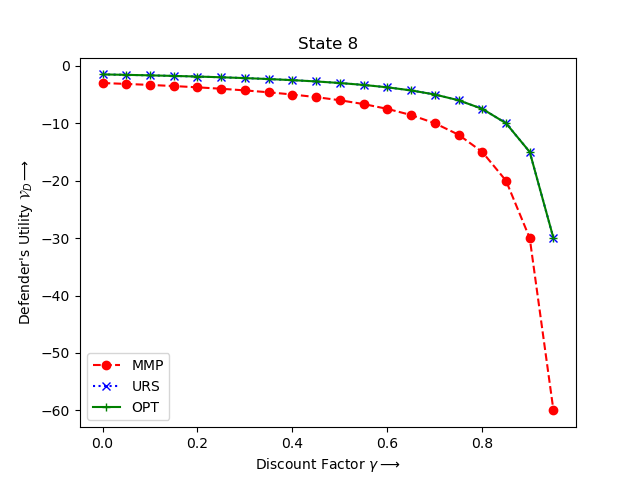
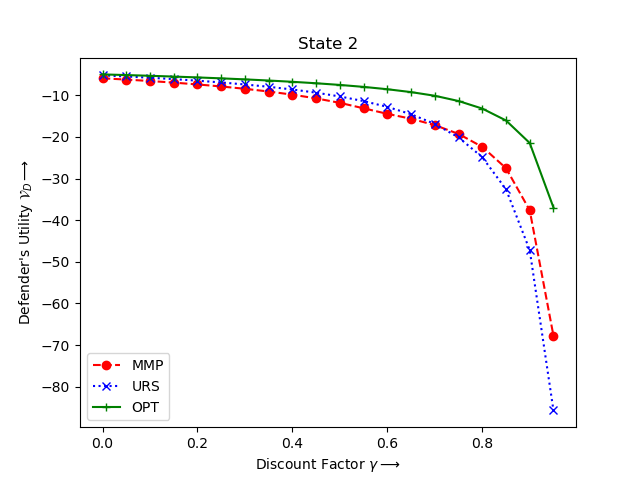
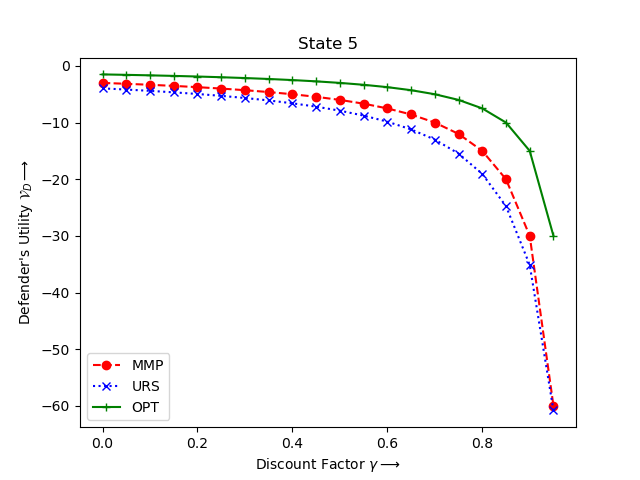

Figures 4 and 5 show that Optimal Mixed Strategy (OPT) outperforms MMP and URS for states seen early (Figures 4(a), 5(a)) and in the middle (Figures 4(b), 5(b)) of the game, and returns payoffs for the defender equal to URS in the later stages (Figures 4(c), 5(c)) of the game where both URS and OPT output the same distribution over the remaining two actions for the defender.
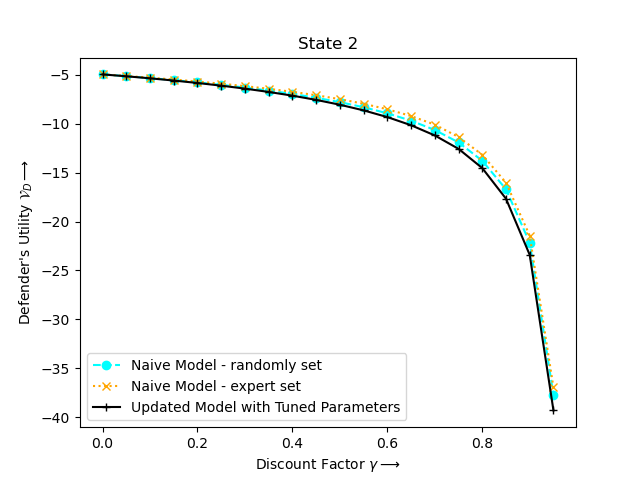
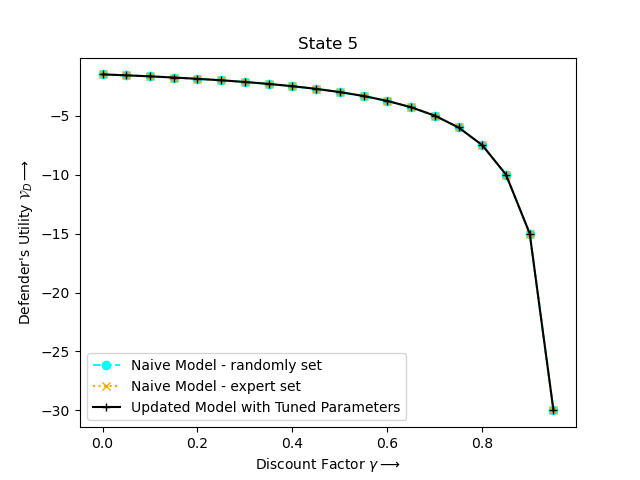
We further apply the Optimal Mixed Strategy to the updated model scenario that we discussed in Section 3. We only focus on the Optimal Mixed Strategy to compare the Stackelberg equilibrium obtained under the following case studies. We divide each case study using the discount factor to understand the variation in the model’s decision making as the weightage for future exploit mitigations varies for the system defender, and particularly discuss the two corner cases of and . We compare the equilibria obtained among the three model variations under uniform costs of deploying mitigations, i.e., Naive Model with randomly set transition probabilities, Naive Model with expertly assumed transition probabilities, and Updated Model with Tuned Parameters. We carry out a similar comparison among the three models for non-uniform costs later.


| Case Study 1 | Probability of honey-patching | |||
| backup | sampleak | exploit-market | ||
| Naive Model (randomly set) | 0 | 0.33 | 0.33 | 0.33 |
| 0.95 | 0.45 | 0.09 | 0.09 | |
| Naive Model (expert set) | 0 | 0.33 | 0.33 | 0.33 |
| 0.95 | 0.46 | 0.08 | 0.08 | |
| Updated Model with Tuned Parameters | 0 | 0.33 | 0.33 | 0.33 |
| 0.95 | 0.5 | 0.1 | 0.05 | |
Case Study 1
The first case focuses on the first honey-patch mitigation deployed in the game where both the attacker and the defender can take any possible actions, i.e., the attacker may choose to exploit any vulnerability or none at all, and the defender may choose to honey-patch any one or more vulnerabilities or choose to deploy no mitigation at all. As shown in Figure 1, we are dealing with the case when Action Set 1 is available.
For the minimum weightage given to future actions and their corresponding expected payoffs using , each of the three models provide an equal probability to honey-patch each of the three vulnerabilities with the respective probabilities being 0.33 each. This is expected as independent of the transition probabilities, all three models share the same utility gains for honey-patching all three vulnerabilities, and the Q-value or the expected return does not depend on the transition matrix for , as shown in Equation 1.
For the maximum weightage given to future actions and their corresponding expected payoffs using ,
-
•
The randomly set Naive model provides a probability of 0.45 to honey-patch backup, and an equal probability of 0.09 to sampleak and exploit-market.
-
•
The expert set Naive model follows a similar trend and provides 0.46 to honey-patch backup and 0.08 to the other two.
-
•
The Updated Model with Tuned Parameters provides the highest probability of 0.5 to honey-patch backup, a much smaller probability of 0.1 to sampleak, and 0.05 to exploit-market.
Figures 6(a) and 7(a) show that the expected payoffs (Naive Model setups) are marginally higher than the actual payoffs received when the true knowledge about the attacker was used by the Updated Model with Tuned Parameters. Hence, we conclude that the defender’s payoffs may not be as high as we may estimate them to be when modeling the attacker’s behavior from the defender’s perspective.
Case Study 2
The second case is when the attacker has captured either the real-flag or the honeypot flag for backup, and the defender can choose to honey-patch either the second or the third vulnerability or choose to deploy no mitigation at all. Thus, this scenario represents the case when Action Set 2 is available.
For the minimum and the maximum weightage given to future actions and their corresponding expected payoffs using and , respectively, all the three models give a 0.5 probability on deploying a honey-patch for sampleak and 0 probability for deploying one on exploit-market. This can be seen in Figures 6(b) and 7(b) when the payoffs returned by all three models are equal.
Case Study 3
For each of the later states when the defender has the option either to honey-patch exploit-market or use no mitigation at all, these states are cases when either the attacker captured 2 real-flags, 2 honeypot flags, or 1 of each kind for the first two vulnerabilities. Thus, this scenario represents the case when Action Set 3 is available.
For the minimum and maximum weightage given to future actions and their corresponding expected payoffs using and , respectively, all the three models provide a 0.5 probability to honey-patch exploit-market. Figures 6(c) and 7(c) show equal payoffs for the defender in all three models. Note that in each of the case studies, the remaining probabilities (as the distribution over actions totals to 1.0) have been provided to the no mitigation action for the defender.
4.3 Discussion
When using uniform and non-uniform costs for the defender to deploy mitigation strategies, we note that the three models show slight variations only for the first three states of the game, particularly for the case when a high weightage is given to future gains or payoffs. Recall that these three states correspond to the following scenarios:
-
•
State : when the attacker is at the starting state of the game and has acquired no flags so far.
-
•
State : when the attacker tried exploiting the first vulnerability and successfully obtained a real flag.
-
•
State : when the attacker tried exploiting the first vulnerability and was successfully trapped into the honeypot, thereby incurring a fake flag.
For all the other states, i.e., from state to state , we note that all three models give the exact same utility returns. Also, irrespective of the state the defender is at the start when attempting the first vulnerability exploit, the three models provide a similar probability of 0.5 to deploy a honey-patch to mitigate the next possible exploit. Hence, we hypothesize that the earlier the adversary is trapped in a honeypot, the better it is for the defender.
The difference in the utility returns is the most prominent for state , as shown in Figures 6(a) and 7(a), where the attacker was trapped in the first honeypot of the game while exploiting the first vulnerability. The initial model with transition probabilities set by the expert dominates the other initializations and gives the highest return, followed by the initial model with probabilities set randomly, and the least returns are obtained through the model initialized using data. The most important observation here is that model parameters set randomly or by expert may not imitate the true model representative of the real-world attack scenario. Hence, in the most important stages of the game, when the model results differ, defensive strategies tend to overestimate the returns from the randomly set or expert set model initializations as compared to the model we obtained from the real-world user studies.
4.3.1 Evaluating the Hypotheses
In the first hypothesis, we assumed that the attacker, once trapped in a honeypot, may continue with the existing strategy without worrying about future honeypots. The results from the user studies show that none of the attackers received the observation, until informed explicitly about the honeypot flag, that they failed to get the real flag, thus verifying our expectation behind this hypothesis. From the equilibria comparison shown in Figures 6 and 7, we note that the payoffs for the defender are primarily equal to the payoffs obtained by the Naive Models, both with randomly set and expert set transition probabilities, thereby confirming that the adversary’s behaviors did not deviate much from the system defender’s expectations in this case.
In the second hypothesis, we assumed that the attacker, once trapped in a honeypot and knowing about the current state, will change the existing strategy to get out of the honeypot and exploit the future vulnerabilities with caution. Only in one instance, an attacker is able to escape the honeypot for sampleak after the user study ends and the attacker is informed about the honeypot flag. In this case, factors such as attacker’s experience and expertise level, ease of exploiting the vulnerability and the effectiveness of the deployed honey-patch (e.g., an incomplete patch), all play an influential role. Due to these reasons, it is not easy to validate this hypothesis with 100% confidence, and hence, we see this as one open direction for future research to investigate in detail.
5 Related Work
Learning attack behaviors for a cybersecurity system has been a problem of relevant interest, particularly when designing decision making model frameworks for the defender. In an Internet of Things setting, Galinkin et al. [24] classify attackers as risk-averse and risk-seeking to understand the suite of scenarios preferred by such adversaries. Assessing the different modalities that influence an attacker’s decision making in real-world scenarios has proven to be a challenging task, and necessitates the requirement of better models that can capture such behavioral patterns more closely [25]. One of the recent attempts on learning attacker’s behavior have been based on approximating the preferences and capabilities of the attacker based on previously collected data over network packets, to learn about the preferences, choices or capabilities of a potential adversary [26]. However, understanding and collecting such data for adversaries, particularly when faced with decoy mitigation strategy, has not been analysed so far.
Do et al. [27] survey existing game-theoretic techniques on cyber security and privacy challenges, and highlights the advantages and limitations from the design to implementation of defense systems. Such evaluations strongly encourage the need to utilize such effective modeling frameworks to fully comprehend the evolving security and privacy problems in cyberspace and to find viable solutions. On the other hand, cybersecurity exercises have also been popularly used as a platform to teach cyber security concepts, and also to conduct experiments to study, analyze and solve issues related to cybersecurity [28, 29, 30, 31, 32, 33, 34, 35, 36].
The study setup presented in [36] explores the use of cyber security exercises and competitions to obtain vital data on measuring the impact of mitigations against exploits and their corresponding success. In this work, our primary focus stayed on the deception-based mitigation of honey-patching vulnerabilities and how the adversary interacted when faced with such a scenario.
6 Conclusion & Future Work
Cybersecurity exercises enable the collection of data on the interactions between attackers and a system defender, to gain insightful knowledge about the attacker’s state, which can be used to further to improve the strategy adopted by a defender when faced by a potential threat. In this work, we take on the challenge of analyzing closely these interactions in deception-based experimental setups where the adversary is faced by three different types of decoy traps. We started with a baseline game-theoretic framework where we manually set the probability distribution over the attacker’s strategy, and update this model with the results collected using the cybersecurity exercise carried over a real-world CTF platform. We observe that the interactions between the defender and the adversary in the initial stages of the game makes a more significant difference in the total expected utility gain for the defender, than in the later stages of the interaction. Moreover, models initialized randomly or using subject-expert knowledge may also lead to the problem of overestimation for the defender’s payoffs in certain scenarios. Since we have a constrained control over the different modalities influencing the adversarial behavior noted in these studies, we believe that gaining further knowledge on the attack behavior when faced with deception-based mitigation strategies holds promise for improving the defender’s decision-making model.
6.0.1 Acknowledgements
This work was supported in part by U.S. ACC-APG / DARPA award W912CG-19-C-0003 and the U.S. Army Research Laboratory under Cooperative Agreement Number W911NF-13-2-0045. Any opinions, recommendations, or conclusions expressed are those of the authors and should not be interpreted as representing the official views or policies of the Department of Defense or the U.S. Government. Approved for Public Release, Distribution Unlimited. We would also like to thank Sailik Sengupta for his useful insights, helpful discussions and feedback on this work.
References
- [1] Yasaman Abbasi, Debarun Kar, Nicole D Sintov, Milind Tambe, Noam Ben-Asher, Don Morrison, and Cleotilde Gonzalez. Know your adversary: Insights for a better adversarial behavioral model. In CogSci, 2016.
- [2] Vincent Conitzer and Tuomas Sandholm. Computing the optimal strategy to commit to. In Proceedings of the 7th ACM conference on Electronic commerce, pages 82–90, 2006.
- [3] Kristin E. Heckman, Frank J. Stech, Roshan K. Thomas, Ben Schmoker, and Alexander W. Tsow. Cyber Denial, Deception and Counter Deception: A Framework for Supporting Active Cyber Defense, volume 64 of Advances in Information Security. Springer, 2015.
- [4] Frederico Araujo, Kevin W. Hamlen, Sebastian Biedermann, and Stefan Katzenbeisser. From patches to honey-patches: Lightweight attacker misdirection, deception, and disinformation. In Proceedings of the 2014 ACM SIGSAC conference on computer and communications security, pages 942–953, 2014.
- [5] Frederico Araujo, Sailik Sengupta, Jiyong Jang, Adam Doupé, Kevin W Hamlen, and Subbarao Kambhampati. Software deception steering through version emulation. In HICSS, pages 1–10, 2021.
- [6] Xiao Han, Nizar Kheir, and Davide Balzarotti. Deception techniques in computer security: A research perspective. ACM Computing Surveys, 51(4):1–36, 2018.
- [7] Mohammed H. Almeshekah and Eugene H. Spafford. Planning and integrating deception into computer security defenses. In Proceedings of the New Security Paradigms Workshop, pages 127–138, 2014.
- [8] Frederico Araujo and Kevin W. Hamlen. Embedded honeypotting. In Cyber Deception: Building the Scientific Foundation, pages 195–225. Springer, 2016.
- [9] Sailik Sengupta, Ankur Chowdhary, Dijiang Huang, and Subbarao Kambhampati. General sum markov games for strategic detection of advanced persistent threats using moving target defense in cloud networks. In International Conference on Decision and Game Theory for Security, pages 492–512. Springer, 2019.
- [10] Erik Trickel, Francesco Disperati, Eric Gustafson, Faezeh Kalantari, Mike Mabey, Naveen Tiwari, Yeganeh Safaei, Adam Doupé, and Giovanni Vigna. Shell we play a game? CTF-as-a-service for security education. In 2017 USENIX Workshop on Advances in Security Education (ASE 17), Vancouver, BC, August 2017.
- [11] Giovanni Vigna, Kevin Borgolte, Jacopo Corbetta, Adam Doupe, Yanick Fratantonio, Luca Invernizzi, Dhilung Kirat, and Yan Shoshitaishvili. Ten years of ictf: The good, the bad, and the ugly. In 2014 USENIX Summit on Gaming, Games, and Gamification in Security Education, 3GSE 2014, 2014.
- [12] Frederico Araujo and Teryl Taylor. Improving cybersecurity hygiene through JIT patching. In Proceedings of the 28th ACM Joint Meeting on European Software Engineering Conference and Symposium on the Foundations of Software Engineering, pages 1421–1432, 2020.
- [13] Teryl Taylor, Frederico Araujo, and Xiaokui Shu. Towards an open format for scalable system telemetry. In 2020 IEEE International Conference on Big Data (Big Data), pages 1031–1040, 2020.
- [14] SysFlow. Cloud-native system telemetry pipeline. https://github.com/sysflow-telemetry, 2022.
- [15] Frederico Araujo and Teryl Taylor. A pluggable edge-processing pipeline for sysflow. In FloCon, 2021.
- [16] Karel Durkota, Viliam Lisỳ, Branislav Bošanskỳ, and Christopher Kiekintveld. Optimal network security hardening using attack graph games. In Twenty-Fourth International Joint Conference on Artificial Intelligence, 2015.
- [17] Joshua Letchford and Yevgeniy Vorobeychik. Optimal interdiction of attack plans. In AAMAS, pages 199–206. Citeseer, 2013.
- [18] Harjinder S. Lallie, Kurt Debattista, and Jay Bal. A review of attack graph and attack tree visual syntax in cyber security. Computer Science Review, 35, 2020.
- [19] Anjon Basak, Jakub Černỳ, Marcus Gutierrez, Shelby Curtis, Charles Kamhoua, Daniel Jones, Branislav Bošanskỳ, and Christopher Kiekintveld. An initial study of targeted personality models in the flipit game. In International conference on decision and game theory for security, pages 623–636. Springer, 2018.
- [20] Michael L Littman. Markov games as a framework for multi-agent reinforcement learning. In Machine learning proceedings 1994, pages 157–163. Elsevier, 1994.
- [21] Rui Zhuang, Scott Deloach, and Xinming Ou. Towards a theory of moving target defense. Proceedings of the ACM Conference on Computer and Communications Security, 2014:31–40, 11 2014.
- [22] Marthony Taguinod, Adam Doupé, Ziming Zhao, and Gail-Joon Ahn. Toward a moving target defense for web applications. In 2015 IEEE International Conference on Information Reuse and Integration, pages 510–517, 2015.
- [23] Michael Winterrose, K. Carter, Neal Wagner, and W. Streilein. Adaptive Attacker Strategy Development Against Moving Target Cyber Defenses, pages 1–14. 01 2020.
- [24] Erick Galinkin, John Carter, and Spiros Mancoridis. Evaluating attacker risk behavior in an internet of things ecosystem. In International Conference on Decision and Game Theory for Security, pages 354–364. Springer, 2021.
- [25] Anjon Basak, Jakub Černỳ, Marcus Gutierrez, Shelby Curtis, Charles Kamhoua, Daniel Jones, Branislav Bošanskỳ, and Christopher Kiekintveld. An initial study of targeted personality models in the flipit game. In International conference on decision and game theory for security, pages 623–636. Springer, 2018.
- [26] Adam Zychowski and Jacek Mandziuk. Learning attacker’s bounded rationality model in security games. CoRR, abs/2109.13036, 2021.
- [27] Cuong T Do, Nguyen H Tran, Choongseon Hong, Charles A Kamhoua, Kevin A Kwiat, Erik Blasch, Shaolei Ren, Niki Pissinou, and Sundaraja S. Iyengar. Game theory for cyber security and privacy. ACM Computing Surveys, 50(2):1–37, 2017.
- [28] Christian Stransky, Yasemin Acar, Duc Cuong Nguyen, Dominik Wermke, Doowon Kim, Elissa M Redmiles, Michael Backes, Simson Garfinkel, Michelle L Mazurek, and Sascha Fahl. Lessons learned from using an online platform to conduct Large-Scale, online controlled security experiments with software developers. In 10th USENIX Workshop on Cyber Security Experimentation and Test (CSET 17), 2017.
- [29] Stephen Schwab and Erik Kline. Cybersecurity experimentation at program scale: Guidelines and principles for future testbeds. In 2019 IEEE European Symposium on Security and Privacy Workshops (EuroS&PW), pages 94–102. IEEE, 2019.
- [30] Malek Ben Salem and Salvatore J Stolfo. On the design and execution of Cyber-Security user studies: Methodology, challenges, and lessons learned. In 4th Workshop on Cyber Security Experimentation and Test (CSET 11), 2011.
- [31] Khaled Salah, Mohammad Hammoud, and Sherali Zeadally. Teaching cybersecurity using the cloud. IEEE Transactions on Learning Technologies, 8(4):383–392, 2015.
- [32] Jelena Mirkovic and Terry Benzel. Teaching cybersecurity with deterlab. IEEE Security & Privacy, 10(1):73–76, 2012.
- [33] Sten Mäses, Kristjan Kikerpill, Kaspar Jüristo, and Olaf Maennel. Mixed methods research approach and experimental procedure for measuring human factors in cybersecurity using phishing simulations. In 18th European Conference on Research Methodology for Business and Management Studies, page 218, 2019.
- [34] Hamdi Kavak, Jose J Padilla, Daniele Vernon-Bido, R Gore, and S Diallo. A characterization of cybersecurity simulation scenarios. In SpringSim (CNS), 2016.
- [35] Asmaa Aljohani and James Jones. Conducting malicious cybersecurity experiments on crowdsourcing platforms. In The 2021 3rd International Conference on Big Data Engineering, pages 150–161, 2021.
- [36] Teodor Sommestad and Jonas Hallberg. Cyber security exercises and competitions as a platform for cyber security experiments. In Nordic conference on secure IT systems, pages 47–60. Springer, 2012.