Has JWST already falsified dark-matter-driven galaxy formation?
Abstract
The James Webb Space Telescope (JWST) discovered several luminous high-redshift galaxy candidates with stellar masses of at photometric redshifts which allows to constrain galaxy and structure formation models. For example, Adams et al. identified the candidate ID 1514 with located at and Naidu et al. found even more distant candidates labeled as GL-z11 and GL-z13 with at and at , respectively. Assessing the computations of the IllustrisTNG (TNG50-1 and TNG100-1) and EAGLE projects, we investigate if the stellar mass buildup as predicted by the CDM paradigm is consistent with these observations assuming that the early JWST calibration is correct and that the candidates are indeed located at . Galaxies formed in the CDM paradigm are by more than an order of magnitude less massive in stars than the observed galaxy candidates implying that the stellar mass buildup is more efficient in the early universe than predicted by the CDM models. This in turn would suggest that structure formation is more enhanced at than predicted by the CDM framework. We show that different star formation histories could reduce the stellar masses of the galaxy candidates alleviating the tension. Finally, we calculate the galaxy-wide initial mass function (gwIMF) of the galaxy candidates assuming the integrated galaxy IMF theory. The gwIMF becomes top-heavy for metal-poor starforming galaxies decreasing therewith the stellar masses compared to an invariant canonical IMF.
ApJL
1 Introduction
The formation of the first galaxies in the observed universe is a key question in modern astrophysics and one of the most important science goals of the recently launched James Webb Space Telescope (JWST). The Near Infrared Camera instrument (NIRCam; Rieke et al., 2005) of JWST observes the universe in the regime. This allows the detection of objects at redshifts , thus, revealing the evolutionary stage of galaxies in the early Universe just Myr after the Big Bang. The most distant confirmed galaxy is GN-z11 with a stellar mass of at a spectroscopic redshift of detected with the Hubble Space Telescope (Oesch et al., 2016). Recently, Naidu et al. (2022b) reported the discovery of two luminous galaxy candidates labeled as GLASS-z11 (hereafter GL-z11) and GLASS-z13 (GL-z13) with and located at photometric redshifts of and , respectively (see their table 3). In a subsequent publication, Naidu et al. (2022a) presented the galaxy candidate CEERS-1749 with most likely located at but a secondary redshift solution of cannot be excluded (see their figure 1 and table 3).
Further luminous high-redshift galaxy candidates have been discovered by JWST (e.g., Adams et al., 2022; Atek et al., 2022; Furtak et al., 2022; Harikane et al., 2022; Yan et al., 2022; Labbe et al., 2022). For example, Adams et al. (2022) studied the properties of candidates over a redshift range of and the source with ID 1514 has at (see their tables 3 and 5). Labbe et al. (2022) identified candidates with over from which the two most massive are ID 14924 with at and ID 38094 with at (see their figure 3). The spectroscopical confirmation of these objects is still outstanding because the high photometric redshifts of these galaxy candidates can, e.g., artificially emerge due to dust attenuation (Naidu et al., 2022b, a; Zavala et al., 2022).
In this contribution, we aim to investigate if ID 1514, ID 14924, GL-z11, GL-z13, and CEERS-1749 are consistent with the hierarchical buildup of stellar mass as predicted by the CDM paradigm (Efstathiou et al., 1990; Ostriker & Steinhardt, 1995) using the Illustris The Next Generation (TNG; Pillepich et al., 2018a; Nelson et al., 2019b; Pillepich et al., 2019) and Evolution and Assembly of GaLaxies and their Environments (EAGLE; Crain et al., 2015; Schaye et al., 2015; McAlpine et al., 2016) projects.
2 Method
The IllustrisTNG (Pillepich et al., 2018a, b, 2019; Nelson et al., 2018, 2019b, 2019a; Springel et al., 2018; Naiman et al., 2018; Marinacci et al., 2018) and EAGLE (Crain et al., 2015; Schaye et al., 2015; McAlpine et al., 2016) projects consist of a suite of hydrodynamical cosmological simulation runs conducted in the CDM framework.
The IllustrisTNG project assumes a Planck-2015 (Planck Collaboration XIII, 2016) cosmology with the cosmological parameters being , , , , , and . The simulation runs are based on the moving-mesh code AREPO (Springel, 2010) and self-consistently evolve the gas cells, stellar, black hole, and dark matter particles from redshift up to present time. The Subfind Subhalos111https://www.tng-project.org/data/docs/specifications/#sec2b [23.07.2022] and Group222https://www.tng-project.org/data/docs/specifications/#sec2a [12.09.2022] catalogs are available for 100 different time steps (snapshots) in the redshift range of . Here, we analyze the snapshot at redshift (corresponding to an age of the universe of Gyr and a snapshot number of snapnum = 1), at ( Gyr, snapnum = 2), at ( Gyr, snapnum = 3), and at ( Gyr, snapnum = 4) of the high-resolution realization TNG50-1 and TNG100-1. The former has a box side of comoving Mpc (cMpc), respectively, where is the present Hubble constant in units of , a baryonic element mass of and a dark matter particle mass of . TNG100-1 has, with cMpc, a larger box size and with and a lower resolution than TNG50-1 (see, e.g., also table 1 of Nelson et al., 2019b).
The EAGLE project is consistent with the Planck-2013 (Planck Collaboration I, 2014) cosmology being , , , , , and (see also table 1 of Schaye et al., 2015). Its simulations run with a modification of the GADGET-3 smoothed particle hydrodynamics code (e.g., Springel, 2005) starting also at and self-consistently evolving the baryonic and dark matter particles up to the present day. The publicly available subhalo catalogs (table B.1 of McAlpine et al., 2016) are recorded for 29 snapshots in the redshift range of (see table C.1 of McAlpine et al., 2016).
We use the two high-resolution realization runs RefL0025N0752 and RecalL0025N0752, and the two lower resolution runs RefL0050N0752 and RefL0100N1504 at (snapnum = 1) and (snapnum = 2). The two high-resolution runs have a box size of with an initial baryonic particle mass of , and a dark matter particle mass of . RefL0050N0752 and RefL0100N1504 have a size of cMpc and cMpc, respectively, and both have an initial baryonic particle mass of and a dark matter particle mass of (table 2 of Schaye et al., 2015).
3 Results
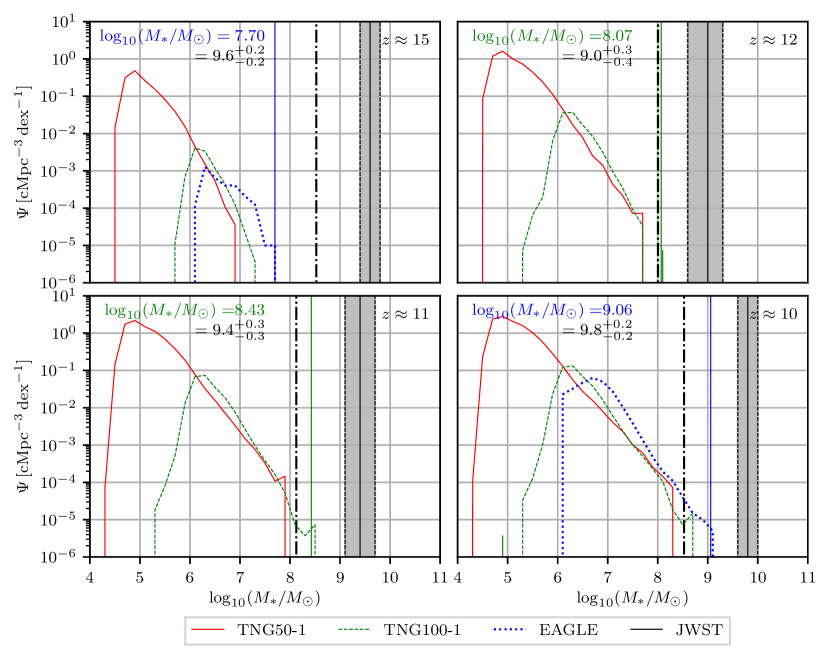
The galaxy stellar mass function (GSMF) at redshifts , , and in the TNG runs and at and in the EAGLE runs are presented in Figure 1. The global peak of the distribution depends on the resolution and/or box size of the simulation runs such that the formation of low massive galaxies depends on the particle resolution but also because small simulation boxes lack large-scale density fluctuations. As a consequence, not-large-enough simulation boxes would not allow the formation of large galaxy clusters, therefore hampering the growth of central (but also noncentral) galaxies. Thus, we mainly focus on the larger simulation boxes TNG100-1 and RefL0100N1504.
In the following, we compare the stellar mass buildup as predicted by the CDM simulations with the masses of the observed high-redshift galaxy candidates ID 1514 (Adams et al., 2022), ID 14924 (Labbe et al., 2022)333We only show ID 1514 and not the more massive candidate ID 14924 in the bottom right panel of Figure 1 in order to be more conservative., GL-z11, GL-z13 (Naidu et al., 2022b), and CEERS-1749 (Naidu et al., 2022a). For the TNG runs, ID 1514 located at and ID 14924 at are compared with simulated galaxies at . GL-z11 at , GL-z13 at , and CEERS-1749 at are compared with the simulations at , , and , respectively. The comparison with GL-z13 and CEERS-1749 is therewith more conservative because snapshots corresponding to lower redshifts than observed are addressed allowing the galaxies to grow in stars for a longer time span than in the observed cases.
In TNG100-1, the GSMF at reaches a maximum value of being therewith times lower than the stellar mass of CEERS-1749 with . At and , the maximum stellar masses of subhalos are and , respectively, which is less massive than GL-z13 with and GL-z11 with . The maximum value of at is significantly lower than the stellar mass of ID 1514, which has . The discrepancy becomes even more significant for ID 14924, which has at .
The above stellar masses refer to all stellar particles bound to the considered subhalo depending therewith on the subhalo-finding algorithm. The identification of subhalos can be disturbed, e.g. by merger events, which frequently occur especially at high redshifts. Therefore, we also assess the maximum stellar masses of halos, which accounts for both the fact that the subhalo finder can split a galaxy in clumps underestimating the total mass of the galaxy, and for the inclusion of observationally unresolved satellite galaxies. The maximum stellar masses of halos are (), (), (), and () at , , , and , in the TNG100-1 (TNG50-1) run, respectively. Thus, using the most massive halo instead of the most massive subhalo in terms of its stellar mass does not significantly effect the results of the TNG runs.
In the EAGLE runs, ID 1514/ID 14924 and CEERS-1749 are compared with the GSMF at and , respectively. Unfortunately, the EAGLE database does not list snapshots that match the observed redshifts of GL-z11 and GLz-13. Thus, the EAGLE analysis only focuses on ID 1514, ID 14924, and CEERS-1749.
The RefL0050N0752 and RefL0100N1504 snapshots contain galaxies reaching up to at and at , which is and times lower than the observed stellar mass of CEERS-1749 and ID 1514, respectively. The stellar mass of ID 14924 is 74 times higher than the most massive simulated galaxy at .
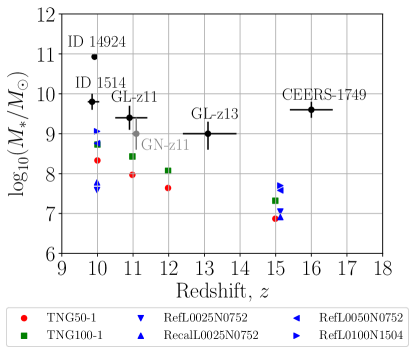
The evolution of the stellar mass growth is summarized in Figure 2 and Table 1 by showing the maximum stellar mass of a subhalo in dependence of redshift for different simulation runs. The observed high-redshift galaxy candidates are, by more than one order of magnitude, more massive than the most massive simulated galaxies in the CDM framework.
The inferred stellar mass of observed galaxies is sensitive to the adopted star formation history (SFH) and initial mass function (IMF). In the following sections, we first investigate if the tension reported here of the stellar mass buildup in the early universe can be resolved if different SFHs of the observed galaxy candidates are assumed. Secondly, the effect of a varying IMF on the observed stellar masses is discussed.
| Redshift () | ||
|---|---|---|
| CEERS-1749 | ()aaLowest possible stellar mass value for an invariant canonical IMF as quantified in Section 3.1 | |
| GL-z13 | ()aaLowest possible stellar mass value for an invariant canonical IMF as quantified in Section 3.1 | |
| GL-z11 | ()aaLowest possible stellar mass value for an invariant canonical IMF as quantified in Section 3.1 | |
| ID 1514 | ()aaLowest possible stellar mass value for an invariant canonical IMF as quantified in Section 3.1 | |
| TNG50-1 | 14.99 | 6.87 |
| TNG50-1 | 11.98 | 7.64 |
| TNG50-1 | 10.98 | 7.97 |
| TNG50-1 | 10.00 | 8.33 |
| TNG100-1 | 14.99 | 7.32 |
| TNG100-1 | 11.98 | 8.07 |
| TNG100-1 | 10.98 | 8.43 |
| TNG100-1 | 10.00 | 8.73 |
| RefL0025N0752 | 15.13 | 7.05 |
| RefL0025N0752 | 9.99 | 7.59 |
| RecalL0025N0752 | 15.13 | 6.91 |
| RecalL0025N0752 | 9.99 | 7.78 |
| RefL0050N0752 | 15.13 | 7.58 |
| RefL0050N0752 | 9.99 | 8.76 |
| RefL0100N1504 | 15.13 | 7.70 |
| RefL0100N1504 | 9.99 | 9.06 |
Note. — The first four rows show the photometric redshifts and stellar masses of the observed galaxy redcandidates ID 1514 (see table 3 and 5 of Adams et al., 2022), GL-z11, GL-z13 (see table 3 of Naidu et al., 2022b), and CEERS-1749 (see table 3 of Naidu et al., 2022a). The other rows list the maximum stellar mass of a subhalo at a given redshift for the TNG and EAGLE runs.
3.1 The minimum inferred galaxy masses for different star formation histories
In order to calculate the minimum possible mass that the observed high-redshift galaxy candidates CEERS-1749, GL-z11, GL-z13, and ID 1514 can have for an invariant IMF, different sets of models of galaxies with different SFHs are constructed. Using stellar population synthesis models, we let the age of the modeled galaxies vary in the range of to investigate their UV-band () stellar mass (including remnants)-to-light ratio, , for an invariant canonical IMF (Kroupa, 2001; Kroupa et al., 2013). The lower limit is set by the implemented stellar evolution tracks of the Padova group (Marigo & Girardi, 2007; Marigo et al., 2008, see also Zonoozi et al. 2019) and is roughly comparable to the mean stellar age ( Myr) of observed high-redshift galaxies () as found by Carnall et al. (2022).
Since the spectral energy distribution fitting analysis of high-redshift star-forming galaxies shows more consistency with increasing SFHs, here we adopt the delayed- model (e.g., Kroupa et al., 2020a)
| (1) |
and an exponentially increasing SFH
| (2) |
where is the star formation rate (SFR), is the age since star formation started, is the normalization parameter, and is the e-folding time scale. The mass and light of a galaxy are calculated by an integral over the SFR. Note that, using the invariant IMF, at a given , the mass-to-light ratio is independent of the total mass that is converted into stars. This is because of cancellation of the normalization parameter, .
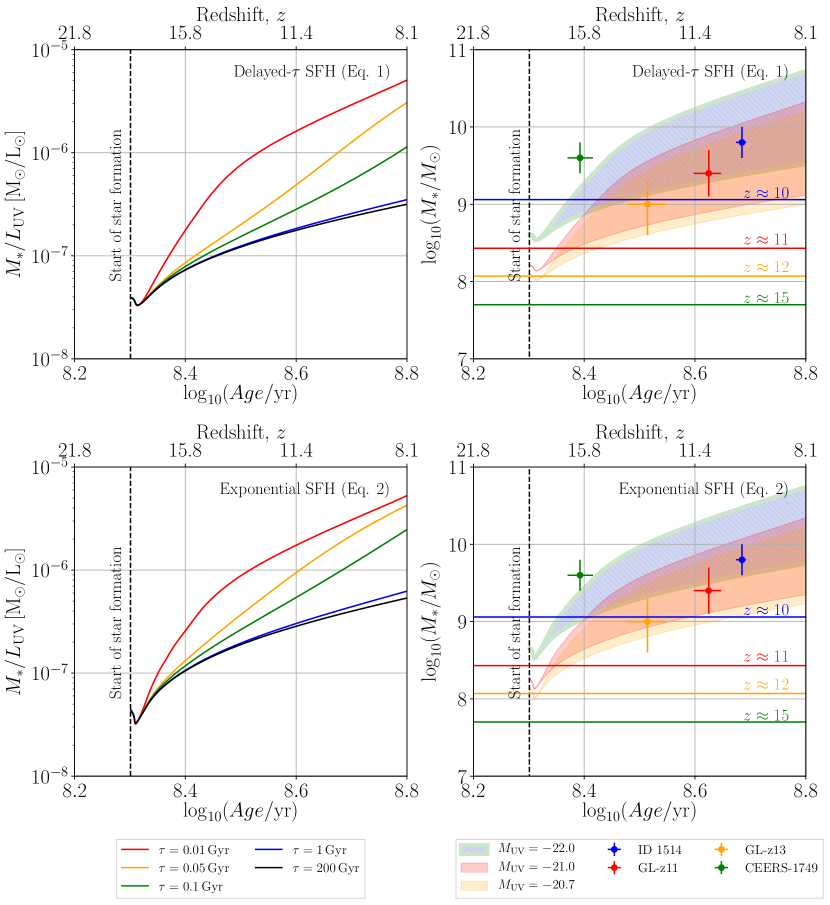
The effect of the SFHs on the ratio of galaxies by adopting different values of is shown in the left panels of Figure 3. We set that galaxies start forming stars 200 Myr after the Big Bang, with an averaged metallicity of [Fe/H] = , and we assume that the mass loss from galaxies is only through stellar evolution in the form of ejected gas. Since the stellar loss due to dynamical evolution is significant only for systems with initial stellar mass less than , no stars are lost by the dynamical evolution of galaxies. As can be seen, the minimum mass-to-light ratio that can be considered for these galaxies assuming different SFHs is .
According to the estimated UV absolute magnitude of these objects, , , , and , we obtain the lowest possible stellar masses of , and for CEERS-1749, GL-z13, GL-z11, and ID 1514 in the case of an exponential SFH, respectively, as visualized in the right panels of Figure 3.
These lower stellar mass limits just resolve the discrepancy for GL-z11, GL-z13, and ID 1514 (see the vertical dashed-dotted lines in Figure 1). In the case of CEERS-1749, the maximum stellar mass obtained in the CDM simulation is lower than its inferred lower limit.
3.2 Galaxy masses for a varying IMF
In the previous section we applied an invariant IMF but recent observations (e.g., Schneider et al., 2018; Zhang et al., 2018; Senchyna et al., 2021) suggest that the mass distribution of a stellar population may depend on its local star forming environment. Especially metal-poor Population III stars are expected to follow a top-heavy IMF.
A theoretical framework to describe the stellar population of an entire galaxy is the integrated galactic initial mass function (IGIMF) theory, which adds up all the IMFs of starforming regions (embedded clusters) within a galaxy (Kroupa & Weidner, 2003; Weidner & Kroupa, 2006). The resulting galaxy-wide IMF (gwIMF) systematically varies with the global SFR and averaged metallicity of the galaxy, i.e. the gwIMF becomes top-heavy for galaxies with and metallicities [Fe/H] (see figure 2 of Jeřábková et al., 2018) compared to the canonical IMF.
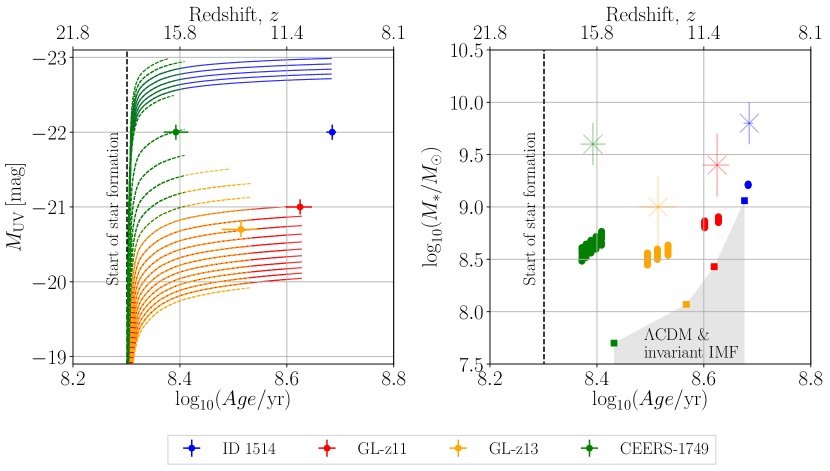
In order to study the effect of a varying IMF on the high-redshift galaxy candidates, we calculate the stellar population of galaxies assuming the latest IGIMF formalism by Yan et al. (2021) and using an IGIMF Fortran code developed by Akram Hasani Zonoozi. For simplification, we assume that all galaxies start to form stars Myr after the Big Bang, with a constant SFR over time, and an average metallicity of [Fe/H] = . Since the gwIMF is time dependent, we require that realistic IGIMF models have to match the observed within mag in the interval of the observed redshift of the corresponding galaxy candidate. The left panel of Figure 4 shows the time evolution of the absolute UV-band magnitude for IGIMF models that fulfill these constraints for observed galaxy candidates CEERS-1749, GL-z13, GL-z11, and ID 1514. These models have constant SFRs in the range of and thus a top-heavy IMF. The stellar masses at the observed redshifts of the galaxy candidates are shown in the right panel of Figure 4 and are systematically lower than the derived stellar masses of Adams et al. (2022), Naidu et al. (2022b), and Naidu et al. (2022a) because of the top-heavy gwIMF compared to the canonical IMF.
4 Discussion and Conclusion
While the redshifts of the galaxy candidates need to be spectroscopically verified, we use these JWST observations to quantify how quickly galaxies form in the currently most advanced cosmological simulations. Using state-of-the-art CDM simulations of the IllustrisTNG and EAGLE project, we showed that the stellar mass buildup is much more efficient in the early universe than predicted by these CDM models (see also, e.g., Boylan-Kolchin, 2022; Lovell et al., 2022). In particular, the stellar masses of ID 1514 (Adams et al., 2022), ID 14924 (Labbe et al., 2022), GL-z11, GL-z13 (Naidu et al., 2022b), and CEERS-1749 (Naidu et al., 2022a) analyzed in Section 3 are higher by about one order of magnitude than the most massive galaxies formed in these simulations. In particular, massive high-redshift candidates appear more frequent at than expected in the CDM framework. For example, Boylan-Kolchin (2022) argued that a volume of is required to explain ID 14924 with at (Labbe et al., 2022). However, the survey covers at (see section 3 of Boylan-Kolchin, 2022). The TNG100-1 and RefL0100N1504 simulations have a box volume of suggesting that the absence of massive galaxies in these runs is not because of a too small simulation volume.
The discrepancy between the observed and simulated stellar mass buildup could be caused by several reasons. First of all, high photometric redshifts can emerge due to dust reddening. For example, Zavala et al. (2022) demonstrated that Lyman-break galaxy candidates at can resemble dusty star-forming galaxies at . Secondly, it could be that the high observed stellar masses are caused by an erroneous calibration of JWST.
Furthermore, it has been argued that star formation could be much more efficient in the early universe (e.g., Naidu et al., 2022b; Harikane et al., 2022; Mason et al., 2022). Assuming that the CDM model is the correct description of the Universe, this would mean that the underlying galaxy formation and evolution ISM models of the EAGLE and IllustrisTNG runs must be improved in order to reproduce such galaxies. For example, these simulations assume that gas above a given density threshold (e.g., Schaye et al., 2015; Nelson et al., 2019b) is able to form stars, which is likely a too simplified implementation especially for describing high-redshift galaxies. Boylan-Kolchin (2022) showed that even a star formation efficiency in CDM would not be enough to explain the stellar mass density measured by Labbe et al. (2022).
Another possibility is that the IMF systematically varies with the galactic properties. The IllustrisTNG and EAGLE simulations and the analysis of the Sections 3 and 3.1 assume an invariant IMF, but it is expected that metal-poor starforming stellar populations follow a top-heavy IMF. Using the IGIMF theory we calculated the gwIMF of the observed galaxy candidates in dependence of the metallicity and SFR of forming galaxies resulting in lower stellar masses compared to an invariant canonical IMF. For this, the IGIMF theory has to be included in cosmological simulations (see, e.g., Ploeckinger et al., 2014) in order to make a firm conclusion if a top-heavy IMF can resolve the reported tension.
Finally, the present findings can also imply that structure formation is much more efficient and/or that the observed universe is even older than predicted by CDM. The existence of these massive galaxies Myr after the Big Bang also questions the hierarchical (bottom-up) structure formation suggesting that late-type galaxies begin to form early through the initial monolithic collapse of rotating post-Big-Bang gas clouds (Wittenburg et al., 2020) while early-type massive galaxies and associated formation of supermassive black halos form by the monolithic collapse of post-Big-Bang gas clouds with little net rotation (e.g., Kroupa et al., 2020b; Wittenburg et al., 2020; Yan et al., 2021; Eappen et al., 2022).
Evidence for an enhanced growth of structures has been reported at different astrophysical scales and redshift ranges in the observed Universe. For example, Steinhardt et al. (2016) showed that the observed number density of luminous galaxies at is much higher than predicted by the CDM model (see their figure 1). However, their analysis relies on the stellar-to-halo mass relation from Leauthaud et al. (2012) measured only at , while, e.g., Behroozi et al. (2019) suggest that there is a strong evolution at . Furthermore, the existence of the massive interacting galaxy cluster El Gordo (ACT-CL J0102-4915; Marriage et al., 2011) at and the Keenan-Barger-Cowie void (Keenan et al., 2013) at both individually falsify the hierarchical CDM structure formation with more than (Haslbauer et al., 2020; Asencio et al., 2021).
An enhanced growth of structure compared to the CDM paradigm is expected in Milgromian dynamics (Milgrom, 1983; Angus, 2009; Malekjani et al., 2009; Famaey & McGaugh, 2012; Kroupa et al., 2012; Haslbauer et al., 2020; Banik & Zhao, 2022). Assuming the cosmic microwave background as the boundary condition and because of the reduced power on scales compared to CDM (Angus & Diaferio, 2011) due to the missing cold dark matter (CDM) component, it may be impossible to form galaxies in the early universe.
This work indicates that the currently available most advanced CDM simulations cannot form galaxies as massive as observed at . This tension needs to be readdressed for extreme SFHs and/or if the gwIMF was top-heavy which would reduce the stellar mass buildup through more intense feedback.
Upcoming ultradeep and wider-area JWST observations will reveal more light on the number density of such luminous high-redshift galaxies over redshift required to evaluate the significance of the here-reported tension of the stellar mass buildup of high-redshift galaxies in more detail.
References
- Adams et al. (2022) Adams, N. J., Conselice, C. J., Ferreira, L., et al. 2022, ArXiv e-prints, ArXiv [\eprint[arXiv]2207.11217v2]
- Angus (2009) Angus, G. W. 2009, MNRAS, 394, 527
- Angus & Diaferio (2011) Angus, G. W. & Diaferio, A. 2011, MNRAS, 417, 941
- Asencio et al. (2021) Asencio, E., Banik, I., & Kroupa, P. 2021, MNRAS, 500, 5249
- Atek et al. (2022) Atek, H., Shuntov, M., Furtak, L. J., et al. 2022, ArXiv e-prints, ArXiv [\eprint[arXiv]2207.12338v1]
- Banik & Zhao (2022) Banik, I. & Zhao, H. 2022, Symmetry, 14, 1331
- Behroozi et al. (2019) Behroozi, P., Wechsler, R. H., Hearin, A. P., & Conroy, C. 2019, MNRAS, 488, 3143
- Boylan-Kolchin (2022) Boylan-Kolchin, M. 2022, arXiv e-prints, ArXiv [\eprint[arXiv]2208.01611v1]
- Carnall et al. (2022) Carnall, A. C., Begley, R., McLeod, D. J., et al. 2022, ArXiv e-prints, ArXiv [\eprint[arXiv]2207.08778v1]
- Crain et al. (2015) Crain, R. A., Schaye, J., Bower, R. G., et al. 2015, MNRAS, 450, 1937
- Eappen et al. (2022) Eappen, R., Kroupa, P., Wittenburg, N., Haslbauer, M., & Famaey, B. 2022, MNRAS, 516, 1081
- Efstathiou et al. (1990) Efstathiou, G., Sutherland, W. J., & Maddox, S. J. 1990, Nature, 348, 705
- Famaey & McGaugh (2012) Famaey, B. & McGaugh, S. S. 2012, Living Reviews in Relativity, 15, 10
- Furtak et al. (2022) Furtak, L. J., Shuntov, M., Atek, H., et al. 2022, ArXiv e-prints, ArXiv [\eprint[arXiv]2208.05473v1]
- Harikane et al. (2022) Harikane, Y., Ouchi, M., Oguri, M., et al. 2022, ArXiv e-prints, ArXiv [\eprint[arXiv]2208.01612v1]
- Haslbauer et al. (2020) Haslbauer, M., Banik, I., & Kroupa, P. 2020, MNRAS, 499, 2845
- Jeřábková et al. (2018) Jeřábková, T., Hasani Zonoozi, A., Kroupa, P., et al. 2018, A&A, 620, A39
- Keenan et al. (2013) Keenan, R. C., Barger, A. J., & Cowie, L. L. 2013, ApJ, 775, 62
- Kroupa (2001) Kroupa, P. 2001, MNRAS, 322, 231
- Kroupa et al. (2020a) Kroupa, P., Haslbauer, M., Banik, I., Nagesh, S. T., & Pflamm-Altenburg, J. 2020a, MNRAS, 497, 37
- Kroupa et al. (2012) Kroupa, P., Pawlowski, M., & Milgrom, M. 2012, International Journal of Modern Physics D, 21, 1230003
- Kroupa et al. (2020b) Kroupa, P., Subr, L., Jerabkova, T., & Wang, L. 2020b, MNRAS, 498, 5652
- Kroupa & Weidner (2003) Kroupa, P. & Weidner, C. 2003, ApJ, 598, 1076
- Kroupa et al. (2013) Kroupa, P., Weidner, C., Pflamm-Altenburg, J., et al. 2013, The Stellar and Sub-Stellar Initial Mass Function of Simple and Composite Populations, ed. T. D. Oswalt & G. Gilmore (Dordrecht: Springer Netherlands), 115–242
- Labbe et al. (2022) Labbe, I., van Dokkum, P., Nelson, E., et al. 2022, ArXiv e-prints, ArXiv [\eprint[arXiv]2207.12446v2]
- Leauthaud et al. (2012) Leauthaud, A., Tinker, J., Bundy, K., et al. 2012, ApJ, 744, 159
- Lovell et al. (2022) Lovell, C. C., Harrison, I., Harikane, Y., Tacchella, S., & Wilkins, S. M. 2022, ArXiv e-prints, ArXiv [\eprint[arXiv]2208.10479v1]
- Malekjani et al. (2009) Malekjani, M., Rahvar, S., & Haghi, H. 2009, ApJ, 694, 1220
- Marigo & Girardi (2007) Marigo, P. & Girardi, L. 2007, A&A, 469, 239
- Marigo et al. (2008) Marigo, P., Girardi, L., Bressan, A., et al. 2008, A&A, 482, 883
- Marinacci et al. (2018) Marinacci, F., Vogelsberger, M., Pakmor, R., et al. 2018, MNRAS, 480, 5113
- Marriage et al. (2011) Marriage, T. A., Acquaviva, V., Ade, P. A. R., et al. 2011, ApJ, 737, 61
- Mason et al. (2022) Mason, C. A., Trenti, M., & Treu, T. 2022, ArXiv e-prints, ArXiv [\eprint[arXiv]2207.14808v2]
- McAlpine et al. (2016) McAlpine, S., Helly, J. C., Schaller, M., et al. 2016, Astronomy and Computing, 15, 72
- Milgrom (1983) Milgrom, M. 1983, ApJ, 270, 365
- Naidu et al. (2022a) Naidu, R. P., Oesch, P. A., Setton, D. J., et al. 2022a, ArXiv e-prints, ArXiv [\eprint[arXiv]2208.02794v1]
- Naidu et al. (2022b) Naidu, R. P., Oesch, P. A., van Dokkum, P., et al. 2022b, arXiv e-prints, ArXiv [\eprint[arXiv]2207.09434v1]
- Naiman et al. (2018) Naiman, J. P., Pillepich, A., Springel, V., et al. 2018, MNRAS, 477, 1206
- Nelson et al. (2019a) Nelson, D., Pillepich, A., Springel, V., et al. 2019a, MNRAS, 490, 3234
- Nelson et al. (2018) Nelson, D., Pillepich, A., Springel, V., et al. 2018, MNRAS, 475, 624
- Nelson et al. (2019b) Nelson, D., Springel, V., Pillepich, A., et al. 2019b, Computational Astrophysics and Cosmology, 6, 2
- Oesch et al. (2016) Oesch, P. A., Brammer, G., van Dokkum, P. G., et al. 2016, ApJ, 819, 129
- Ostriker & Steinhardt (1995) Ostriker, J. P. & Steinhardt, P. J. 1995, Nature, 377, 600
- Pillepich et al. (2018a) Pillepich, A., Nelson, D., Hernquist, L., et al. 2018a, MNRAS, 475, 648
- Pillepich et al. (2019) Pillepich, A., Nelson, D., Springel, V., et al. 2019, MNRAS, 490, 3196
- Pillepich et al. (2018b) Pillepich, A., Springel, V., Nelson, D., et al. 2018b, MNRAS, 473, 4077
- Planck Collaboration I (2014) Planck Collaboration I. 2014, A&A, 571, A1
- Planck Collaboration XIII (2016) Planck Collaboration XIII. 2016, A&A, 594, A13
- Ploeckinger et al. (2014) Ploeckinger, S., Hensler, G., Recchi, S., Mitchell, N., & Kroupa, P. 2014, MNRAS, 437, 3980
- Rieke et al. (2005) Rieke, M. J., Kelly, D., & Horner, S. 2005, in Society of Photo-Optical Instrumentation Engineers (SPIE) Conference Series, Vol. 5904, Cryogenic Optical Systems and Instruments XI, ed. J. B. Heaney & L. G. Burriesci, 1–8
- Schaye et al. (2015) Schaye, J., Crain, R. A., Bower, R. G., et al. 2015, MNRAS, 446, 521
- Schneider et al. (2018) Schneider, F. R. N., Sana, H., Evans, C. J., et al. 2018, Science, 359, 69
- Senchyna et al. (2021) Senchyna, P., Stark, D. P., Charlot, S., et al. 2021, MNRAS, 503, 6112
- Springel (2005) Springel, V. 2005, MNRAS, 364, 1105
- Springel (2010) Springel, V. 2010, MNRAS, 401, 791
- Springel et al. (2018) Springel, V., Pakmor, R., Pillepich, A., et al. 2018, MNRAS, 475, 676
- Steinhardt et al. (2016) Steinhardt, C. L., Capak, P., Masters, D., & Speagle, J. S. 2016, ApJ, 824, 21
- Weidner & Kroupa (2006) Weidner, C. & Kroupa, P. 2006, MNRAS, 365, 1333
- Wittenburg et al. (2020) Wittenburg, N., Kroupa, P., & Famaey, B. 2020, ApJ, 890, 173
- Yan et al. (2022) Yan, H., Ma, Z., Ling, C., et al. 2022, arXiv e-prints, ArXiv [\eprint[arXiv]2207.11558v1]
- Yan et al. (2021) Yan, Z., Jeřábková, T., & Kroupa, P. 2021, A&A, 655, A19
- Zavala et al. (2022) Zavala, J. A., Buat, V., Casey, C. M., et al. 2022, ArXiv e-prints, ArXiv [\eprint[arXiv]2208.01816v1]
- Zhang et al. (2018) Zhang, Z.-Y., Romano, D., Ivison, R. J., Papadopoulos, P. P., & Matteucci, F. 2018, Nature, 558, 260
- Zonoozi et al. (2019) Zonoozi, A. H., Mahani, H., & Kroupa, P. 2019, MNRAS, 483, 46