Unconventional magneto-resistance, and electronic transition in Mn3Ge Weyl semimetal
Abstract
Weyl semimetals are well known for their anomalous transport effects caused by a large fictitious magnetic field generated by the non-zero Berry curvature. We performed the analysis of the electrical transport measurements of the magnetic Weyl semimetal Mn3Ge in the a-b and a-c plane. We have observed negative longitudinal magneto-resistance (LMR) at a low magnetic field ( T) along all the axes. The high field LMR shows different behavior along x and z axes. A similar trend has been observed in the case of planar Hall effect (PHE) measurements as well. The nature of high field LMR along the x axis changes near 200 K. Dominant carrier concentration type, and metallic to semimetallic transition also occur near 200 K. These observations suggest two main conclusions: (i) The high field LMR in Mn3Ge is driven by the metallic - semimetallic nature of the compound. (ii) Mn3Ge compound goes through an electronic band topological transition near 200 K. Single crystal neutron diffraction does not show any change in the magnetic structure below 300 K. However, the in-plane lattice parameter (a) shows a maximum near 230 K. Therefore, it is possible that the change in electronic band structure near 200 K is driven by the a lattice parameter of the compound.
I Introduction:
Topological materials have been extensively studied recently due to their observed anomalous transport effects (ATE). Signatures of Weyl fermions can be observed in topological materials, which exhibit broken inversion or time-reversal symmetry Nayak et al. (2016); Nakatsuji et al. (2015); Armitage et al. (2018); Liu et al. (2018); Xiong et al. (2015). Magnetic Weyl semimetals show large anomalous conductivity due to a strong Berry curvature Shekhar et al. (2018); Liu et al. (2018); Nayak et al. (2016); Nakatsuji et al. (2015). Magnetic properties of Mn3X (X = Sn, Ge, Ga) type of compounds were studied a long time ago Tomiyoshi and Yamaguchi (1982); Tomiyoshi et al. (1983); Nagamiya et al. (1982); Krén and Kádár (1970). However, ATE in such compounds (X = Ge, Sn) were observed only recently Nayak et al. (2016); Nakatsuji et al. (2015); Liu et al. (2017); Chen et al. (2014); Zhang et al. (2016a); Krén and Kádár (1970). The hexagonal phase of these compounds has a non-collinear antiferromagnetic (AFM) structure in the a-b plane, along with a small ferromagnetic (FM) moment which arises due to the spin canting away from the ideal triangular magnetic structure Nayak et al. (2016); Tomiyoshi et al. (1983); Kiyohara et al. (2016). The non-collinear AFM structure causes a non-vanishing Berry curvature, which gives rise to the ATE Kiyohara et al. (2016); Kübler and Felser (2014); Jeon et al. (2021). The presence of a small in-plane FM moment in Mn3X helps in controlling the chirality of the magnetic structure within 200 Oersted (Oe) of the external magnetic field. The observed large change in Hall resistivity in near-zero fields suggests that a large fictitious field is present in the system Kiyohara et al. (2016); Jeon et al. (2021), which can be switched by 200 Oe of the external magnetic field. Therefore, compounds with large anomalous Hall effect (AHE) can be useful for developing spintronics devices.
Among the family of Mn3X, the magnitude of anomalous hall conductivity in Mn3Ge was predicted and observed to be the highest Kübler and Felser (2014); Nayak et al. (2016); Kiyohara et al. (2016). Other than this, Mn3Ge stands out because large anomalous transport effects were observed below 365 K, down to 2 K Shekhar et al. (2018); Liu et al. (2018); Nayak et al. (2016); Nakatsuji et al. (2015). The observed anomalous Nernst effect Hong et al. (2020); Wuttke et al. (2019), AHE Nayak et al. (2016); Kiyohara et al. (2016), and magneto-optical Kerr effect Wu et al. (2020) are signatures of the presence of the Weyl points in Mn3Ge. The field dependent planar Hall effect has been reported recently Xu et al. (2020a). However, chiral anomaly arises in Weyl semimetals due to the increase in conductivity primarily driven by the angle between the electric field (E) and the magnetic field (B). The correction term is proportional to EB. Therefore, angle-dependent electrical transport measurements can explicitly verify the presence of Weyl points in the system.
Our primary aim in this paper is to interpret the origin of magneto-electrical transport effects. We performed magneto-resistance (MR) measurements with magnetic field and electric current (I) applied along the x, y, and z directions. Here, x, y axes are along the [], [] crystallographic directions, respectively, and both lie in the the a-b plane of the hexagonal lattice. z axis is along the [0001] direction, the c axis of the hexagonal lattice. Unlike Mn3Sn Kuroda et al. (2017), the LMR in Mn3Ge is negative and positive at below and above 1.5 T. Therefore, the presence of chiral anomaly effect in Mn3Ge cannot be justified. However, the sudden change in LMR near 1.5 T suggests a strong competition between two competing phenomena. We also report the observation of anisotropic MR and planar Hall effect (PHE) when the magnetic field and electric current are rotated in the a-b or a-c plane. When a high magnetic field is applied along the x axis, the slope of LMR (along the x axis) remains positive and negative below and above 200 K, respectively. Such a change in the behavior of high field LMR can be linked with the metal to semimetal transition, and change in carrier concentration of the compound, near 200 K. These effects, including temperature dependent resistivity, indicate that the Mn3Ge go through an electronic (topological) transition around 200 K, similar to the thin film-Mn3Ge at 50 K Wang et al. (2021), possibly driven by the change in a lattice parameter of the compound.
II Experimental methods
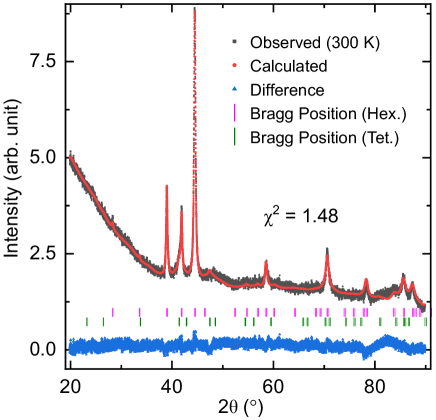
The experiments were performed on single crystals of ()-Mn3Ge (hexagonal phase), which is stable above 900 K, and metastable below. The hexagonal phase of Mn3Ge forms only with excess in Mn. According to Refs. Berche et al. (2014); Gokhale and Abbaschian (1990); Yamada et al. (1988), Hexagonal phase is stable only when Mn:Ge = :, where . To prepare the Mn3Ge single crystals, high purity () Mn and Ge were taken in a stoichiometric ratio of : (), and then melted using induction melting technique to ensure the homogeneous mixing of the elements. After that, the alloy was sealed in a quartz tube and heated to 1273 K for 10 hours, followed by cooling at a rate of 2 K/ hr down to 1073 K. Finally, the sample was quenched at 1073 K to retain the high-temperature hexagonal phase. The chemical analysis of the single crystals was done by using the ICP-OES method. The chemical compositions of the three single crystals were found to be Mn3.08(5)Ge, Mn3.18(5)Ge, and Mn3.55(5)Ge, which will be referred ahead as S1, S2, and S3, respectively. For convenience, Mn3+δGe is termed in this paper as Mn3Ge unless specified otherwise. The X-ray powder diffraction of the sample was performed by crushing a few single crystals from the same batch. Data analysis was performed using the FullProf software (Fig. 1). The data analysis using the tetragonal and hexagonal phases of Mn3Ge showed that crystals were synthesized mostly (96(2)%) in the hexagonal phase with P/mmc space group symmetry. The lattice parameters at room temperature were found to be a = b = 5.3325(5) Å, c = 4.3122(4) Å. Temperature-dependent X-ray diffraction was also performed using a Huber Imaging Plate Guinier Camera G670 (Fig. 13).
Single crystal neutron diffraction measurements were performed on the (S3) sample, using the HEiDi instrument at the FRM II neutron source, Garching (Germany) (see section IV). The data analysis (using JANA2006 Petr̆íc̆ek et al. (2014)) has shown that the chemical composition of the sample is Mn[3+0.09(1)]Ge[1-0.09(1)], which, after normalization, corresponds to Mn:Ge = 3.40(5):1, slightly lower than the chemical composition of the same sample determined by the ICP-OES method. Neutron diffraction analysis also confirms that the excess 10% Ge sites are occupied by the Mn atoms. Further details of the data analysis will be discussed in section IV.
Electrical transport and magnetization measurements were performed on the three samples (S1, S2, S3) using the Quantum Design Physical Property Measurement System (PPMS). However, most of the transport measurements were performed using S1 and S2 samples because of having similar chemical compositions as reported in the literature Wuttke et al. (2019); Nayak et al. (2016); Kiyohara et al. (2016); Chen et al. (2020); Xu et al. (2020b). In some cases, sample S3 was also measured to determine the evolution of physical properties with the Mn concentration. Our analysis remained consistent with all three samples.
III Electrical Transport Results
III.1 Longitudinal magneto-resistance
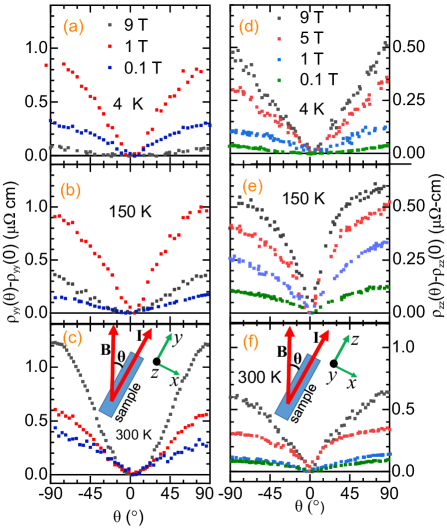
We measured the longitudinal magneto-resistance (LMR) of Mn3Ge for different combinations of the applied current and magnetic field directions. The measurements were repeated using different samples pieces with thin rectangular shapes (typical dimension - length: 1.5 - 2.1 mm; width: 0.4 - 0.5 mm; thickness: 0.1 - 0.3 mm). We observed a consistent behavior of LMR above 0.05 T field in all three samples. The MR% (=) of all the samples lies in the range of 0.5 - 1%. Therefore, careful analysis is required to determine its origin. Even a small misalignment of the sample contacts led to an asymmetric curve in B regimes due to a large anomalous Hall contribution near zero field. Therefore, the MR data were symmetrized to extract the true MR contribution. Negative MR was observed in the low field regime where IB(x, y and z) axes (Fig. 19 in the Appendix B). The nature of LMR was found to be very similar as long as the magnetic field and current are applied in the x-y (or a-b) plane. However, it is different when the field and current are applied along the z axis. The LMR data show non-monotonic behavior with the magnetic field in all the cases. Most of the electric transport measurement analysis presented here corresponds to the S2 sample unless another sample is mentioned.
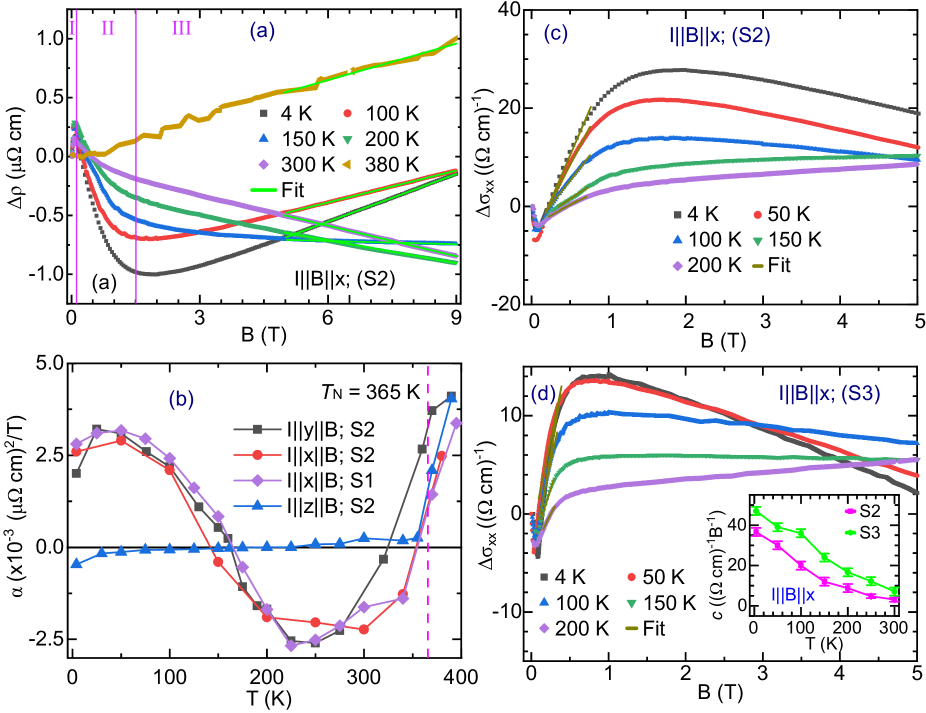
The LMR along x axis, for S2 and S3 samples, increases with the magnetic field up to 0.05 T, which is referred to as region I, as shown in Fig. 2(a). However, such behavior was not observed when the field was applied along the y, z axes (Fig. 19 in the appendix). Such an increase in LMR at a very low field was not observed when the LMR of the S1 sample was measured along the x axis (Fig. 18 in the appendix). Beyond 0.05 T, LMR starts to show a sudden decrease till 1.5 T (S2 sample), referred as region II. This behavior was observed in all cases, irrespective of the sample, and the direction of the magnetic field. Near 1.5 T, negative MR starts to get suppressed, followed by region III. The LMR in region III shows different behavior in different cases, which will be discussed later. In the case of the S3 sample, a similar change from region II to region III is observed near 0.8 T. Similar nature of LMR has also been observed in the case of the thin-film Mn3Ge Qin et al. (2020).
As described and observed by Ref. Liang et al. (2018); Zhang et al. (2016b), the current jetting effect can lead to negative MR in anisotropic samples. Therefore, the effect of current jetting on the MR of our sample has been measured, as described in Appendix B. It is clear from the observation that the role of current jetting is insignificant in our samples. This is expected because in contrast with the Na3Bi and GdPtBi Liang et al. (2018), the magnitude of resistivity and MR in Mn3Ge is nearly same along different axes (see Fig (17, 19) in the appendix). The absence of the current jetting effect provides a piece of strong evidence that the observed LMR is intrinsic.
IBx
In the case of (IBx), the origin of the region I is likely to be a weak antilocalization (WAL) effect. Its magnitude was found to be 0.05 cm, 0.3 cm, and 0.6 cm, in the case of S1, S2, and S3 samples, respectively. The increase in the magnitude of MR in the region I could link with the increase in the strength of the WAL with the disorder in the system with an increase in the Mn concentration.
The sudden decrease of LMR in region II is observed along all the axes, in all three samples. We have compared LMR in this field regime in terms of Longitudinal magneto-conductivity (LMC). The relation between LMC () and LMR () is given as: . LMC for S2 and S3 samples are compared in Figs. 2(c, d), where it is clear that the LMC increases almost linearly (beyond 0.05 T) up to 0.8 T and 0.4 T, in S2 and S3 samples, respectively. As mentioned above, this magnetic field regime is referred as region II. The LMC in region II shows positive (linear) increase when the magnetic field is applied along the x axis, and can be fitted linearly (at low field) using the equation: . Where is the proportionality constant.
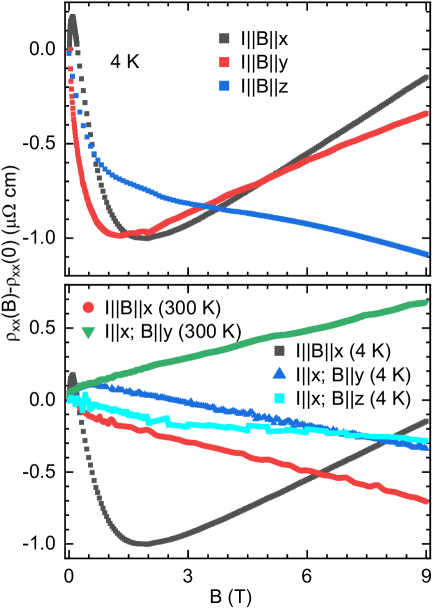
The LMC along the x axis shows positive and increasing behavior at low field. However, it starts to decrease for T. This observation is different from the Mn3Sn, where positive LMC persists up to 9 T Kuroda et al. (2017). Therefore, the presence of the chiral anomaly effect in Mn3Ge cannot be justified.
As shown in Fig. 2(d), at 200 K is nearly one-third of with at 4 K. However, the magnetization (Fig. 15 in the appendix) remains almost constant up to 200 K. Furthermore, the field dependent magnetization is linear, however, LMC is not monotonic, up to 3 T, with the magnetic field. These observations imply that the positive LMC in region II is not driven by the magnetization of the sample.
At high magnetic field (region III), LMR shows linear field-dependent behavior with slope , where is the zero field resistivity. The temperature dependence of for three samples with field applied along different axes is shown in Fig. 2(b). Unlike Mn3Sn Kuroda et al. (2017), positive LMR () is observed in Mn3Ge below 165 K when field is applied along the x, y axes. Positive LMR has been observed in several Weyl semimetals Ghimire et al. (2018); Shama et al. (2020); Zhang et al. (2016b); Huang et al. (2015); Zhang et al. (2020); Li et al. (2017), however, such a feature has been attributed to the extrinsic effects, like current jetting or misalignments Li et al. (2017). Since we have already nullified the possibility of the current jetting effect, the nature and origin of have to be intrinsic. Application of the magnetic field in a different direction can lead to the opening of the gap in the Weyl points, or Dirac points, which can lead change in the nature of MR Zeng et al. (2020). Such electronic transition has been observed in TaAs (Weyl semimetal), where vanishing Weyl points lead AHE to vanish near 50 T Ramshaw et al. (2018). However, in the case of Mn3Ge, AHE is present up to 9 T, which suggests that the Weyl points remain separated beyond 1.5 T as well. Therefore, change in LMR near 1.5 T does not originate due to field induced electronic transition.
In the case of Mn3Ge, metallic to non-metallic transition is observed in the resistivity measurements (see Fig. 17 in the appendix) near 200 K. We assume that the non-metallic region (above 200 K) is semimetal. However, spin-resolved band structure calculations are required to determine whether it is a semimetal or half-metal above 200 K. For convenience, we will consider our sample at as semimetal. Positive and negative longitudinal MR can be observed in the case of metallic, and halfmetallic/semimetallic samples Yang et al. (2012); Pippard (1989); Roth et al. (1963); Furukawa (1962); Kawabata (1980); Endo et al. (1999); Sun et al. (2020), respectively, depending on the spin polarized density of states (DOS) near the Fermi surface Kokado et al. (2012). Crossover of MR from positive to negative MR due to change in the spin polarized DOS, near the Fermi surface, has been reported in the case of Half metallic compounds Ouardi et al. (2013); Du et al. (2013). Since Mn3Ge shows semimetal to metal transition near 200 K, the high field LMR at low and high temperatures possibly originates due to the metallic and semimetallic nature of the sample, respectively. At lower temperatures, low field LMR is negative, and high field LMR is positive. This suggests a strong competition between two different phenomena, which leads to a change in sign of near 165 K, rather than near 200 K, where semimetal to metal transition occurs. It is important to note that the high field positive LMR due to the metallic nature of the sample has not been observed in the case of Mn3Sn Kuroda et al. (2017); Chen et al. (2021). Such difference in LMR for Mn3Ge and Mn3Sn is possible because electrical transport measurements are intimately linked with the DOS, which differs significantly for these compounds, as reported by Refs. Yang et al. (2017); Kübler and Felser (2014).
Similar observation of crossover of MR, at an intermediate temperature, due to the relative change in the spin polarized DOS, has been observed in the case of ferromagnetic thin-film CrTe2, Half metallic, and semimetallic compounds as well Sun et al. (2020); Du et al. (2013); Ouardi et al. (2013). Therefore, it would be very interesting to study the spin polarized DOS in Mn3Ge at low and high temperatures to justify the role of spins in the observed LMR.
IBz
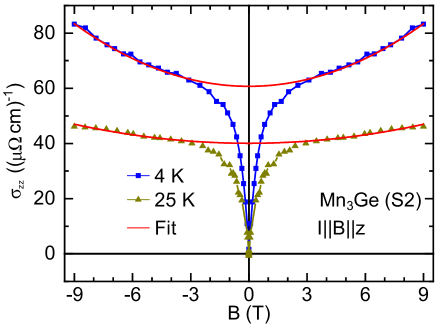
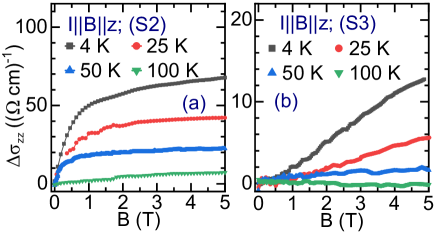
In contrast to the x axis, LMC along the z axis increases with the magnetic field up to 9 T, as shown in Figs. 3 (and Fig. 20 in the appendix). The sharp linear increase in LMC, along z axis, at the low field is possibly due to the domain effect, as suggested by Ref. Chen et al. (2021). For T, we have observed dependence of the LMC, at 4 K, similar to the Ref. Chen et al. (2021). However, such a field dependence, and magnitude of LMC, both weaken as the temperature is increased to 25 K.
III.2 Angle dependent MR (MR)
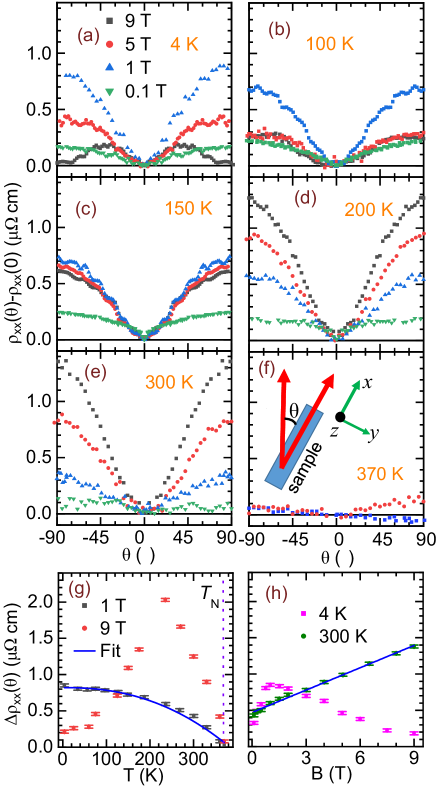
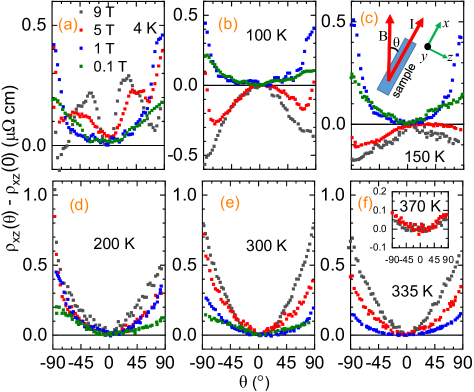
Angle dependent MR (referred as MR) was performed by rotating the sample, thus making the current direction have an angle with respect to the applied magnetic field. All the MR measurements were performed using the S2 sample, whose corresponding LMR is shown in Fig. 2(a). The MR measurement can be performed in several different combinations of the direction of rotation, magnetic field, and electric current. Therefore, we performed MR in four different ways: (i) Ix; B is rotation from y axis, (ii) Iy; B is rotation from x axis, (iii) Ix; B is rotation from z axis, (iv) Iz; B is rotation from x axis. Field dependent behavior of MR is different depending on the direction of the current at , and the plane of rotation. MR remains nearly same (except at B = 9 T at 4 K) as long as the field is rotated in the x-y plane, which is the case (i, ii) as shown in Figs. (4, 21(a - c) in the appendix). However, it is different in other two cases when plane of rotation is x-z axis (compare Figs. 21(d, e, f), and Fig. 22 in the appendix).
The MR of the sample with B applied parallel () and perpendicular () to the current direction axis is compared in Fig. 19 in the appendix. Based on this, it is obvious that the MR, () has to be positive in almost all the cases, except high field measurements at 4 K, and the same has been observed during the MR measurements.
Positive MR is observed when it is measured corresponding to IBx; B rotation from (Figs. 4(a-f)). The magnitude and behavior of MR behaves in a similar way when it is measured for IBy; B rotated from (see Fig. 21(a-c) in the appendix). We have performed detailed analysis of MR corresponding to IBx; B rotation from . The temperature dependence of magnitude of MR is shown in Fig. 4(g). It has been observed that the magnitude of MR at 9 T increases with temperature up to 200 K, beyond which it starts to decrease and vanishes near 365 K (T). The MR at 9 T is unlikely to be originated from the chiral anomaly effect, because the LMR increases with field beyond 1.5 T at 4 K (Fig. 2(a)). In contrast with 9 T, MR at 1 T monotonically decreases with temperature, and can be fitted with , where m = 2.3(2) was observed, which is higher than observed in other Dirac or Weyl semimetals (m = 1.4 Singha et al. (2018), m =1.7 Shama et al. (2020)). The temperature dependence of MR magnitude at 1 T is similar to the temperature dependent magnetization Fig. (15). Therefore, low field MR might originate from the tiny magnetization of the sample.
Analysis of high field MR
According to the Refs. Kokado et al. (2012); McGuire and Potter (1975), unequal spin DOS near Fermi surface can lead to the positive and negative MR, as observed by Refs. Sun et al. (2020); Yang et al. (2012). The condition for negative and positive MRspin is discussed in more detail in Ref. Kokado et al. (2012). We will refer to the MR contribution due to spin DOS as MRspin. The temperature dependent resistivity in Fig. 17 (in the appendix) suggests that Mn3Ge is metallic below 200 K, and semimetallic above this temperature, which suggests a possible change in the spin DOS, near the Fermi surface, near 200 K. Since our sample is metallic below 200 K, MRspin should be negative (i.e. ) in behavior Yang et al. (2012); Kokado et al. (2012). As observed in Fig. 2, high field LMR increases with the magnetic field, but it remains negative in magnitude due to its sharp decrease at low field (below 1.5 T). Also, the transverse MR (Fig. 19 in the appendix) is larger than LMR up to 8 T. Therefore, positive MR () is observed at 4 K, even though the sample is metallic at this temperature.
The field dependent MR magnitude in Fig. 4(h) shows a decrease with an increase in the magnetic field, which also suggest that high field MRspin (expected to show negative MR) suppresses the low field MR (which leads to positive MR), as the magnetic field is increased. These observations also suggest that similar to the high field LMR, the high field MR is also driven by the spin DOS near the Fermi surface. Furthermore, the observed MR at 4 K is a combined effect of two competing phenomena, which results in negative and positive LMR, below 200 K. Therefore, an increase in the magnitude of MR, at 9 T, with temperature, up to 200 K, is possible if both the effects weaken with an increase in temperature at different rates (see Fig. 4(g)).
Above 200 K, Mn3Ge is semimetallic, which suggest that for MR driven by unequal spin density (MRspin), has to be positive Yang et al. (2012); Kokado et al. (2012). We have observed positive MR at 300 K. The MR at 300 K also increases linearly with an increase in the magnetic field (Fig. 4(h)). This confirms that the positive MR for T 200 K (Fig. 4(d, e)) originates due to the MRspin.
III.3 Anomalous Hall effect and planar Hall effect
Anomalous Hall effect
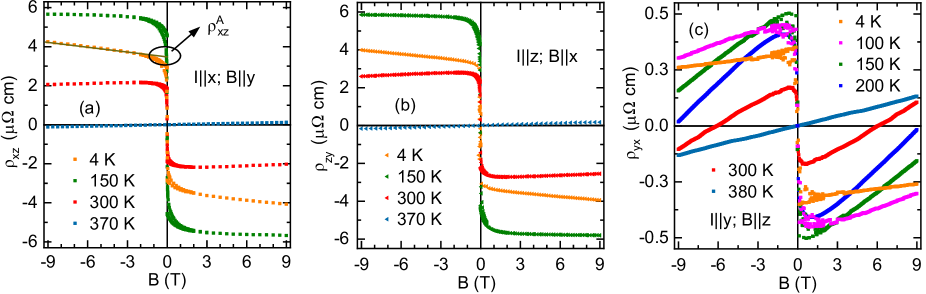
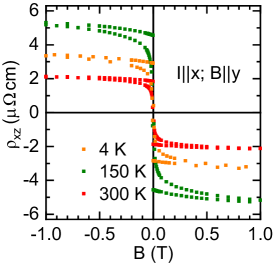
Hall resistivity of Mn3Ge was measured in different combinations of the current and magnetic field. The measurements were repeated using different samples as mentioned previously (section III.1). Consistent behavior of Hall resistivity was observed during all the measurements performed using different samples. Fig. 5 shows Hall resistivity of Mn3Ge (S2) with field applied along the y, x and z axes at various temperatures. It can be seen that Hall resistivity shows a finite jump at zero magnetic fields followed by a linear field dependence at higher fields. The Hall effect can arise because of the external or internal magnetic field present in the system. In the case of Weyl semimetals, Berry curvature over the Brillouin zone does not vanish, which results in a huge fictitious magnetic field, giving rise to the AHE. Hall resistivity (), with current and voltage measured along and j axis, can be written into its components as: . Where, the first term shows normal Hall resistivity contribution, which is proportional to the external magnetic field (B). is the Hall resistivity component that originates due to the magnetization (M) of the sample. The term denotes the anomalous Hall resistivity due to the non-zero Berry curvature. In the case of Mn3Ge, a small residual magnetic moment is present but the - the curve does not follow the M-H type behavior. Also, the temperature-dependent Hall conductivity does not follow the M-T behavior (compare Fig. 7 and Fig. 15). Therefore, we conclude that the magnetization plays a negligible role in the anomalous Hall resistivity observed in Mn3Ge Kiyohara et al. (2016) and most likely originates from the non-zero Berry curvature, which is denoted by .
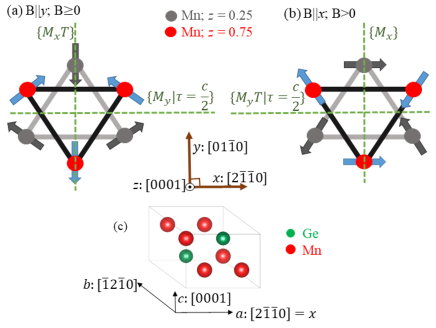
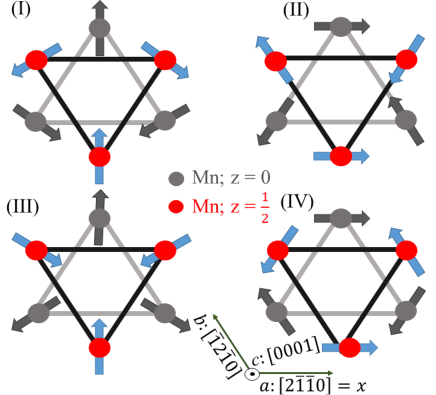
The non-zero value of the anomalous Hall resistivity is intimately connected to the underlying symmetry of the magnetic structure. The ideal magnetic structure of Mn3Ge is a coplanar triangular antiferromagnetic structure with spins aligned in a reverse triangular arrangement (Fig. 6(a)). However, the presence of Dzyaloshinskii-Moriya interaction (DMI) in such a system, leads to small ferromagnetic canting, which has two important consequences: (i) The presence of only a few hundred Oersted (Oe) magnetic fields can create unequal domain population of spins with opposite chirality, which leads to the non-zero value of Berry curvature. (ii) The Mn spin triangle can be rotated easily with the help of just a few hundred Oe of magnetic field Tomiyoshi et al. (1983); Nagamiya et al. (1982). Therefore, once the magnetic field is reversed, Hall resistance also reverses its sign within 200 Oe of the applied magnetic field (Fig. 23).
The symmetry analysis performed by Ref. Nayak et al. (2016) claims that (By) shows large intrinsic Hall conductivity. However, (Bz), (Bx) should vanish if the zero-field magnetic structure is taken into consideration. Here, denotes that the current (voltage) is applied (measured) along the i (j) axis, and the magnetic field is perpendicular to both directions. Despite their claim, a large and comparable magnitude of anomalous Hall conductivity (AHC) was observed if the magnetic field was applied along the x and y axis Nayak et al. (2016). We also observed large anomalous Hall resistivity, which corresponds to large AHC, when the magnetic field was applied along the x or y axis (Fig 5). The presence of a large can be explained by the field induced change of the magnetic structure of Mn3Ge.
Based on field-dependent single crystal neutron diffraction, Refs. Tomiyoshi et al. (1983); Nagamiya et al. (1982) claim that the magnetic structure of Mn3Ge changes if a magnetic field is applied along the x or y axis. Fig. 6(a) shows the ground state magnetic structure, which remains the same even if the magnetic field is applied along the y axis. However, if the field is applied along the x axis, the magnetic structure changes as shown in Fig. 6(b). In the case of By, and Bx, there exists a mirror plane (, and , respectively) as shown in Fig. 6(a, b). Mirror reflection reverses the chirality but keeps the Berry curvature preserved Yang et al. (2017). Therefore, the Berry curvature (, ) does not vanish in the case of Bx or By. This leads to the large AHC observed in Mn3Ge as long as the magnetic field is applied along the x or y axis. Refs. Tomiyoshi et al. (1983); Nagamiya et al. (1982) performed a neutron diffraction experiment under a 0.8 T magnetic field and a change in the magnetic structure was observed depending on the direction of the applied magnetic field. Also, a very small field hysteresis is observed in AHE, as shown in Fig. 23, and is consistent with Ref. Nayak et al. (2016). Therefore, it is very likely that just a few hundred Oe of the magnetic field are sufficient to change the magnetic structure from (a) to (b) of Fig. 6, which results in a very similar nature of Hall resistivity if the field is applied along the x or y direction, as shown in Fig. 5.
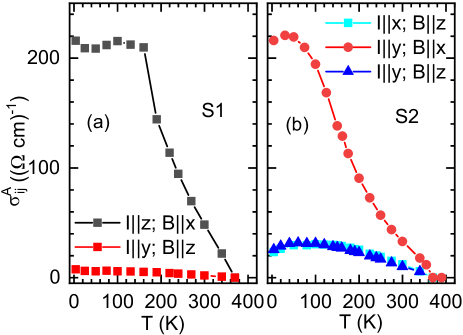
The anomalous Hall conductivity (AHC) (), originating from a non-zero Berry curvature, can be experimentally determined by: . Where, are the longitudinal resistivities at the given field, is the Hall resistivity at B = 0, with the field applied perpendicular to both the i and j directions. is significantly large if the field is applied along the x or y axis. The y axis intercept of linear fitting of Hall resistivity at high field can be regarded as (example shown in Fig. 5(a)). The temperature dependent AHC, , is shown in Fig. 7. We observed nearly the same conductivity at 4 K for S1 and S2 samples which have slightly different Mn concentrations - (Mn3.1Ge and Mn3.2Ge). Similar to Refs. Chen et al. (2021); Kiyohara et al. (2016); Xu et al. (2020b), the AHC was observed to be nearly constant below 150 K and 60 K for samples with low (S1) and high (S2) Mn concentration (Fig. 7), respectively. Hall conductivity above these temperatures decreases as the temperature is increased and eventually vanishes near TN = 365 K. Interestingly, a small anomalous Hall effect was observed in the case of Bz () as well. To confirm this observation, we performed a Bz Hall effect experiment with different samples. The behavior was found to be nearly the same in nature but different in magnitude. In the case of Bz, small anomalous Hall and Nernst conductivity have already been reported, but its nature is not consistent Xu et al. (2020b); Kiyohara et al. (2016); Nayak et al. (2016); Wuttke et al. (2019). The probable origin of the non zero could be: (i) the location of Weyl points out of the a-b plane, as theoretically predicted by Yang et al. (2017), (ii) the small topological Hall effect due to very small canting of Mn moments towards the z axis, as observed in M-H with Bz Nayak et al. (2016) and, (iii) the presence of a small (2-3%) tetragonal-Mn3Ge impurity phase, which is ferrimagnetic along the z axis. However, the true origin of AHE in the case of Bz is still unknown.
Using the single-band model, the carrier concentration was observed to be /cm3 below 100 K when z was applied. However, it is up to 10 times lower if the field is applied along the x or y axis. The Hall slopes observed in our samples are larger than the reported data Nayak et al. (2016); Kiyohara et al. (2016); Xu et al. (2020b), which results in nearly 10 - 50 times lower carrier concentration compared to Ref. Xu et al. (2020b) ( /cm3). The possible difference could arise because of different sample compositions and preparation methods.
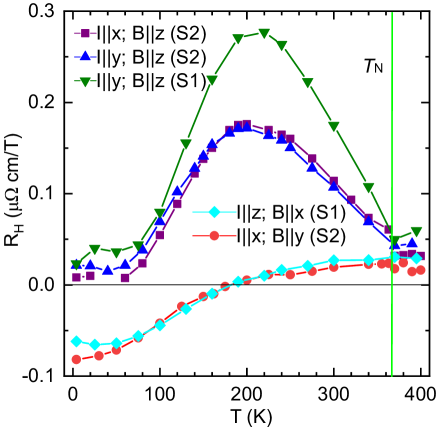
The Hall coefficient, (), can be determined by the high field slope of the Hall resistivity (). It can be seen in Fig. 8 that remains positive and shows a maximum, near 200 K, as long as the field is applied along the z direction. However, it turns negative, near 190 K, if the field is applied along the x or y axis, irrespective of the current direction. The change in the sign of suggests that electrons are the dominant carrier above 190 K. However, the number of hole carriers dominates over electrons below 190 K. A similar transition in the dominant carrier concentration, at a lower temperature ( 50 K) though, has been reported by Ref. Wang et al. (2021) in the case of thin film Mn3Ge. Therefore, we can argue that similar to Ref. Wang et al. (2021), a topological electronic transition occurs in single crystal Mn3Ge also, where chemical potential relative to Weyl points move from the valence to the conduction band with an increase in temperature and crosses the Fermi surface near 190 K. The topological transition temperature (190 K) is very near 200 K, where the metal-semimetal transition occurs. This suggests an intricate connection between these two effects, which is expected as both the effects are determined by the electronic band structure and DOS near the Fermi surface.
Planer Hall effect (PHE)
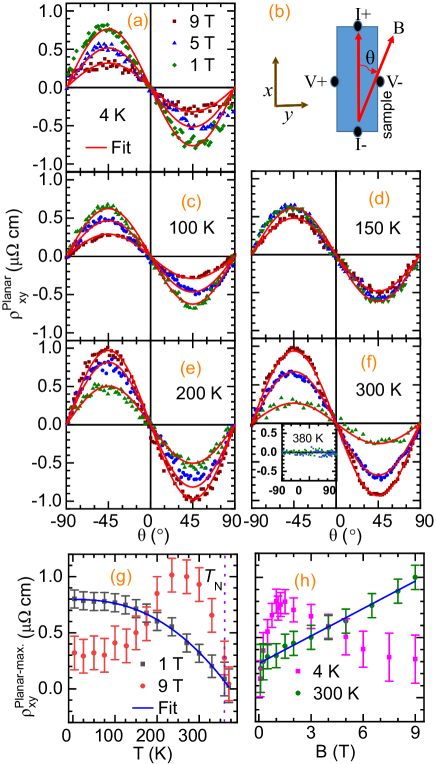
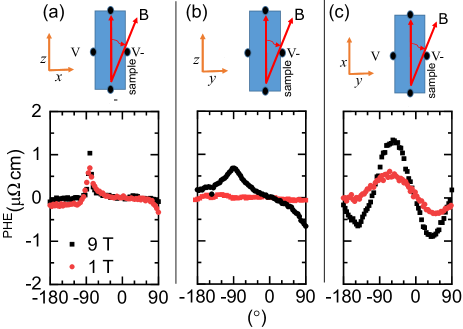
Transverse resistivity can also be measured with the magnetic field rotating in the sample plane (as shown in Fig. 9), which is known as the planar Hall effect (PHE). PHE is expected to be observed in Weyl semimetals. However, it can have non-topological origin as well Liu et al. (2019). Usually, the PHE follows the following angular dependence Liu et al. (2019):
| (1) |
Where, is termed as the planar Hall resistivity with the current is applied along the i direction and the voltage is measured along the j direction, given that the field is rotated in the i-j plane. It is interesting to note in the magnitude of PHE in the system is determined by the magnitude of MR (). We have performed PHE measurement such that the magnetic field is rotated in the x-y crystallographic plane. As shown in Fig. 9, clear oscillations of PHE, consistent with Eqn. (1), is observed in all the fields and temperature ranges below (365 K).
As shown in Figs. 9(g, h), the PHE magnitude at 9 T and 1 T behaves very similar to the MR magnitude (shown in Fig. 4(g, h)), and vanishes near 365 K (T). The PHE magnitude at 1 T decreases monotonically with temperature, and was obtained (when fitted with ), similar to the MR. Behavior of the low temperature (4 K) PHE magnitude is also the same as MR, where PHE increases with field up to 1.5 T, and decreases afterward. At 300 K, PHE increases almost linearly with the magnetic field, similar to the MR. The observations cleraly suggest that PHE magnitude follow MR behaviour, which is expected Liu et al. (2019). Therefore, the origin of PHE at any temperature and magnetic field has to be the same as the origin of MR.
Further, we measured PHE in the x-z and y-z planes as well. However, a PHE oscillation was not observed in these cases. The raw data corresponding to different configurations are shown in the Appendix B (see Fig. 24). In the case of PHE measured in x-z and y-z planes, either the signal is absent or too weak to be analyzed. The absence of PHE in the case of out of a-b plane magnetic field rotation may be related to the in-plane magnetic structure of the system. It is possible that the out-of-plane magnetic field rotation leads to equalizing the population of domains with opposite chirality, leading to neutralizing the PHE oscillations, which have a periodicity of 180∘. Further neutron diffraction experiments for magnetic fields out of the plane are needed to clarify the absence of PHE oscillations in these planes.
IV Single crystal neutron diffraction
Magnetic Weyl semimetals primarily originate from the broken time-reversal symmetry in the magnetically ordered ground state. Therefore, slight change in magnetic structure or a sudden change in a magnetic moment with temperature could play a direct role in the observed changes of the anomalous transport properties. Other than this, the symmetry of the magnetic structure also interferes with the properties observed in the magnetic Weyl semimetals, thus, affecting the magnitude of anomalous transport effects. As we observed a significant change in the behavior of all the components of electrical transport effects, (even thermal transport Wuttke et al. (2019)) below room temperature, careful analysis of the magnetic structure of Mn3Ge was required. Therefore, we performed a (unpolarized) neutron diffraction experiment on a single crystal of Mn3Ge (S3) at three different temperatures at 300 K, 175 K, and 4 K to look for possible changes in its magnetic structures. The experiment was performed by selecting neutron wavelength at 0.87 Å. The data analysis was performed using JANA2006 software Petr̆íc̆ek et al. (2014). Since propagation vector, k = 0 for Mn3Ge Tomiyoshi et al. (1983); Soh et al. (2020), the nuclear and magnetic reflections coincide. Therefore, high Q (0.4) reflections 111Due to the specific form of magnetic form factor we expect a negligible contribution of magnetic intensities at high Q. were fitted to obtain the nuclear parameters, which were in agreement with the results from X-ray diffraction of the same sample (S3). The Mn atoms occupying Ge sites were assumed to be non-magnetic while performing the magnetic refinement.
The representation analysis of space group P/mmc for k = 0 gives 18 basis vectors, corresponding to 18 types of possible magnetic structures. Most of them could be rejected based on the magnetization data, except for four magnetic structures shown in Fig. 10. The fitting parameter () corresponding to these magnetic structures is mentioned in Table 2 in the appendix. There are three (120∘) magnetic domains possible for each structure in Fig. 10. Therefore, unequal populations of the domains were also taken into consideration, and the refinement was performed by fitting data with different magnetic structures at all three temperatures. We observed that the neutron diffraction data at all three temperatures (4 K, 175 K, 300 K) fit best with magnetic structures I and II (Fig. 10) only, as mentioned in Table 2 in the Appendix C. Since magnetic structure factors for I and II are same for all the reflections, even if unequal domain population is taken into account, they cannot be differentiated using unpolarized single crystal neutron diffraction. However, Ref. Soh et al. (2020) has reported Fig. 10 (I) to be the ground state magnetic structure of Mn3Ge. Therefore, we also considered magnetic structure I as the ground state magnetic structure of Mn3Ge.
| Temperature | 4 K | 175 K | 300 K |
|---|---|---|---|
| Moment | 2.15(8) | 2.01(7) | 1.68(9) |
| 1.82 | 1.35 | 1.79 | |
| R | 2.76 | 2.32 | 2.37 |
| Rw | 3.15 | 2.53 | 3.22 |
| U[Mn] | 0.0036(2) | 0.0058(1) | 0.0082(3) |
| U[Ge] | 0.0014(2) | 0.0031(2) | 0.0050(2) |
| Domain ratio | 55:35:10 | 50:35:15 | 52:42:6 |
| No. of reflections | 229 | 165 | 175 |
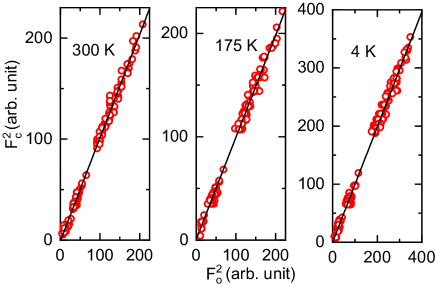
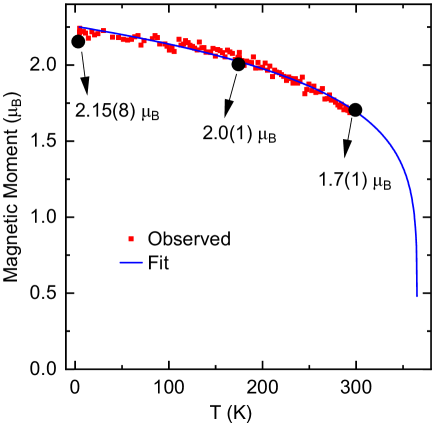
Calculated vs. observed intensities, corresponding to the magnetic structure I, are shown in Fig. 11, and the fitting parameters at each temperature are given in Table 1. Based on the analysis, it can be concluded that no change in the magnetic structure was observed starting from 300 K to 4 K. The temperature-dependent magnetic moment was also determined by collecting the strongest magnetic peak (1 0 1) at several temperatures. As shown in Fig. 12, the magnetic moment increases smoothly with decrease in temperature. The magnetic moment can be fitted with a power law of the form , where is the magnetic moment at K, and found to be 2.25(1) . , which is an exponent, was found to the 0.16(1). The = 165 K was fixed.
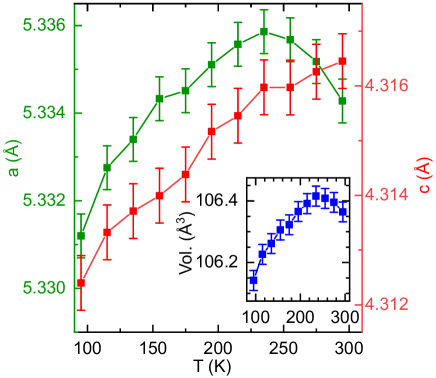
Our neutron diffraction analysis at zero magnetic fields, along with field-dependent studies by Refs. Nagamiya et al. (1982); Tomiyoshi et al. (1983), suggest that the magnetic structure remains the same below 300 K. Therefore, the change in the behavior of transport properties is not directly linked to the magnetic structure or the ordered magnetic moment. To look further, we measured lattice parameters as a function of temperature. Fig. 13 shows the temperature variation of the lattice parameters. The in-plane lattice parameter, a, shows a maximum near 230 K, whereas the c lattice parameter varies smoothly. Negative thermal expansion was observed in the temperature range of 300 K to 230 K, same as reported by Song et al. (2018); Sukhanov et al. (2018). Below 230 K, it follows positive thermal expansion as expected for any normal metal. Since transport properties show a change in the behavior near or below 200 K, it is very likely that the transport properties are sensitive to the changes in the lattice parameters.
V Conclusion
An increase in the excess Mn concentration () in Mn3+δGe increases the magnitude of resistivity, thus conductivity decreases. However, the intrinsic nature of the transport behavior of Mn3Ge (S2, S3) remains unchanged. The LMR shows sharp negative behavior at low fields, which turns towards positive beyond 1.5 T. Therefore, the presence of a chiral anomaly in Mn3Ge cannot be justified. At the high field, all the electrical transport effects show a change in behavior near 200 K, where metal-semimetal transition occurs. Analysis of transport measurements shows that the high field LMR and MR of Mn3Ge are possibly driven metallic or semimetallic nature of the sample, below and above 200 K, respectively. Dominant carrier type also changes from hole to electrons near 190 K. Since electrical transport effects are determined by the band structure near the Fermi surface, an electronic topological transition is very likely to be present in the Mn3Ge near 200 K. Neutron diffraction measurements show that the magnetic structure remains same below and above 200 K. However, in-plane lattice parameter shows an unusual behavior near 230 K. It is possible that the change in electrical properties, near 200 K, could possibly be driven by the change in lattice parameter of Mn3Ge.
VI Acknowledgements
Single crystal neutron diffraction data used in this publication were measured at the instrument HEiDi jointly operated by the Institute of Crystallography of RWTH Aachen University and the Jülich Centre of Neutron Science, Forschungszentrum Jülich GmbH within the JARA cooperation at the Heinz Maier-Leibnitz Zentrum (MLZ).
APPENDIX A EXPERIMENTAL DETAILS
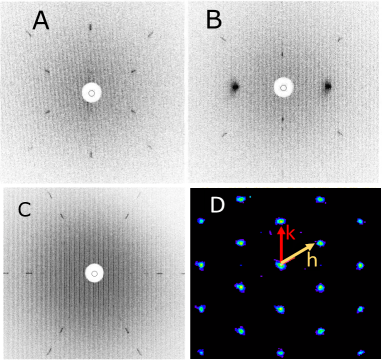
X-Ray diffraction: High-intensity Laue spots were also observed in the Laue diffraction of the single crystals. The Laue diffraction pattern for X-ray parallel to the x, y, z crystallographic axis are shown in Fig. 14. Single crystal X-ray diffraction was performed using SuperNova (Rigaku Oxford Diffraction) instrument. High-intensity reflections were observed, as shown in 14(D), which suggests the high quality of the single crystals.
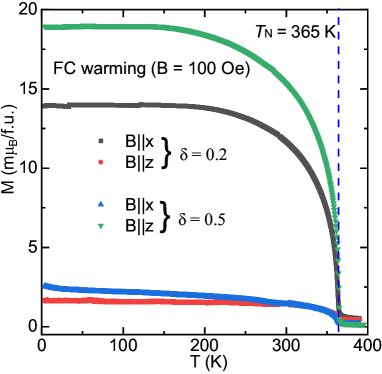
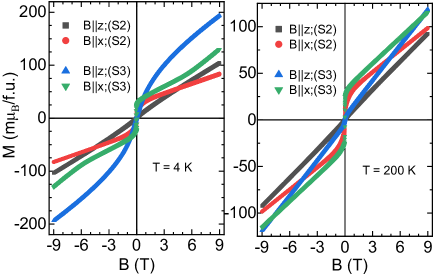
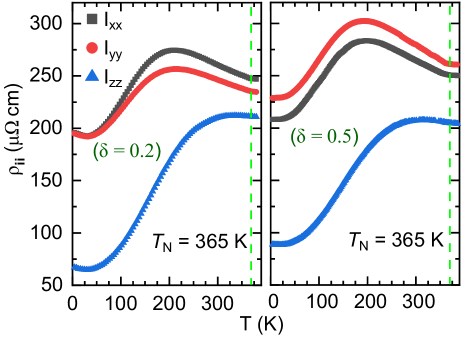
Magnetization: The magnetization of all the single crystals of Mn3Ge was measured using the Quantum Design PPMS setup, with the magnetic field applied along the , , and directions. The Néel temperature (T) was observed to be near 365 K for all the samples. For both the samples, magnetization starts to saturate below 200 K. Magnetization behavior was found to be very similar to each other for S1 and S2 samples. However, a slightly different magnetization behavior was observed, below 25 K, in the case of the S3 sample, when the field was applied along the z direction. M-T, M-H for S2 and S3 samples are compared in Fig. 15 and Fig. 16. The magnetization data (for S2) shows residual magnetic moment of 20 m/f.u. and 4 m/f.u. when field was applied in the a - b plane, and along the c axis, respectively. This confirms that along with dominant antiferromagnetic (AFM) structure, Mn moments are canted ferromagnetically in the a-b plane Nayak et al. (2016); Kiyohara et al. (2016). Since a small amount of tetragonal phase (2-5%) was observed in all the samples, its effect on magnetization data was important to determine. M-H at 390 K, (paramagnetic regime for hexagonal phase), was performed. We observed only paramagnetic behavior even though the tetragonal phase is ferrimagnetic. Therefore, we can conclude that a small (tetragonal) impurity phase has a negligible effect on the magnetization and electrical transport measurement.
APPENDIX B TRANSPORT MEASUREMENT
Longitudinal resistivity corresponding to the two samples with significantly different Mn concentrations is shown in Fig. 17. The resistivity along x, y axis looks very similar to each other. However, it shows significantly different behavior along the z axis.
Current jetting effect
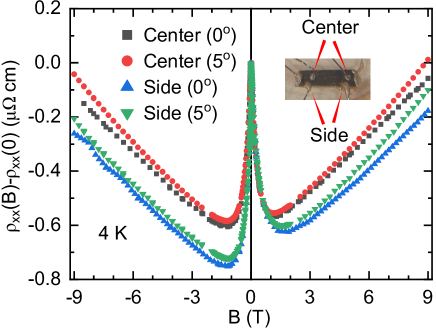
The current jetting effect can also be the possible reason behind the negative MR observed in samples, however, we can nullify this effect based on three arguments: (1) We observed a very similar nature of MR for all three samples. (2) samples were carefully cut to create a parallel electric field region. (3) voltage was measured at different positions of the sample to see the effect of a non-uniform electric field if present. The behavior of LMR along x axis has a negligible effect of voltage contact positions - either at the center or sides, as shown in Fig. 18. Since the magnitude of MR is nearly the same in all directions, the current jetting effect cannot be expected to be significant.
MR (z-x plane rotation)
As shown in Figs. (21(d-f), 22), positive MR is observed in the case of IBz; B rotation from , and IBx; B rotation from . In the case of IBz; B rotation from , MR increases (decreases) with field (temperature) at all the temperatures (field). However, the magnitude of MR is non-monotonic with field and temperature for IBx; B rotation from . Since Mn3Ge has magnetic anisotropy in z-x plane, the observed MR may result from the magnetization of the sample.
| Temperature | 4 K | 175 K | 300 K |
|---|---|---|---|
| (model I) | 1.82 | 1.35 | 1.79 |
| (model II) | 1.82 | 1.35 | 1.79 |
| (model III) | 4.18 | 3.43 | 2.58 |
| (model IV) | 3.95 | 3.31 | 2.4 |
APPENDIX C Neutron diffraction
The neutron diffraction analysis at different temperatures was performed using various models mentioned in the main text. The fitting parameter corresponding to different models is shown in Table 2.
References
- Nayak et al. (2016) A. K. Nayak, J. E. Fischer, Y. Sun, B. Yan, J. Karel, A. C. Komarek, C. Shekhar, N. Kumar, W. Schnelle, J. Kübler, et al., Sci. Adv. 2, e1501870 (2016).
- Nakatsuji et al. (2015) S. Nakatsuji, N. Kiyohara, and T. Higo, Nature 527, 212 (2015).
- Armitage et al. (2018) N. Armitage, E. Mele, and A. Vishwanath, Rev. Mod. Phys. 90, 015001 (2018).
- Liu et al. (2018) E. Liu, Y. Sun, N. Kumar, L. Muechler, A. Sun, L. Jiao, S.-Y. Yang, D. Liu, A. Liang, Q. Xu, et al., Nat. Phys. 14, 1125 (2018).
- Xiong et al. (2015) J. Xiong, S. K. Kushwaha, T. Liang, J. W. Krizan, M. Hirschberger, W. Wang, R. J. Cava, and N. P. Ong, Science 350, 413 (2015).
- Shekhar et al. (2018) C. Shekhar, N. Kumar, V. Grinenko, S. Singh, R. Sarkar, H. Luetkens, S.-C. Wu, Y. Zhang, A. C. Komarek, E. Kampert, et al., Proc. Natl. Acad. Sci. USA 115, 9140 (2018).
- Tomiyoshi and Yamaguchi (1982) S. Tomiyoshi and Y. Yamaguchi, J. Phys. Soc. Jpn. 51, 2478 (1982).
- Tomiyoshi et al. (1983) S. Tomiyoshi, Y. Yamaguchi, and T. Nagamiya, J. Magn. Magn. Mater 31, 629 (1983).
- Nagamiya et al. (1982) T. Nagamiya, S. Tomiyoshi, and Y. Yamaguchi, Solid State Commun. 42, 385 (1982).
- Krén and Kádár (1970) E. Krén and G. Kádár, Solid State Commun. 8, 1653 (1970).
- Liu et al. (2017) Z. Liu, Y. Zhang, G. Liu, B. Ding, E. Liu, H. M. Jafri, Z. Hou, W. Wang, X. Ma, and G. Wu, Sci. Rep. 7, 1 (2017).
- Chen et al. (2014) H. Chen, Q. Niu, and A. H. MacDonald, Phys. Rev. Lett. 112, 017205 (2014).
- Zhang et al. (2016a) W. Zhang, W. Han, S.-H. Yang, Y. Sun, Y. Zhang, B. Yan, and S. S. Parkin, Sci. Adv. 2, e1600759 (2016a).
- Kiyohara et al. (2016) N. Kiyohara, T. Tomita, and S. Nakatsuji, Phys. Rev. Appl. 5, 064009 (2016).
- Kübler and Felser (2014) J. Kübler and C. Felser, Europhys. Lett. 108, 67001 (2014).
- Jeon et al. (2021) K.-R. Jeon, B. K. Hazra, K. Cho, A. Chakraborty, J.-C. Jeon, H. Han, H. L. Meyerheim, T. Kontos, and S. S. Parkin, Nat. Mater. 20, 1358 (2021).
- Hong et al. (2020) D. Hong, N. Anand, C. Liu, H. Liu, I. Arslan, J. E. Pearson, A. Bhattacharya, and J. Jiang, Phys. Rev. Mater. 4, 094201 (2020).
- Wuttke et al. (2019) C. Wuttke, F. Caglieris, S. Sykora, F. Scaravaggi, A. U. Wolter, K. Manna, V. Süss, C. Shekhar, C. Felser, B. Büchner, et al., Phys. Rev. B 100, 085111 (2019).
- Wu et al. (2020) M. Wu, H. Isshiki, T. Chen, T. Higo, S. Nakatsuji, and Y. Otani, Appl. Phys. Lett. 116, 132408 (2020).
- Xu et al. (2020a) L. Xu, X. Li, L. Ding, K. Behnia, and Z. Zhu, Appl. Phys. Lett. 117, 222403 (2020a).
- Kuroda et al. (2017) K. Kuroda, T. Tomita, M.-T. Suzuki, C. Bareille, A. Nugroho, P. Goswami, M. Ochi, M. Ikhlas, M. Nakayama, S. Akebi, et al., Nat. Mater. 16, 1090 (2017).
- Wang et al. (2021) X. Wang, D. Pan, Q. Zeng, X. Chen, H. Wang, D. Zhao, Z. Xu, Q. Yang, J. Deng, T. Zhai, et al., Nanoscale 13, 2601 (2021).
- Berche et al. (2014) A. Berche, J.-C. Tedenac, and P. Jund, Intermetallics 47, 23 (2014).
- Gokhale and Abbaschian (1990) A. Gokhale and R. Abbaschian, J. Ph. Equilibria Diffus 11, 460 (1990).
- Yamada et al. (1988) N. Yamada, H. Sakai, H. Mori, and T. Ohoyama, Physica B + C 149, 311 (1988).
- Petr̆íc̆ek et al. (2014) V. Petr̆íc̆ek, M. Dus̆ek, and L. Palatinus, Z. Krist. 229, 345 (2014).
- Chen et al. (2020) Y. Chen, J. Gaudet, S. Dasgupta, G. Marcus, J. Lin, T. Chen, T. Tomita, M. Ikhlas, Y. Zhao, W. Chen, et al., Phys. Rev. B 102, 054403 (2020).
- Xu et al. (2020b) L. Xu, X. Li, X. Lu, C. Collignon, H. Fu, J. Koo, B. Fauqué, B. Yan, Z. Zhu, and K. Behnia, Sci. Adv. 6, eaaz3522 (2020b).
- Qin et al. (2020) P. Qin, Z. Feng, X. Zhou, H. Guo, J. Wang, H. Yan, X. Wang, H. Chen, X. Zhang, H. Wu, et al., ACS Nano 14, 6242 (2020).
- Liang et al. (2018) S. Liang, J. Lin, S. Kushwaha, J. Xing, N. Ni, R. J. Cava, and N. P. Ong, Phys. Rev. X 8, 031002 (2018).
- Zhang et al. (2016b) C.-L. Zhang, S.-Y. Xu, I. Belopolski, Z. Yuan, Z. Lin, B. Tong, G. Bian, N. Alidoust, C.-C. Lee, S.-M. Huang, et al., Nat. Commun. 7, 1 (2016b).
- Ghimire et al. (2018) N. Ghimire, M. A. Khan, A. Botana, J. Jiang, and J. Mitchell, Phys. Rev. Mater. 2, 081201 (2018).
- Shama et al. (2020) Shama, R. Gopal, and Y. Singh, J. Magn. Magn. 502, 166547 (2020).
- Huang et al. (2015) X. Huang, L. Zhao, Y. Long, P. Wang, D. Chen, Z. Yang, H. Liang, M. Xue, H. Weng, Z. Fang, et al., Phys. Rev. X 5, 031023 (2015).
- Zhang et al. (2020) N. Zhang, G. Zhao, L. Li, P. Wang, L. Xie, B. Cheng, H. Li, Z. Lin, C. Xi, J. Ke, et al., Proc. Natl. Acad. Sci. 117, 11337 (2020).
- Li et al. (2017) Y. Li, Z. Wang, P. Li, X. Yang, Z. Shen, F. Sheng, X. Li, Y. Lu, Y. Zheng, and Z.-A. Xu, Front. Phys. 12, 1 (2017).
- Zeng et al. (2020) F. Zeng, Z. Ren, Y. Li, J. Zeng, M. Jia, J. Miao, A. Hoffmann, W. Zhang, Y. Wu, and Z. Yuan, Phys. Rev. Lett. 125, 097201 (2020).
- Ramshaw et al. (2018) B. Ramshaw, K. A. Modic, A. Shekhter, Y. Zhang, E.-A. Kim, P. J. Moll, M. D. Bachmann, M. Chan, J. Betts, F. Balakirev, et al., Nat. Commun. 9, 1 (2018).
- Yang et al. (2012) F. Yang, Y. Sakuraba, S. Kokado, Y. Kota, A. Sakuma, and K. Takanashi, Phys. Rev. B 86, 020409 (2012).
- Pippard (1989) A. B. Pippard, Magnetoresistance in metals, vol. 2 (Cambridge university press, 1989).
- Roth et al. (1963) H. Roth, W. Straub, W. Bernard, and J. Mulhern Jr, Phys. Rev. Lett. 11, 328 (1963).
- Furukawa (1962) Y. Furukawa, J. Phys. Soc. Jpn. 17, 630 (1962).
- Kawabata (1980) A. Kawabata, J. Phys. Soc. Jpn. 49, 628 (1980).
- Endo et al. (1999) T. Endo, H. Kubota, and T. Miyazaki, J. Magn. Soc. Jpn. 23, 1129 (1999).
- Sun et al. (2020) X. Sun, W. Li, X. Wang, Q. Sui, T. Zhang, Z. Wang, L. Liu, D. Li, S. Feng, S. Zhong, et al., Nano Res. 13, 3358 (2020).
- Kokado et al. (2012) S. Kokado, M. Tsunoda, K. Harigaya, and A. Sakuma, J. Phys. Soc. Jpn. 81, 024705 (2012).
- Ouardi et al. (2013) S. Ouardi, G. H. Fecher, C. Felser, and J. Kübler, Phys. Rev. Lett. 110, 100401 (2013).
- Du et al. (2013) Y. Du, G. Xu, X. Zhang, Z. Liu, S. Yu, E. Liu, W. Wang, and G. Wu, EPL 103, 37011 (2013).
- Chen et al. (2021) T. Chen, T. Tomita, S. Minami, M. Fu, T. Koretsune, M. Kitatani, I. Muhammad, D. Nishio-Hamane, R. Ishii, F. Ishii, et al., Nat. Commun. 12, 1 (2021).
- Yang et al. (2017) H. Yang, Y. Sun, Y. Zhang, W.-J. Shi, S. S. Parkin, and B. Yan, New J. Phys. 19, 015008 (2017).
- Singha et al. (2018) R. Singha, S. Roy, A. Pariari, B. Satpati, and P. Mandal, Phys. Rev. B 98, 081103 (2018).
- McGuire and Potter (1975) T. McGuire and R. Potter, IEEE Trans. Magn. 11, 1018 (1975).
- Liu et al. (2019) Q. Liu, F. Fei, B. Chen, X. Bo, B. Wei, S. Zhang, M. Zhang, F. Xie, M. Naveed, X. Wan, et al., Phys. Rev. B 99, 155119 (2019).
- Soh et al. (2020) J.-R. Soh, F. de Juan, N. Qureshi, H. Jacobsen, H.-Y. Wang, Y.-F. Guo, and A. Boothroyd, Phys. Rev. B 101, 140411 (2020).
- Song et al. (2018) Y. Song, Y. Qiao, Q. Huang, C. Wang, X. Liu, Q. Li, J. Chen, and X. Xing, Chem. Mater. 30, 6236 (2018).
- Sukhanov et al. (2018) A. Sukhanov, S. Singh, L. Caron, T. Hansen, A. Hoser, V. Kumar, H. Borrmann, A. Fitch, P. Devi, K. Manna, et al., Phys. Rev. B 97, 214402 (2018).