Model reduction for molecular diffusion in nanoporous media
Abstract
Porous materials are widely used for applications in gas storage and separation. The diffusive properties of a variety of gases in porous media can be modeled using molecular dynamics simulations that can be computationally demanding depending on the pore geometry, complexity and amount of gas adsorbed. We explore a dimensionality reduction approach for estimating the self-diffusion coefficient of gases in simple pores using Langevin dynamics, such that the three-dimensional (3D) atomistic interactions that determine the diffusion properties of realistic systems can be reduced to an effective one-dimensional (1D) diffusion problem along the pore axis. We demonstrate the approach by modeling the transport of nitrogen molecules in single-walled carbon nanotubes of different radii, showing that 1D Langevin models can be parametrized with a few single-particle 3D atomistic simulations. The reduced 1D model predicts accurate diffusion coefficients over a broad range of temperatures and gas densities. Our work paves the way for studying the diffusion process of more general porous materials as zeolites or metal-organics frameworks with effective models of reduced complexity.
I Introduction
The simulation of gas diffusion in nanoporous solid-state materials is important for applications such as gas filtering, separation and storage DPD ; gordon1999molecular ; daglar2018computational ; krishna2005darken ; COLON_2014 . The self-diffusion coefficient of a gas in a porous medium is an essential physical quantity that characterizes mass transfer and is a relevant parameter for designing industrial separation processes liu1995accurate , diffusion of gas mixtures krishna2005darken , and the selectivity of gas separation techniques koros2017materials ; daglar2018computational ; keil2000modeling ; mace2013role ; gu2018metal . The diffusive properties of gases in porous media is ultimately related to the short and long-range interaction potentials between gas particles and between gas molecules and the condensed-phase environment tsimpanogiannis2019self .
The growing interest in estimating the diffusive properties of target gases in porous materials reported in public databases COLON_2014 has stimulated the search for methods to accelerate large scale screening efforts based on fully-atomistic simulations, which in general are computationally demanding sokhan2004transport ; keil2000modeling ; MOFs_Diffusion_2020 . Acceleration strategies based on machine learning are promising because training sets with acceptable predictive power can be constructed with a smaller number of calculations than an exhaustive database search ML_TANG_2021 ; ML_ORHAN_2022 . An alternative acceleration strategy would be to develop generalizable physics-based models that are sufficiently accurate for ranking materials based on their transport properties, but at a much lower cost than atomistic simulations.
In this context, we study the dimensionality reduction capabilities of one-dimensional (1D) Langevin dynamics for modeling gas diffusion inside carbon nanotubes at different temperatures. The predictions of the reduced model are compared to the three-dimensional (3D) molecular dynamics simulations. For concreteness, we consider the transport of molecular nitrogen in single-walled carbon nanotubes (CNT) and obtain self-diffusion coefficients with 1D Langevin dynamics for different nanotube radii, temperatures and gas densities. We show that it is possible to construct effective 1D pore potentials and model parameters that can reproduce the diffusive 3D transport behavior over a broad range of conditions. The proposed parametrization scheme could be extended to other porous materials such as zeolites and metal-organic frameworks.
The rest of the article is organized as follows: Section II describes the theoretical methodology and the settings for the atomistic molecular dynamics simulations. In Sec. III we discuss the results obtained for the diffusion constant of nitrogen in carbon nanotubes, comparing the predictions of the reduced 1D Langevin model, 3D molecular dynamics simulations, and the Lifson-Jackson formula from Brownian motion theory. In Sec. IV, we suggest possible applications and generalization strategies.
II Methods
II.1 1D stochastic Langevin dynamics
The stochastic motion of Brownian particles can be described by a Langevin equation paquet2015molecular , which for a 1D system of particles with trajectories can be written as
| (1) |
where is the particle index, is momentum, is the total potential, and the position of the -th particle. The interaction of particle with a large ensemble of bath particles is effectively taken into account by introducing the momentum loss (dissipation) term proportional to the damping parameter and a random momentum kick given by the random process , which induces energy fluctuation. These terms together take into account the multiples collisions of the system (Brownian) particle with the reservoir DPD ; paquet2015molecular . The random momentum kick has zero bias, i.e., and its autocorrelation function is given by
| (2) |
where is the particle mass, is the Boltzmann constant, is temperature, is the Dirac delta function and is a Kronecker delta. In other words, momentum fluctuations are Markovian in time and proportional to the thermal energy .
We solve Eq. (1) numerically for a system of particles using the impulsive Langevin leap-flog algorithm DPD , which is a modification of the classical Verlet algorithm that involves an intermediate velocity correction at each time step of the form
| (3) |
where and are the velocity and acceleration of the -th particle, and is the time step of the simulation. For a free Brownian particle at thermal equilibrium, the damping coefficient can be obtained from the Einstein relation DPD
| (4) |
where is the free-particle diffusion coefficient. In this work, the damping parameter encodes the interaction of gas molecules with the carbon nanotube walls.
II.2 Diffusion from mean squared displacements
We calculate the self-diffusion coefficient using the mean squared displacement (MSD) method from the simulated particle trajectories. For a trajectory composed of cartesian vectors at times , the MSD can be calculated as MSD
| (5) |
which uses all available offsets of a given duration with the offset step. The advantage of this definition is that the number of such displacements is and therefore large for small , resulting in well-averaged MSD values. MSD is related to the self-diffusion coefficient by the expression arora2006air
| (6) |
where is the system dimensionality ( for 1D, for 3D). By solving Eq. (1) for all the particles in the system at fixed temperature and density, we calculate MSD from Eq. (5) and obtain from the slope of a linear fit plot of Eq. (6) using the least-squares method.
For short simulation times, particle transport is dominated by the initial condition and the absence of intermolecular interactions (ballistic regime). After equilibration is reached though multiple collisions, the linear scaling of MSD with time is established (diffusive regime). Several methods have been proposed to analyze trajectories with coexisting transport regimes 26 . In our work, the diffusive regime is established when a log-log plot MSD vs , averaged over particles and simulation replicas has unit slope.
II.3 Lifson-Jackson model for 1D diffusion
The Lifson-Jackson formula is an analytical expression, first derived in Ref.lifson1962self , for the diffusion coefficient of a periodic 1D potential in terms of the potential depth. The periodic nature of a pristine carbon nanotube potential along its axis allows us to use this theory directly at different temperatures. For a periodic potential with period , the Lifson-Jackson diffusion coefficient can be written as lifson1962self ; reimann2001giant ; berezhkovskii2019biased
| (7) |
where is the free-particle diffusion coefficient from Eq. (4). For a sinusoidal potential with depth and period , the integrals in the denominator can be solved analytically to give
| (8) |
where is a modified Bessel function of the first kind and . Equation (8) shows that for sinusoidal potentials, self-diffusion is determined by the ratio between the depth of the potential and the thermal energy, independent of the lattice period. reduces to the free-particle limit at high-temperatures, and asymptotically vanishes at low temperatures, as inferred from the asymptotic forms and .
II.4 Molecular nitrogen in carbon nanotubes
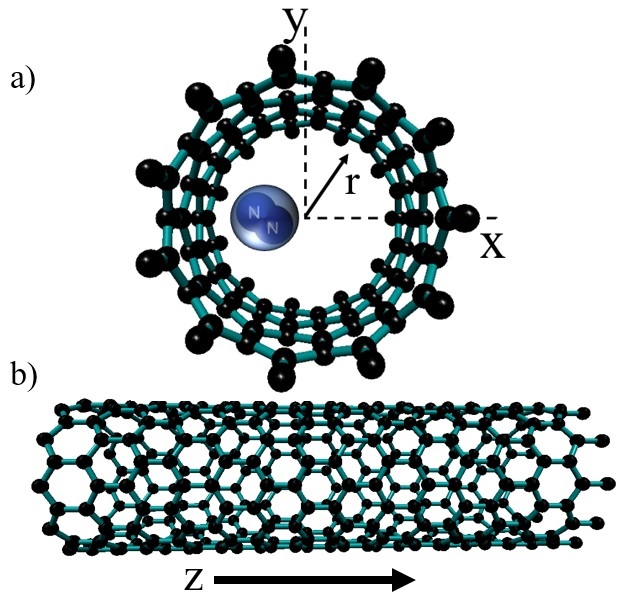
The self-diffusion of molecular nitrogen inside a carbon nanotube was computed over a broad range of temperatures in the range K, and a range of gas densities spanning from the single-molecule limit to pore saturation. We perform calculations using zig-zag carbon nanotubes (11,0) and (15,0), with radii 4.309 Å and 5.876 Å, respectively. The nanotube coordinates were obtained with a modeler software NTM , for a tube length of 426.3 Å. Figure 1 shows representative radial and axial views of the nanotubes used in this work. For MD and Langevin dynamics simulations, the thermal motion of carbon atoms in the nanotubes were ignored, which does not introduce significant errors in the evaluation of gas diffusion constants. We set periodic boundary conditions, random initial locations of the gas particles, and a thermalization time of 0.5 ns in all simulations.
We model the interaction between nitrogen molecules and between nitrogen and carbon atoms in the nanotube with a Lennard-Jones potential
| (9) |
where is the interparticle distance. The potential parameters for each particle pair in the problem are listed in Table 1.
| (Å) | 3.32 | 3.36 | 3.63 | 3.52 |
|---|---|---|---|---|
| 36.4 | 33.4 | 104.5 | 56.2 |
MD simulations are implemented in LAMMPS lammps . To compute 3D MSD trajectories, we adopt a non-vibrating diatomic molecule model for nitrogen, with three-dimensional rotational and translational motion inside the CNT. We use a time step fs in the canonical ensemble. Each replica corresponds to a total simulation time of 5 ns. Depending on the depth of the effective axial potential experienced by a molecule in the nanotube, at very low gas densities (single particle) there is a temperature in which nitrogen molecules behave as quasi-free Brownian particles, as seen from the linear scaling of the diffusion coefficient with temperature. In this regime, we assume that the Einstein relation in Eq. (4) holds and extract the effective damping parameter from a linear fit. For higher gas densities, nitrogen molecules are added inside the CNT with random locations and orientations. For MD simulations we define the filling ratio to quantify nitrogen density relative to the tabulated density of bulk liquid nitrogen at the simulation temperature.
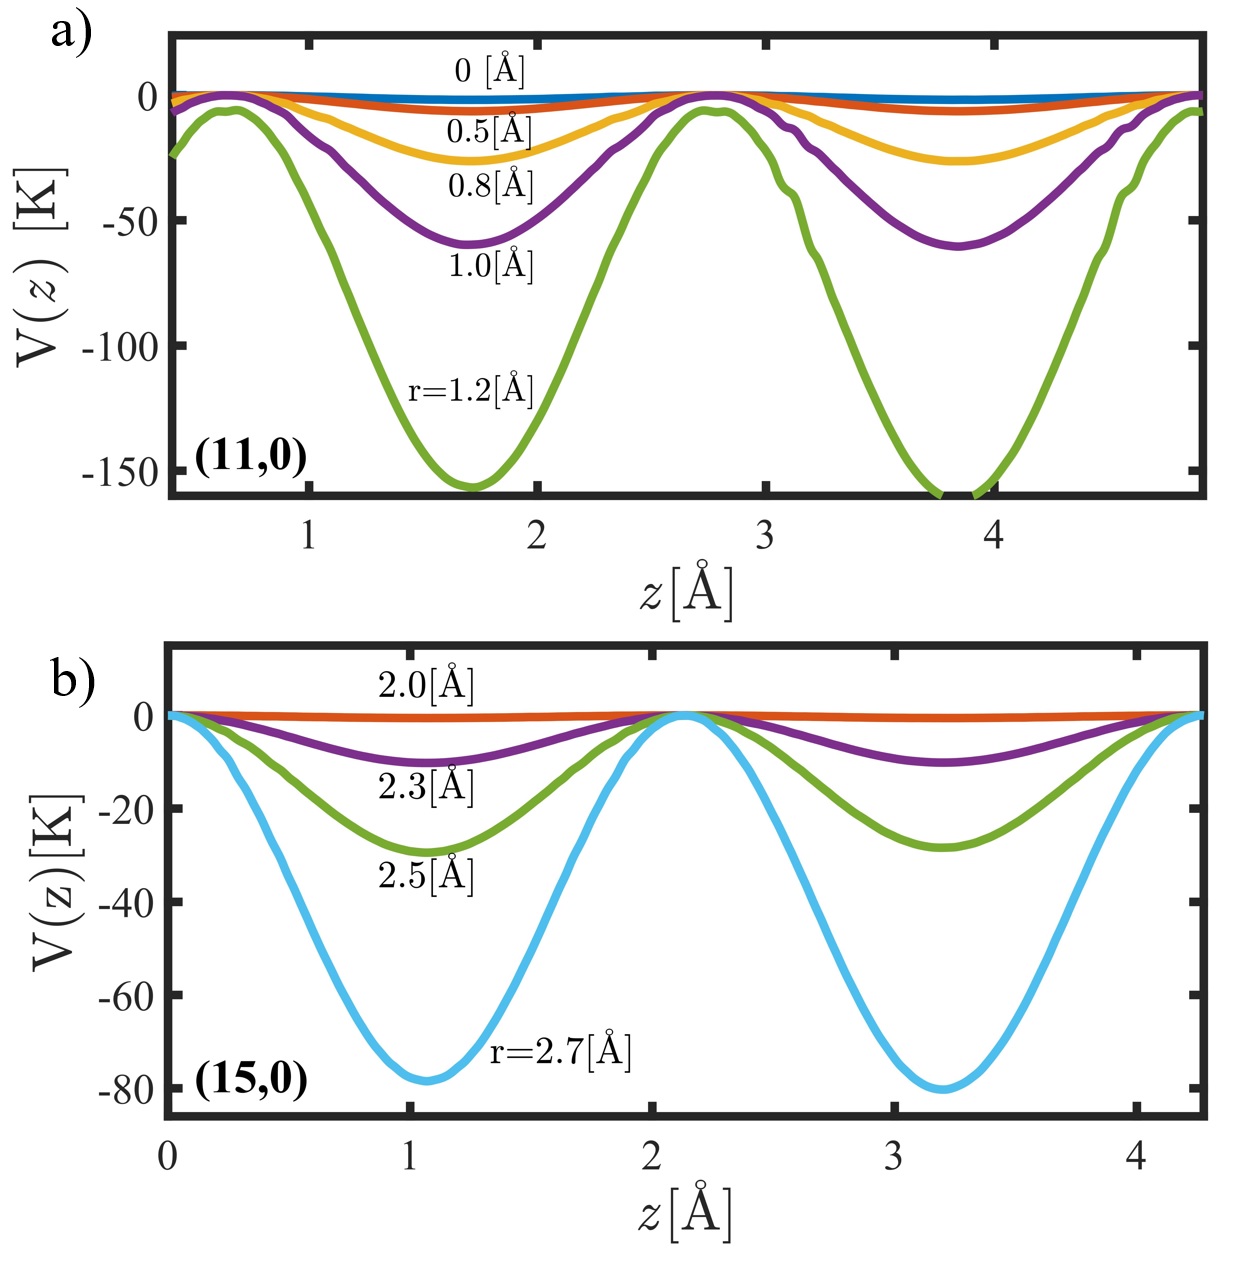
The stochastic 1D simulations were implemented in Matlab with the impulsive Langevin leap-flog algorithm DPD , as mentioned previously. As input for the simulation we constructed axial potentials that capture the interaction of nitrogen molecules with the CNT walls along the transport direction. In Figure 2 we show effective axial potentials constructed for nanotubes (11,0) and (15,0) at different radial distances from the nanotube center. The potentials are periodic with a lattice constant of about Å, which correlates with the equilibrium carbon-carbon distance in the nanotubes. At the center of the nanotubes, the depth of the axial potential becomes negligible, and is higher near the walls.
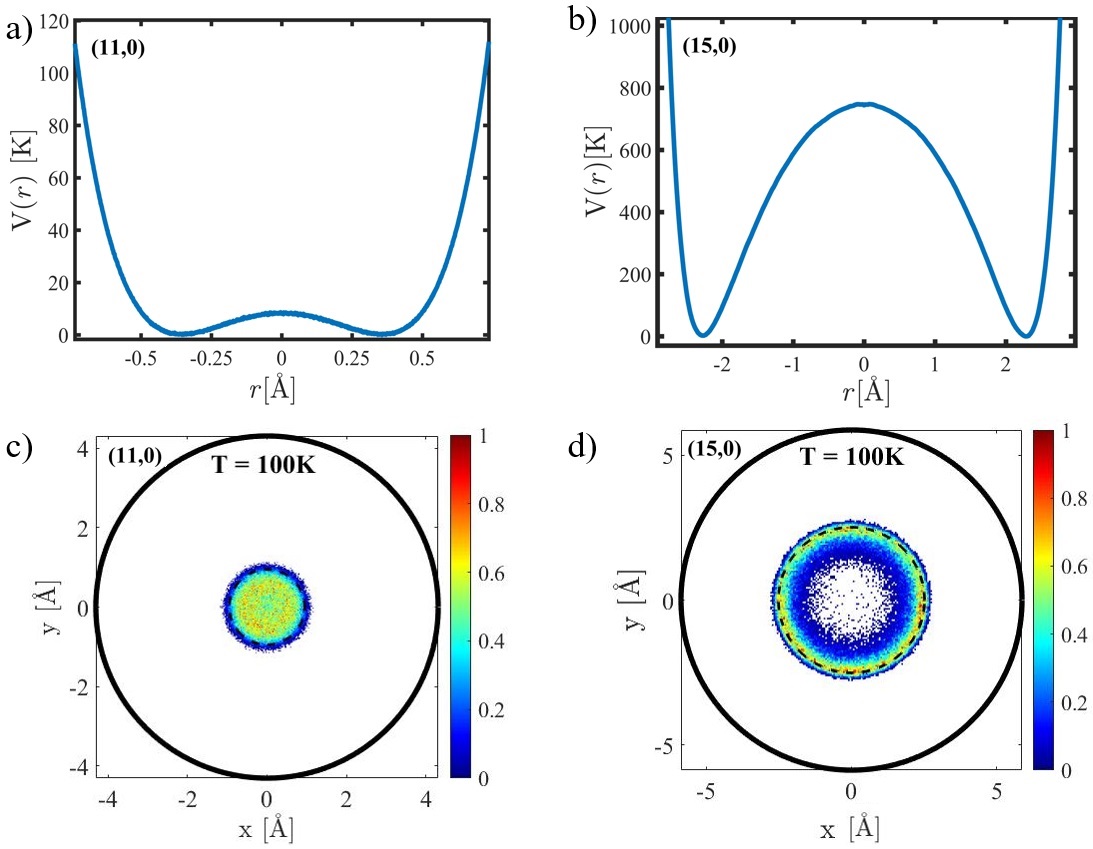
In Figure 3 we show representative radial potentials for the nanotubes (11,0) and (15,0). The potentials feature a repulsive wall near the nanotube radius and radial barrier at the center that separates two potential minima with azimuthal symmetry. The central barrier is about 10 K high for (11,0), and 700 K for (15,0). In Figs. 3c and 3d we show the histograms of the radial positions that nitrogen molecules explore at 100K, as obtained from 3D MD trajectories. While for (11,0), the nitrogen molecules tend to move near the center of the nanotube, for (15,0), the nitrogen molecules tend to move around the minimum of the radial potential, which has ring shape along the azimuthal coordinates. Practically no trajectories explore the nanotube center in this case.
For projecting the nitrogen molecule degrees of freedom to 1D axial motion, we replace the rotating diatomic nitrogen by a spherical mass at the position of the molecular center of mass, as illustrated in Fig. 1a. However, the Lennard-Jones parameters in Table 1 do take into account the orientational dependence of the interaction potential between two nitrogen molecules and between nitrogen diatomic and carbon atoms through a thermal averaging procedure described in the Supplementary Material (SM). The stochastic MSD trajectories were obtained with a damping parameter calibrated from a dilute nanotube MD simulation, as previously described. The 1D simulation time step is fs. The total simulation time is 6.5 ns. To define a 1D filling ratio, we assume the nanotube is saturated () when the number of nitrogen molecules in the simulation is equal to the ratio between the van der Waals diameter of molecular nitrogen and the length of the simulation box.
III RESULTS AND DISCUSSION
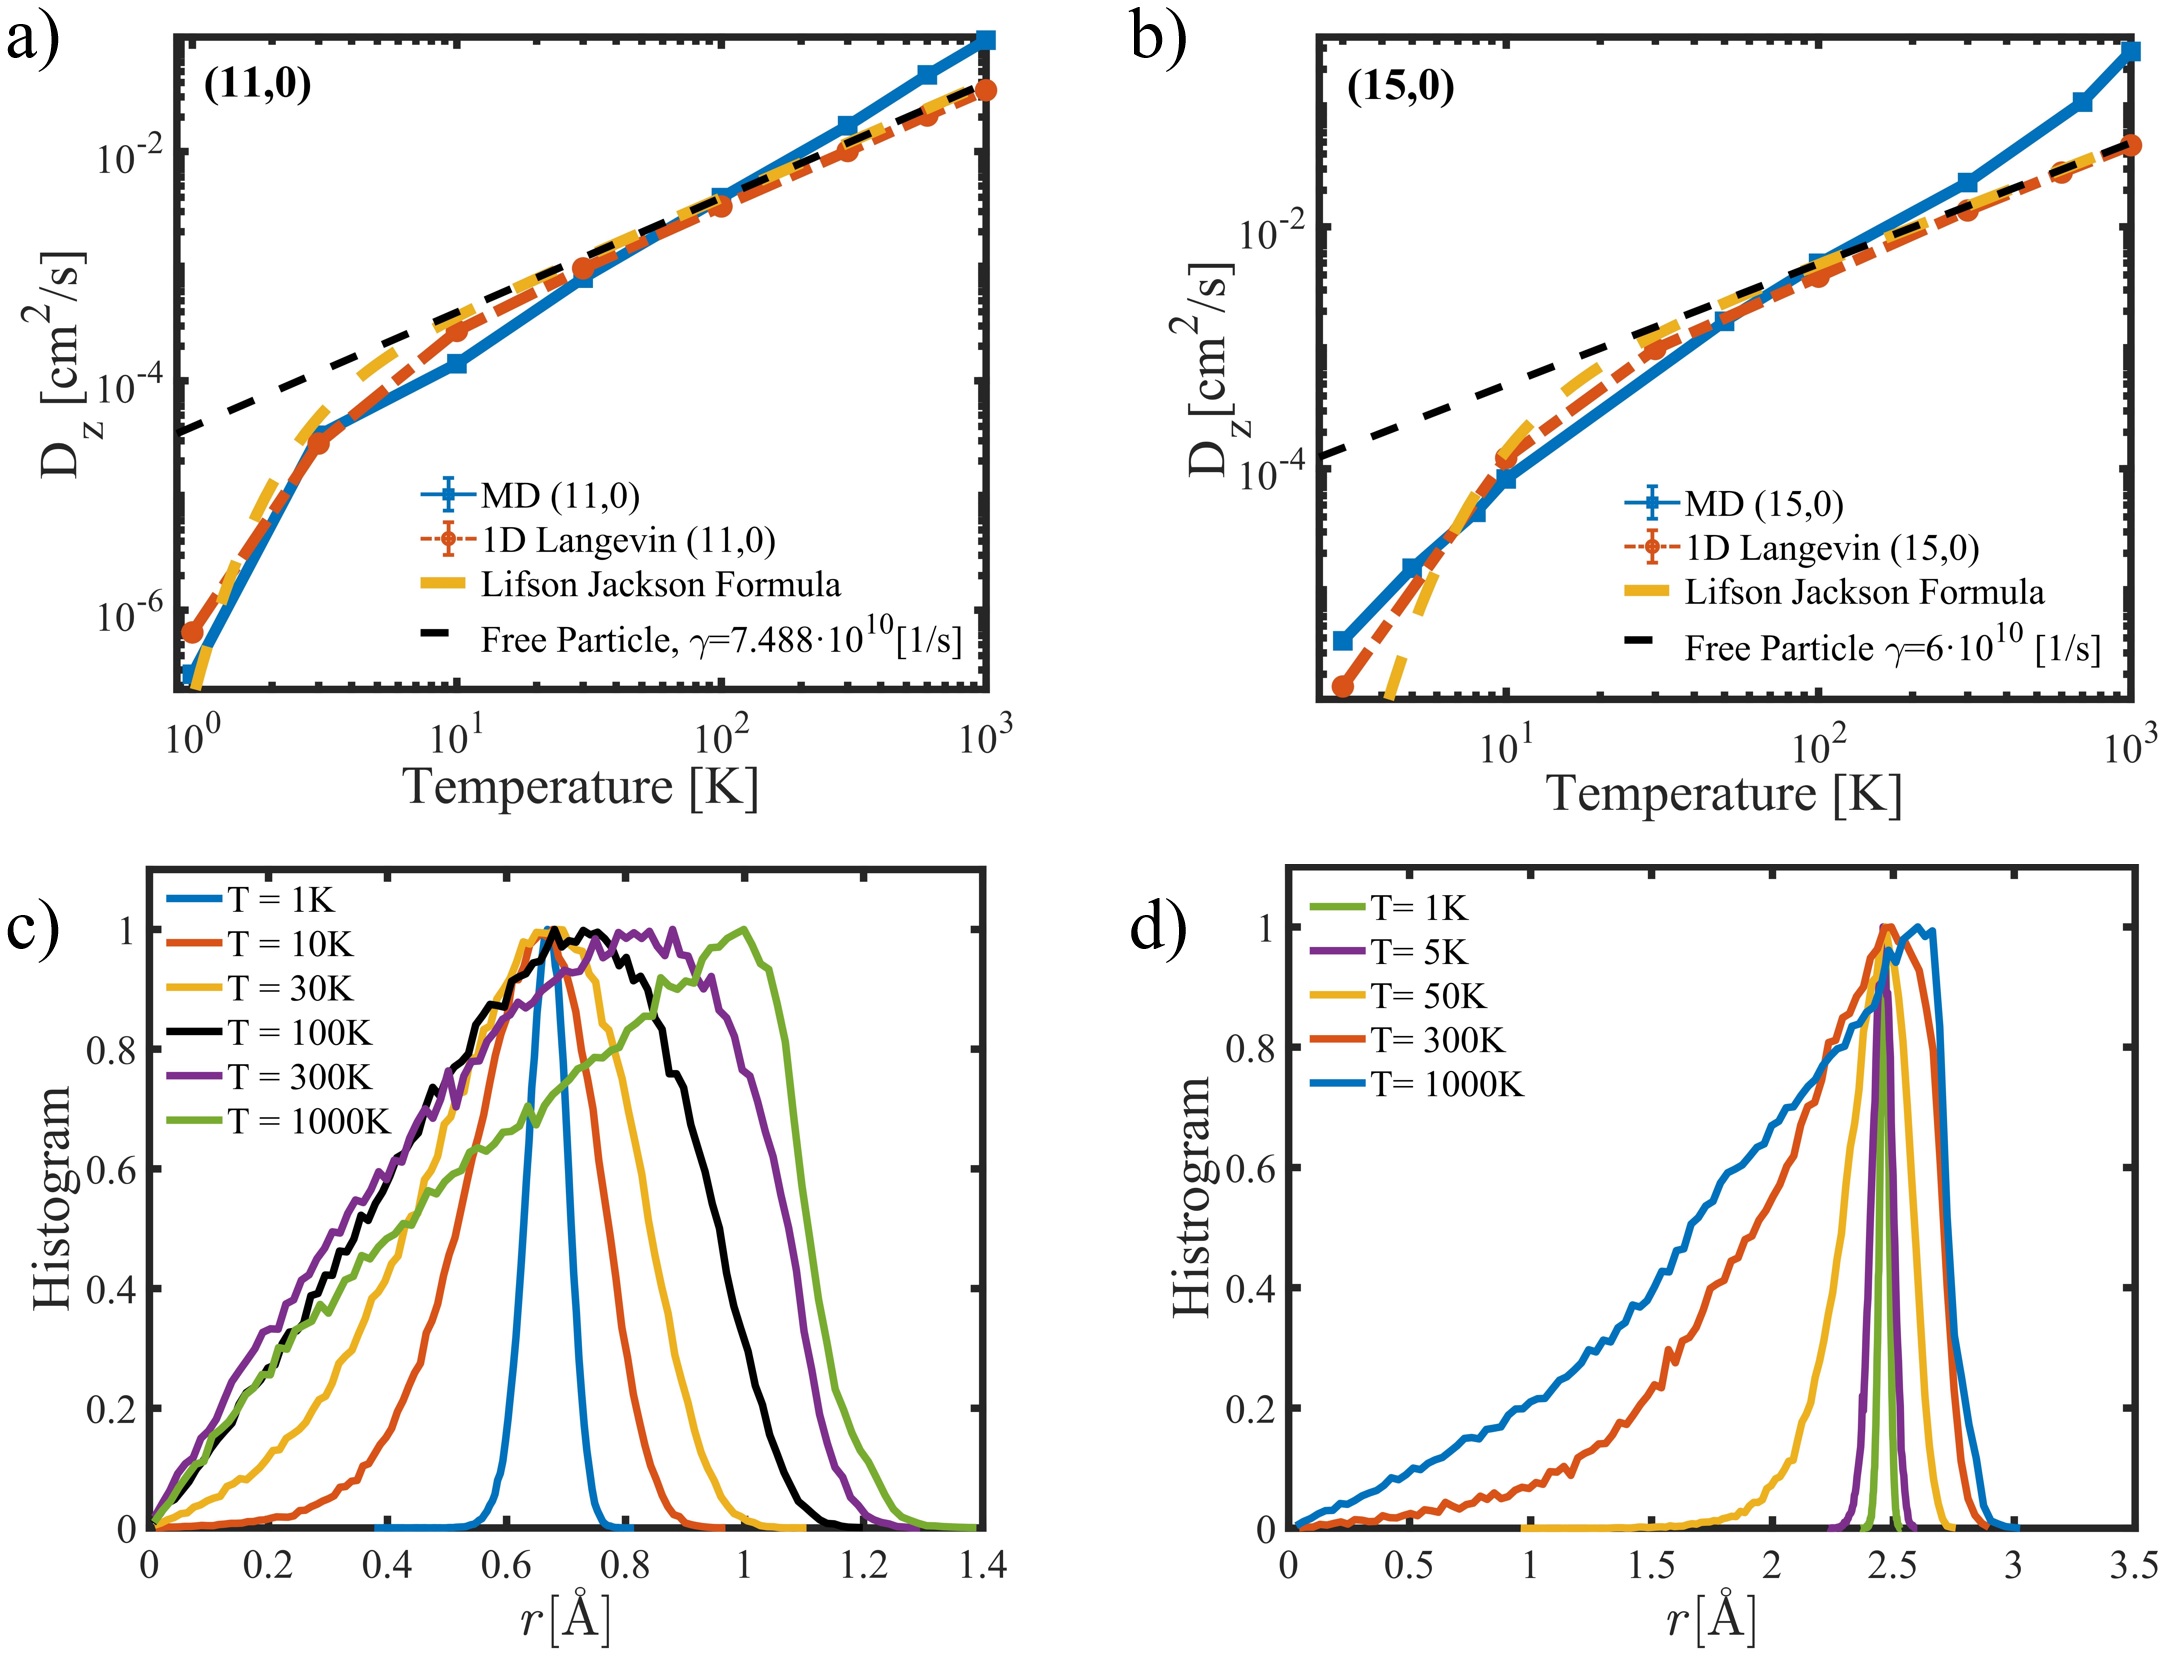
In Fig. 4 we show the self-diffusion coefficient for a single nitrogen molecule in carbon nanotubes (11,0) and (15,0), as a function of temperature. We compare the results obtained from 3D MD simulations, 1D Langevin simulations and the Lifson-Jackson formula. The latter is evaluated with the same axial potential used in the Langevin calculations. The damping parameter obtained via linear fit from the MD diffusion coefficient at 100 K was for (11,0), and for (15,0).
Below K there is essentially no diffusion in the nanotubes, because the thermal energy is lower than the corresponding axial potential depths (see Fig. 2), so particles become trapped in the axial potential. At higher temperatures, the MSD trajectory analysis gives a diffusive regime with a log-log slope of arora2006air , from which we obtain converged diffusion coefficients.
As the temperature increases, all methods capture a crossover between particle trapping and diffusion around K, beyond which the diffusion constant scales linearly with temperature, as expected from Eq. (4) for quasi-free Brownian motion. The self-diffusion coefficient for 1D langevin and the Lifson-Jackson formula coincide in the entire range of temperatures studied. However, while the orders of magnitude are the same, the 3D diffusion coefficients obtained with MD are consistently greater. The similarity in self-diffusion coefficients of the 1D Langevin and Lifson Jackson formulas can be explained by the fact that both methods use the same one-dimensional axial potential as input data. In addition, at high temperatures they must converge to the value of . The discrepancy between 3D and 1D results grows with temperature, as Fig.4b illustrates more clearly for the wider (15,0) nanotube.
To understand this discrepancy at high temperature, in Figs. 4c and 4d we show the histograms of the radial positions of the centers of mass explored by nitrogen molecules at different temperatures for the nanotubes (11,0) and (15,0), obtained from 3D MD trajectories. At low temperatures ( K), molecules are mostly trapped at the minima of their corresponding radial potentials. At higher temperatures ( K), particles have more energy to explore a larger fraction of the nanotube pore volume, broadening the radial distribution and displacing the most-probable radius towards the nanotube walls. This effective increase in the configuration space involved in axial transport cannot be captured by the effective 1D Langevin model, without redefining . However, the agreement is excellent between the dilute 1D Langevin with a single value of and the 3D MD simulations, over a broad range of temperatures.
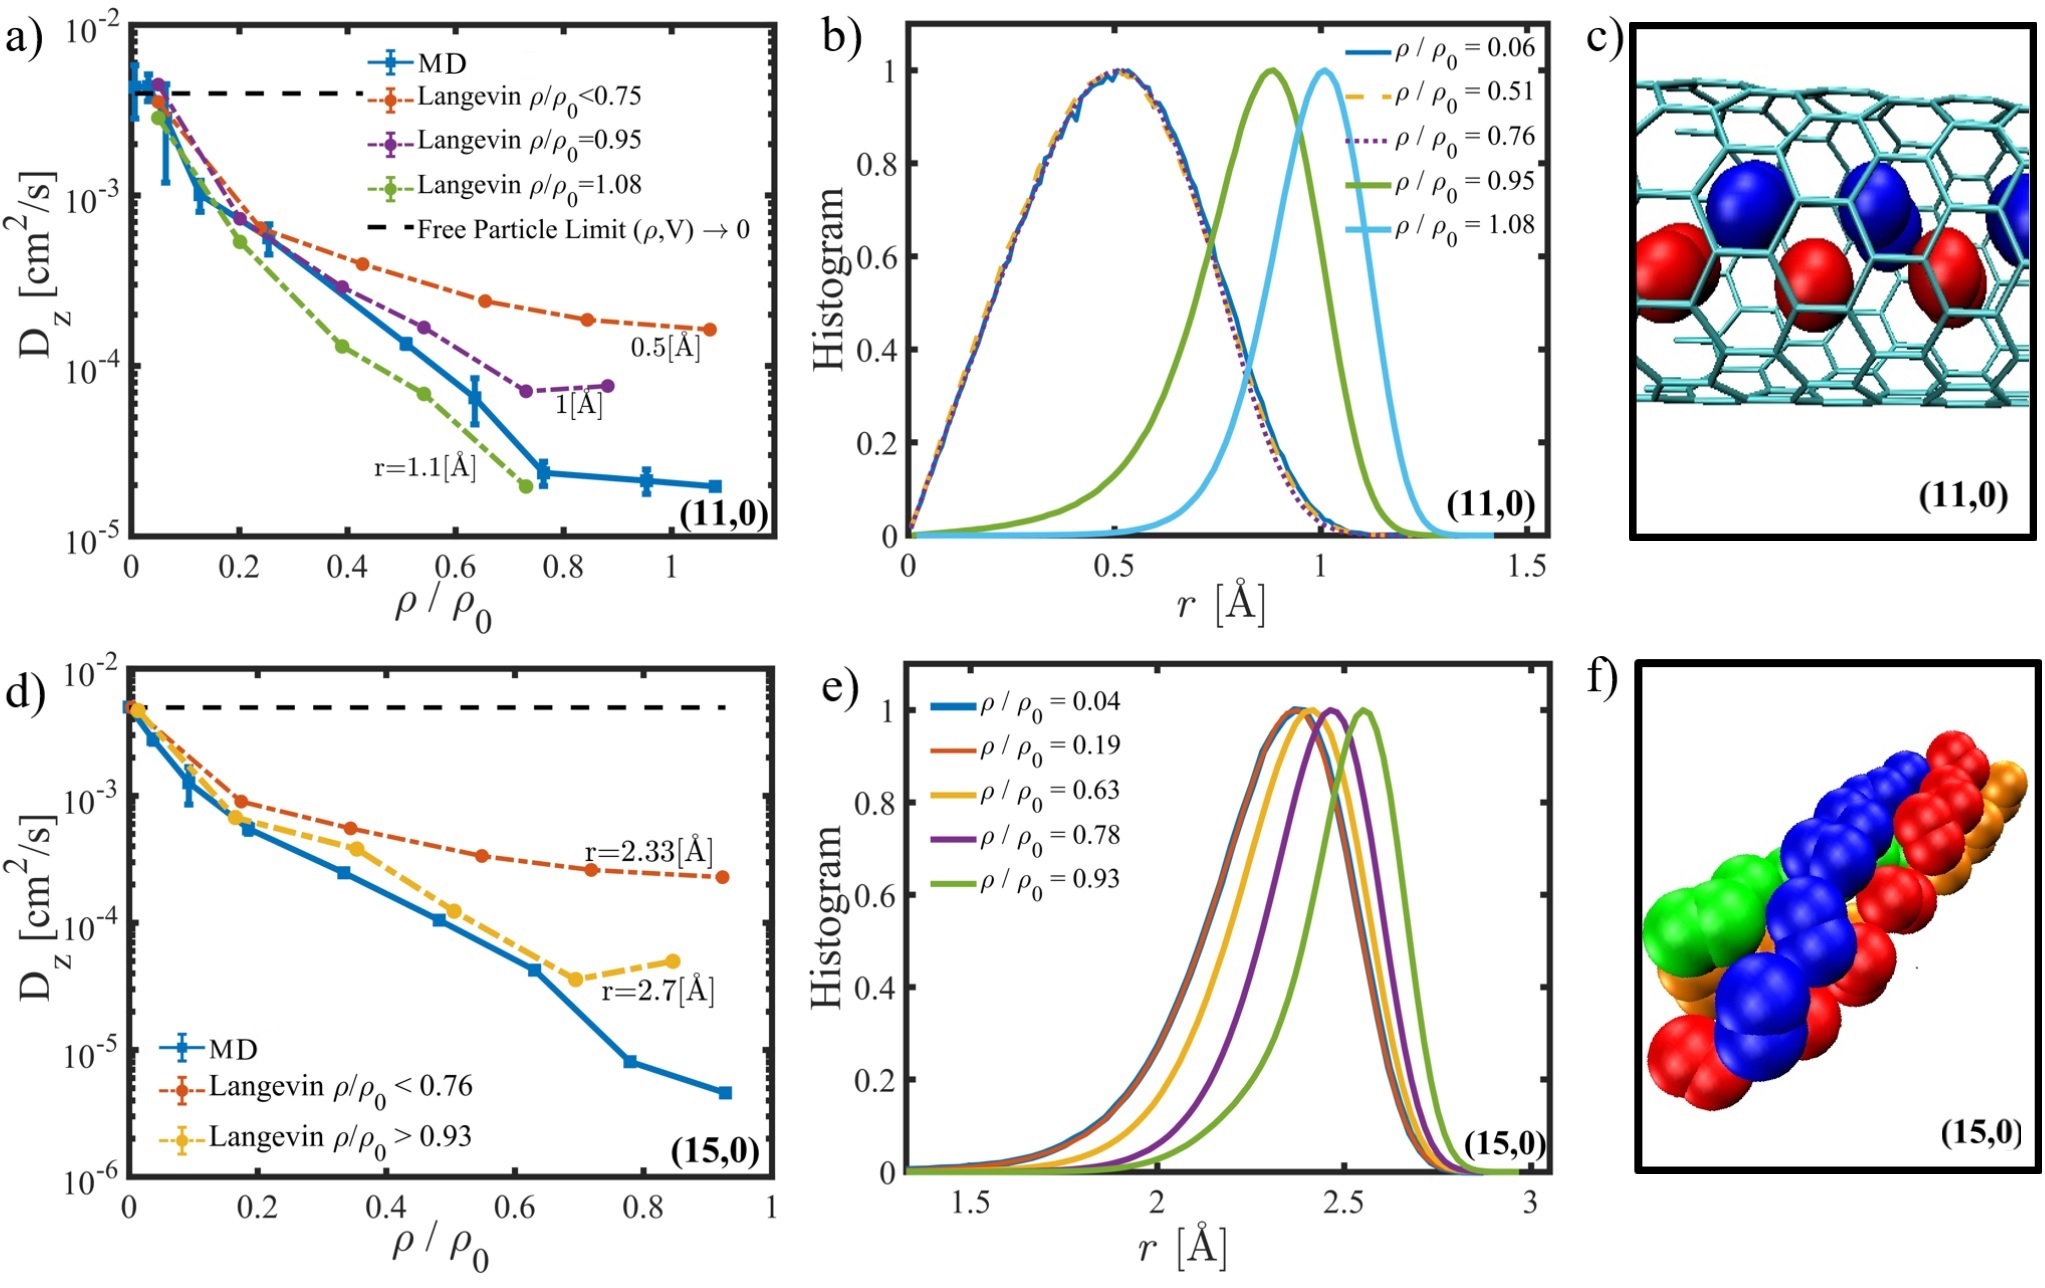
In Figs. 5a and 5b we plot the nitrogen diffusion coefficient as a function of the gas filling ratio for (11,0) and (15,0) nanotubes, respectively. We compare the results obtained from 3D MD and 1D Langevin simulations at 100 K. For the 1D calculations, we approximately capture the density-dependence of the effective axial molecule-nanotube axial potential by evaluating the nitrogen-nanotube axial potential at the peak of the radial distribution of MD trajectories shown in Fig. 5b for (11,0) and Fig. 5e for (15,0). For increasing molecular densities, close to saturation (). Radial density of trajectories peak closer to the pore walls. In general, both 3D and 1D simulations give diffusion coefficients that decrease monotonically with the pore occupation for the two nanotube radii considered.
Depending on the radial position used to estimate the depth of the effective axial potential , the Langevin calculations can approximate the atomistic 3D results reasonably well over the entire range of densities up to the saturation regime (). For axial potential depths below 30 K ( Å), Fig. 5a shows that the agreement between the 1D and 3D curves is excellent up to for (11,0) nanotubes. At these low gas concentrations, nitrogen molecules move preferably near the center of the nanotube (see peak at Å in Fig. 5b).
At higher densities (), there is a sudden shift in radial density towards the walls of the (11,0) nanotube. This shift is due to emergence of stacked configurations between nitrogen molecules, as shown in Fig. 5c. At higher densities, the Langevin simulations consistently overestimate the diffusion coefficient relative to atomistic MD, although both 1D and 3D continue to have similar qualitative behavior, reaching asymptotic saturation for . By evaluating the axial potential closer to the peak of the radial trajectory distribution at the corresponding density (see Fig. 5b), the Langevin results can be made to agree with the MD simulations over a wider range of densities with the same low-density value of .
For the wider (15,0) nanotube, we find similar trends when comparing 1D and 3D diffusion coefficients in Fig. 5d. Again the agreement between MD and Langevin simulations can be improved by sampling the axial potential closer to the peak of the radial trajectory distribution at a given gas density (Fig. 5e). The main qualitative difference between (11,0) and (15,0) nanotubes occurs near saturation, as the larger pore volume of (15,0) allows for more intricate stacking configurations of the nitrogen molecules, which are more difficult to capture with 1D effective models than the small-pore saturation behavior of (11,0), for example. Fig. 5f shows a representative quadruple “helix” configuration that nitrogen molecules adopt at high filling ratios in the (15,0) nanotube (). These helical structures have been reported in carbon nanotubes for nitrogen arora2006air and water helicalwater .
IV Conclusions
In this work we developed an effective one-dimensional Langevin equation model for the diffusive transport for dilute and dense molecular gases inside carbon nanotubes, as a function of tube radius and temperature. By parametrizing the Langevin model using atomistic molecular dynamics simulations over a limited range of densities and temperatures, we find that the reduced stochastic approach can accurately extrapolate the behavior of the diffusion coefficient over a broader range of temperatures and nanotube filling ratios. For higher densities closer to saturation, we show that the effective potential that drives the Langevin dynamics along the nanotube axis can be adjusted to account for the interaction between gas particles over transverse degrees of freedom, and propose criteria to obtain effective Langevin potentials and damping parameters using nitrogen transport in carbon nanotubes as an example. We envision future extensions of the proposed dimensionality reduction methodology to study diffusive transport of gases and liquids in complex nanoporous media such as metal-organic frameworks, zeolites and structured electrodes, which could facilitate the large-scale screening of materials for applications in energy, catalysis, and gas separation.
V acknowledgements
RAF is supported by DICYT-USACH grant POSTDOC USA1956 _ DICYT and ANID Fondecyt Postdoctoral 3220857. FH and GG are supported by ANID through Fondecyt Regular 1181743 and Millennium Science Initiative Program ICN17-012. YJC thanks the University of Notre Dame for financial support through start-up funds.
References
- [1] N Goga, AJ Rzepiela, AH De Vries, SJ Marrink, and HJC Berendsen. Efficient algorithms for langevin and dpd dynamics. Journal of chemical theory and computation, 8(10):3637–3649, 2012.
- [2] Peter A Gordon and Roland B Saeger. Molecular modeling of adsorptive energy storage: Hydrogen storage in single-walled carbon nanotubes. Industrial & engineering chemistry research, 38(12):4647–4655, 1999.
- [3] Hilal Daglar and Seda Keskin. Computational screening of metal–organic frameworks for membrane-based co2/n2/h2o separations: best materials for flue gas separation. The Journal of Physical Chemistry C, 122(30):17347–17357, 2018.
- [4] R Krishna and JM Van Baten. The darken relation for multicomponent diffusion in liquid mixtures of linear alkanes: An investigation using molecular dynamics (md) simulations. Industrial & engineering chemistry research, 44(17):6939–6947, 2005.
- [5] Yamil J. Colón and Randall Q. Snurr. High-throughput computational screening of metal–organic frameworks. Chem. Soc. Rev., 43:5735–5749, 2014.
- [6] Hongqin Liu and Eugénia A Macedo. Accurate correlations for the self-diffusion coefficients of co2, ch4, c2h4, h2o, and d2o over wide ranges of temperature and pressure. The Journal of Supercritical Fluids, 8(4):310–317, 1995.
- [7] William J Koros and Chen Zhang. Materials for next-generation molecularly selective synthetic membranes. Nature materials, 16(3):289–297, 2017.
- [8] Frerich J Keil, Rajamani Krishna, and Marc-Olivier Coppens. Modeling of diffusion in zeolites. Reviews in Chemical Engineering, 16(2):71–197, 2000.
- [9] Amber Mace, Niklas Hedin, and Aatto Laaksonen. Role of ion mobility in molecular sieving of co2 over n2 with zeolite naka. The Journal of Physical Chemistry C, 117(46):24259–24267, 2013.
- [10] Zonglin Gu, Wei Song, Zaixing Yang, and Ruhong Zhou. Metal–organic framework as an efficient filter for the removal of heavy metal cations in water. Physical Chemistry Chemical Physics, 20(48):30384–30391, 2018.
- [11] Ioannis N Tsimpanogiannis, Othonas A Moultos, Luís FM Franco, Marcelle B de M Spera, Máté Erdős, and Ioannis G Economou. Self-diffusion coefficient of bulk and confined water: a critical review of classical molecular simulation studies. Molecular Simulation, 45(4-5):425–453, 2019.
- [12] VP Sokhan, D Nicholson, and N Quirke. Transport properties of nitrogen in single walled carbon nanotubes. The Journal of chemical physics, 120(8):3855–3863, 2004.
- [13] Yohanes Pramudya, Satyanarayana Bonakala, Dmytro Antypov, Prashant M. Bhatt, Aleksander Shkurenko, Mohamed Eddaoudi, Matthew J. Rosseinsky, and Matthew S. Dyer. High-throughput screening of metal–organic frameworks for kinetic separation of propane and propene. Phys. Chem. Chem. Phys., 22:23073–23082, 2020.
- [14] Hongjian Tang, Qisong Xu, Mao Wang, and Jianwen Jiang. Rapid screening of metal–organic frameworks for propane/propylene separation by synergizing molecular simulation and machine learning. ACS Applied Materials & Interfaces, 13(45):53454–53467, 2021. PMID: 34665615.
- [15] Ibrahim B. Orhan, Hilal Daglar, Seda Keskin, Tu C. Le, and Ravichandar Babarao. Prediction of o2/n2 selectivity in metal–organic frameworks via high-throughput computational screening and machine learning. ACS Applied Materials & Interfaces, 14(1):736–749, 2022. PMID: 34928569.
- [16] Eric Paquet and Herna L Viktor. Molecular dynamics, monte carlo simulations, and langevin dynamics: a computational review. BioMed research international, 2015, 2015.
- [17] Xavier Michalet. Mean square displacement analysis of single-particle trajectories with localization error: Brownian motion in an isotropic medium. Physical Review E, 82(4):041914, 2010.
- [18] Gaurav Arora and Stanley I Sandler. Air separation by single wall carbon nanotubes: Mass transport and kinetic selectivity. The Journal of chemical physics, 124(8):084702, 2006.
- [19] Hong Qian, Michael P Sheetz, and Elliot L Elson. Single particle tracking. analysis of diffusion and flow in two-dimensional systems. Biophysical journal, 60(4):910–921, 1991.
- [20] Shneior Lifson and Julius L Jackson. On the self-diffusion of ions in a polyelectrolyte solution. The Journal of Chemical Physics, 36(9):2410–2414, 1962.
- [21] Peter Reimann, Christian Van den Broeck, H Linke, Peter Hänggi, JM Rubi, and Agustín Pérez-Madrid. Giant acceleration of free diffusion by use of tilted periodic potentials. Physical review letters, 87(1):010602, 2001.
- [22] Alexander M Berezhkovskii and Leonardo Dagdug. Biased diffusion in periodic potentials: Three types of force dependence of effective diffusivity and generalized lifson-jackson formula. The Journal of Chemical Physics, 151(13):131102, 2019.
- [23] Nanotube-Modeler. Jcrystalsoft, 2004–2005, 2004-2005.
- [24] Steve Plimpton. Fast parallel algorithms for short-range molecular dynamics. Journal of computational physics, 117(1):1–19, 1995.
- [25] William Humphrey, Andrew Dalke, and Klaus Schulten. VMD – Visual Molecular Dynamics. Journal of Molecular Graphics, 14:33–38, 1996.
- [26] William H Noon, Kevin D Ausman, Richard E Smalley, and Jianpeng Ma. Helical ice-sheets inside carbon nanotubes in the physiological condition. Chemical Physics Letters, 355(5-6):445–448, 2002.
Appendix A Effective Potential
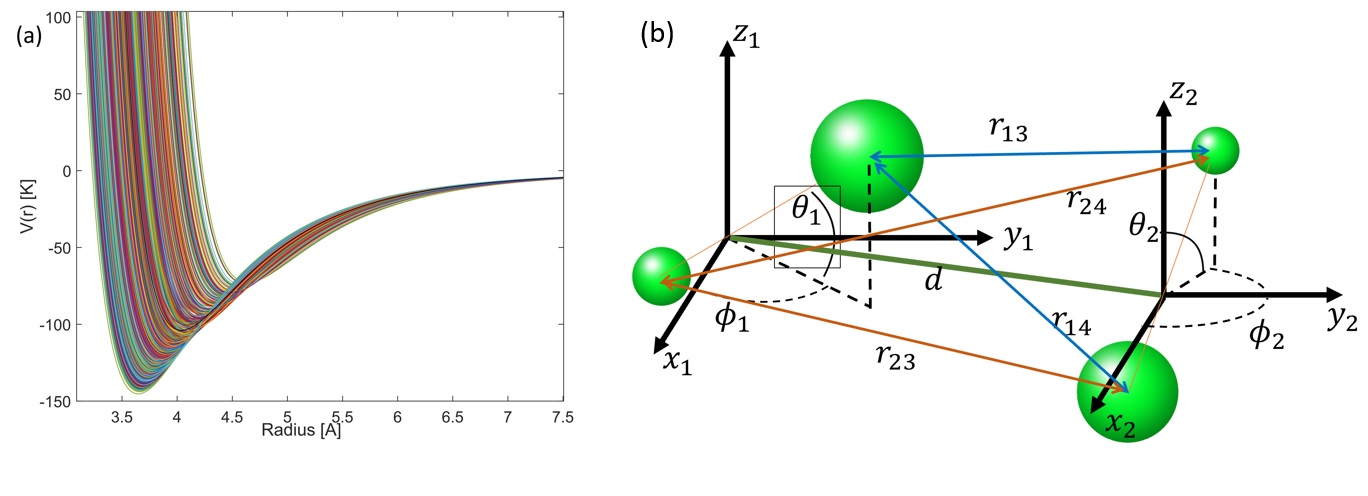
We want to find the effective potential between the diatomic molecules of and . If we simulate a large set of potentials of considering all possible configurations or orientations with equal probability, we obtain a wide range of potential values, as is shown in Figure6a. Linearly adding the interactions between each pair of molecules () for random orientations of each molecule (6b) and then averaging with a Boltzman weight, it is possible to find an effective total potential at a certain temperature.
| (10) |
This effect is easily explained if we consider the effect of the spatial orientations of the molecules. At low temperatures, the possible spatial orientations experienced by the molecule are ”limited”. They are arranged in such a way as to minimize energy. The opposite is the case at high temperatures that experience almost equally all possible spatial orientations, including (for example) a system of two interacting molecules arranged collinearly in space (system where energy is maximized).
Replicating the previous calculation, the interaction potential between can be determined, we can calculate the potential as a function of the radius of the interior of the nanotube.
Finally, by finding the minima of the potentials and their intersection with zero, we can determine their potential analog of Lennard Jones, the parameters obtained are found in Table. 1.