Effect of different splitting criteria on the performance of speech emotion recognition
Abstract
Traditional speech emotion recognition (SER) evaluations have been performed merely on a speaker-independent condition; some of them even did not evaluate their result on this condition. This paper highlights the importance of splitting training and test data for SER by script, known as sentence-open or text-independent criteria. The results show that employing sentence-open criteria degraded the performance of SER. This finding implies the difficulties of recognizing emotion from speech in different linguistic information embedded in acoustic information. Surprisingly, text-independent criteria consistently performed worse than speaker+text-independent criteria. The full order of difficulties for splitting criteria on SER performances from the most difficult to the easiest is text-independent, speaker+text-independent, speaker-independent, and speaker+text-dependent. The gap between speaker+text-independent and text-independent was smaller than other criteria, strengthening the difficulties of recognizing emotion from speech in different sentences.
Index Terms:
Speech emotion recognition, data partition, text-independent, speaker-independent, splitting criteriaI Introduction
Speech emotion recognition (SER) is one topic of interest in automatic speech recognition and understanding. In contrast to automatic speech recognition (ASR) which attempts to obtain linguistic information from speech, SER attempts to obtain non-linguistic information from speech. In more concrete, SER aims to infer the affective state of the speaker from solely speech data.
SER can be designed to recognize discrete emotion, continuous emotion, or both emotion models. Recent research suggested that emotion is ordinal by nature [1], which is closer to a categorical than the continuous model. In the categorical model, several emotion categories exist, from the simplest two categories with positive and negative emotions to 27 categories [2]. The choice of emotion model in SER depends on the availability of the labels in the dataset.
Data-driven methods, in which most SER systems employ this kind of approach, rely on the configuration or selection of the data to build the model. In SER, it is common to split the data by evaluating different speakers for training and test partitions. This approach, known as speaker-independent criteria, is a gold standard to build SER model that minimizes speaker variability in the training phase.
Recent research in SER, particularly by fusing acoustic and linguistic information, has found that different splitting criteria in splitting data for training will result in different performances [3]. In the fusion of acoustic and linguistic information, it is sound that the model needs to be trained in different scripts, known as sentence-open or text-independent. This strategy was intended to avoid the effect of having the same linguistic information for predicting emotion under the same sentences for both training and test partitions. Since linguistic information is extracted via text or script, this splitting condition is necessary to evaluate such discrepancies of using different features or types of information. Using merely acoustic features for SER, one may argue that this evaluation is unnecessary since no linguistic features are involved in building the SER model.
Fujisaki in 2002 proposed a scheme in which various types of information are manifested in the segmental and suprasegmental features of speech [4]. One of the types of information includes emotion. Referencing this argument that emotional information is manifested directly in speech without a need to convert speech into text, there is a possibility that different sentences will yield different SER performances under the same acoustic-only system. The current research on SER showed no evaluation of the differences of splitting criteria, particularly comparing data with and without linguistic information.
The contribution of this paper is an evaluation of the effect of splitting criteria into the training data on SER performance. As argued previously, linguistic information is embedded in acoustic features; hence, evaluating text-independent criteria, i.e., different sentences for training and test, is necessary to observe such effects. We evaluated four splitting criteria: speaker-dependent (including text-dependent data), speaker-independent, text-independent, and speaker+text-independent criteria, and traced their SER performances. We experimented with these criteria in three different experiments. The results of three different experiments show a consistent pattern of difficulties for four different splitting criteria. Text-independent criteria obtained the worst result followed by speaker+text-independent, speaker-independent, and speaker-dependent criteria.
II RELATED WORK
Research on the evaluation of the effect of data selection on speech processing is not new. Different data for training will produce different results on the same algorithm. A model generalization is a challenging task to minimize the variance among different data inputs for the same model.
In [5], the authors evaluated the effect of training data selection for speech recognition of emotional speech. Emotional speech showed lower error rates than neutral speech. Using their proposed selection criteria based on the entropy of diphones, they improved the error rate of speech recognition by transferring the model from emotional speech to non-emotional speech data.
The authors of [3] pointed to the different results of splitting data by random folds, speaker folds, and script folds on the speech emotion recognition by fusing acoustic and linguistic information [Fig. 2]. The results suggested that splitting by both speakers and scripts is more difficult than splitting by random folds only or splitting by speaker only. No information is available on comparing the difficulties of splitting by both speaker and script to splitting by script only.
The author of [6] evaluated Japanese Twitter-based emotional speech (JTES) dataset with speaker-open and sentence-closed conditions. The author achieved an accuracy of 81.44 % by utilizing a common normalization. Using two other corpora as training data and JTES as test data resulted in a degraded score to 80.66%, highlighting the difficulty of cross-corpus evaluation [7]. On the same JTES dataset but different criteria, speaker-open and sentence-open, the authors of [8] achieved an accuracy of 73.4 % by utilizing multi-stream attention-based bidirectional LSTM (BLSTM) with feature segmentation. This result is the closest machine performance to human performance on the JTES dataset, in which human evaluators scored 75.5% from acoustic subjective evaluation [9]. However, again, there is no evaluation comparing the effect of splitting by speakers (text-independent) and other criteria.
This research fills the gap in the existing research on evaluating SER with different splitting criteria. We evaluated speaker-independent (including text-independent), speaker-dependent, text-independent, and speaker+text-independent data. This paper denotes an insight to add information missing in the previous papers to gain new insight on the effect of splitting data based on the different criteria on SER performance.
III METHODS
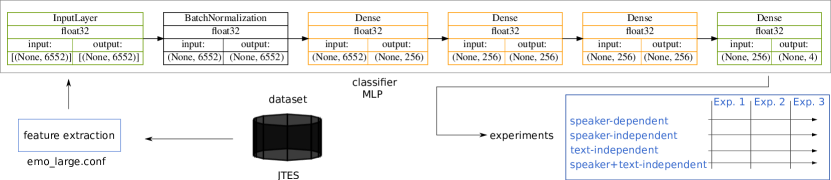
Fig. 1 shows the flow diagram of this research. Each component on that diagram is explained below.
III-A DATASET
This paper makes use of the phonetically and prosodically balanced Japanese Twitter-based Emotional Speech corpus (JTES) [10]. The main reason to choose this emotional speech dataset is due to the richness of sentences (200 sentences: 50 sentences for each emotion) and speakers (100 speakers: 50 male and 50 female), which can be evaluated with different criteria and conditions. Japanese speech emotion recognition also lacks exploration compared to English, Chinese, and European languages.
The JTES dataset consists of 20000 utterances from four emotion categories: joy, anger, sadness, and neutral. For each emotion, there are 500 raw sentences collected from Twitter data. The Twitter text data are modified to reflect Japanese culture when they are spoken in the recordings. For instance, sentences that end with nouns were removed due to emotional independence. The labeling of the emotion categories was performed by matching emotion-related words. Selection criteria based on entropy reduce the number into 50 sentences for each emotion category.
All data in the JTES dataset were involved in the experiments. However, due to the naturalness of this research’s aims, each splitting criteria resulted in a different number of data for each experiment. For instance, splitting by speakers and by sentences will allocate 19600 samples for training, and the rest 400 samples for test. However, splitting by both speakers and sentences only allocates 14400 samples for training due to overlap between both speaker and text. To avoid the effect of different sizes of training data, we performed an evaluation on the same amount of data.
III-B Feature Extraction
The first step to obtaining input data for the SER system from the raw dataset
is by extracting features of speech. For this purpose, we utilized opensmile
feature extraction tool to extract a set of acoustic features that represent
emotion information in speech. The version of opensmile used in this experiment
is 3.0. The feature set is ’emo_large’ with default configuration
emo_large.conf in the config/misc/ directory.
For this emo_large feature set, we extracted only statistical functions per utterance. The size was a 6552-dimensional feature from 56 low-level descriptors with their deltas and deltas-deltas (total 168 features) multiplied by 39 statistics. For the feature data, first, we extracted each audio file (.wav) into corresponding .csv files. Then we extracted related rows in .csv files (rows 6559 to end) and saved them in the form of Numpy arrays (.npy files). The first 6558 rows only consist of header names of the corresponding features, which are not used in a classification process.
| Feat. number | LLD |
|---|---|
| 1 | Log energy |
| 2-14 | MFCC (0-12) |
| 15-40 | Melspec (0-25) |
| 41 | Zero Crossing Rate (ZCR) |
| 42 | Voice probability |
| 44-44 | , env |
| 45 | Spectral energy: 0-250 Hz |
| 46 | Spectral energy: 0-250 Hz |
| 47 | Spectral energy: 0-650 Hz |
| 48 | Spectral energy: 1000-4000 Hz |
| 49-52 | Spectral RollOff (25%, 50%, 75%, 90%) |
| 53-54 | Spectral Flux, Spectral Centroid |
| 55-56 | Spectral MaxPos, Spectral MinPos |
| 57-168 |
Table I shows detail of the acoustic features in emo_large setup. The top rows show fifty-six LLDs. Adding this 56 LLD with their deltas () and deltas-deltas () sums up 168 features. For each LLD, 39 statistics were computed, resulting in 6652 features in total. Aside from emotion recognition, this feature set is reported to be effective for classifying dogs’ barking [11].
III-C Classifiers
We evaluated multi-layer perceptron (MLP), also known as fully-connected or dense network, for the classifier of the SER system. The previous research on speech emotion recognition has shown the effectiveness of these fully-connected (FC) or dense networks to overcome the SER problem [12]. The structure of FC networks follow the previous research on the different layers and dataset [13]. Three dense layers were stacked, followed by a four-unit dense layer as the final layer.
Table II shows the detail of hyperparameters employed in the MLP networks. The choice of the values is based on some references [14, 13]. The same architecture was employed to evaluate four different conditions in three experiments.
| Parameter | Value |
|---|---|
| Networks/layers | FC |
| Layer activation | ReLU |
| Units | (256, 256, 256) |
| Optimizer | Adam |
| Learning rate | 0.001 |
| Epoch | 25 |
| Batch size | 1024 |
| Validation split | 20% |
| Output layer (units) | FC (4) |
| Output activation | Softmax |
III-D Experiments
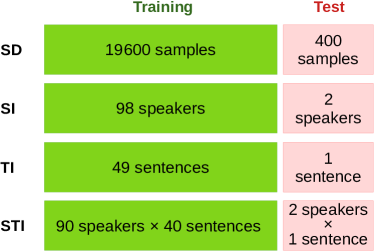
Since the goal of this research is to evaluate the performance of SER under different training criteria, we split our experiment into four criteria, namely speaker-dependent (SD), speaker-independent (SI), text-independent (TI), and speaker+text-independent (STI). The splitting criteria were designed to match the number of STI the test partition, i.e., 400 samples, following the previous research [8, 14]. Fig. 2 depicts the configuration of this splitting criteria. Note that the first SD criterion also contains text-dependent data since the data are randomly shuffled. For instance, we only selected the first 19600 utterances for training and the rest 400 utterances for the test for both first and second experiments. Both number of data are obtained after shuffling the data. In the second, third, and fourth criteria, we selected the samples such that the condition of each criterion is fulfilled, i.e., the samples in the training and test partitions are different based on these criteria. Three different experiments were conducted to gain an overall conclusion among these splitting criteria.
In the first experiment, we ran 30 trials and calculated an average number of accuracy (weighted accuracy, WA) along with its standard errors (SE). This method is similar to the method reported in [8]. While they only ran ten trials, we extended it into 30 trials for more statistical confidence. This first experiment is conducted to attain an initial result and to compare the trend with the later methods (cross-validation with same and different number of data). The number of 30 trials was chosen since the results showed unstable performance when the model was trained with less than this number of trials.
The second experiment replaced an average score from a number of trials with cross-validation. In this experiment, we divided each training data (SD, SI, TI, STI) into five-folds and shuffle the training and validation data in different five splits. The model generated by cross-validation with this 5-fold is then used to predict the test data. As shown in Table III, both the first and second experiments employed the same amount of data. For SD, SI, and TI, 19600 samples were used for training while the rest 400 samples were kept for the test. For STI, which overlaps between speaker and text-independent data, only 14400 can be used for training with the same number of test data, i.e., 400 samples.
To take into account the effect of different numbers of training data, we reduced the number of training samples in the previous cross-validation experiment. In this third experiment, all criteria have the same number of data for both training and test partitions. A larger number of training data is reported to be more effective for deep learning than smaller data [15]. Hence, it is necessary to train the model under the same number of data.
| Criteria | Exp. #1 & Exp. #2 | Exp. #3 | ||
|---|---|---|---|---|
| Training | Test | Training | Test | |
| SD, SI, TI | 19600 | 400 | 14400 | 400 |
| STI | 14400 | 400 | 14400 | 400 |
III-E Evaluation Metric
We evaluated our results, i.e., classification performance, with a single metric weighted accuracy (WA). This metric is also known as overall accuracy [16]. Since the dataset is balanced, i.e., the number of samples for each emotion class is same, various metrics (accuracy, precision, recall, F1) result in similar performance. Hence, we only used WA as a measure of total correct predicted samples divided by the number of all samples irrespective of emotion classes. This metric is also known as weighted average recall [17, p. 268].
In addition to WA, we calculated error bars using the standard error (SE) of the mean. This SE “reflect the uncertainty in the mean and its dependency on the sample size, ” [18]. It can be formulated as,
| (1) |
where SD is the standard deviation. As shown in the formula, SE depends on the number of samples, . In our experiment, is for experiment 1 and is for both experiment 2 and experiment 3.
IV RESULTS AND DISCUSSION
IV-A Results
Table IV shows the result of experiments under different conditions. As noted in the Methods section, one of the purposes of conducting experiments in different conditions (average of trials, cross-validation, and same amount data) is to check the consistency and pattern of the evaluated criteria. Hence, we summarized all results of these experiments in a single table to show these behaviors.
Table IV shows results of three SER experiment conditions in terms of accuracy (weighted accuracy, WA). There is consistency among different splitting criteria across different experiments. The SD condition always gains the highest performance, as expected. Contrary to expectation, the text-independent condition always obtains the lowest performance among others. We first assumed that the speaker+text-independent condition would have the worst result since this condition is the most difficult among others. These results suggest that the order of difficulties across different splitting criteria is text-independent, speaker+text-independent, speaker-independent, and speaker-dependent.
| Criteria | WA (%) SE (%) | ||
|---|---|---|---|
| Exp. #1 | Exp. #2 | Exp. #3 | |
| SD | 91.14 0.07 | 92.30 0.40 | 89.40 0.48 |
| SI | 87.88 0.09 | 88.85 0.49 | 86.64 0.63 |
| TI | 64.36 0.08 | 65.04 0.90 | 62.35 0.93 |
| STI | 69.56 0.09 | 70.65 0.44 | 70.65 0.44 |
IV-B Discussion
We came to this research idea from the previous findings on SER research where the recognition performance has increased when acoustic information is combined with linguistic information [3, 12]. If linguistic information is involved, it makes sense that the performance will improve. In other words, the SER performance will decrease without linguistic information. While the previous linguistic information is extracted from text, Fujisaki [4] argued that linguistic information itself is also manifested in acoustic features, meaning that there is also linguistic information in acoustic features. This argument leads to the following presumption. If we train SER with different splitting criteria with regard to linguistic information, the performance also changes.
Implementing splitting criteria with different linguistic information can be achieved by separating training and test sets into different sentences. The spoken sentences (or utterances) used for the test partition can be set to be different from the sentences used for the training. One may argue that this separation only works if linguistic information from text is involved. However, based on a solid argument from the previous literature [4], we believe that there will be differences in SER performance by splitting training and test partitions into different sentences.
To test our hypothesis, we split the samples in the dataset into four criteria: speaker-dependent, speaker-independent, text-independent, speaker+text-independent. We experimented with these different splitting criteria on three different conditions: average trials, cross-validation, and the same amount of data. The results show consistency among different splitting criteria and experiment conditions.
Among three experiments, the cross-validation condition obtained the highest scores among the other two conditions. Shuffling different training and validation data seems to be useful for generalizing the model. Using five-fold shows slightly higher scores than an average of 30 trials. The results may also be used to justify that reporting performance from average trials may be sufficient to gain an insight into the order of difficulties among different splitting criteria. One exception in guaranteeing this justification is that the test set for four splitting criteria is different for various criteria in one experiment condition. It is impossible to have the same test set for SD, SI, TI, and STI. Indeed, the test sets are the same for each criterion across different experiments.
The last experiment 3 using the same amount of data for all splitting criteria seems to be the most relevant result in this research. As shown in a literature [19], the size of data greatly influences the performance of deep learning, particularly on the SER task. To avoid bias due to differences in the amount of training data, we forced all data in the third experiment to have the same size. In this scenario, the results show consistency with the previous experiments with smaller performance scores. The result for STI was the same for both experiment 2 and experiment 3 since both experiments used the same data for training and test.
One interesting finding in this research is that the text-independent criterion is more difficult than speaker+text-independent criteria. A possible explanation for this phenomenon might be that the model learns more information in speaker+text-independent than in text-independent only. To test that hypothesis, it is suggested for future research to explore the data inside the model using such a tool, e.g., t-SNE [20]. Testing the experimental setup used in this research on other datasets might be useful to generalize the finding, particularly on the order of difficulties across different splitting criteria.
This research challenges the previously reported results on SER research, where most evaluations are performed under speaker-independent only. One may argue that building larger datasets that cover more spoken words may be sufficient to tackle this limitation. However, in the currently evaluated datasets in SER community, there are limited numbers of samples available. There is a necessity to overcome this sentence-open problem in SER with such strategies.
V Conclusions
This paper reports experimental research on the effect of different splitting criteria for speech emotion recognition tasks. Since linguistic information is manifested in acoustic features, it is hypothesized that different splitting criteria with regard to linguistic information will lead to different performances on the SER task. Four splitting criteria were evaluated, focusing on the differences between splitting criteria with the same and different linguistic information. The first is known as text-dependent, while the latter is known as text-independent. Along with splitting criteria by speakers, we conducted experiments on three conditions. The results show a consistency that text-independent condition is the most difficult condition among others.
To tackle the limitation of text-independent condition, one may utilize a larger dataset to cover more spoken words for training SER. Under limited or small dataset, it is necessary to find a strategy to learn information in different sentences in training and test partitions.
VI Acknowledgment
This paper is based on results obtained from a project, JPNP20006, commissioned by the New Energy and Industrial Technology Development Organization (NEDO), Japan.
References
- [1] G. N. Yannakakis, R. Cowie, and C. Busso, “The Ordinal Nature of Emotions: An Emerging Approach,” IEEE Trans. Affect. Comput., vol. 12, no. 1, pp. 16–35, 2021.
- [2] A. S. Cowen and D. Keltner, “Self-report captures 27 distinct categories of emotion bridged by continuous gradients,” Proc. Natl. Acad. Sci. U. S. A., vol. 114, no. 38, pp. E7900–E7909, 2017.
- [3] L. Pepino, P. Riera, L. Ferrer, and A. Gravano, “Fusion Approaches for Emotion Recognition from Speech Using Acoustic and Text-Based Features,” in ICASSP 2020 - 2020 IEEE Int. Conf. Acoust. Speech Signal Process. IEEE, may 2020, pp. 6484–6488.
- [4] H. Fujisaki, “Prosody, Information, and Modeling with Emphasis on Tonal Features of Speech,” in Work. Spok. Lang. Process., 2003.
- [5] Y. Yamada, Y. Chiba, T. Nose, and A. Ito, “Effect of Training Data Selection for Speech Recognition of Emotional Speech,” Int. J. Mach. Learn. Comput., vol. 11, no. 5, pp. 362–366, 2021.
- [6] S.-w. Lee, “The Generalization Effect for Multilingual Speech Emotion Recognition across Heterogeneous Languages,” in ICASSP 2019 - 2019 IEEE Int. Conf. Acoust. Speech Signal Process. IEEE, may 2019, pp. 5881–5885.
- [7] ——, “Domain Generalization with Triplet Network for Cross-Corpus Speech Emotion Recognition,” in 2021 IEEE Spok. Lang. Technol. Work. IEEE, jan 2021, pp. 389–396. [Online]. Available: https://ieeexplore.ieee.org/document/9383534/
- [8] Y. Chiba, T. Nose, and A. Ito, “Multi-Stream Attention-Based BLSTM with Feature Segmentation for Speech Emotion Recognition,” in Interspeech 2020, vol. 2020-Octob. ISCA: ISCA, oct 2020, pp. 3301–3305.
- [9] Y. Mai, T. Nose, Y. Chiba, and A. Ito, “Labeling of Perceived Emotion for Large-Scale Emotional Speech Database,” in 2020 RISP Int. Work. Nonlinear Circuits, Commun. Signal Process., 2020, pp. 230–233.
- [10] E. Takeishi, T. Nose, Y. Chiba, and A. Ito, “Construction and analysis of phonetically and prosodically balanced emotional speech database,” in 2016 Conf. Orient. Chapter Int. Comm. Coord. Stand. Speech Databases Assess. Tech. O-COCOSDA 2016. Bali: IEEE, 2016, pp. 16–21.
- [11] H. Pérez-Espinosa and A. A. Torres-García, “Evaluation of quantitative and qualitative features for the acoustic analysis of domestic dogs vocalizations,” J. Intell. Fuzzy Syst., vol. 36, no. 5, pp. 5051–5061, 2019.
- [12] B. T. Atmaja and M. Akagi, “Deep Multilayer Perceptrons for Dimensional Speech Emotion Recognition,” in 2020 Asia-Pacific Signal Inf. Process. Assoc. Annu. Summit Conf. APSIPA ASC 2020 - Proc., Auckland, 2020, pp. 325–331.
- [13] ——, “Improving Valence Prediction in Dimensional Speech Emotion Recognition Using Linguistic Information,” in Proc. 2020 23rd Conf. Orient. COCOSDA Int. Comm. Co-ord. Stand. Speech Databases Assess. Tech. O-COCOSDA 2020. IEEE, nov 2020, pp. 166–171.
- [14] Y. Haneda, M. Katoh, and T. Kosaka, “Basic research on emotional recognition for Japanese emotional speech corpus JTES,” Yamagata University, Tech. Rep., 2019.
- [15] A. Halevy, P. Norvig, and F. Pereira, “The unreasonable effectiveness of data,” IEEE Intell. Syst., vol. 24, no. 2, pp. 8–12, 2009.
- [16] A. Satt, S. Rozenberg, and R. Hoory, “Efficient Emotion Recognition from Speech Using Deep Learning on Spectrograms,” in Interspeech 2017, vol. 2017-Augus. ISCA: ISCA, aug 2017, pp. 1089–1093.
- [17] B. Schuller and A. Batliner, Computational Paralinguistics: Emotion, Affect and Personality in Speech and Language Processing. Wiley, 2013. [Online]. Available: https://books.google.co.jp/books?id=aaTyAAAAQBAJ
- [18] M. Krzywinski and N. Altman, “Points of Significance: Error bars,” Nat. Methods, vol. 10, no. 10, pp. 921–922, 2013.
- [19] B. T. Atmaja, K. Shirai, and M. Akagi, “Deep Learning-based Categorical and Dimensional Emotion Recognition for Written and Spoken Text,” in IPTEK J. Proc. Ser., 2019.
- [20] L. van der Maaten and G. Hinton, “Visualizing Data using t-SNE,” J. Mach. Learn. Res., vol. 164, pp. 2579–2605, 2008. [Online]. Available: https://lvdmaaten.github.io/publications/papers/JMLR_2008.pdf