Ca3Ru2O7: Interplay among degrees of freedom and the role of the exchange-correlation
Abstract
Ca3Ru2O7 is a fascinating material that displays physical properties governed by spin-orbit interactions and structural distortions, showing a wide range of remarkable electronic phenomena. Here, we present a density-functional-based analysis of the interplay among degrees of freedom, such as magnetism, Coulomb repulsion (Hubbard-U), and structural degrees of freedom, considering two exchange-correlation methods: Local-Density Approximation (LDA) and Perdew-Burke-Ernzerhof revised for solids (PBEsol). Our goal is twofold: first, to provide a brief overview of the current state of the art on this compound underpinning to the last proposed theoretical models and experimental research, and second, to give another view to model the electronic properties compared with the previous theoretical models. Our findings show that Ca3Ru2O7 displays several electronic states (metal, semimetal, and narrow insulator) as a function of Hubbard-U while it exhibits structural transition depending on the functional. We disentangle the effect of the different degrees of freedom involved, clarifying the role of exchange-correlation in the observed electronic and structural transitions.
I Introduction
11footnotetext: Present address: Pontificia Universidad Católica de Chile; andrea.leon@uc.clPhysics driven by spin-orbit interactions is among the most important topics in contemporary condensed matter physicssoumyanarayanan2016emergent ; witczak2014correlated . Since the spin-orbit interaction is comparable to the on-site Coulomb and other relevant interactions create a unique balance between competing interactions that drive complex behaviors and exotic states. In particular, compounds involving transition metals are technologically relevant. However, with their characteristic partially-filled orbitals, they exemplify this non-trivial competition between interactions of different natures kosmider2013large ; rejali2020complete ; gonzalez2017complex . The series Can+1RunO3n+1 compounds exemplify these characteristics; these -electrons systems present a perovskite structure, where the relative rotation and tilting of RuO6 octahedra often affect electronic properties depending on the number of layers ( in Can+1RunO3n+1). Among these, the Ca3Ru2O7 compound (CRO) presents several quantum phenomena such as electronic phase transitions, colossal magneto-resistance, spin density waves, or quantum oscillations cao1997observation ; colossal-Yoshida2004 ; kikugawa2007ca3ru2o7 ; spindensityCa3 . Early works suggested that CRO is a hallmark material exhibiting both metallic and insulator states. Due to these characteristics, CRO is cataloged as a peculiar materialcaofrontiers whose further comprehension could provide new routes to understand the complex interplay among spin, orbital, charge, and lattice degrees of freedom present in -oxides markovic2020electronically ; xing2018existence .
Currently, CRO is recognized as a polar metal holding a strong interplay between spin-orbit coupling (SOC) and structural inversion symmetrymarkovic2020electronically ; horio2021electronic , which leads to their exotic states. Recent experimental research has given new perspectives to manipulate and continue exploring their quantum states. In this context, have been observed metamagnetic phases sokolov2019metamagnetic , which may host mixed textures similar to the chiral magnetic skyrmions, being this an ideal playground to study diverse antiferromagnetic-ferromagnetic states near metamagnetic transitions. Also, it was evidenced by the emergence of polar domains that may be controlled by ferroelectric switching. This last discovery opens new exciting questions about the mechanism behind supporting such domains in polar metalsdanilo-2 . Moreover, it was shown that CRO exhibits extraordinary lattice flexibility because its electronic states can be tuned by manipulating their crystalline axes via external magnetic fields and under pressurecolossal-Yoshida2004 ; Lattice2021 . The studies mentioned above open a new research stage on the CRO system. The appearance of magnetic textures and polar domains, and the facility for manipulating electronic states under lattice deformation mechanisms, could give novel perspectives to search for the next generation of ferroelectric compounds with novel functionalities haldiwi2017 .
The CRO structure is defined by RuO6 planes intercalated with calcium atoms. Due to the strong spin-orbit coupling present in the Ru atoms, non-collinear magnetism is expectedjohansson2010spin ; srnec2008effect . The interaction between Ru planes depends on the large coupled rotations and tilts of the RuO6 octahedra that make up the perovskite-like building blocks of this structure, generating a non-centrosymmetric crystal structure. In particular, one of the most striking characteristics of CRO is its phase transitions under temperature, exhibiting a first magnetic transition at the Néel temperature of 56 K (TN). This first transition is associated with the spins aligning ferromagnetically within each bilayer in the [100] direction but antiferromagnetically coupled between bilayers (AFM-). A second structural and magnetic transition happens at 48 K (TS), where occurs a c-axis lattice parameter compression and the spins are reoriented from [100] to [010] direction (AFM-) cao1997observation ; kikugawa2007ca3ru2o7 ; yoshida2005 .
Below TS, the in-plane resistivity starts to increase with cooling, showing a local maximum at T 30 K. In early workscao1997observation , the phase transition at Ts has often been discussed as a metal-insulator transition, and the temperature region between 30 K and TS as an insulating phase of Ca3Ru2O7; the understanding of the nature of these phases (either metallic or insulator) has been controversial in the literaturexing2018existence . In this context, it was suggested that different growth batches of Ca3Ru2O7 crystals yield differing low temperature properties, ranging all the way from the metallic ground states spindensityCa3 ; kikugawa2007ca3ru2o7 ; baumberger2006nested ; lee2007pseudogap to insulating phasescao1997observation ; cao2003quantum ; karpus2006spectroscopic . Conciliating the different experimental observations have been an intense topic of research and debate for more than one decadespindensityCa3 ; colossal-Yoshida2004 ; baumberger2006nested ; kikugawa2007ca3ru2o7 ; lee2007pseudogap ; cao1997observation ; cao2003quantum ; karpus2006spectroscopic .
Using a theoretical approach based on the density functional theory (DFT), we explore the electronic and magnetic properties of CRO crystals to evidence the conditions that lead to either metallic or non-metallic ground state solutions. Here, we explore the interplay among Coulomb repulsion (U-Hubbard), spin-orbit effects (SOC), structural degrees of freedom (positions and volume), and exchange-correlation. We compare our results against the latest experimental and theoretical results on CRO. Furthermore, we contrast the electronic band structure of CRO using two exchange correlations: PBEsol (PS) and LDA approximations and performing a linear response approximation calculation implemented by Cococcioni-Gironcoli cococcioni2005linear . We establish the upper and lower limits of the optimal U-Hubbard values. The contrast of our results against the experimental evidence reveals that LDA+U ( eV) models properly the electronic and structural properties of CRO.
II Theoretical advances
As we mentioned before, one of the biggest problems was to conciliate the metallic or insulator nature of the phase between 30 T TS, in which some experimental works suggested a metal/semi-metal behaviorspindensityCa3 ; kikugawa2007ca3ru2o7 ; baumberger2006nested ; lee2007pseudogap and others an insulator phase cao1997observation ; cao2003quantum ; karpus2006spectroscopic . From a theoretical point of view, early DFT studies have reported electronic properties under different approximations. Collinear calculations predict AFM ground state with an FM and AFM spin coupling intra- and inter-layersingh2006electronic , respectively, agreeing with the experimental reportyoshida2005 . Along with the FM configuration, it was evidenced that the system exhibits a nearly half-metallic state. Later, noncollinear calculations explored the role of U and SOC on the electronic properties, indicating the U region in which the system could be metallic or insulator, which in turn depends on the magnetic moment orientationLiu-cro-327 .
Recent experimental and theoretical studies have given new perspectives about the nature of CRO below TS, reaching a better agreement between theory and experiments. It was revealed that CRO does not have a real insulator phase
since it was evidenced a pseudogap behavior around point and several bands crossing the Fermi level markovic2020electronically ; horio2021electronic . Despite this advance, understanding the mechanism that causes the phase transitions around TS is still controversial. On the one hand, it is proposed a Lifshitz-like transition at Ts together with a new structural transition at T 30 K as a result of the RuO6 octahedral distortions and hybridization changes induced by the enhancement of the Coulomb interactions upon cooling danilo . On the other hand, it is suggested that the phase transition at Ts arises due to the thermal population reduction, opening a gap at the Fermi level. These hybridization changes induce an electronic energy gain favoring the spin reorientation through Rashba-type spin-orbit coupling, accompanied by structural changes simultaneously markovic2020electronically . Previous theoretical works have discussed the role of fundamental interactions such as Coulomb and spin-orbit coupling considering GGALiu-cro-327 ; danilo and PSdanilo approximations. However, in this work, we aim to gain insight into the interplay among several degrees of freedom, such as magnetism, SOC, Hubbard-U repulsion, and structural degrees of freedom, considering the role of the exchange-correlation (LDA and PS) in the electronic and structural properties of CRO.
Why is it so complicated to understand the electronic structure of CRO? From a theoretical point of view, studies based on DFT have observed that the unconventional magnetic and electronic properties are dictated by the competition of multiple degrees of freedom (charge, spin, SOC, lattice) that makes the electronic states highly sensitive to the electronic interactions and exchange of correlation. Early studies using GGA approximation evidenced a metallic state and highly anisotropic behavior of CRO. They suggested for the first time the crucial role of spin-orbit interaction, whereas a metal-insulator transition happens by the interplay of SOC and Coulomb repulsion (U) (for U 3 eV)Liu-cro-327 . Later, other studies considering spin-orbit interaction with LDA and GGA evidenced that the system has a semimetal state. Here, it was evidenced that GGA fails to describe the band structure at point through comparing with ARPES spectra markovic2020electronically . Finally, recent work has performed studies using GGA along with PS approximation and considering the interplay among SOC+U+structural degrees of freedom; this study revealed that for small U values, it is possible to control the band occupation around the Fermi level, in which for U 1.4 give good agreement with the ARPES spectra danilo . However, it is necessary to propose a new structural phase transition not reported by experiments so far.
III Calculation Details
We perform a theoretical analysis using the density functional theory with spin-orbit coupling (SOC). We use the plane-wave pseudopotential method implemented in the Vienna ab-initio simulation package (VASP)Kresse1996 within the PBEsol functional (PS)Perdew2008 and the Local-density approximations (LDA)ceperley1980ground . PS belongs to generalized gradient approximations (GGA), and it gives structural properties closer to the experimental values when compared to the results of PBEdongho2015density . The electronic valence considered are: Ru: 54 and O: 22 (for LDA and PS), and Ca: 334/Ca: 2, for PS/LDA respectively. We use a plane-wave energy cutoff of 650 eV and set a Regular Monkhorst-Pack grid of 553 to perform the atomic relaxation and 775 to perform the self-consistent calculation. We use a fine k-grid 14145 within the tetrahedron method for the density of states. We perform the structural optimization of the unit cell until a force convergence threshold of at least 10-3 eV/Å per atom.
To consider the electronic correlation effects in d-orbitals of Ru atoms, we consider a range of Hubbard on-site Coulomb parameters through the Dudarev approximation dudarev1998electron . Also, we employ the Liechtenstein scheme for comparison propose liechtenstein1995density . Later, we employ the linear response to estimate the optimal Hubbard-U; we follow the linear approach methodcococcioni2005linear . The linear response was computed by introducing the interacting and non-interacting occupation response with respect to the localized perturbations up to = 0.2 eV in the Ru atoms; we compare the Ru -orbital occupation upon the perturbation along LDA/PS, and with/without SOC.
IV Results and Discussion
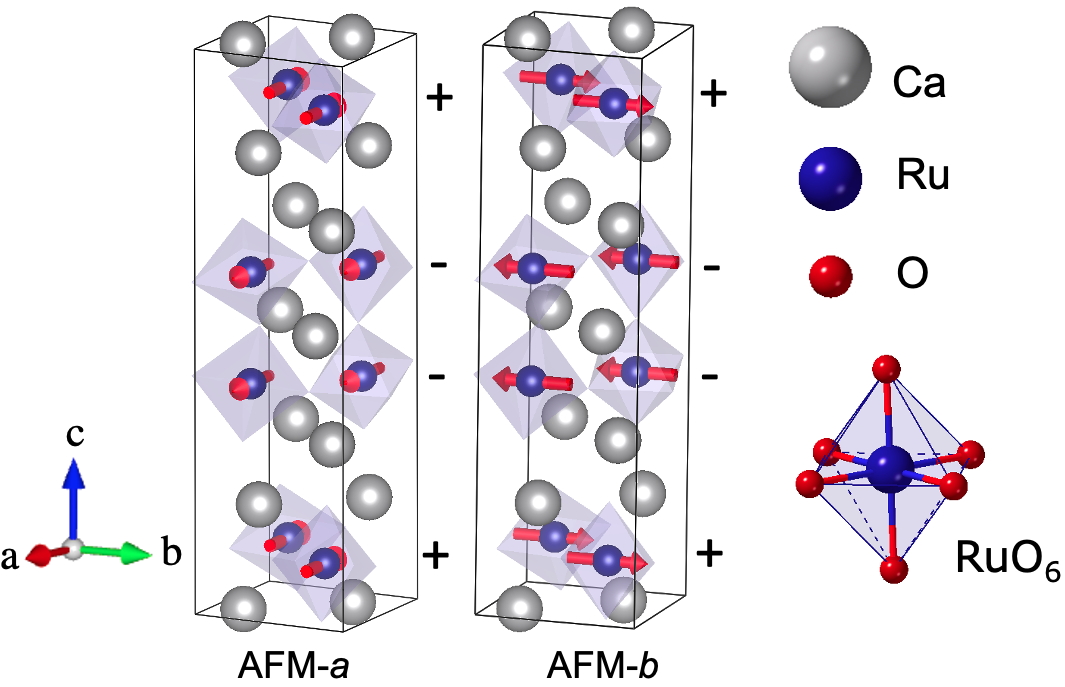
CRO crystallizes in a orthorhombic structure with space groupyoshida2005 Bb21m (a full description of the structure is available in ref. (35)). The atomic positions are taken from the neutron diffraction measurementsyoshida2005 at 8 K. To reproduce the different collinear AFM configurations, the unit cell includes 48 atoms; there are 12 Ca atoms, 8 Ru atoms, and 28 O atoms. Fig. 1 shows the lattice structure of CRO, with two possible magnetic configurations experimentally reported at T 48 K and T 56 K called AFM- and AFM-, respectively. The and notation means the ferromagnetic states with the direction in which the in-plane magnetic moments align. Additionally, we introduce the FM- configuration that means a FM coupling between layers with the magnetic moment aligned along b direction.
IV.0.1 Exchange–correlation effects, U = 0 eV.
In the PS approximation, the ground state presents an AFM- configuration with a magnetic moment () of (calculated in a Wigner-Seitz (WZ) radius 1.323 Å). The energy difference between the AFM- and AFM- configuration is 0.39 eV (EAFM-a EAFM-b). Within the same approximation, the FM-b phase presents a total magnetic moment of 1.92 ; this value overestimates about a 6% concerning the measured by previous experimental reportsyoshida2005 . The energy differences between the AFM- state and FM- phase is 1.69 meV/Ru (EFM-b EAFM-b).
In contrast, the LDA approximation reveals an FM- ground state with a low total magnetic moment of 0.83 . This state is more stable than AFM- and AFM- configuration with an energy difference of -5.85 meV/Ru (EFM-b EAFM-b) and -2.35 meV/Ru (EFM-b EAFM-a), respectively. Besides, the AFM- phase has lower energy than the AFM- phase by -2.67 meV/Ru. Despite the mismatch in the magnetic stability order between PS and LDA, both approximations reproduce the experimental crystal structureyoshida2005 (see table 1, calculation at the experimental volume 580.04 Å3, considering positions degrees of freedom).
Going further, we perform a volume cell relaxation; these values are reported in table S1 of supplementary material (SM), and our results for the most stable phase are shown in table S2. We can see that under volume relaxation do not change the most stable magnetic ground state.
| Appr. | Magnetic conf. | m () | V(RuO6) (Å3) | (Ru-O) (Å) |
|---|---|---|---|---|
| LDA | FM- | 0.83 | 10.53 | 1.992 |
| PS | AFM- | 1.36 | 10.54 | 1.993 |
| Expyoshida2005 | AFM- | 1.8 | 10.53 | 1.992 |
IV.0.2 Electron-electron correlation effects.
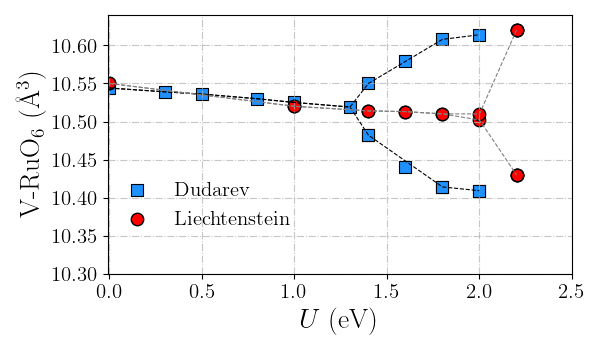
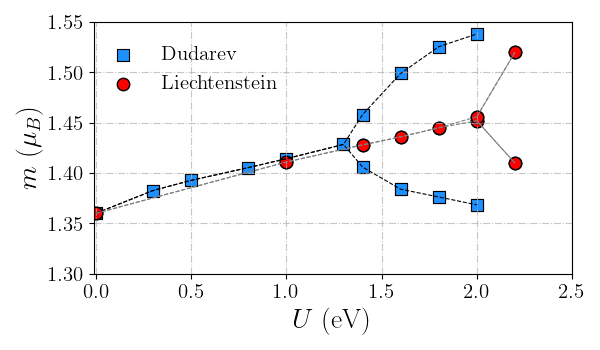
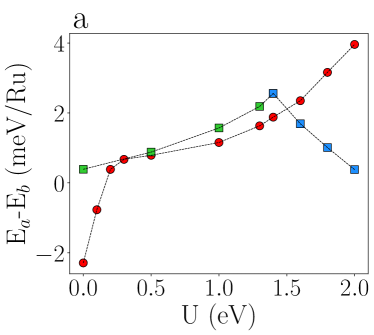
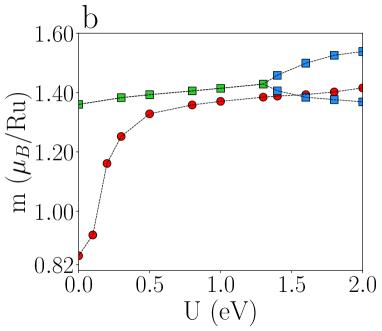
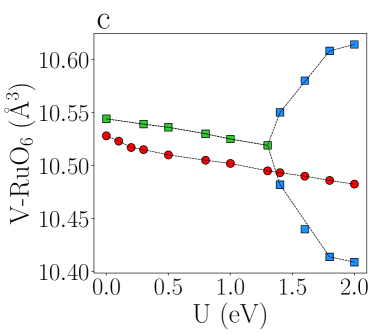
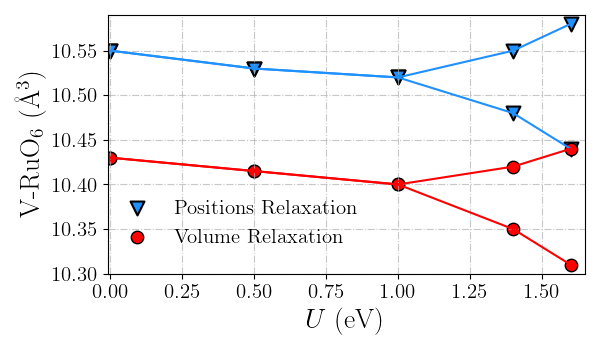
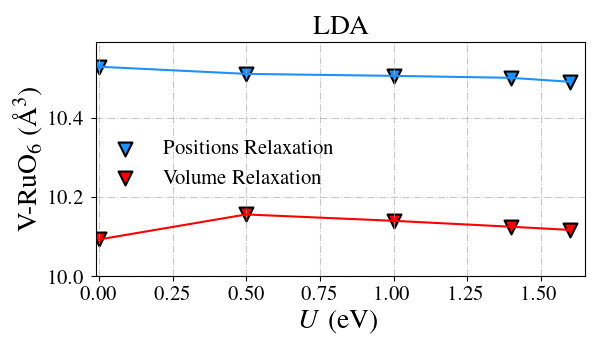
Now we will study the effect of electron-electron repulsion on the electronic and structural properties considering positions degrees of freedom. Based on previous worksdanilo , we use Hubbard-U values in the eV range and considering the volume given by the experimental reportsyoshida2005 . Fig. 2 shows the effect within the PS and LDA approximations of the Hubbard-U interaction for the magnetic anisotropy (Ea EAFM-a and Eb EAFM-b), the magnetic moment per Ru atom , and RuO6 octahedra volume (V-RuO6).
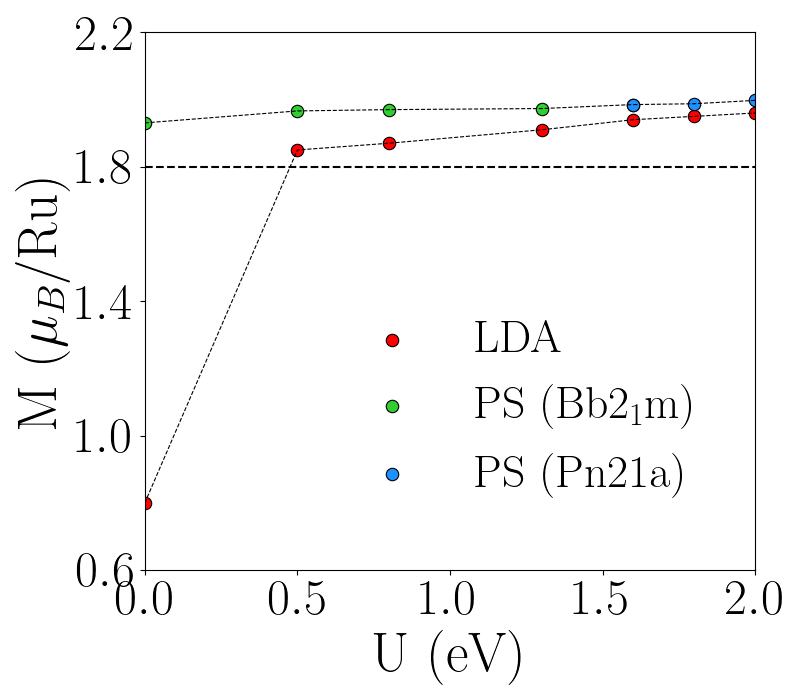
On the one hand, we will start with the LDA analysis, represented with red dots in Fig. 2. The magnetic anisotropy as a function of the Hubbard-U is presented in Fig. 2 (a). When the Hubbard-U interaction is included, the AFM- ground state is restored for U 0.2 eV (this configuration became more stable as E 0). In Fig. 2 (b), as expected, we observe that the U-term increases the magnetic moment rise, from 0.84 at U 0 to 1.16 at U 0.2 eV, then the magnetic moment increases monotonously to U 2.0 eV. Finally, in Fig. 2 (c), we found that the octahedra volume decreases as the U-term increases.
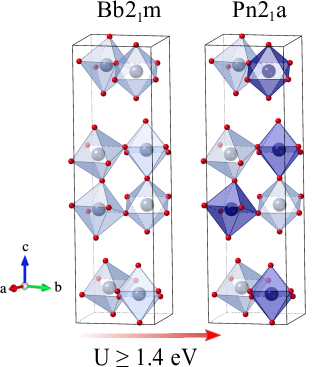
On the other hand, for the PS approximation represented with blue and green dots in Fig. 2, we can observe a non-monotonous behavior as the U-term increases. Here, we identify the critical U-term of eV. When U increases above the , a spontaneous structural transition appears, changing from Bb21m to Pn21a structure (depicted in the bottom-right panel). This transition could be associated with the interplay of the SOC+U and structural degrees of freedom danilo .
In panel (a), after we note a drop in the anisotropy value, where for U = 2 eV we recover the value obtained for U 0. In panel (b), the magnetic moment after shows two different values associated with the two crystallographic environments observed (see Fig. 2 bottom-right panel); note that the average between the average magnetic moment follows the same trend as before . A similar behavior appears when we look at the volume of the RuO6 octahedron in panel (c). Additionally, we have verified that the spontaneous structural symmetry change is independent of the structural degrees of freedom; further comments are in section I of the SM.
To properly describe the AFM- ground state within the LDA approach, it is necessary to consider a large U-Hubbard ( eV). For eV, the most stable system is the AFM- configuration (see Fig. 2(a)). Furthermore, comparing Fig. 2(a) and (b), we can identify that the regions with AFM- as the ground state, , the magnetic moment is smaller, . In the regions with AFM- as the ground state, , the magnetic moment is larger than . Since the LDA approximation does not reproduce the experimental magnetization of the ground state for smaller U values ( eV), to discuss the theoretical results with the experimental data, we compare the band structure within PS and LDA approximations considering and eV, respectively.
We should note that the magnetic moment observed for PS and LDA is lower than the magnetic moment experimentally reported (see Table 1). This is because the plane-wave approximation yields minor uncertainties in predicting localized quantities, like the magnetic moment and the charge per atomic site. The displayed in Fig. 2(b) is measured in the WS radius, then lower than the total magnetic moment. In order to compare our results with the magnetic moment reported by the experiment for the AFM-b phase ( 1.8 )yoshida2005 , we compute an FM-b configuration by completeness in order to obtain the total magnetic moment by Ru atom as a U function for both approximations; see details in the SM (see Fig. S2).
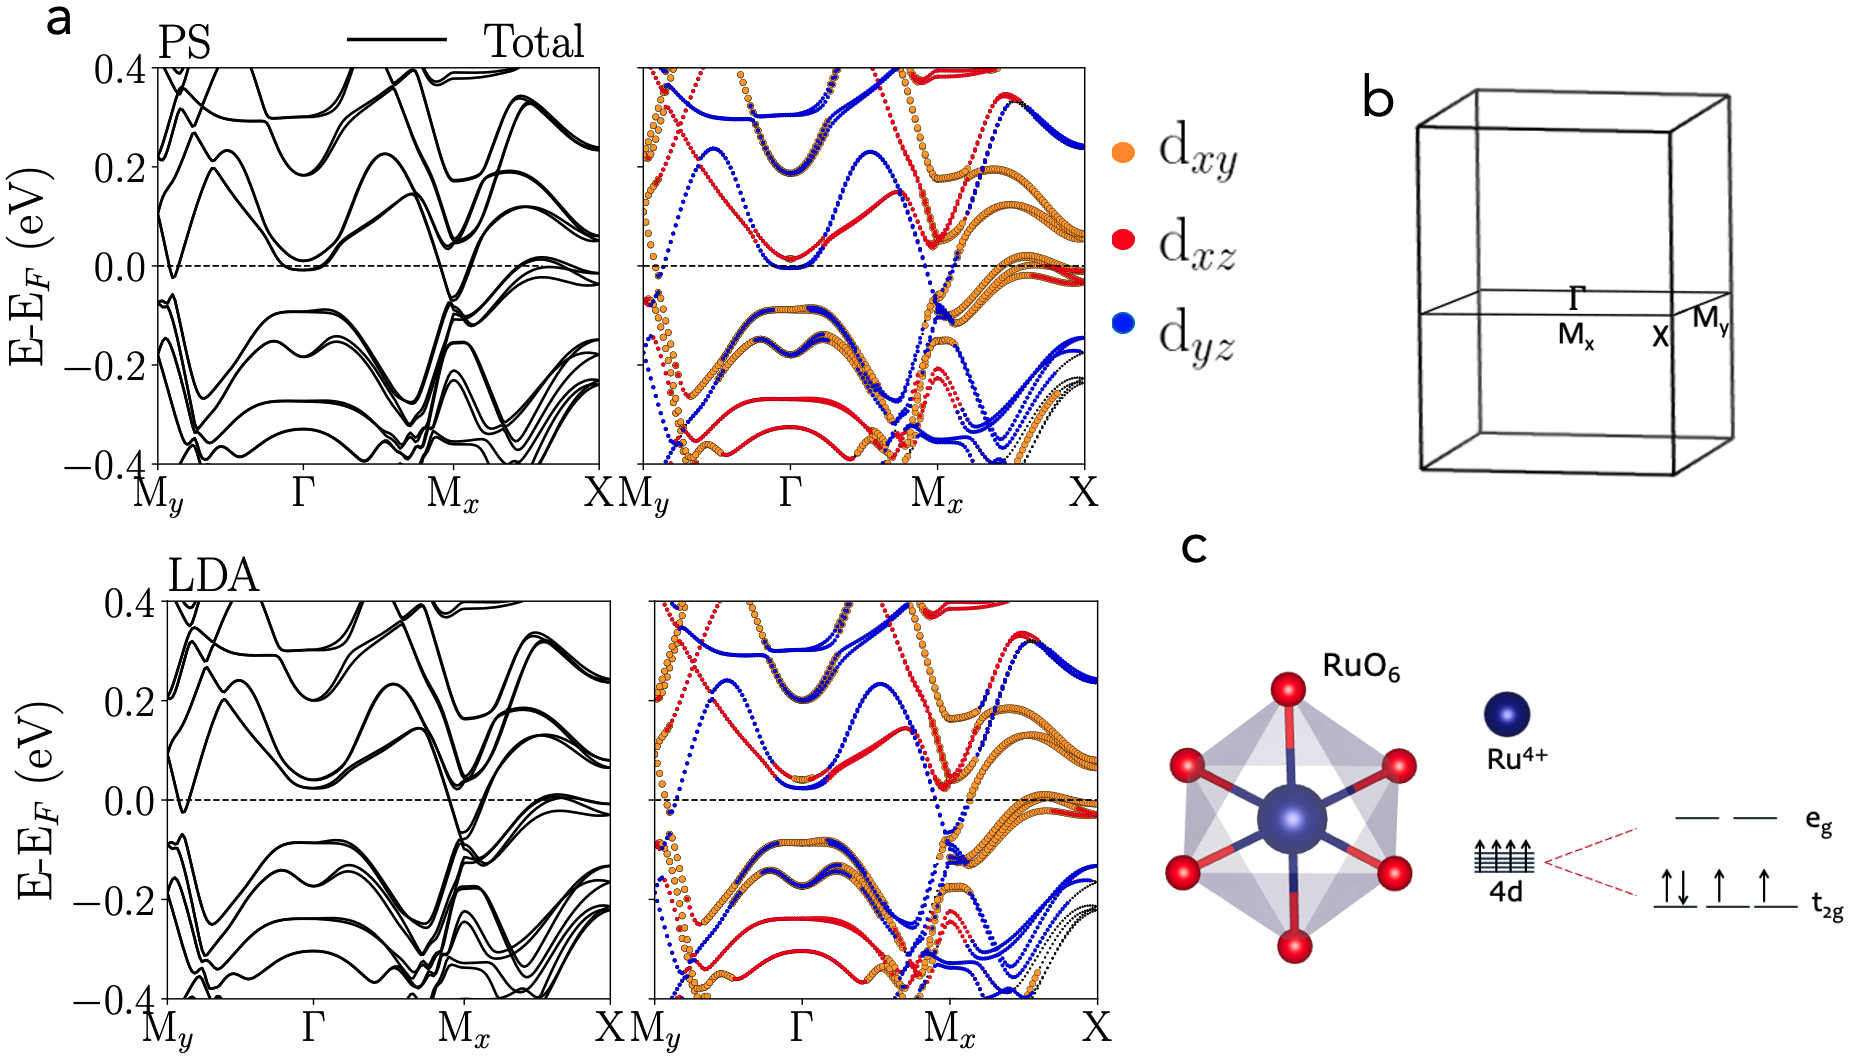
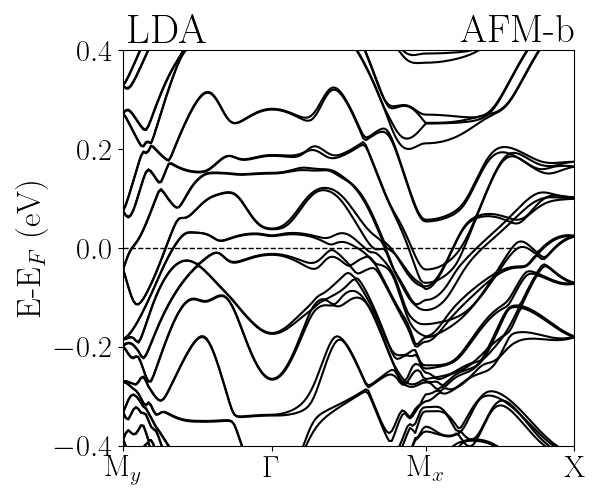
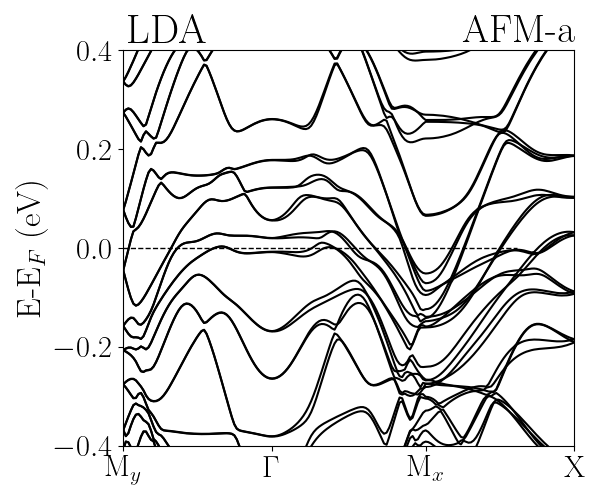
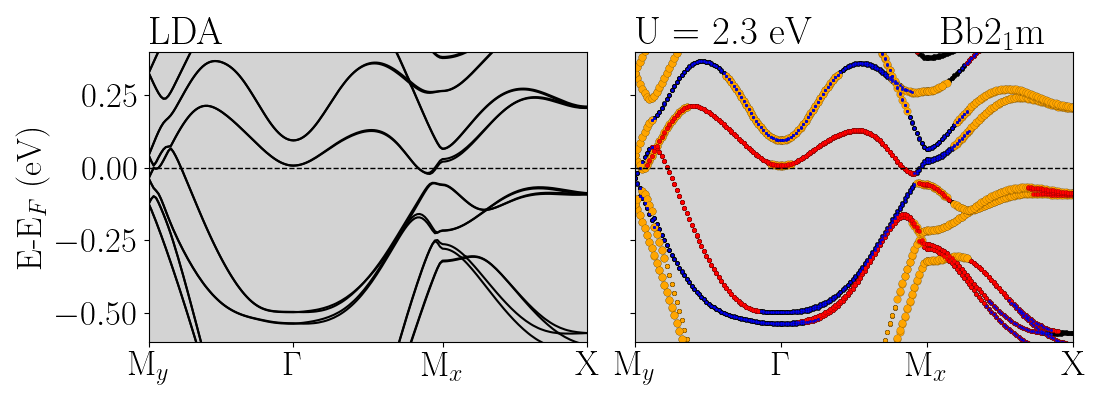
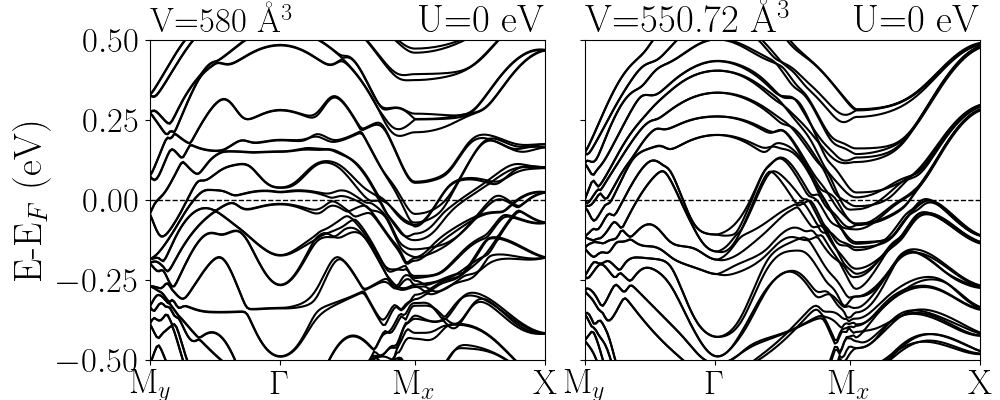
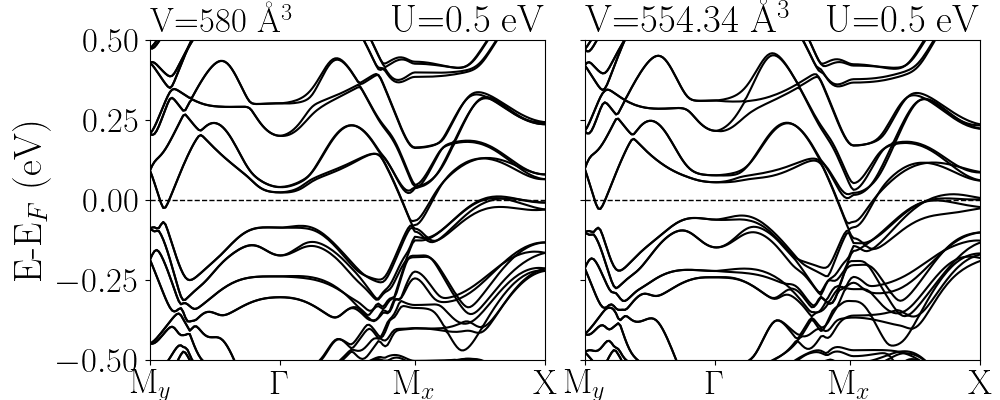
The band structure and its projection in atomic orbitals for the PS and LDA approximations are shown in Fig. 3. We will compare systems with similar magnetic anisotropy and magnetic moments (see Fig. 2 a-b); for the PS approximation, we will take a value U 0 eV, and for the LDA approximation, we choose a U 0.5 eV. In Fig. 3, we can see that the band structure and its projection are very similar, independent of the approximation used. The system exhibits a metallic character with subtle differences at the Fermi level for both approximations, mainly around the point. The valence band is mainly composed of the contribution of atoms of Ru and O (see Fig. S3). The Ru ions are embedded in an octahedral environment formed by the oxygen atoms; the octahedral crystal field splits the Ru 4 atomic levels, raising the eg and decreasing the t2g orbitals. This configuration yields a low-spin state, with the four 4 electrons partially filling the three t2g orbitals, leaving two unpaired electrons per Ru atomtesis-igor aligned as seen in the right panel of Fig.3 and in the partial density of states displayed in SM section (see Fig. S3). The orbital projection is considered with octahedra aligned to the unit cell; thus, in this reference, the t2g and eg orbitals correspond to (dxy,dxz,dyz) and (d,d), respectively.
In the case of PS, we can observe a metallic character at ; however, this is not observed in the LDA approximation. We observe a local band gap of 65 meV around the -point in the LDA approximation. For both approximations, we identify a Dirac-like behavior at Mx, in agreement with the ARPES measurementsmarkovic2020electronically . Along Mx- path, a small band crossing around the Fermi level is found. The projected band structure around the Fermi level reveals a dominant contribution (between a 25% to 75% per orbital) of the dxy, dxz, and dyz. The d, d orbitals represent less than 25% of the projection, and therefore they are not displayed. In both projections, we can see that around the , the dominant states belong to the hybridization between dxy-dyz (below the Fermi level) and dyz-dxz without hybridization (above of Fermi level). Along My- the bands are mainly composed of dxy and dyz orbitals. The Dirac-like bands are characterized by dxy, dyz orbitals, and finally, along Mx- path, the most dominant contribution became from dxy and dxz states (around the Fermi level).
In the case of LDA for , its is found a different trend on the band dispersion as well as for AFM- (ground state) and AFM- configuration. Here we evidenced a metallic behavior along all the high symmetry points (details in SM, Fig. S4).
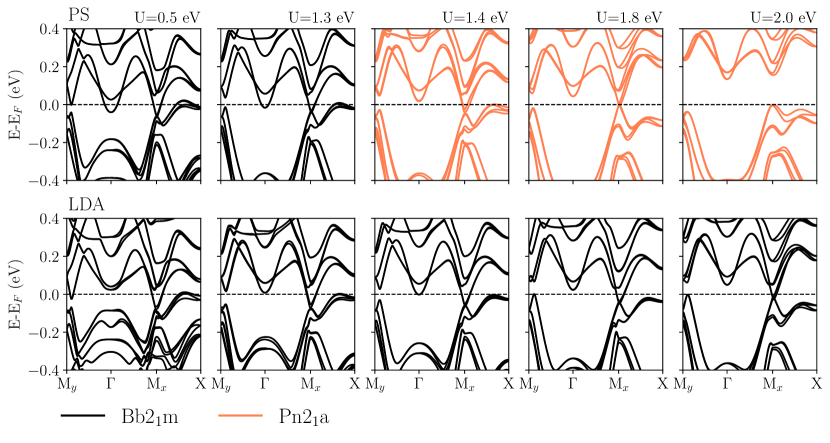
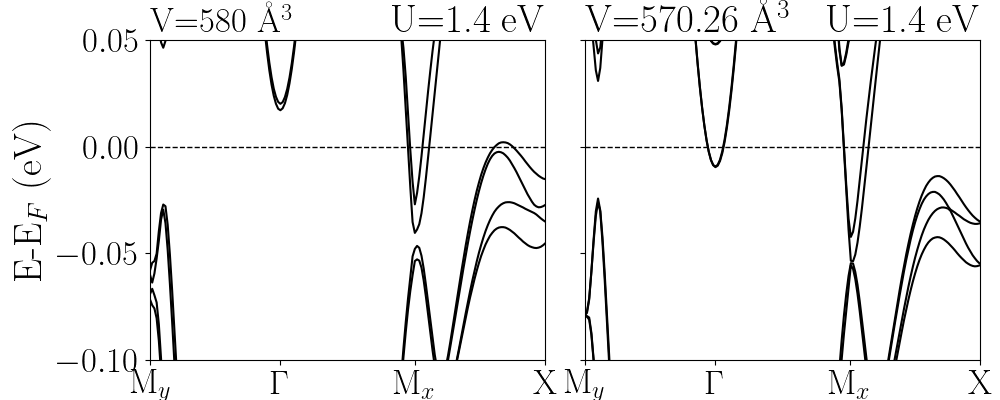
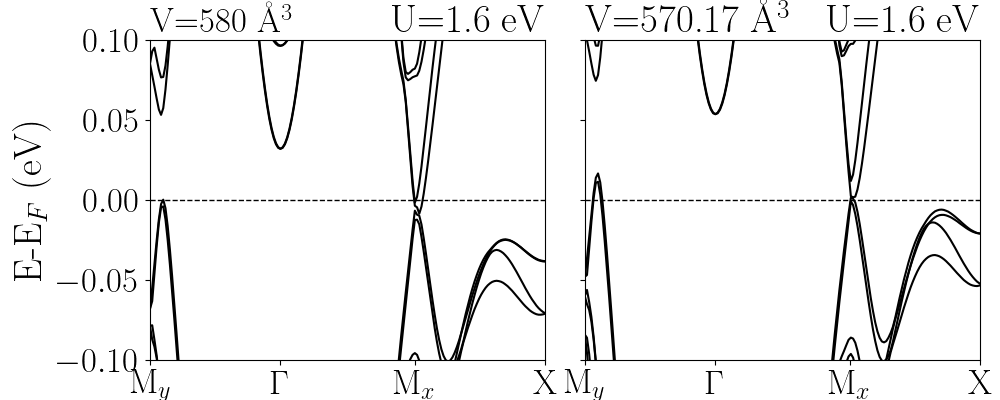
We systematically study the effect of U-Hubbard repulsion on the band structure; in Fig. 4, we show the evolution of the band structure for PS and LDA approximations as -term changes in a range from eV to eV. In general, for the same U-term value, there are similarities between PS and LDA; below the Fermi level, the bands around the point that are mainly composed by dyz and dxy orbitals, these orbitals are pushed to lower energies as the U-term increases, favoring the hybridization between these orbitals (see Fig. S5). Along Mx to X path, we can observe that these states are slightly pushed below the Fermi level. These bands are rather modified due to they are mainly composed of dxy-orbitals being close to integer filling and then exhibiting a less grade of hybridization (see Fig. 3 right panel). Besides, from My- as the Hubbard-U increases, the bands are pushed to higher energies inducing a band distribution aiding the occupation of the dxz orbitals, which slightly hybridize with the dxy orbitals just below the Fermi level (see Fig. S5). Although, for PS approximation, we can distinguish three ranges of -term values. The first region, between 0 U 1.4 eV, is characterized by a metallic state (with a band crossing the Fermi level at , in the first three plots of the top panel in Fig. 4). In the second region, for 1.4 U 1.8 eV, we can observe that the bands at and the Dirac-like bands are pushed to high energies given to the system a semimetallic character (due to the gap around point). These changes are simultaneous with the phase transition when symmetry changes from Bb21m to Pn21a, as discussed before. In the last region, U 1.8 eV, the Dirac-like bands are suppressed due to the orbital occupation rearrangement favoring the band hybridization, in which the dyz are shifted to higher energies separated by a gap of 0.16 eV of the hybridized dyz-dxz orbitals below the Fermi level (see Fig. S6, for U 2 eV). The suppression of the Dirac-like bands allows the emergence of a narrow bandgap insulator phase with Pn21a structure along with PS approximation; also, we can observe the gap oppening around the Fermi level in the total density of states displayed in Fig. S7.
When examining the band structure along the LDA approximation (lower panels of Fig. 4), unlike in the PS case for lower U values (U 1.4 eV), we do not observe bands crossing the Fermi level in the vicinity of the point and the Bb21m structure continues to be as the most stable configuration. Although, as in the case of PS, we can observe that for U 1.4 eV, it favors a semimetallic state in which the Dirac-like bands (at Mx) are pushed to higher energies, besides the bands get closer to the Fermi level near the My for U 1.8 eV.
IV.0.3 Effects of the functional and structural degrees of freedom
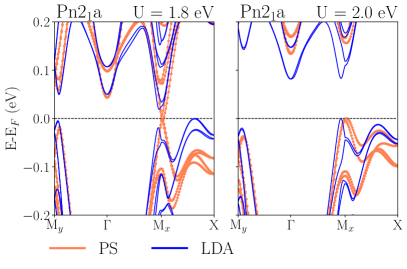
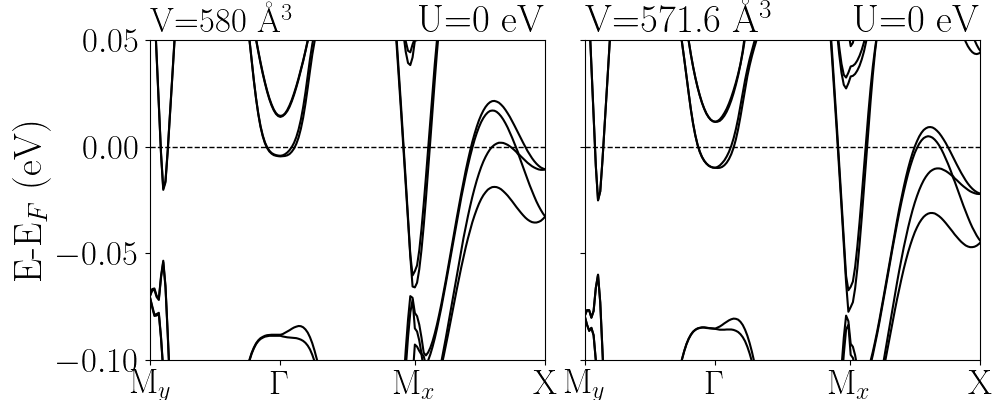
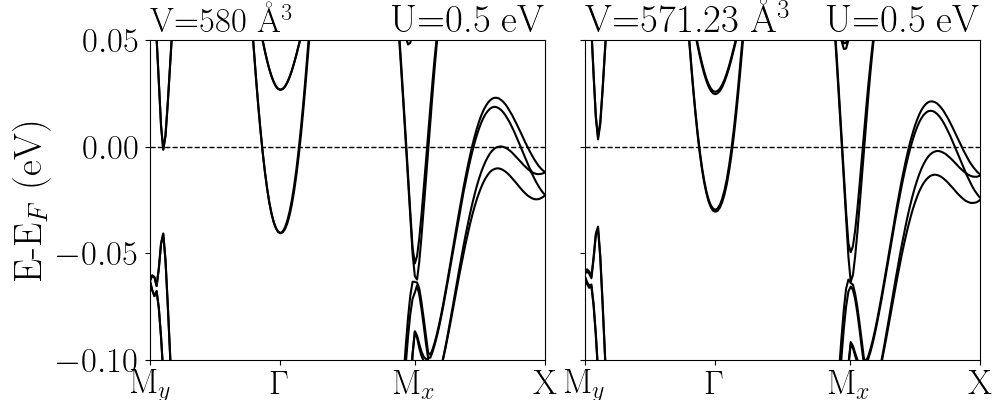
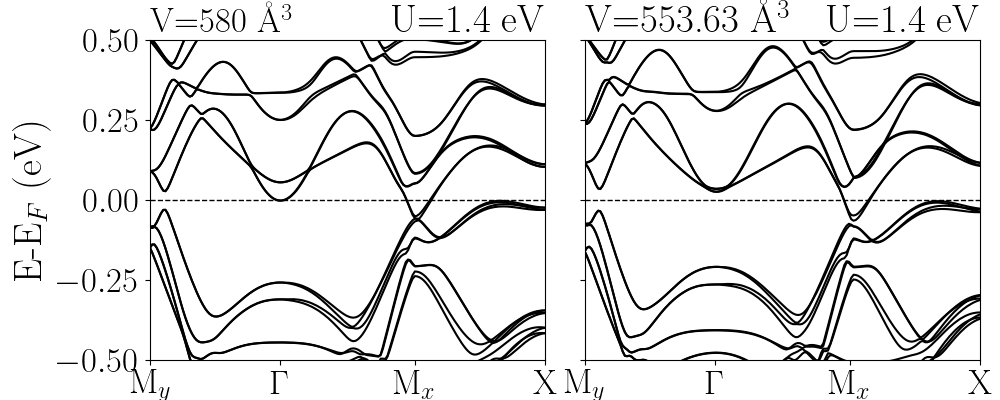
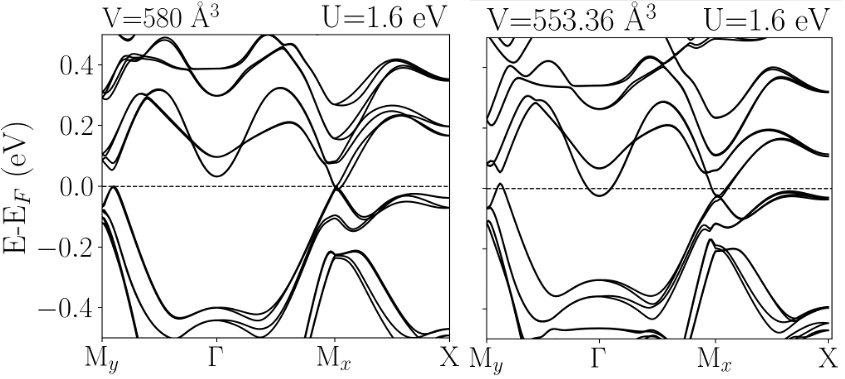
To determine the mechanism promoting the electronic and structural changes under PS approximation, we perform an additional calculation to distinguish the effects of the functional choice and the structural phase in the electronic band structure. For this sake, first, we take the structure obtained with PS for U 1.4 eV (Pn21a phase), and with a frozen geometry, we calculate the electronic bands within the LDA approximation. In Fig. 5, we compare the band structure for PS and LDA, keeping the geometry of the PS approximation (Pn21a). In the left panel of Fig. 5, we show the band structure for U 1.8 eV, the system with Pn21a (PS approximation) remains with a semimetal state. Instead, we can observe that the Dirac-like bands are suppressed under LDA approximation, emerging a band gap of around Mx-point. Furthermore, for U 2.0 eV, shown in the right panel of Fig. 5, both approximations show a narrow bandgap insulator character with a gap at Mx of 0.08 eV for LDA and 0.18 eV for PS approximation. Secondly, to reveal the effect of the structural degrees of freedom in the band structure for the Bb21m phase, we have calculated this without and with structural degrees of freedom along with PS and LDA approximation. In the first case, we find that the main role of Hubbard-U interaction is to control the band occupation around the Fermi level, favoring the gap increases around and the emergence of hole-like bands close to My (for U 1.4) while changing the Hubbard-U from 0 to 2 eV (see SM. Fig. S8). In the second case, the changes in the lattice vectors induce slight modifications of the bands around the Fermi level, affecting mainly the gap at (see SM Fig. S10-S11). In particular, the metallic character is still present for U = 1.4 eV within the PS approach; thus, the structural transition is not concurrent with the electronic transition from metal to semi-metal (gap at point).
IV.0.4 Comparison with Experimental Evidence
In this section, we aim to get into contact with the experiments; therefore, we focus on which approximation and parameters best describe the band structure and magnetic configuration (AFM-) experimentally measured in CRO samples.
As discussed in section II, understanding physical properties have been a significant challenge. There are inconsistencies between different experimental measurements and theoretical predictions. One of the main inconsistencies between observations and theory was that band structure calculation performed by DFT calculations predicted that CRO is a semi-metal with a high carrier concentration spindensityCa3 . However, on the one hand, single-crystal measurements characterized CRO as a low carrier-concentration material on the verge of a metal-insulator. On the other hand, the ARPES measurements reveal that CRO displays a low-carrier metallicity but is characterized by a semimetallic state with a gapped fermi surface markovic2020electronically ; horio2021electronic . A summary of contradictions around CRO can be found in ref. (12).
A previous theoretical study (ref.(28)) proposed a mechanism to model the band structure and Fermi surface of CRO at low temperatures based on DFT calculations (along with PS approximation). The suggested mechanism aim to explain the electronic changes between TS T 30 K, taking into account Hubbard-U in the range 0.5 U 1.6 eV, in which at U 1.4 eV emerges a gap at point, accompanied of a spontaneous structural transition from Bb21m to Pn21a structure. In such scenario, the emergence of the semimetallic state could be related to the gap evidenced below 45 K in the optical conductivity spectralee2007pseudogap . Besides, the broken translational symmetry of the Pn21a structure could allow the charge (spin-) density wave transition agreeing with some experimental proves spindensityCa3 .
However, recently a series of independent experiments have successfully reconstructed the Fermi surface of CROmarkovic2020electronically ; horio2021electronic ; xing2018existence offering a novel approach to understanding the evolution of the electronic structure as the temperature decreases. The experimental evidence shows that CRO presents a semimetallic character at low temperaturesmarkovic2020electronically ; horio2021electronic , in which the band structure displays a gap around point, Dirac-like bands at (/a,/b), and bands intersecting the Fermi level near the My. Each workmarkovic2020electronically ; horio2021electronic reveals a key aspect to consider to identify the mechanism underneath the CRO phase transition. On the one hand, it was shown that the reconstruction of the Fermi surface is incompatible with the translational symmetry-breaking density waveshorio2021electronic . On the other hand, a band gap magnitude of 10 to 15 meV around the point was estimated, comparable to the pseudogap observed in optical spectroscopy spectra markovic2020electronically . These observations bring us several constraints to impose on our calculations.
After a systematic study and comparison with the most recent experiments, our results indicate that the LDA+U approximation is the one that most faithfully represents the complex behavior exhibited by the CRO. The LDA+U approximation successfully identifies the magnetic ground state (AFM- configuration) and the occupation bands in agreement with the recent experimental reportshorio2021electronic .
The subtlest region is to model the band spectrum along the high symmetry lines, specifically near the and the My; this region is quite sensitive to U value; however, these regions are key, as we explained before the experiment evidences a pseudogap (around ) and hole pocket (near the My)
and Dirac-like bands (at Mx)horio2021electronic ,
given a semimetallic character to the system. In contrast to the PS approach, LDA can modulate the band occupation at -point in the studied range of U-values. For instance, the LDA+U with U 0.5 eV evidence a band gap of 96 meV at ; this value is in the same order of ARPES measurementsmarkovic2020electronically .
Besides, the bands are getting closer to My for U 1.8 eV; however, for this range of U, the band dispersion around is pushed down to lower energies, increasing the size gap. Additionally, we have identified that the main band contribution around the Fermi level comes from dxy, dxz and dyz orbitals in which dxy does not cross the Fermi level for U 0.5 eV (see Fig. S5) in agreement with the experimental reports horio2021electronic .
In the case of PS, several issues are found as U increases: Below U 1.4 eV band crosses the Fermi level at point and above U 1.4 eV due to a spontaneous transition toward the Pn21a structure, being this structural phase reported theoretically until now danilo in the best of our knowledge.
In order to dig into the role of the Hubbard-U approximation and how the double counting, as well as the directional dependence, can affect the observed results, we have performed the same calculations using the Liechtenstein approximation liechtenstein1995density (along PS). A detailed analysis is provided in section V of the SM; here, we summarize the main findings. We have observed that for U 1.4 eV Dudarev and Liechtenstein approximations have the same trend. However, at U 1.4 eV along Dudarev happens, the spontaneous phase transition and with Liechtenstein, the Bb21m phase keeps stable. With this last approximation, the transition happens for U 2.0 eV, emerging a narrow insulator phase.
What is the underlying mechanism for the observed structural transition when considering the PS approximation with spin-orbit coupling (SOC) and Hubbard-U repulsion effects?.
The spontaneous transition appears independent of the Hubbard-U approximation. To inspect the role of SOC we have performed calculations considering Hubbard-U and structural degrees of freedom without SOC. We find that without SOC, the spontaneous structural transition does not appear. Our calculations show that Bb21m is stable considering positions and volume degrees of freedom. However, the phase Pn21a is unstable, being difficult to have an accurate convergence. These results disagree with the studies reported in ref.danilo .
When spin-orbit coupling effects are considered, the direction of magnetization changes from point to point, inducing a complex magnetic landscape. The PBEsol approximation belonging to the family of generalized gradient functional approximations (GGA) is more susceptible to convergence problems and can induce symmetry changes to stabilize the systemdesmarais2019spin .
IV.0.5 Linear response determination of U-term
Going one step further, we employ a perturbative approach to determine a value for the U-Hubbard interaction. However, this method tends to overestimate the value of U. Note that the DFT+U approach also has limitations and should be considered a pragmatic way to partially eliminate the self-interaction errors inherent in DFT. In addition, the effective U-value depends on several factors that limit their transferability, such as atomic coordination and calculation parameterslim2016improved ; yu2014communication (pseudopotentials, basis-set). We compute the U-Hubbard term through a constrained DFT-based method developed by Cococcioni and Gironcolicococcioni2005linear to compute the non-zero second derivative of energy concerning the local occupancy of the metal ion, in which is given byvaspwiki :
| (1) |
where is the occupation response at the site , and VI is the orbital energy shift in the site. The first and second terms are the self-consistent (scf) and non-self consistent (nscf) solutions. We consider a perturbation in the 0.2 eV range. As a result of these calculations we found that eV and eV for PS and LDA respectively. We have also performed calculations in a lower range of perturbation (0.1, with steps 0.02). Here, we have evidenced no large modification of the U value of ULDA= 2.86 eV and Ups= 2.73 eV.
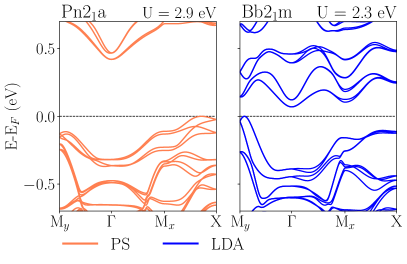
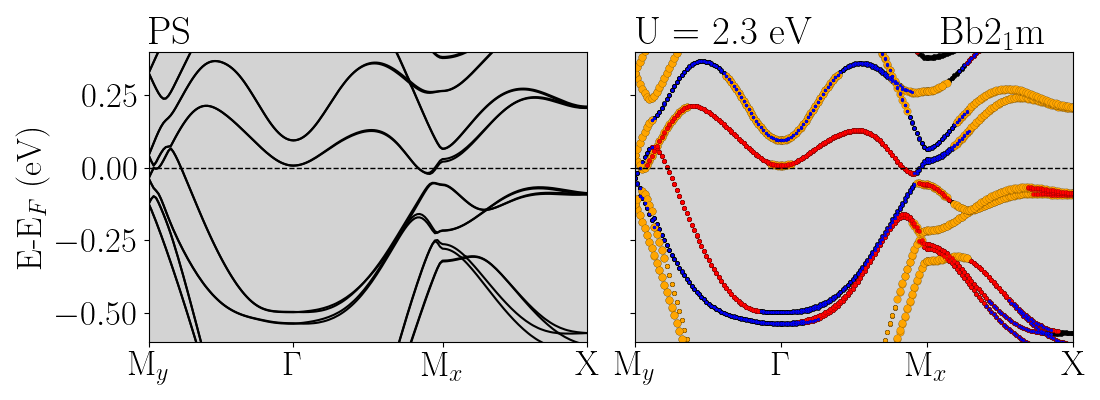
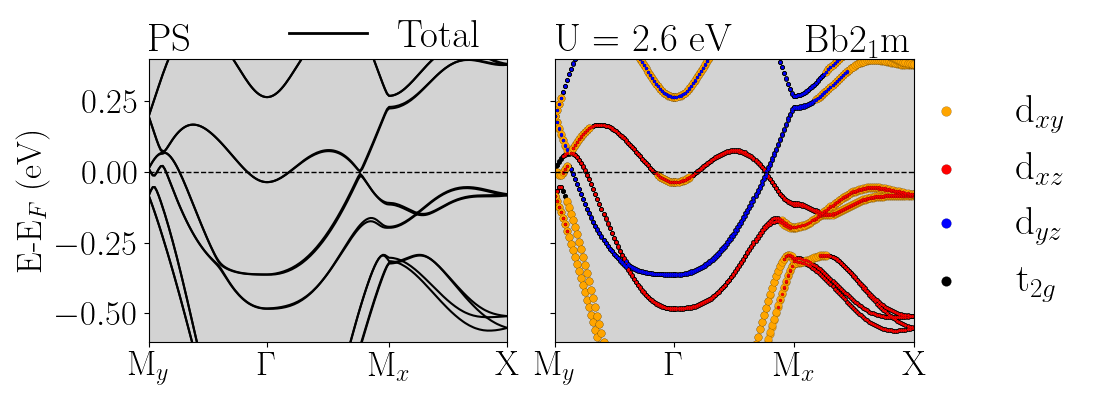
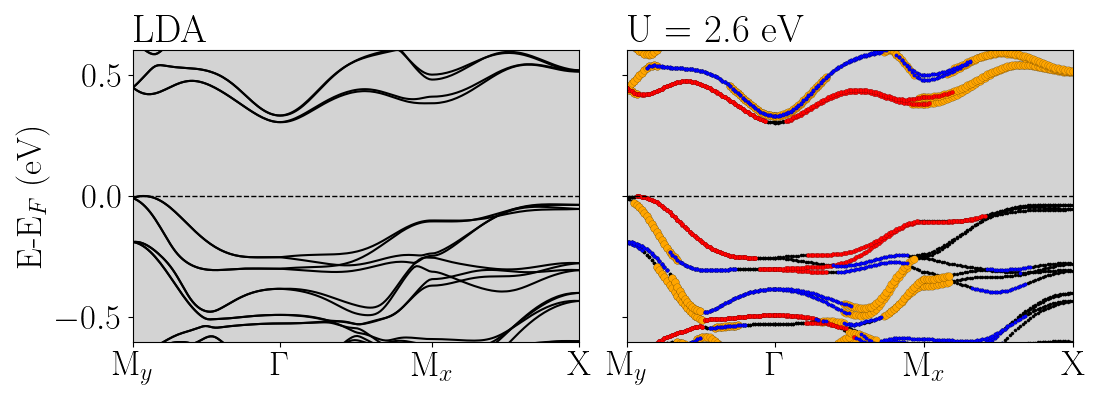
We plot the electronic structure for the Hubbard-U values found by the linear response method. In Fig. 6 (left panel), the PS band structure ( eV) and in Fig. 6 (right panel), the LDA band structure ( eV). As a result of our calculation, we find that LDA retains the same Bb21m symmetry, and the PS approximation keeps the Pn21a phase. In the PS approximation, the larger U-term value ( eV) produces a band gap of 0.80 eV at Mx (see Fig. 6 left panel). Note that the band gap increases from the 0.153 eV calculated with U = 2 eV (outermost right panel of Fig. 4). The large U influence in Pn21a structure induces t2g band distribution mainly at Mx, in which the band structure change from the hybridized bands dxz-dyz for U 2.0 eV to be composed mainly by dxz orbitals (below Fermi-level) for U = 2.9 eV (see Fig. S6).
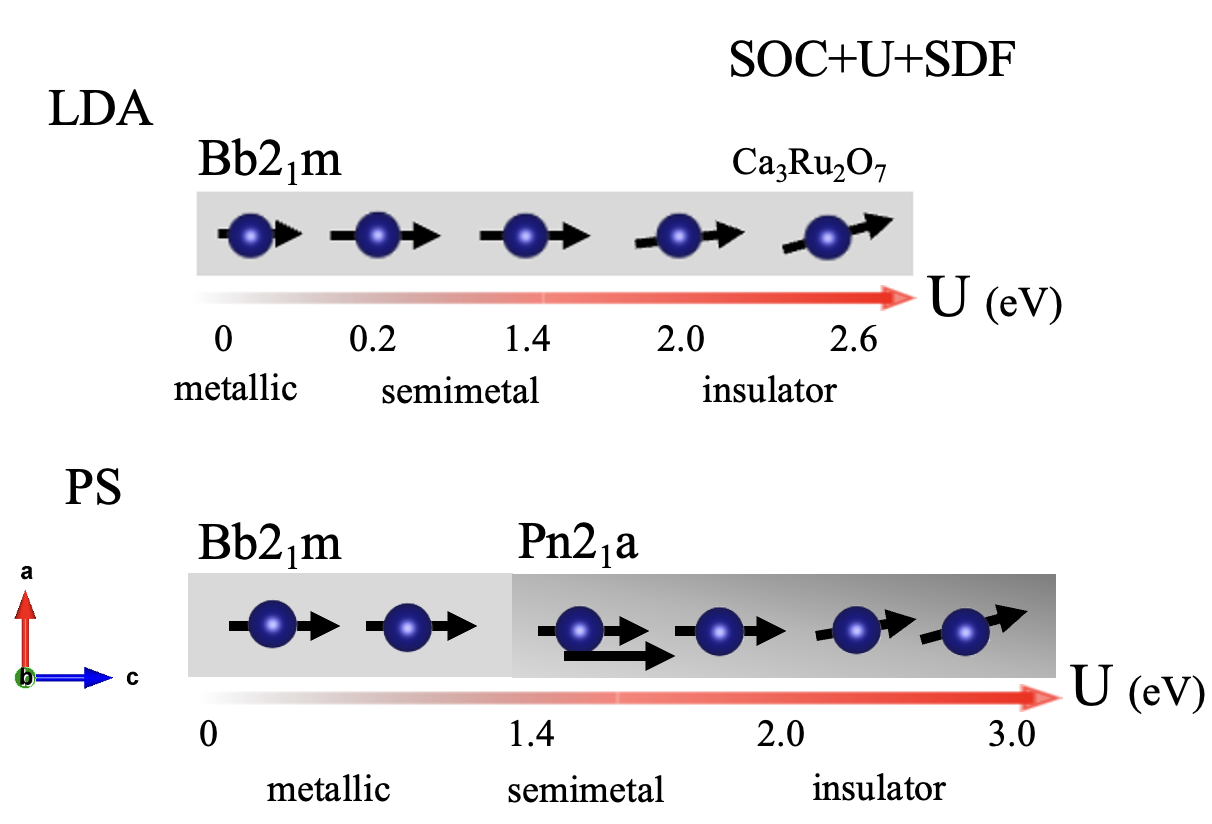
In the case of LDA approximation, the system presents a Bb21m symmetry; however, we can observe that to increase to U 2.3 eV, the Dirac-like bands are suppressed, emerging a gap of 0.10 eV at Mx similar to the evidence along with PS approximation at U 2.0 eV (see Fig. 4). The observed gap emerges due to the re-arrangement of t2g orbitals around Mx, as under the PS approximation case. Furthermore, in Bb21m structure the large U induces a decrease of the dyz orbital population (see Fig. S5) and for U 2.3 eV is favored the band occupation of dxy-dxz around Mx below the Fermi level (without hybridization, see Fig. S5 at U 2.3 eV). Additionally, for larger values of the Hubbard U-term (U 2 eV), the magnetic state along the direction became unstable, and the magnetic moment direction goes toward the (111) direction in which mb ma,c. Fig. 7 shows a schematic representation with the electronic and structural phase transitions as U increases to 2.6 eV and 3.0 eV for LDA and PS approximations.
Because the structure of the ground state depends on the functional used (PS or LDA), a direct comparison between band structures is meaningless. To compare the band structure for a particular value of the Hubbard-U, we fix the atomic position and lattice vectors to the Bb21m structure (with the atomic position given by the experimentyoshida2005 at 8 K). Here, we noticed that regardless of the functional, the gap at Mx appears for eV; however, the system continues metallic (see Fig. S9). For LDA approximation, the narrow bandgap insulator state appears for U above 2.3 eV (see Fig. S9 at U 2.6 eV). However, under PS approximation, the band structure favors the metallic character (see SM, Fig. S9). The metallic behavior tendency could be related to a topological band arising as the U-term increases.
We should point out that the narrow bandgap insulator character originates in the strength of -term independent of the functional choice and structural phase (in the presence of structural degrees of freedom). The Pn21a structure favors the insulator state for U 2.0 eV and U 1.8 eV for PS and LDA approximation, respectively (see Fig.5), whereas the Bb21m favors the insulator character for large U-term value, as we can observe for U 2.3 eV Fig.6 and Fig. S5 under LDA approximation.
The large difference in the U-term computed through the linear approximation with the values chosen a priory could be related to the DFT self-interaction errors or -ligand interactions between Ru and O atoms. To develop a U-Hubbard correction for the CRO system, it could be necessary to evaluate -interactions for first principles, then construct a Hamiltonian that explicitly contains the -orbitals and the -orbitals of the system as interacting degrees of freedom; however, to solve this in practice could be a tremendous open challengelong2020evaluating ; yu2014communication .
To enclose our last finding, we suggest that the optimum values of CRO lie among 0.2 U 2.0 eV (under LDA approximation); in this range, the band structure agrees with the experimental report. However, for U 1.4 eV, the band dispersion is strongly pushed to lower around the point. The established range of U are in agreement with the U implemented to modulate the electronic structure in several ruthenium family such as: Ca2RuO4 (1.0 U 1.5)keen2021ab , Sr2RuO4 (U 1.5 eV)iwasawa2010interplay , CaRuO3 (1.0 U 2.5 eV)zhong20104 in which both electronic and structural properties depend of the chosen U value.
V final remarks
We have evidenced the strong interplay among magnetism, SOC, U-Hubbard, and structural degrees of freedom on the electronic properties of CRO, considering two functional choices: LDA and PS approximations.
Depending on the level of theory, we find contradictory results. On the one hand, the LDA approximation fails to reproduce the correct magnetic ground state of CRO, predicting the AFM- solution as the most stable AFM configuration; however, the LDA+U approximation for U 0.2 eV results in the AFM- alignment as the ground state solution. On the other hand, PS and PS+U approximations successfully describe the AFM- magnetic configuration as the ground state.
Both LDA+U (0.2 U 2.0 ) and PS+U (0.5 U 1.6 eV) approximation successfully describe the electronic structure of CRO. However, regarding the structural properties, LDA predicts Bb21m phase as the ground state, and PS predicts a structural transition from Bb21m to Pb21a (U 1.4 eV), being this last one not evidenced by experiment so far. This new structural transition gives interesting explanations for describing several experimental findings, as explained in section-4. However, new experiments will be necessary to support the Pn21a structure evidenced using PS+U approximation.
We conclude that the exchange and correlation functional affects the band occupation mainly at -point. On the one hand, the band crosses the Fermi level for PS approximation. On the other hand, a band gap appears for the LDA approximation. Additionally, the primary effect of the Coulomb repulsion (expressed as U-term) is to modify the band occupation around the Fermi level with the following main characteristics associated with the exchange-correlation approximation:
PS+U: It is possible to distinguish three regions as the Hubbard-U term increases. The system exhibits a metallic character for U 1.4 eV, characterized by a band crossing the Fermi level at and Dirac-like bands at My. For U 1.4 eV, the Bb21m phase became unstable, and the system relaxes spontaneously into Pn21a structure, exhibiting a semimetallic state (gap around point) (independent of the structural degrees of freedom considered). Finally, for U 2.0 eV, a semimetal to a narrow bandgap insulator phase emerges by opening a gap of 0.16 eV at Mx (U 2.0 eV).
The observed structural transition is independent of the U approach; along Liechtenstein approach, we find that the transition emerges for U 2.0 eV together with an electronic transition from semi-metal to narrow-insulator state (in agreement with PS approximation for U 2.0 eV).
LDA+U: The Bb21m phase is the most stable configuration, and the band structure presents a semimetallic character. For 0.2 U 2.0 eV, we have evidenced a gap around (gap size of 96 meV at for U 0.5 eV) and Dirac-like bands at Mx in good agreement with the band structure reported by the experiments. However, for above U 1.4 eV, the band around is pushed down to lower energies increasing the gap size (as also happens with PS).
We remark that a narrow bandgap insulator state emerges independent of the functional choice. In the case of PS+U happening for U 2.0 eV (Dudarev scheme) and U 2.0 eV (Liechtenstein approach). For LDA+U occurring from U 2.0 eV (Dudarev scheme). Additionally, for these large U values, the magnetic moment along the direction became unstable, and goes from [010] to [111] direction in which mb ma,c.
From these findings, we can give keys to model the electronic structure of CRO system, establishing the effect of Coulomb repulsion and structural degrees of freedom for two different functional natures. Here we have evidenced that CRO is very sensitive to these parameters, in which, as a function of U, it is possible to get a metal, semimetal, and narrow bandgap insulator state independent of the structural degrees of freedom.
Depending on the functional choice Bb21m phase can be stable (LDA) or unstable (PS) in the presence of Coulomb repulsion, SOC and structural degrees of freedom.
The Hubbard repulsion term is usually considered a free parameter, adjusted to improve agreement between calculated and measured properties. This is one of the simplest approaches used to improve the description of the ground state of the many correlated systems, based on the correction of ELDA/GGA energies, leading to the called “double-counting term (Edc)” that models the contribution of correlated electrons to the DFT energy as a mean-field. However, the dc term is not uniquely defined, being this an open issue of LDA+U that has been widely discussed; see ref. ostlin2016electronic for further discussion. Some techniques, such as the linear response approach, can estimate a value for the effective U-term; these techniques, however, require further validation. Methods beyond DFT, such as Local Density approximation + Dynamical Mean-Field approximation (LDA+DMFT), have been successfully used to describe the electronic, structural properties and phase transitions in correlated materials with 4d electrons ostlin2016electronic , including Ruddlesden-Popper compounds ca-strain1 ; ca-strain2 . Studies in this direction could provide a better understanding of CRO, making it possible to compare different levels of theory on this compound. In this sense, there is still much to explore in CRO systems. In this direction, our study aims to give a first step forward, doing a systematic study of the role of the exchange and correlation in the presence of different degrees of freedom and considering different approximations for the Hubbard-U parameter.
While preparing this manuscript, we became aware of a recent experimental report by Hao-Yu et al. (ref. (47)) studying the magnetoresistance and magnetostriction on CRO. This study proposes the use of pulsed magnetic fields to control the magnetic states of CRO. Additionally, in agreement with our results, they reported the stability of magnetic phases (AFM-b, AFM-a) using PBEsol+U with eV. Furthermore, a recent experimental report has studied the CRO under lattice deformation (ref. (48)), evidencing that applied strain can be used to tune the spin orientation. These studies confirm the strong correlation between lattice and electronic degrees of freedom needed to reproduce the magnetic transitions of CRO.
VI acknowledgment
The authors would like to thank Igor Markovic and Jose Mejía for the fruitful discussions. We acknowledge the Max Planck Computing Data Facility for bringing the technical support and Dr. Claudia Felser for providing the VASP license. AL thanks to Chilean FONDECYT POSTDOCTORAL grant N. 3220505 and Dr. Danilo Puggioni for aiding with the calculation setup and discussions in the early stage of this project. JWG acknowledges financial support from FONDECYT: Iniciación en Investigación 2019 grant N. 11190934 (Chile) and USM complementary research grant.
References
- [1] Anjan Soumyanarayanan, Nicolas Reyren, Albert Fert, and Christos Panagopoulos. Emergent phenomena induced by spin–orbit coupling at surfaces and interfaces. Nature, 539(7630):509–517, 2016.
- [2] William Witczak-Krempa, Gang Chen, Yong Baek Kim, and Leon Balents. Correlated quantum phenomena in the strong spin-orbit regime. Annu. Rev. Condens. Matter Phys., 5(1):57–82, 2014.
- [3] K Kośmider, Jhon W González, and Joaquın Fernández-Rossier. Large spin splitting in the conduction band of transition metal dichalcogenide monolayers. Physical Review B, 88(24):245436, 2013.
- [4] Rasa Rejali, David Coffey, Jeremie Gobeil, Jhon W González, Fernando Delgado, and Alexander F Otte. Complete reversal of the atomic unquenched orbital moment by a single electron. npj Quantum Materials, 5(1):1–7, 2020.
- [5] Jhon W González, Tomás Alonso-Lanza, Fernando Delgado, Faustino Aguilera-Granja, and Andrés Ayuela. Complex magnetic orders in small cobalt–benzene molecules. Physical Chemistry Chemical Physics, 19(22):14854–14860, 2017.
- [6] G Cao, S McCall, JE Crow, and RP Guertin. Observation of a metallic antiferromagnetic phase and metal to nonmetal transition in Ca3Ru2O7. Physical Review Letters, 78(9):1751, 1997.
- [7] E Ohmichi, Y Yoshida, SI Ikeda, N Shirakawa, and T Osada. Colossal magnetoresistance accompanying a structural transition in a highly two-dimensional metallic state of Ca3Ru2O7. Physical Review B, 70(10):104414, 2004.
- [8] N Kikugawa, A Rost, F Baumberger, NJC Ingle, MA Hossain, W Meevasana, KM Shen, DH Lu, A Damascelli, AP Mackenzie, et al. Ca3Ru2O7: Electronic instability and extremely strong quasiparticle renormalisation. Journal of Magnetism and Magnetic Materials, 310(2):1027–1029, 2007.
- [9] Naoki Kikugawa, Andreas Winfried Rost, Clifford William Hicks, Andrew John Schofield, and Andrew Peter Mackenzie. Ca3Ru2O7: density wave formation and quantum oscillations in the hall resistivity. Journal of the Physical Society of Japan, 79(2):024704, 2010.
- [10] Gang Cao and Lance E Delong. Frontiers of 4D-and 5D-transition Metal Oxides, (Cap.1-pag.4). World Scientific, 2013.
- [11] Igor Marković, Matthew D Watson, Oliver J Clark, Federico Mazzola, Edgar Abarca Morales, Chris A Hooley, Helge Rosner, Craig M Polley, Thiagarajan Balasubramanian, Saumya Mukherjee, et al. Electronically driven spin-reorientation transition of the correlated polar metal Ca3Ru2O7. Proceedings of the National Academy of Sciences, 117(27):15524–15529, 2020.
- [12] Hui Xing, Libin Wen, Chenyi Shen, Jiaming He, Xinxin Cai, Jin Peng, Shun Wang, Mingliang Tian, Zhu-An Xu, Wei Ku, et al. Existence of electron and hole pockets and partial gap opening in the correlated semimetal Ca3Ru2O7. Physical Review B, 97(4):041113, 2018.
- [13] M Horio, Q Wang, V Granata, KP Kramer, Y Sassa, S Johr, D Sutter, A Bold, L Das, Y Xu, et al. Electronic reconstruction forming a C2-symmetric dirac semimetal in Ca3Ru2O7. npj Quantum Materials, 6(1):1–7, 2021.
- [14] DA Sokolov, N Kikugawa, T Helm, H Borrmann, U Burkhardt, R Cubitt, JS White, E Ressouche, M Bleuel, K Kummer, et al. Metamagnetic texture in a polar antiferromagnet. Nature Physics, 15(7):671–677, 2019.
- [15] Shiming Lei, Mingqiang Gu, Danilo Puggioni, Greg Stone, Jin Peng, Jianjian Ge, Yu Wang, Baoming Wang, Yakun Yuan, Ke Wang, et al. Observation of quasi-two-dimensional polar domains and ferroelastic switching in a metal, Ca3Ru2O7. Nano letters, 18(5):3088–3095, 2018.
- [16] Hengdi Zhao, Hao Zheng, Jasminka Terzic, Wenhai Song, Yifei Ni, Yu Zhang, Pedro Schlottmann, and Gang Cao. Lattice flexibility in Ca3Ru2O7: Control of electrical transport via anisotropic magnetostriction. Physical Review B, 104(12), Sep 2021.
- [17] Daniel Halwidl, Wernfried Mayr-Schmolzer, David Fobes, Jin Peng, Zhiqiang Mao, Michael Schmid, Florian Mittendorfer, Josef Redinger, and Ulrike Diebold. Ordered hydroxyls on Ca3Ru2O7 (001). Nature communications, 8(1):23, 2017.
- [18] Erik MJ Johansson, Michael Odelius, Stefan Plogmaker, Mihaela Gorgoi, Svante Svensson, Hans Siegbahn, and Håkan Rensmo. Spin- orbit coupling and metal- ligand interactions in Fe (II), Ru (II), and Os (II) complexes. The Journal of Physical Chemistry C, 114(22):10314–10322, 2010.
- [19] Martin Srnec, Jakub Chalupský, Miroslav Fojta, Lucie Zendlová, Ludek Havran, Michal Hocek, Mojmir Kyvala, and Lubomír Rulísek. Effect of spin-orbit coupling on reduction potentials of octahedral ruthenium (II/III) and osmium (II/III) complexes. Journal of the American Chemical Society, 130(33):10947–10954, 2008.
- [20] Yoshiyuki Yoshida, Shin-Ichi Ikeda, Hirofumi Matsuhata, Naoki Shirakawa, CH Lee, and Susumu Katano. Crystal and magnetic structure of Ca3Ru2O7. Physical Review B, 72(5):054412, 2005.
- [21] F Baumberger, NJC Ingle, N Kikugawa, MA Hossain, W Meevasana, RS Perry, KM Shen, DH Lu, A Damascelli, A Rost, et al. Nested fermi surface and electronic instability in Ca3Ru2O7. Physical Review Letters, 96(10):107601, 2006.
- [22] JS Lee, SJ Moon, BJ Yang, Jaejun Yu, U Schade, Y Yoshida, S-I Ikeda, and TW Noh. Pseudogap dependence of the optical conductivity spectra of Ca3Ru2O7: A possible contribution of the orbital flip excitation. Physical Review Letters, 98(9):097403, 2007.
- [23] G Cao, L Balicas, Y Xin, JE Crow, and CS Nelson. Quantum oscillations, colossal magnetoresistance, and the magnetoelastic interaction in bilayered Ca3Ru2O7. Physical Review B, 67(18):184405, 2003.
- [24] JF Karpus, CS Snow, R Gupta, H Barath, SL Cooper, and G Cao. Spectroscopic study of the field-and pressure-induced phases of the bilayered ruthenate Ca3Ru2O7. Physical Review B, 73(13):134407, 2006.
- [25] Matteo Cococcioni and Stefano De Gironcoli. Linear response approach to the calculation of the effective interaction parameters in the LDA+U method. Physical Review B, 71(3):035105, 2005.
- [26] David J Singh and Sushil Auluck. Electronic structure and bulk spin-valve behavior in Ca3Ru2O7. Physical Review Letters, 96(9):097203, 2006.
- [27] Guo-Qiang Liu. Mott transition and magnetic anisotropy in Ca3Ru2O7. Physical Review B, 84(23):235137, 2011.
- [28] Danilo Puggioni, M Horio, J Chang, and James M Rondinelli. Cooperative interactions govern the fermiology of the polar metal Ca3Ru2O7. Physical Review Research, 2(2):023141, 2020.
- [29] Georg Kresse and Jürgen Furthmüller. Efficiency of ab-initio total energy calculations for metals and semiconductors using a plane-wave basis set. Computational materials science, 6(1):15–50, 1996.
- [30] John P Perdew, Adrienn Ruzsinszky, Gábor I Csonka, Oleg A Vydrov, Gustavo E Scuseria, Lucian A Constantin, Xiaolan Zhou, and Kieron Burke. Restoring the density-gradient expansion for exchange in solids and surfaces. Physical Review Letters, 100(13):136406, 2008.
- [31] David M Ceperley and Berni J Alder. Ground state of the electron gas by a stochastic method. Physical Review Letters, 45(7):566, 1980.
- [32] GM Dongho Nguimdo and Daniel P Joubert. A density functional (PBE, PBEsol, HSE06) study of the structural, electronic and optical properties of the ternary compounds AgAlX2 (X= S, Se, Te). The European Physical Journal B, 88(5):1–10, 2015.
- [33] Sergei L Dudarev, Gianluigi A Botton, Sergey Y Savrasov, CJ Humphreys, and Adrian P Sutton. Electron-energy-loss spectra and the structural stability of nickel oxide: An lsda+ u study. Physical Review B, 57(3):1505, 1998.
- [34] AI Liechtenstein, Vladimir I Anisimov, and Jan Zaanen. Density-functional theory and strong interactions: Orbital ordering in mott-hubbard insulators. Physical Review B, 52(8):R5467, 1995.
- [35] Igor Markovic. Interplay of spin-orbit coupling and crystal symmetries in the electronic structures of NbGeSb and Ca3Ru2O7. Chapter 5 pages 83-88. PhD thesis, University of St Andrews, 2020.
- [36] Jacques K Desmarais, Jean-Pierre Flament, and Alessandro Erba. Spin-orbit coupling from a two-component self-consistent approach. II. non-collinear density functional theories. The Journal of Chemical Physics, 151(7):074108, 2019.
- [37] Jin Soo Lim, Diomedes Saldana-Greco, and Andrew M Rappe. Improved pseudopotential transferability for magnetic and electronic properties of binary manganese oxides from dft+ u+ j calculations. Physical Review B, 94(16):165151, 2016.
- [38] Kuang Yu and Emily A Carter. Communication: Comparing ab-initio methods of obtaining effective U parameters for closed-shell materials. The Journal of Chemical Physics, 140(12):121105, 2014.
- [39] Calculate U for LSDA+U. https://www.vasp.at/wiki/index.php/Calculate_U_for_LSDA+U.
- [40] Olivia Y Long, Gopalakrishnan Sai Gautam, and Emily A Carter. Evaluating optimal U for 3d transition-metal oxides within the SCAN+U framework. Physical Review Materials, 4(4):045401, 2020.
- [41] Harry DJ Keen, Stephen R Julian, and Andreas Hermann. Ab initio study of pressure-induced structural and electronic phase transitions in Ca2RuO4. Physical Review B, 104(8):085143, 2021.
- [42] H Iwasawa, Y Yoshida, I Hase, S Koikegami, H Hayashi, J Jiang, K Shimada, H Namatame, M Taniguchi, and Y Aiura. Interplay among coulomb interaction, spin-orbit interaction, and multiple electron-boson interactions in Sr2RuO4. Physical Review Letters, 105(22):226406, 2010.
- [43] GH Zhong, YL Li, Z Liu, and HQ Lin. 4 electronic and magnetic characteristics in postperovskite CaRuO3. Journal of Applied Physics, 107(9):09E102, 2010.
- [44] Andreas Östlin, Wilhelm H Appelt, Igor Di Marco, W Sun, M Radonjić, Michael Sekania, Levente Vitos, O Tjernberg, and Liviu Chioncel. Electronic structure of palladium in the presence of many-body effects. Physical Review B, 93(15):155152, 2016.
- [45] Christopher Dietl, SK Sinha, G Christiani, Y Khaydukov, T Keller, D Putzky, S Ibrahimkutty, P Wochner, G Logvenov, PA van Aken, , et al. Tailoring the electronic properties of ca2ruo4 via epitaxial strain. Applied Physics Letters, 112(3):031902, 2018.
- [46] Sara Riccò, Minjae Kim, Anna Tamai, S McKeown Walker, Flavio Yair Bruno, Irène Cucchi, Edoardo Cappelli, Cèline Besnard, Timur K Kim, Pavel Dudin, , et al. In situ strain tuning of the metal-insulator-transition of Ca2RuO4 in angle-resolved photoemission experiments. Nature Communications, 9(1):1–7, 2018.
- [47] Hao-Yu Niu, Xiong He, Zhuo Zeng, Yu-Jie Song, De-Quan Jiang, Hao Huang, You-Yuan Liang, Li-Xia Xiao, Zhong-Wen Ouyang, and Zheng-Cai Xia. Magnetoresistance relaxation steps originating from dynamic spin-orbital interactions in Ca3Ru2O7. Physical Review B, 106(17):174415, 2022.
- [48] CD Dashwood, A Walker, MP Kwasigroch, LSI Veiga, Q Faure, JG Vale, DG Porter, P Manuel, DD Khalyavin, F Orlandi, et al. Strain control of a bandwidth-driven spin reorientation in Ca3Ru2O7. arXiv preprint arXiv:2210.12555, 2022.
Supplemental Material: Ca3Ru2O7: Interplay among degrees of freedom and the role of the exchange-correlation
Andrea León,1,2,3 J. W. González,4, H. Rosner2
1Facultad de Física, Pontificia Universidad Católica de Chile, Santiago, Chile.
2 Max Planck Institute for Chemical Physics of Solids, Dresden, Germany.
3 Faculty for Chemistry, TU Dresden, Bergstrasse 66c, 01069 Dresden, Germany.
4 Departamento de Física, Universidad Técnica Federico Santa María, Casilla Postal 110V, Valparaíso, Chile.
The next sections, I and II, show the structural and electronic properties of CRO considering, in all the cases, spin-orbit interaction and different Hubbard-U parameters, magnetic states, and with and without structural degrees of freedom. Section III compares the main electronic and structural properties of CRO, considering two approximations to include U-Hubbard repulsion: Dudarev and Liechtenstein approach.
SI Structural properties
SI.1 Volume degrees of freedom.
Table S1 shows the lattice parameter in Å, Ru-O length in Å, octahedra volume and equilibrium volume in Å3 for PBEsol (PS), LDA approximation, and the values given by the experiment. Here, we can observe that LDA and PS approximation underestimate the volume by 4% and 1.44% , respectively. Table S2 shows the energy difference between AFM- and AFM- magnetic configuration (E= EAFM-a-EAFM-b) per Ru atom and the magnetic moment per Ru atom () for each magnetic phase (calculation considering U 0 eV) .
| a (Å) | b (Å) | c (Å) | Ru-O (Å) | V(RuO6) (Å3) | V0 (Å3) | |
|---|---|---|---|---|---|---|
| LDA | 5.292 | 5.458 | 19.427 | 1.965 | 10.09 | 556.72 |
| PS | 5.328 | 5.533 | 19.390 | 1.986 | 10.44 | 571.63 |
| Exp.[20] | 5.367 | 5.535 | 19.521 | 1.992 | 10.53 | 580.04 |
| Approximation | E (meV/Ru) | () |
|---|---|---|
| LDA | -3.644 | 0.28 |
| PS | 0.44625 | 1.34 |
| Exp[20] | AFM- | 1.8 |
SI.2 Hubbar-U and structural degrees of freedom.
Table S3 shows the equilibrium volume and magnetic moment for several U values for LDA and PS approximation.
Fig.S1 shows the RuO6 volume octahedra as U increases under positions and volume degrees of freedom (see equilibrium volume in the Table S3).
| U (eV) | 0 | 0.5 | 1.0 | 1.4 | 1.6 | |
|---|---|---|---|---|---|---|
| PS | Volume Cell (Å3) | 571.62 | 571.23 | 570.70 | 570.26 | 570.16 |
| m () | 1.35 | 1.38 | 1.41 | 1.40/1.44 | 1.38/1.48 | |
| LDA | Volume Cell (Å3) | 550.72 | 554.34 | 554.07 | 553.63 | 553.36 |
| () | 0.28 | 1.27 | 1.35 | 1.37 | 1.38 |
SII Electronic properties
SII.1 FM phase: positions degrees of freedom.
The total magnetic moment (M) by Ru atom (defined as M = total magnetic moment of the cell/Ru) as U increases is given by the Fig.S2.
SII.2 Band structure: positions degrees of freedom
Fig. S3 shows the density of states (DOS) along LDA and PS calculation at U 0 for PS and U 0.5 for LDA at the experimental volume.
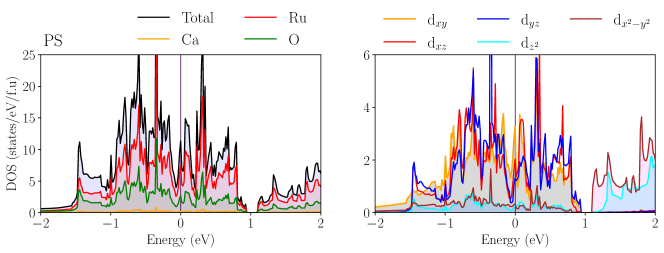
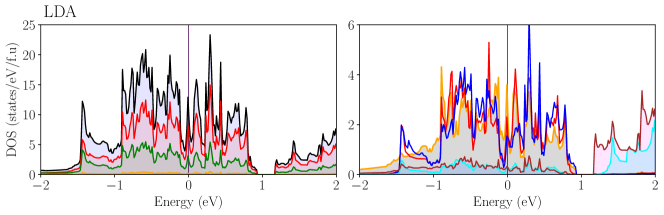
Fig. S4 (a) and (b) show the band structure for LDA calculation with AFM- and AFM- configuration considering U = 0 eV at the experimental volume.
In the following the displayed -partial band structure have a percentage of occupation between 50-75% per each orbital; these correspond to
dxy, dxz and dyz, the dx2-y2 and dz2 represent less than 25% of occupation then they are not shown. The back point displays the hybridized t2g orbitals representing between 0-25% of the occupation per band (Fig. S5, S6, S9).
Fig. S5 shows the electronic band structure performed in the phase Bb21m for several U values. Along with LDA approximation. Here we can observe that the -electronic band distribution changes slightly to increase the U-term. Along My- bands are pushed to high energies inducing a band distribution, helping the occupation of the dxz orbitals, which slightly hybridize with the dxy orbitals just below the Fermi level. Around point, we can observe that the dxy contribution decreases, and these states become more hybridized with dyz orbitals below the Fermi level. Additionally, these bands are strongly pushed toward lower energies. At Mx, the Dirac-like bands move towards the Fermi level, favoring the occupation of dyz orbitals. Finally, from Mx-X, we can observe that these states are slightly pushed below the Fermi level. These bands are rather modified because they are mainly composed of dxy-orbitals being close to integer filling and then exhibiting a lower grade of hybridization. Furthermore, we have included the band structure at U 2.3 eV (U computed using the perturbative approach [25]). For this U value, we can observe that a band gap of 0.25 eV emerges at Mx arising the transition from metal to a narrow bandgap insulator. Together with the transition, we can observe a -orbital re-ordering mainly at Mx in which the dominant bands are mainly dxz-dxy.
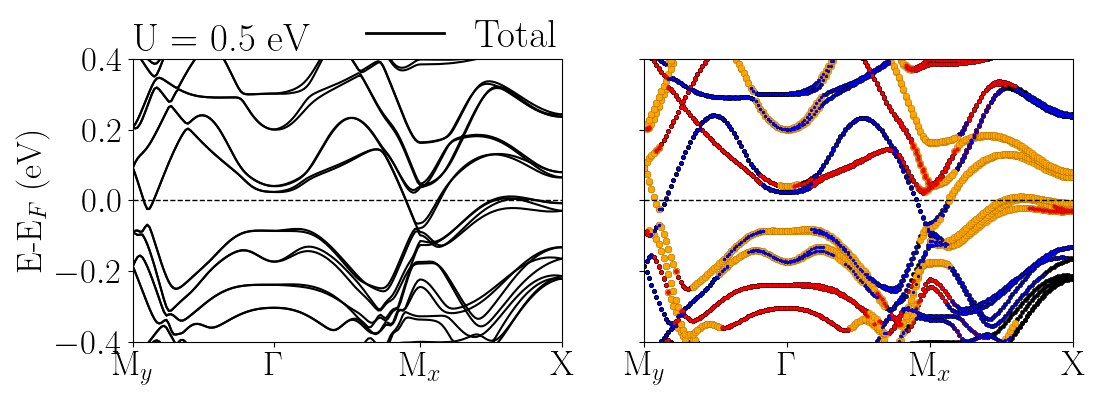
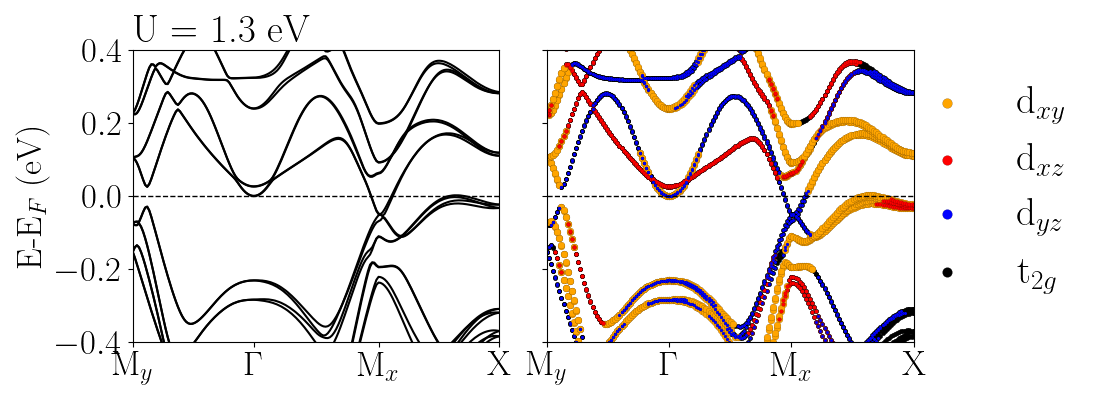
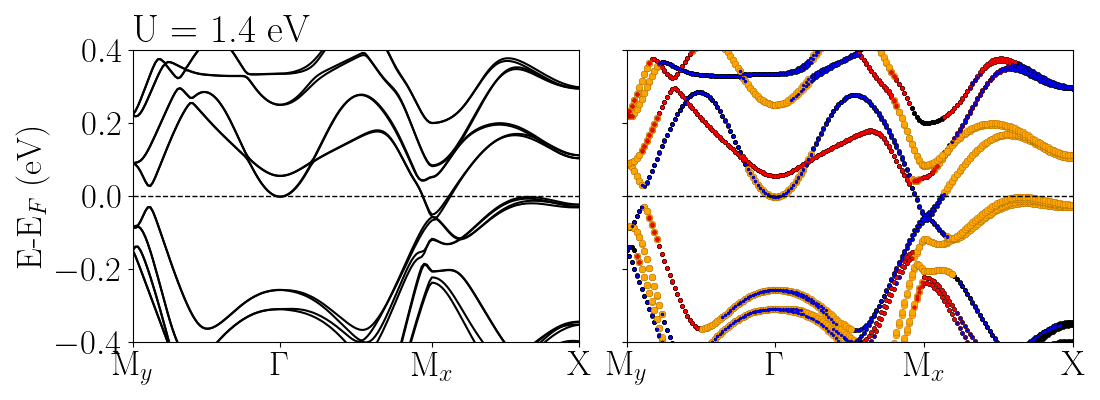
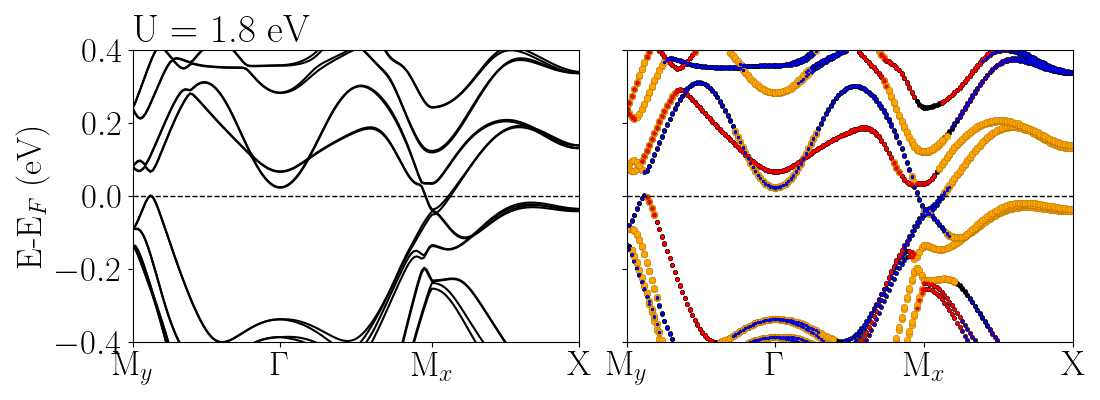
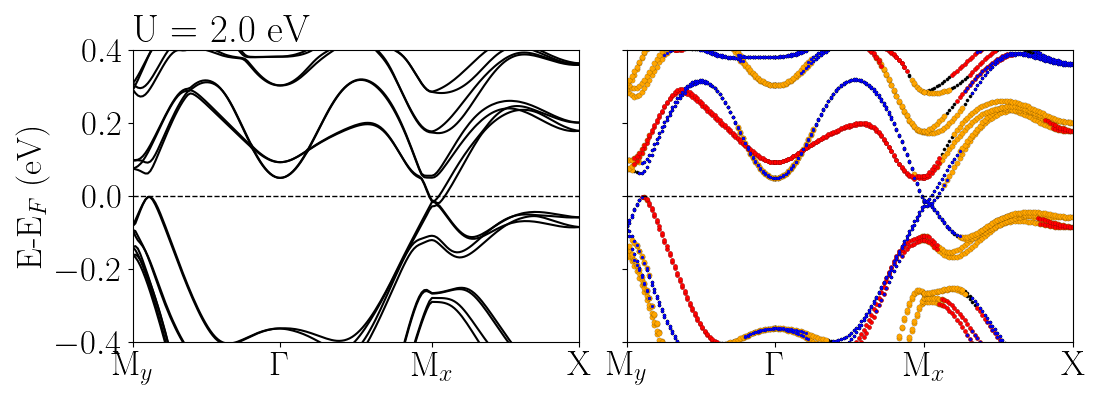
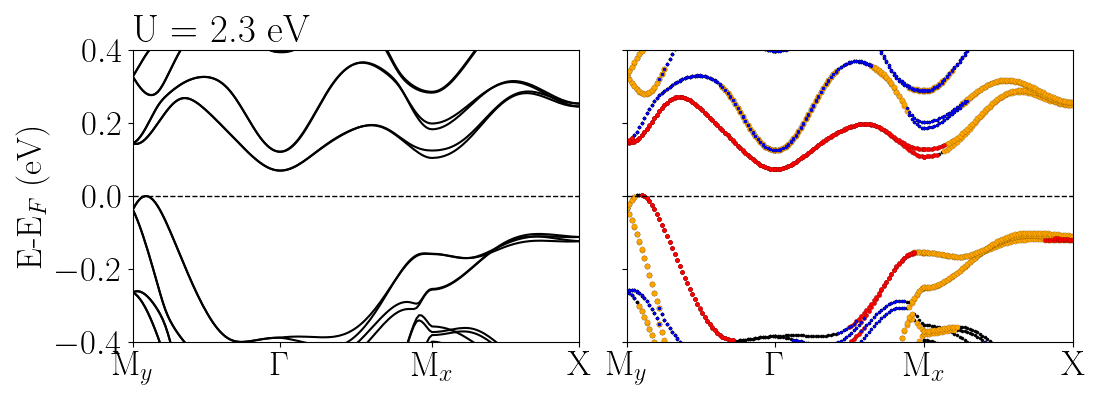
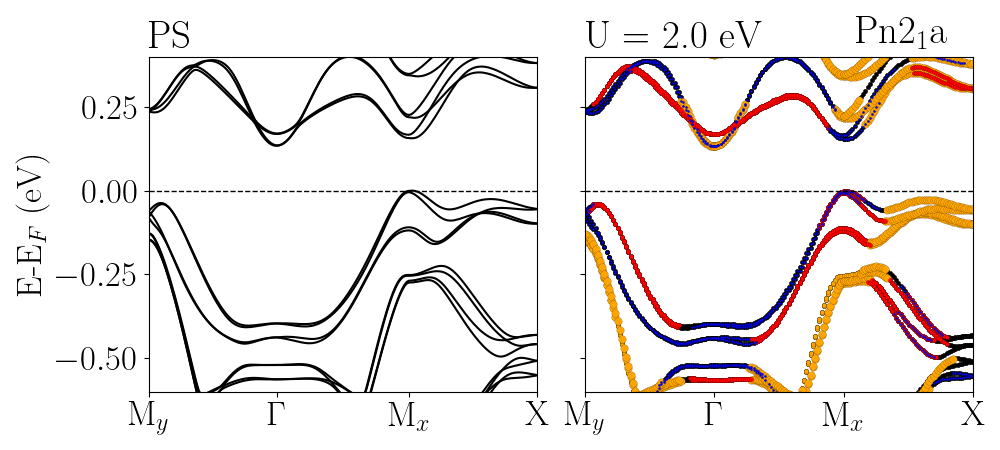
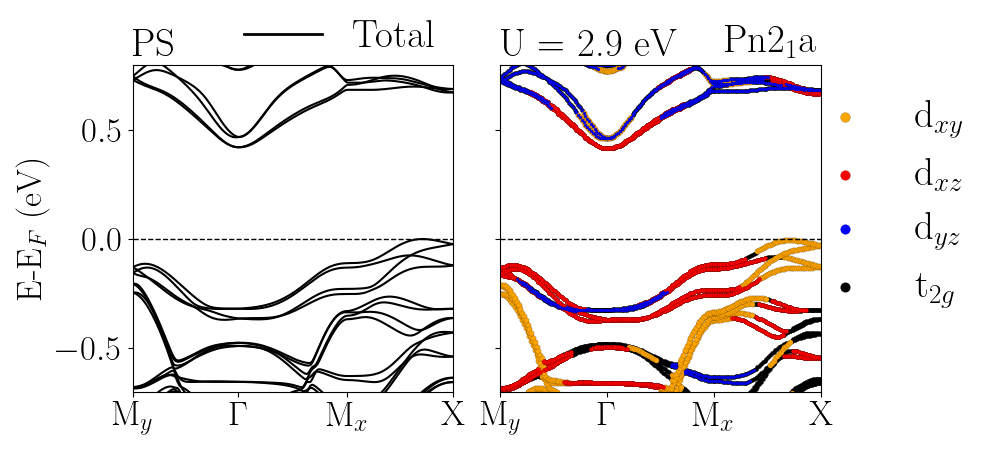
Fig. S6 shows the total bands and partial -band structure along with PS approximation for the U value in which happens the electronic transition from semimetal to a narrow bandgap insulator (U 2.0 eV) with Pn21a structure with a gap of 0.18 eV at Mx. Here, we can observe that around Mx appears a grade of hybridization between dxz and dyz orbitals. To increase the U to 2.9 eV (U computed using the perturbative approach), we can observe that the gap increases to 0.80 eV at Mx. The bands around this point are mainly composed of dxz orbitals.
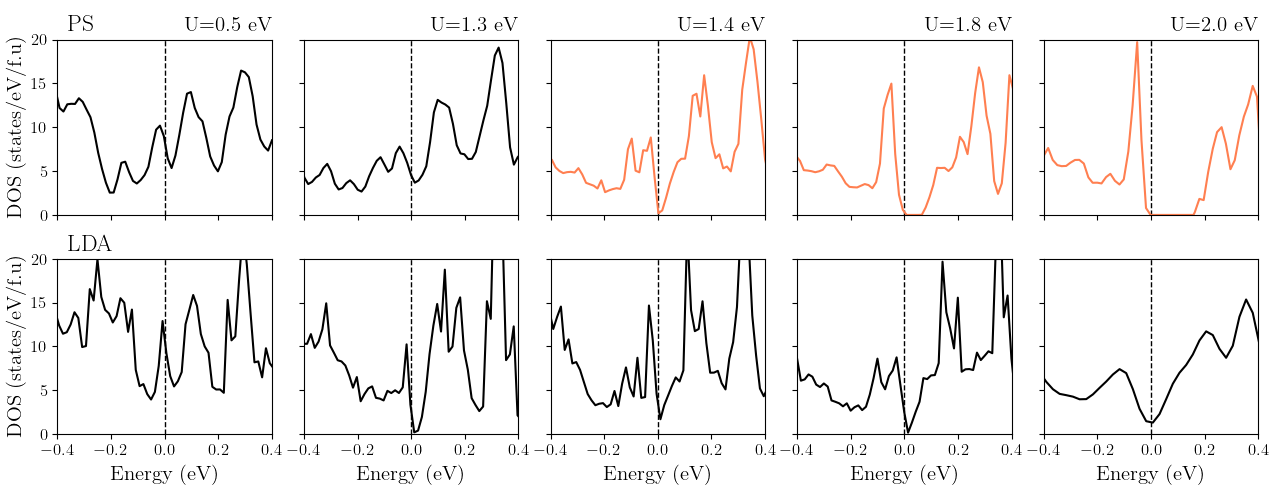
Fig. S7 shows the total density of state (DOS) in a window of [-0.4,0.4] eV. For PS approximation, we can observe that for U= 0.5 and 1.3 eV, the system exhibits a metallic state with Bb21m structure. When U increases to 1.4 eV-1.8 eV, the DOS at the Fermi level decreases, being close to 0, giving a nearly semimetallic character along with a Pn21a phase. For U= 2.0 eV is observed a gap opening at the Fermi level of 0.16 eV. In the case of LDA approximation, as U increases, we can see a diminution of the states around the Fermi level; however, the system continues in a metallic phase with Bb21m structure.
SII.3 Band structure: without structural degrees of freedom
Fig. S8 shows the electronic band structure performed in the Bb21m structure (with the position reported by the experiment at 8 K[20]) for several U values without considering the lattice degrees of freedom. Here we can observe that the role of U is to control the band occupation mainly around the point (above and below the Fermi level). Furthermore, we evidence that without degrees of freedom, the band opening at Mx at U 2.0 eV does not emerge for PS approximation (see Fig. 4 main text).
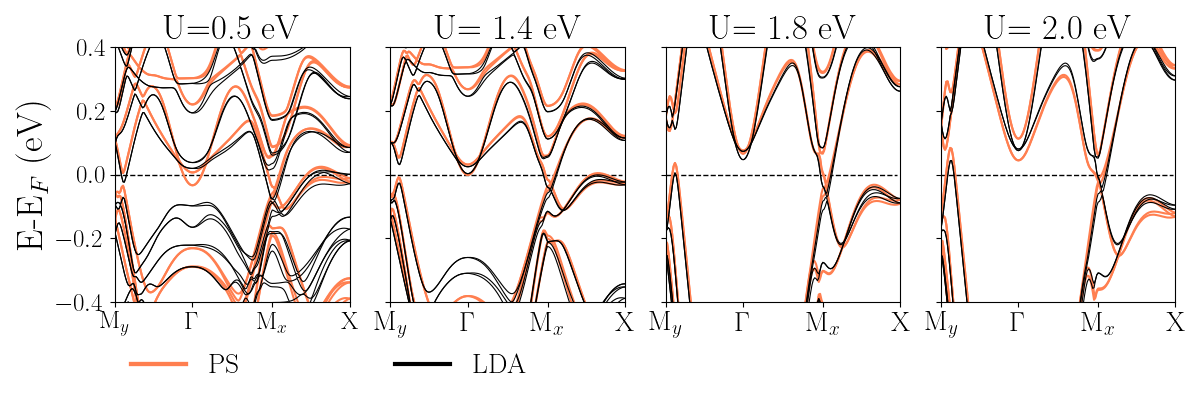
Fig. S9 shows the total band and partial -band along with PS and LDA approximation, with U 2.3 eV, considering Bb21m structure without considering structural degrees of freedom. Here we can observe that for both PS and LDA approximation emerges, a gap at Mx; however, the system continues in a metallic state. To increase U to 2.6 eV, we can observe that the system became a narrow bandgap insulator in the case of LDA. Instead, along PS, the system goes toward a metallic state.
SII.4 Band structure: structural degrees of freedom.
Fig. S10 and S11 shows the band structure of CRO in the Bb21m structure (with the position reported by the experiment at 8 K[20]) for PS and LDA approximation, respectively, considering positions (left panel) and volume (right panel) degrees of freedom in the calculation. The calculations were performed for selected U values (U = 0, 0.5, 1.3, 1.4 and 1.6 eV).
SIII Dudarev and Liechtenstein approach.
Fig. S12 shows the octahedra volume and magnetic moment by Ru atoms as U-Hubbard increases, along two approximations Dudarev and Liechtenstein approaches. Here, we can observe that the electronic changes associated with the phase transition appear independent of the method, happening U 1.4 and U 2.0 for Dudarev and Liechtenstein, respectively.