[a,b,c]Etsuko Itou
Bump of sound velocity in dense 2-color QCD
Abstract
We obtain the equation of state (EoS) and the sound velocity for 2-color QCD at low temperature and high density and find that in the superfluid phase, , where is the value at the relativistic limit. Several independent Monte Carlo studies on 2-color QCD have been conducted intensively in recent years. These works have shown a clear evidence of phase transition between hadronic and superfluid phases. In our paper [1], we have investigated the EoS and sound velocity in both phases. Our result is consistent with chiral perturbation theory in a low regime of the superfluid phase including the Bose-Einstein condensed phase, and shows a peak of sound velocity in the high-density BCS phase. We also give detailed simulation results and a comment on the holography bound in this proceedings.
1 Introduction
Determination of the equation of state (EoS) for dense QCD at low temperature has been desired recently especially because it is related with understanding neutron star observations including recent simultaneous measurements of masses and radii of neutron stars. However, the first-principles calculation of dense QCD at low temperature, beyond the onset scale () in particular, is still extremely difficult because of the severe sign problem. On the other hand, the sign problem is absent in even-flavor dense -color QCD because of the pseudo-reality of fundamental quarks. Furthremore, if we add an external source term of the diquark condensate to explicitly break the U(1) baryon symmetry, we can perform numerical simulations using an exact algorithm even beyond the onset scale, namely, in the superfluid phase. -color QCD at zero chemical potential exhibits the same properties as -color QCD, e.g., confinement, spontaneous chiral symmetry breaking, and thermodynamic behaviors. It is expected that -color QCD even at non-zero chemical potential could be a good testing ground in qualitatively understanding dense QCD.
Based on this motivation, several Monte Carlo studies on -color QCD have been conducted independently and intensively in recent years (see references in Ref. [1]). One can conclude that the -color QCD phase diagram has been quantitatively clarified; even at fairly high temperature, MeV, superfluidity can remain.
Now, we would like to focus on the EoS and the sound velocity in a low temperature and high density regime. Several early works based on a phenomenological quark-hadron crossover picture of neutron star matter [2, 3] suggested that the zero-temperature sound velocity squared, , peaks in – to be consistent with various observational constraints. Here, , and denote the pressure, internal energy density of the system, and nuclear saturation density, respectively. More recently, based on a quarkyonic matter model, McLerran and Reddy [4] have shown that the peak appears at –. Furthermore, Kojo [5] proposed a microscopic interpretation on the origin of the peak based on a quark saturation mechanism, which is supposed to work for any number of colors. Actually, Kojo and Suenaga [6] argued that a similar peak of emerges not only in -color QCD, but also in -color QCD.
2 Lattice setup
The lattice gauge action used in this work is the Iwasaki gauge action As for the fermion action, we take the naive Wilson fermion with the quark number density and diquark source terms,
| (5) |
where Here, the indices of denote the label of the flavor, and the is the Wilson-Dirac operator with the number operator. The additional parameter corresponds to the diquark source parameter, which allows us to perform the numerical simulation in the superfluid phase. Note that , where is a source parameter in the corresponding continuum theory, and is the hopping parameter. The in is the charge conjugation operator, and acts on the color index. The square of the extended matrix () can be diagonal, but corresponds to the fermion action for the four-flavor theory, since a single in Eq. (LABEL:eq:def-M) represents the fermion kernel of the two-flavor theory. To reduce the number of fermions, we take the root of the extended matrix in the action. In practice, utilizing the Rational Hybrid Monte Carlo (RHMC) algorithm, we can generate gauge configurations.
In this work, we perform the simulation with . According to Ref. [7], once we introduce the physical scale as MeV, where denotes the pseudo-critical temperature of chiral phase transition at , then our parameter set, and (), corresponds to fm and MeV. The mass of the lightest pseudo-scalar (PS) meson at , , is still heavy in our simulations, ( MeV). As for the values of , we generate the configurations at intervals of . The number of configuration for each parameter is –. The statistical errors are estimated by the jackknife method.
3 Phase structure at MeV
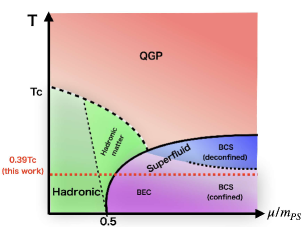
We show the schematic phase structure in Fig. 1 and summarize the definition of each phase in Table 1, which is an extract from Ref. [8].
 |
| Hadronic | Superfluid | |||
| Hadronic matter | BEC | BCS | ||
| zero | zero | |||
| zero | zero | non-zero | non-zero | |
| zero | non-zero | |||
The order parameters that help classify the phases are the Polyakov loop and diquark condensate , whose zero/nonzero values indicate the appearance of confinement and superfluidity, respectively. We found that the superfluidity emerges at as predicted by the chiral perturbation theory (ChPT) [9]. It is natural to use as a dimensionless parameter of density since the critical value can be approximated by even if the value of in numerical simulation would be changed 111It is expected that the corresponding critical value of would be if the hadronic-superfluid phase transition occurs also in the case of -color QCD, where denotes the nucleon mass. . We also confirmed that the scaling law of the order parameter around it is consistent with the ChPT prediction. Furthermore, we measured the quark number operator, . We identified the regime where is consistent with the free quark theory (see Eq. (26) in Ref. [10]) as the BCS phase. Thus, we concluded that there are hadronic, hadronic-matter, Bose-Einstein condesed (BEC) and BCS phases at MeV, although there is no clear boundary between the BEC and BCS phases. Interestingly, up to ( MeV), the confining behavior remains [11], while nontrivial instanton configurations have been discovered from calculations of the topological susceptibility [8]. It indicates that a naive perturbative picture, for instance, pQCD, is not yet valid in the density regime studied here.
4 Equation of state and velocity of sound at finite
Now, we utilize a fixed scale method to obtain the EoS at finite density [10]. The trace anomaly can be described by the beta-functions of various parameters and the trace part of the energy-momentum tensor. In our lattice setup, which is explicitly given by
Here, is the lattice spacing, and the beta-function for each parameter is evaluated at along the line of constant physics (LCP). Note that there is no renormalization for the quark number density as it is a conversed quantity. We take all physical observables in the limit, which implies that the third term in the right side can be eliminated. denotes the subtraction of the vacuum quantity. Thus, ideally, we should take , but the exact zero-temperature simulations is practically difficult. In this work, we take .
Utilizing the scale setting function (Eq. (23)) and a set of with a fixed mass ratio of pseudoscalar and vector mesons (Table ) in Ref. [7], the coefficients can be nonperturbatively determined as
| (8) |
5 Simulation results
The first term of the RHS in Eq. (LABEL:eq:trace-anomaly) is given by the measurement of the gauge action. The raw data are plotted in the left panel of Fig. 2.
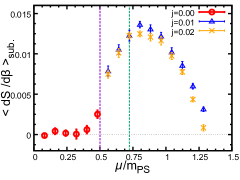
We find that they are consistent with zero in the hadronic phase (except for near the phase transition point), while increasing in the BEC phase and then decreasing in the BCS phase. Although we have determined the phase structure by the measurement of several physical observables in each phase as defined in Table 1, the results for indicate that from the value of gauge action during the configuration generation, we can estimate where the hadronic-superfluid phase transition and the BEC-BCS crossover occur. Furthermore, we can see that the -dependence is mild, so that we take the constant extrapolations of the and data in the superfluid phase.
The second term of the RHS in Eq. (LABEL:eq:trace-anomaly) is given by
| (9) |
Thus, we measure the chiral condensate. To obtain the extrapolated value at , we perform the reweighting of and take the linear extrapolation (see Fig.8 in Ref. [8]).
The pressure can be expressed by the integral of the number density over in the thermodynamic limit. On the lattice, two schemes with different discretization errors have been proposed in Ref. [10]:
| (10) | |||||
| (11) |
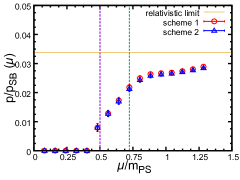
Here, denotes the pressure value at the Stefan-Boltzman (SB) limit, which is obtained by the numerical integration of the number density of quarks in the relativistic limit. represents the onset scale, namely, the starting point at which becomes nonzero as increases. In the continuum theory, the pressure scales as in the high regime, where () is the number of flavors (colors)
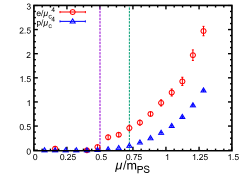
The simulation results are plotted in the right panel in Fig. 2. First of all, we can see that the scheme dependence of is negligible. It indicates that the discretization effect of our simulation is small. At for the hadronic-superfluid phase transition (purple vertical line), takes a nonzero value since becomes nonzero in the hadronic-matter phase. Thus, becomes nonzero before the hadronic-superfluid phase transition, then is not the same as . The low but finite temperature effects cause the discrepancy between them as discussed in [8]. We can see that our data monotonically increase and approach the value in the relativistic limit. The value of is at the highest density in our simulation.
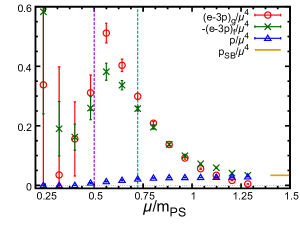
The trace anomaly and pressure (Scheme II) are shown in Fig. 3. For the trace anomaly, we plot the gauge part (the first term in Eq. (LABEL:eq:trace-anomaly)) and minus the fermion part (the second term) separately. Both parts are normalized by to see the dimensionless asymptotic behavior. The magnitude of each part has a peak around the hadronic-superfluid phase transition. It is very similar to the emergence of the peak of around the hadronic-QGP phase transition at .
Combining the data of and obtained above, we finally obtain the EoS and sound velocity in Fig. 4. In the left panel, we normalize and by so as to be dimensionless. We can see that both and are consistent with zero in the hadronic phase. Thus, these thermodynamic quantities are not changed even if increases before the hadronic-superfluid phase transition. Note that in hadronic phase indicates that the nonperturbative beta-functions of and given by Eq. (8) work well enough to make the parts of trace anomaly, and , cancel each other.
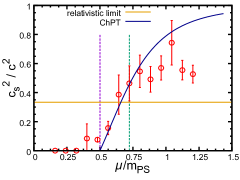
Now, let us focus on the sound velocity depicted in the right panel in Fig. 4. Here, we evaluate , where and are estimated by the symmetric finite difference, i.e., . First of all, our results are consistent with the prediction of ChPT [12, 10], which is given by , in the BEC phase. We also find that is larger than , which is the value in the relativistic limit, at higher densities than the regime where the BEC-BCS crossover occurs. Eventually, our data seem to peak around and, as density increases further, decrease so as to go away from the ChPT prediction. Such a peak of the sound velocity is a characteristic feature previously unknown from any lattice calculations for QCD-like theories. For example, in the finite temperature case, the sound velocity monotonically increases in and approaches the relativistic limit as the temperature increases [13, 14].
Here, we give a comment on the holography bound. It is a conjecture that is satisfied for a broad class of four-dimensional theories proposed by Ref. [15]. The paper itself studies the finite temperature case in the context of holography. Our result from the first-principles calculation shows that the bound is broken in the case of finite density. Furthermore, the counterexamples consisting of strongly coupled theories at finite density are also known in the context of holography [16].
6 Summary and discussion
It is strongly believed that at ultrahigh density, approaches the relativistic limit. Then, there arises a question of how it approaches . According to the pQCD analysis (see Appendix A in [17]), it scales as , where denotes the -loop coefficient of the beta-function. Thus, approaches the asymptotic value from below. On the other hand, a result based on the resummed perturbation theory suggests that approaches the limit from above [18]. In the numerical simulations, the maximum value of is limited by to avoid the strong lattice artefact. Otherwise, the hopping term of fermions would be partially suppressed by the factor in the Wilson-Dirac operator. For the extension to larger chemical potential, we need to perform smaller lattice spacing or lighter quark mass simulations. Furthermore, to obtain at , it is also required to see the EoS in the lower temperature regime by carrying out larger volume simulations.
According to Ref. [5], a peak of appears due to the development of the quark Fermi sea just after the saturation of low momentum quarks. The density at which the peak appears in our results is apparently low, i.e., , but seems sufficiently high that the quark Fermi sea would be fully developed. It supports the predictions from several effective models based on the presence of the quark Fermi sea [4, 5, 6]. Furthermore, it is reported that the peak of sound velocity emerges around BEC-BCS crossover also in condensed matter systems with finite-range interactions [19]. To ask whether or not the emergence of the peak structure is a universal property of superfluids in a BEC-BCS crossover regime, it would be important to investigate the origin of this structure as another future work. If the peak of sound velocity would be a universal property even for real -color QCD as discussed in Refs. [5, 6], then it will change a conventional picture that a first order transition from stiffened hadronic matter to soft quark matter is responsible for the presence of massive neutron stars.
Acknowledgments
We would like to thank T. Hatsuda, T. Kojo, T. Saito, D. Suenaga, H. Tajima and H. Togashi for useful conversations. We are grateful to S. Hands and J.-I. Skullerud for calling our attention to erroneous data in the earlier version of the manuscript. The consistency with ChPT was kindly suggested by N. Yamamoto. E. I. especially thanks T. Kojo T. Hatsuda and H. Togashi for fruitful discussions about the origin of peak, the pQCD analysis and the correspondence between the lattice data and neutron-matter analysis. Discussions in the working group “Gravitational Wave and Equation of State" in iTHEMS, RIKEN was useful for completing this work. The work of E. I. is supported by JSPS KAKENHI with Grant Number 19K03875, JST PRESTO Grant Number JPMJPR2113 and JSPS Grant-in-Aid for Transformative Research Areas (A) JP21H05190, and the work of K. I. is supported by JSPS KAKENHI with Grant Numbers 18H05406 and 18H01211. The numerical simulation is supported by the HPCI-JHPCN System Research Project (Project ID: jh220021).
References
- [1] K. Iida and E. Itou, “Velocity of Sound beyond the High-Density Relativistic Limit from Lattice Simulation of Dense Two-Color QCD,” arXiv:2207.01253 [hep-ph].
- [2] K. Masuda, T. Hatsuda, and T. Takatsuka, “Hadron–quark crossover and massive hybrid stars,” Prog Theor Exp Phys 2013 no. 7, (July, 2013) 073D01.
- [3] G. Baym, T. Hatsuda, T. Kojo, P. D. Powell, Y. Song, and T. Takatsuka, “From hadrons to quarks in neutron stars: a review,” Rept. Prog. Phys. 81 no. 5, (2018) 056902, arXiv:1707.04966 [astro-ph.HE].
- [4] L. McLerran and S. Reddy, “Quarkyonic matter and neutron stars,” Phys. Rev. Lett. 122 no. 12, (Mar., 2019) 122701.
- [5] T. Kojo, “Stiffening of matter in quark-hadron continuity,” Phys. Rev. D 104 no. 7, (2021) 074005, arXiv:2106.06687 [nucl-th].
- [6] T. Kojo and D. Suenaga, “Peaks of sound velocity in two color dense QCD: quark saturation effects and semishort range correlations,” Phys. Rev. D 105 no. 7, (2022) 076001, arXiv:2110.02100 [hep-ph].
- [7] K. Iida, E. Itou, and T.-G. Lee, “Relative scale setting for two-color QCD with =2 Wilson fermions,” PTEP 2021 no. 1, (2021) 013B05, arXiv:2008.06322 [hep-lat].
- [8] K. Iida, E. Itou, and T.-G. Lee, “Two-colour QCD phases and the topology at low temperature and high density,” JHEP 01 (2020) 181, arXiv:1910.07872 [hep-lat].
- [9] J. B. Kogut, M. A. Stephanov, D. Toublan, J. J. M. Verbaarschot, and A. Zhitnitsky, “QCD-like theories at finite baryon density,” Nucl. Phys. B 582 (2000) 477–513, arXiv:hep-ph/0001171.
- [10] S. Hands, S. Kim, and J.-I. Skullerud, “Deconfinement in dense 2-color QCD,” Eur. Phys. J. C 48 (2006) 193, arXiv:hep-lat/0604004.
- [11] K. Ishiguro, K. Iida, and E. Itou, “Flux tube profiles in two-color QCD at low temperature and high density,” in 38th International Symposium on Lattice Field Theory. 11, 2021. arXiv:2111.13067 [hep-lat].
- [12] D. T. Son and M. A. Stephanov, “QCD at a finite isospin density: From the pion to quark-antiquark condensation,” Physics of Atomic Nuclei 64 no. 5, (May, 2001) 834–842. https://doi.org/10.1134%2F1.1378872.
- [13] S. Borsanyi, Z. Fodor, C. Hoelbling, S. D. Katz, S. Krieg, and K. K. Szabo, “Full result for the QCD equation of state with 2+1 flavors,” Phys. Lett. B 730 (2014) 99–104, arXiv:1309.5258 [hep-lat].
- [14] HotQCD Collaboration, A. Bazavov et al., “Equation of state in ( 2+1 )-flavor QCD,” Phys. Rev. D 90 (2014) 094503, arXiv:1407.6387 [hep-lat].
- [15] A. Cherman, T. D. Cohen, and A. Nellore, “A Bound on the speed of sound from holography,” Phys. Rev. D 80 (2009) 066003, arXiv:0905.0903 [hep-th].
- [16] C. Hoyos, N. Jokela, D. Rodríguez Fernández, and A. Vuorinen, “Breaking the sound barrier in AdS/CFT,” Phys. Rev. D 94 no. 10, (2016) 106008, arXiv:1609.03480 [hep-th].
- [17] T. Kojo, G. Baym, and T. Hatsuda, “QHC21 equation of state of neutron star matter – in light of 2021 NICER data,” arXiv:2111.11919 [astro-ph.HE].
- [18] Y. Fujimoto and K. Fukushima, “Equation of state of cold and dense QCD matter in resummed perturbation theory,” Phys. Rev. D 105 no. 1, (2022) 014025, arXiv:2011.10891 [hep-ph].
- [19] H. Tajima and H. Liang, “Role of the effective range in the density-induced bec-bcs crossover,” Phys. Rev. A 106 (Oct, 2022) 043308.