Reading Between the Lines: Modeling User Behavior and Costs in AI-Assisted Programming
Code-recommendation systems, such as Copilot and CodeWhisperer, have the potential to improve programmer productivity by suggesting and auto-completing code. However, to fully realize their potential, we must understand how programmers interact with these systems and identify ways to improve that interaction. To make progress, we studied GitHub Copilot, a code-recommendation system used by millions of programmers daily. We developed CUPS, a taxonomy of common programmer activities when interacting with Copilot. Our study of 21 programmers, who completed coding tasks and retrospectively labeled their sessions with CUPS, showed that CUPS can help us understand how programmers interact with code-recommendation systems, revealing inefficiencies and time costs. Our insights reveal how programmers interact with Copilot and motivate new interface designs and metrics.
1 Introduction
Programming-assistance systems based on the adaptation of large language models (LLMs) to code recommendations have been recently introduced to the public. Popular systems, including Copilot Github [2022], CodeWhisperer Amazon [2022], and AlphaCodeLi et al. [2022], signal a potential shift in how software is developed. Though there are differences in specific interaction mechanisms, the programming-assistance systems generally extend existing IDE code completion mechanisms (e.g., IntelliSense 111https://code.visualstudio.com/docs/editor/intellisense) by producing suggestions using neural models trained on billions of lines of code Chen et al. [2021]. The LLM-based completion models are able to suggest sentence-level completions to entire functions and classes in a wide array of programming languages. These large neural models are deployed with the goal of accelerating the efforts of software engineers, reducing their workloads, and improving their productivity.
Early assessments suggest that programmers do feel more productive when assisted by the code recommendation models Ziegler et al. [2022] and that they prefer these systems to earlier code completion engines Vaithilingam et al. [2022]. In fact, a recent study from GitHub, found that CoPilot could potentially reduce task completion time by a factor of two Kalliamvakou [2022]. While these studies help understand the benefits of code-recommendation systems, they do not allow us to identify avenues to improve and understand the nature of interaction with these systems.
In particular, the neural models introduce new tasks into a developer’s workflow such as writing AI prompts Jiang et al. [2022] and verifying AI suggestions Vaithilingam et al. [2022], which can be lengthy. Existing interaction metrics such as suggestion acceptance rates, time to accept (i.e., the time a suggestion remains onscreen), and reduction of tokens typed, tell only part of this interaction story. For example, when suggestions are presented in monochrome pop-ups (Figure 1), programmers may choose to accept them into their codebases so that they can be read with code highlighting enabled. Likewise, when models suggest only one line of code at a time, programmers may accept sequences before evaluating them together as a unit. In both scenarios, considerable work verifying and editing suggestions occurs after the programmer has accepted the recommended code. Prior interaction metrics also largely miss user effort invested in devising and refining prompts used to query the models. When code completions tools are evaluated using coarser task-level metrics such as task completion time Kalliamvakou [2022], we begin to see signals of the benefits of AI-driven code completion but lack sufficient detail to understand the nature of these gains, as well as possible remaining inefficiencies. We argue that an ideal approach would be sufficiently low level to support interaction profiling, while sufficiently high level to capture meaningful programmer activities.
Given the nascent nature of these systems, numerous questions exist regarding the behavior of their users, e.g., what activities do users undertake in anticipation for, or to trigger a suggestion? What mental processes occur while the suggestions are onscreen, and, do people double-check suggestions before or after acceptance? How costly for users’ are these various new tasks, and which take the most time and effort? To answer these and related questions in a systematic manner, we apply a mixed-methods approach to analyze interactions with a popular code suggestion model, GiHub Copilot 222https://github.com/features/copilot with more than a million users. To emphasize that our analysis is not restricted to the specifics of Copilot, we use the term CodeRec to refer to any instance of code suggestion models including Copilot. We begin by introducing a taxonomy of common states of a programmer when interacting with CodeRec, which we refer to as CodeRec User Programming States (CUPS). The taxonomy was developed through the authors’ knowledge of Copilot’s implementation, first-hand experience using Copilot for development, and small-scale pilot studies.
Given the initial taxonomy, we conducted a user study with 21 developers who were asked to retrospectively review videos of their coding sessions and explicitly label their intents and actions using this model, with an option to add new states if necessary. The study participants labeled a total of 3137 coding segments and interacted with 1024 suggestions. The study confirmed that the taxonomy was sufficiently expressive, and we further learned transition weights and state dwell times —something we could not do without this experimental setting. Together, these data can be assembled into various instruments, such as the CUPS diagram (Figure 1), to facilitate profiling interactions and identify inefficiencies. Moreover, we show that such analysis nearly doubles the amount of developer time that can be attributed to interactions with code suggestion systems, as compared with existing metrics. We believe that identifying the current CUPS state during a programming session can help serve programmer needs. This can be accomplished using custom key-board macros or automated prediction of CUPS states as discussed in [Mozannar et al., 2023]. Overall we leverage the CUPS diagram to identify some opportunities to address inefficiencies in the current version of CodeRec.
In sum, we contribute:
-
1.
A novel taxonomy of common activities of programmers (called CUPS) when interacting with code recommendation systems.
-
2.
A user study where programmers retrospectively label their activities with our taxonomy using a tool we developed. The study generated a new dataset of coding sessions annotated with user actions, CUPS, and video recordings available publicly.
-
3.
A new instrument for measuring and analyzing patterns in user behavior, time spent in different states, and adjustments required for better estimating the time impact of code-generation tools. 333A previous version of this work discusses the prediction of behavior, this work can now be found in [Mozannar et al., 2023]
The remainder of this paper is structured as follows: We first review related work on AI-assisted programming (Section 2) and formally describe Copilot, along with a high-level overview of programmer-CodeRec interaction (Section 3). To further understand this interaction, we define our model of CodeRec User Programming States (CUPS) (Section 3) and then describe a user study designed to explicitly collect programmer annotations of their states (Section 5). We use the collected data to analyze the interactions using CUPS diagram revealing new insights into programmer behavior (Section 6). We then discuss limitations, and future work and conclude in (Section 7). Code and data for the paper can be found at https://github.com/microsoft/coderec_programming_states.
2 Background and Related Work
Large language models based on the Transformer network [Vaswani et al., 2017], such as GPT-3 [Brown et al., 2020], have found numerous applications in natural language processing. Codex [Chen et al., 2021], a GPT model trained on 54 million GitHub repositories, demonstrates that LLMs can very effectively solve various programming tasks. Specifically, Codex was initially tested on the HumanEval dataset containing 164 programming problems, where it is asked to write the function body from a docstring [Chen et al., 2021] and achieves 37.7% accuracy with a single generation. Various metrics and datasets have been proposed to measure the performance of code generation models [Hendrycks et al., 2021, Li et al., 2022, Evtikhiev et al., 2022, Dakhel et al., 2022]. However, in each case these metrics test how well the model can complete code in an offline setting without developer input, rather than evaluating how well such recommendations assist programmers in-situ.
This issue has also been noted in earlier work on non-LLM based code completion models where performance on completion benchmarks overestimates the model’s utility to developers [Hellendoorn et al., 2019]. Importantly, however, these results may not hold to LLM-based approaches, which are radically different [Sarkar et al., 2022].
One straightforward approach to understanding the utility of neural code completion services, including their propensity to deliver incomplete or imperfect suggestions, is to simply ask developers. To this end, Weisz et al. interviewed developers and found that they did not require a perfect recommendation model for the model to be useful [Weisz et al., 2021]. Likewise, Ziegler et al. surveyed over 2,000 Copilot users [Ziegler et al., 2022], and asked about perceived productivity gains using a survey instrument based the SPACE framework [Forsgren et al., 2021b] – we incorporate the same survey design for our own study. They found both that developers felt more productive using Copilot, and that these self-reported perceptions were reasonably correlated with suggestion acceptance rates.
While these self-reported measures of utility and preference are promising, we would expect gains to be reflected in objective metrics of productivity. Indeed, one ideal method would be to conduct randomized control trials where one set of participants writes code with a recommendation engine, while another set codes without it. GitHub performed such an experiment where 95 participants were split into two groups and asked to write a web server. The study concluded by finding that task completion was reduced by 55% in the Copilot condition [Kalliamvakou, 2022]. Likewise, a study by Google showed that an internal CodeRec model had a 6% reduction in ’coding iteration time’ [Tabachnyk and Nikolov, 2022]. On the other hand, Vaithilingam et al. [2022] showed in a study of 24 participants showed no significant improvement in task completion time – yet participants stated a clear preference for Copilot.
This wide dispersion of results raises interesting questions about the nature of the utility afforded by neural code completion engines: how, and when, are such systems most helpful; and conversely, when do they add additional overhead? This is the central question to our work. The related work closest to answering this question is that of Barke et al. [Barke et al., 2022], who showed that interaction with Copilot falls into two broad categories: the programmer is either in “acceleration mode” where they know what they want to do, and Copilot serves to make them faster; or they are in “exploration mode”, where they are unsure what code to write and Copilot helps them explore. The taxonomy we present in this paper, CUPS, enriches this further with granular labels for programmers’ intents. Moreover, the data collected in this work was labeled by the participants themselves rather than by the researchers interpreting their actions, allowing for more faithful intent and activity labeling and the data collected in our study can also be used to build predictive models as in [Mozannar et al., 2023]. The next section describes the Copilot system formally and describes the data collected when interacting with Copilot.
3 Copilot System Description
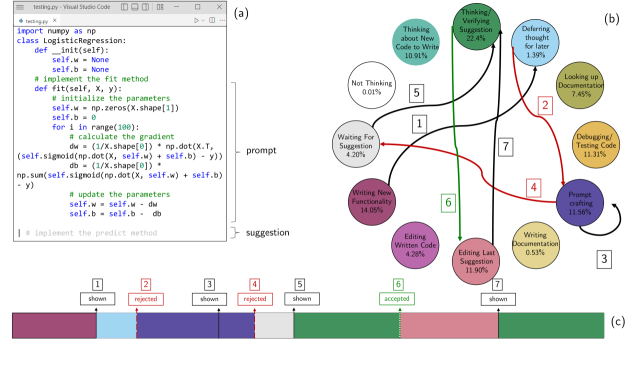
To better understand how code recommendation systems influence the effort of programming, we focus on GiHub Copilot, a popular and representative example of this class of tools. Copilot 444The version of Copilot that this manuscript refers to is Copilot as of August 2022. is based on a Large Language Model (LLM) and assists programmers inside an IDE by recommending code suggestions any time the programmer pauses their typing 555Copilot implementation details are kept to a high level in this manuscript.. Figure 1 shows an example of Copilot recommending a code snippet as an inline, monochrome popup, which the programmer can accept using a keyboard shortcut (e.g., <tab>).
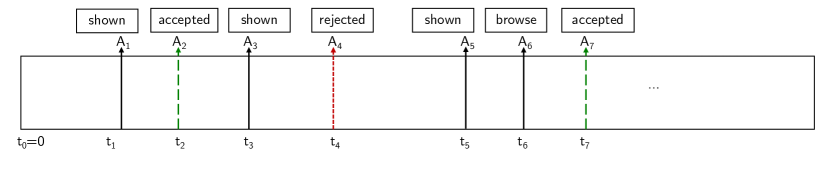
To serve suggestions, Copilot uses a portion of the code written so far as a prompt, , which it passes to the underlying LLM. The model then generates a suggestion, , which it deems to be a likely completion. In this regime, programmers can engineer the prompt to generate better suggestions by carefully authoring natural language comments in the code such as “# split the data into train and test sets.” In response to a Copilot suggestion, the programmer can then take one of several actions , where . The latter of these actions, reject, is triggered implicitly by continuing to type. Copilot logs aspects of the interactions via telemetry. We leverage this telemetry in the studies described in this paper. Specifically, whenever a suggestion is shown, accepted, rejected, or browsed, we record a tuple to the telemetry database, , where represents the within-session timestamp of the event (), details the action taken (augmented to include ‘shown’), and and capture features of the prompt and suggestion, respectively. Figure 2 displays telemetry of a coding session and Figure 1a shows Copilot implemented as a VSCode plugin. We have the ability to capture telemetry for any programmer interacting with Copilot, this is used to collect data for a user study in section 5.
3.1 Influences of CodeRec on Programmer’s Activities
Despite the limited changes that Copilot introduces to an IDE’s repertoire of actions, LLM-based code suggestions can significantly influence how programmers author code. Specifically, Copilot leverages LLMs to stochastically generate novel code to fit the arbitrary current context. As such, the suggestions may contain errors (and can appear to be unpredictable) and require that programmers double-check and edit them for correctness. Furthermore, programmers may have to refine the prompts to get the best suggestions. These novel activities associated with the AI system introduce new efforts and potential disruptions to the flow of programming. We use time as a proxy to study the new costs of interaction introduced by the AI system. We recognize that this approach is incomplete: the costs associated with solving programming tasks are multi-dimensional and it can be challenging to assign a single real-valued number to cover all facets of the task Forsgren et al. [2021a]. Nevertheless, we argue that, like accuracy, efficiency-capturing measures of time are an important dimension of the cost that is relevant to most programmers.
3.2 Programmer Activities in Telemetry Segments
Copilot’s telemetry captures only instantaneous user actions (e.g., accept, reject, browser), as well as the suggestion display event. By themselves, these entries do not reveal such programmer’s activities as double-checking and prompt engineering, as such activities happen between two consecutive instantaneous events. We argue that the regions between events, which we refer to as telemetry segments, contain important user intentions and activities unique to programmer-CodeRec interaction, which we need to understand in order to answer how Copilot affects programmers—and where and when Copilot suggestions are useful to programmers.
Building on this idea, telemetry segments can be split into two groups (Figure 2). The first group includes segments that start with a suggestion shown event and end with an action (accept, reject, or browse). Here, the programmer is paused and yet to take an action. We refer to this as ‘User Before Action’. The second group includes segments that start with an action event and end with a display event. During this period the programmer can be either typing or paused, hence we denote it as ‘User Typing or Paused’. These two groups form the foundation of a deeper taxonomy of programmer’s activities, which we further develop in the next section.
4 A Taxonomy for Understanding Programmer-CodeRec Interaction: CUPS

| State | Description |
|---|---|
| Thinking/Verifying Suggestion | Actively thinking about and verifying a shown or accepted suggestion |
| Not Thinking | Not thinking about suggestion or code, programmer away from keyboard |
| Deferring Thought For Later | Programmer accepts suggestion without completely verifying it, but plans to verify it after |
| Thinking About New Code To Write | Thinking about what code or functionality to implement and write |
| Waiting For Suggestion | Waiting for CodeRec suggestion to be shown |
| Writing New Code | Writing code that implements new functionality |
| Editing Last Suggestion | Editing the last accepted suggestion |
| Editing (Personally) Written Code | Editing code written by a programmer that is not a CodeRec suggestion for the purpose of fixing existing functionality |
| Prompt Crafting | Writing prompt in form of comment or code to obtain desired CodeRec suggestion |
| Writing Documentation | Writing comments or docstring for purpose of documentation |
| Debugging/Testing Code | Running or debugging code to check functionality may include writing tests or debugging statements |
| Looking up Documentation | Checking an external source for the purpose of understanding code functionality (e.g. Stack Overflow) |
| Accepted | Accepted a CodeRec suggestion |
| Rejected | Rejected a CodeRec suggestion |
4.1 Creating the Taxonomy
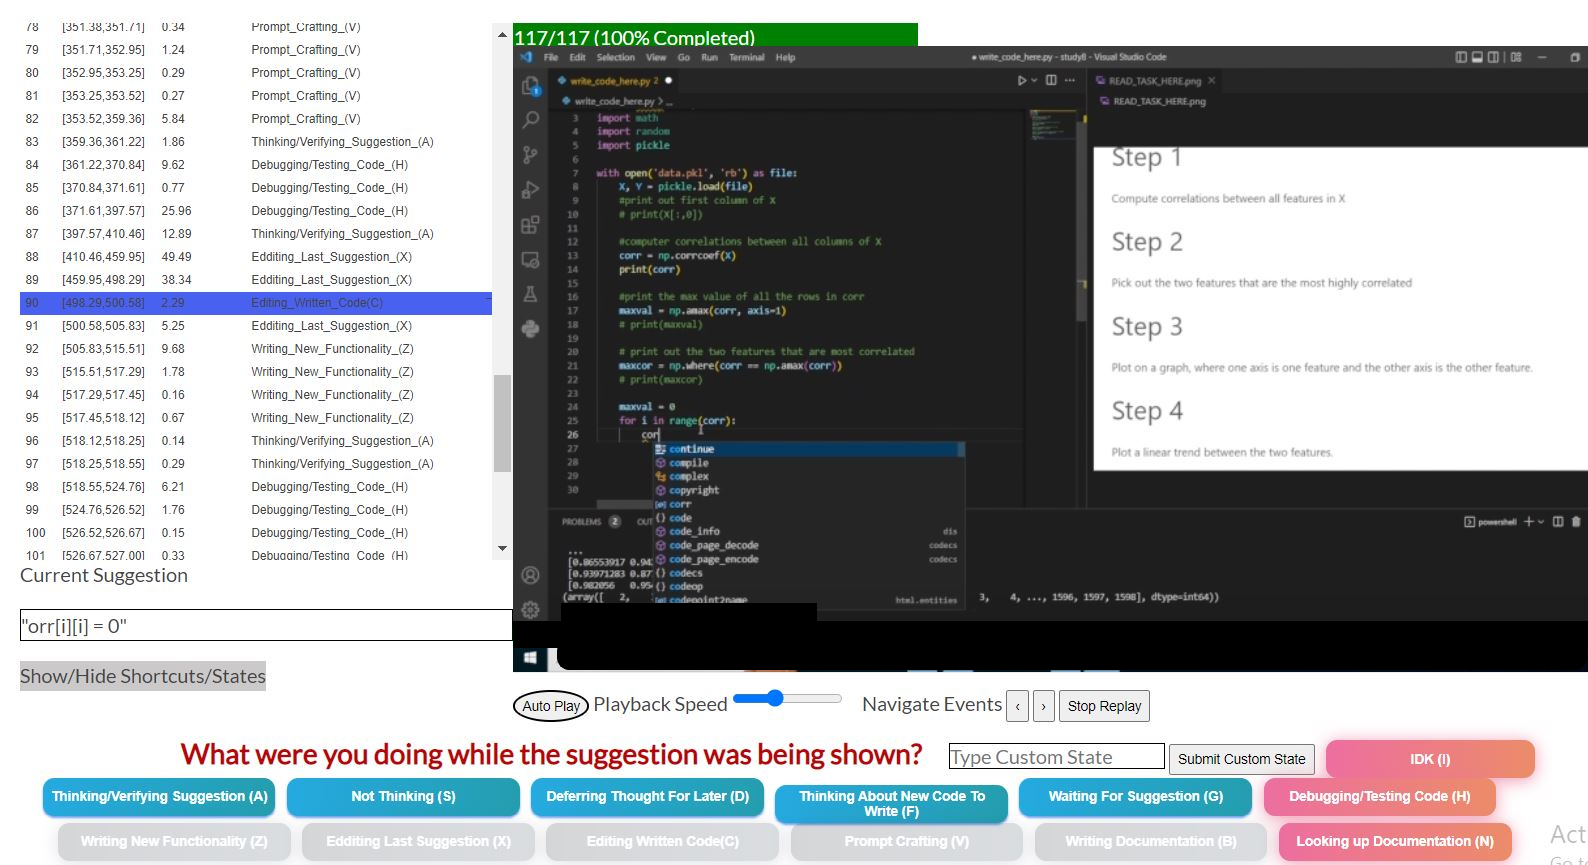
Our objective is to create an extensive, but not complete, taxonomy of programmer activities when interacting with CodeRec that enables a useful study of the interaction. To refine the taxonomy of programmers’ activities, we developed a labeling tool and populated it with an initial set of activities based on our own experiences from extensive interactions with Copilot (Figure 4). The tool enables users to watch a recently captured screen recording of them solving a programming task with Copilot’s assistance and to retrospectively annotate each telemetry segment with an activity label. We use this tool to first refine our taxonomy with a small pilot study (described below) and then to collect data in Section 5.
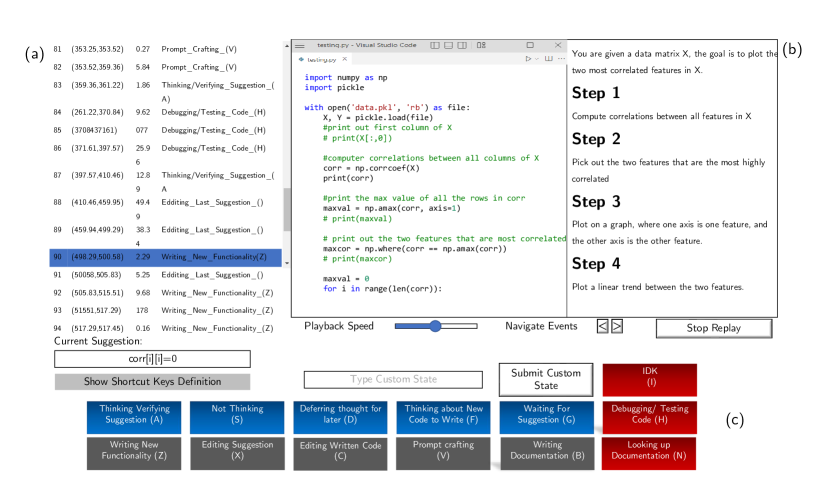
The labeling tool (Figure 4) contains three main sections: a) A navigation panel on the left, which displays and allows navigating between telemetry segments, and highlights the current segment being labeled in blue. The mouse or arrow keys are used to navigate between segments. b) A video player on the right, which plays the corresponding video segments in a loop. The participant can watch the video segments any number of times. c) Buttons on the bottom corresponding to the CUPS taxonomy along with an “IDK” button and a free-form text box to write custom state labels. Buttons also have associated keyboard bindings for easy annotation.
To label a particular video segment, we asked participants to consider the hierarchical structure of CUPS in Figure 3. For example, in a segment where a participant was initially double-checking a suggestion and then wrote new code to accomplish a task, the appropriate label would be "Writing New Functionality" as the user eventually typed in the segment. In cases where there are two states that are appropriate and fall under the same hierarchy, e.g., if the participant double-checked a suggestion and then looked up documentation, they were asked to pick the state in which they spent the majority of the time. These issues arise because we collect a single state for each telemetry segment.
Pilot. Through a series of pilots involving the authors of the paper, as well as three other participants drawn from our organization, we iteratively applied the tool to our own coding sessions, and to the user study tasks described in section 5. We then expanded and refined the taxonomy by incorporating any “custom state” (using the text field) written by the pilot participants. The states ’Debugging/Testing Code’, ’Looking up Documentation’, and ’Writing Documentation’ were added through the pilots. By the last pilot participant, the code book was stable and saturated as they did not write a state not yet covered. We observe in our study that the custom text field was rarely used. We describe the resultant taxonomy in the sections below.
4.2 Taxonomy of Telemetry Segments
Figure 3 shows the finalized taxonomy of programmer activities for individual telemetry segments with Copilot. As noted earlier, the taxonomy is rooted on two segment types: ‘User Typing or Paused’, and ‘User Before Action’. We first detail the ‘User Typing or Paused’ segments, which precede shown events, (Figure 2) and are distinguished by the fact that no suggestions are displayed during this time. As the name implies, users can find themselves in this state if they are either actively ’Typing’666Active typing allows for brief pauses between keystrokes., or have ’paused’, but have not yet been presented with a suggestion. In cases where the programmer is actively typing, they could be completing any of a number of tasks such as: ‘writing new functionality’, ’editing existing code’, ’editing prior (CodeRec) suggestions’, ‘debugging code’, or authoring natural language comments, including both documentation and prompts directed at CodeRec (i.e., ‘prompt crafting’). When the user pauses, they may simply be “waiting for a suggestion,” or can be in any number of states common to ‘User Before Action’ segments.
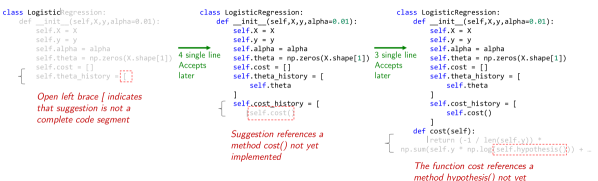
In every ‘User Before Action’ segment, CodeRec is displaying a suggestion and the programmer is paused and not typing. They could be reflecting and verifying that suggestion, or they may not be paying attention to the suggestion and thinking about other code to write instead. The programmer can also defer their efforts on the suggestion for a later time period by accepting it immediately, then pausing to review the code at a later time. This can occur, for example, because the programmer desires syntax highlighting rather than grey text, or because the suggestion is incomplete, and the programmer wants to allow Copilot to complete its implementation before evaluating the code as a cohesive unit. The latter situation tends to arise when Copilot displays code suggestions line by line (e.g., Figure 6).
The leaf nodes of the finalized taxonomy represent 12 distinct states that programmers can find themselves in. These states are illustrated in Figure 3 and are further described in Table 1. While the states are meant to be distinct, siblings may share many traits. For example, "Writing New Functionality" and "Editing Written Code", are conceptually very similar. This taxonomy also bears resemblance to the keystroke level model, in that it assigns a time cost to mental processes as well as typing Card et al. [1980], John and Kieras [1996]. As evidenced by the user study—which we describe next section—these 12 states provide a language that is both general enough to capture most activities (at this level of abstraction), and specific enough to meaningfully capture activities unique to LLM-based code suggestion systems.
5 CUPS Data Collection Study
To study CodeRec-programmer interaction in terms of CodeRec User Programming States, we designed a user study where programmers perform a coding task, then review and label videos of their coding session using the telemetry segment-labeling tool described earlier. We describe the procedure, the participants, and the results in the sections that follow.
5.1 Procedure
We conducted the study over a video call and asked participants to use a remote desktop application to access a virtual machine (VM). Upon connecting, participants were greeted with the study environment consisting of Windows 10, together with Visual Studio Code (VS Code) augmented with the Copilot plugin.
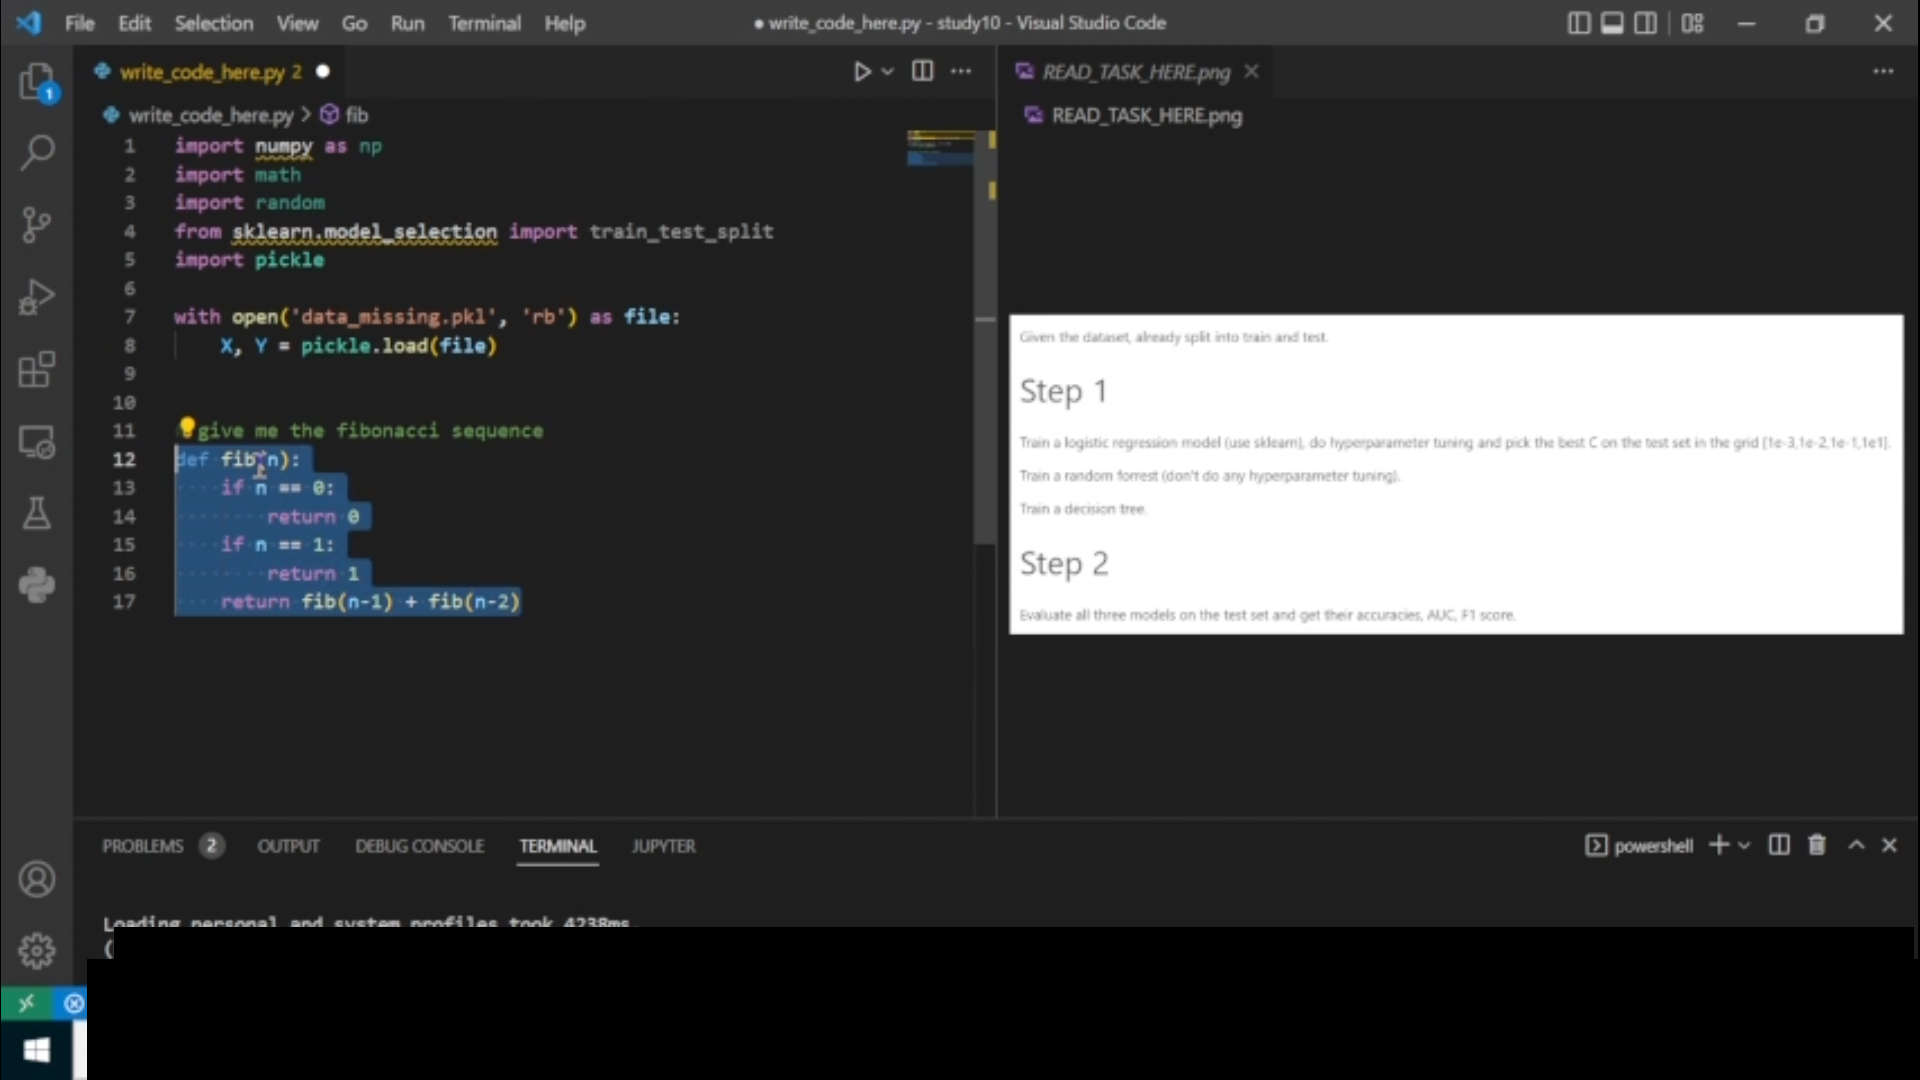
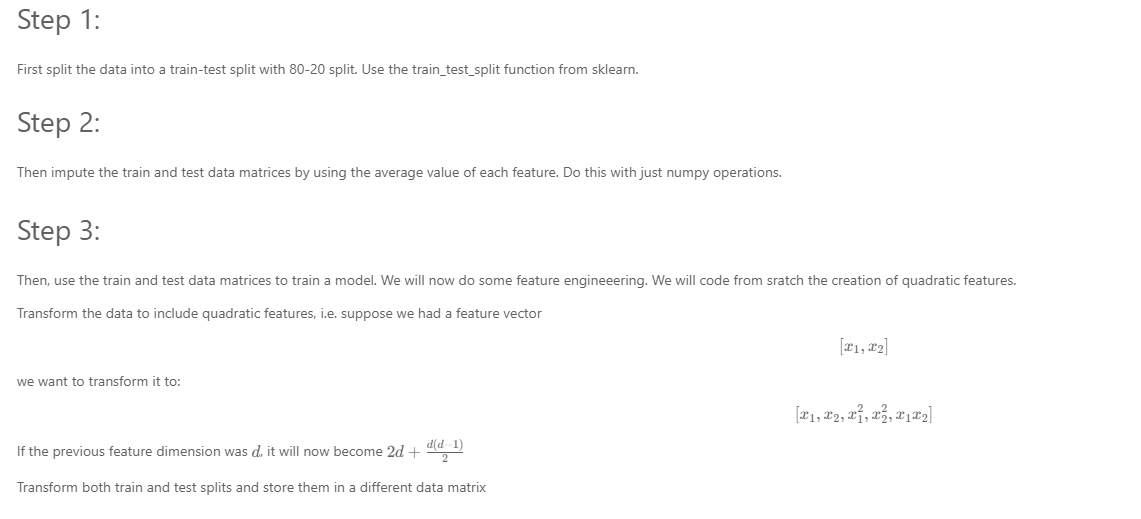
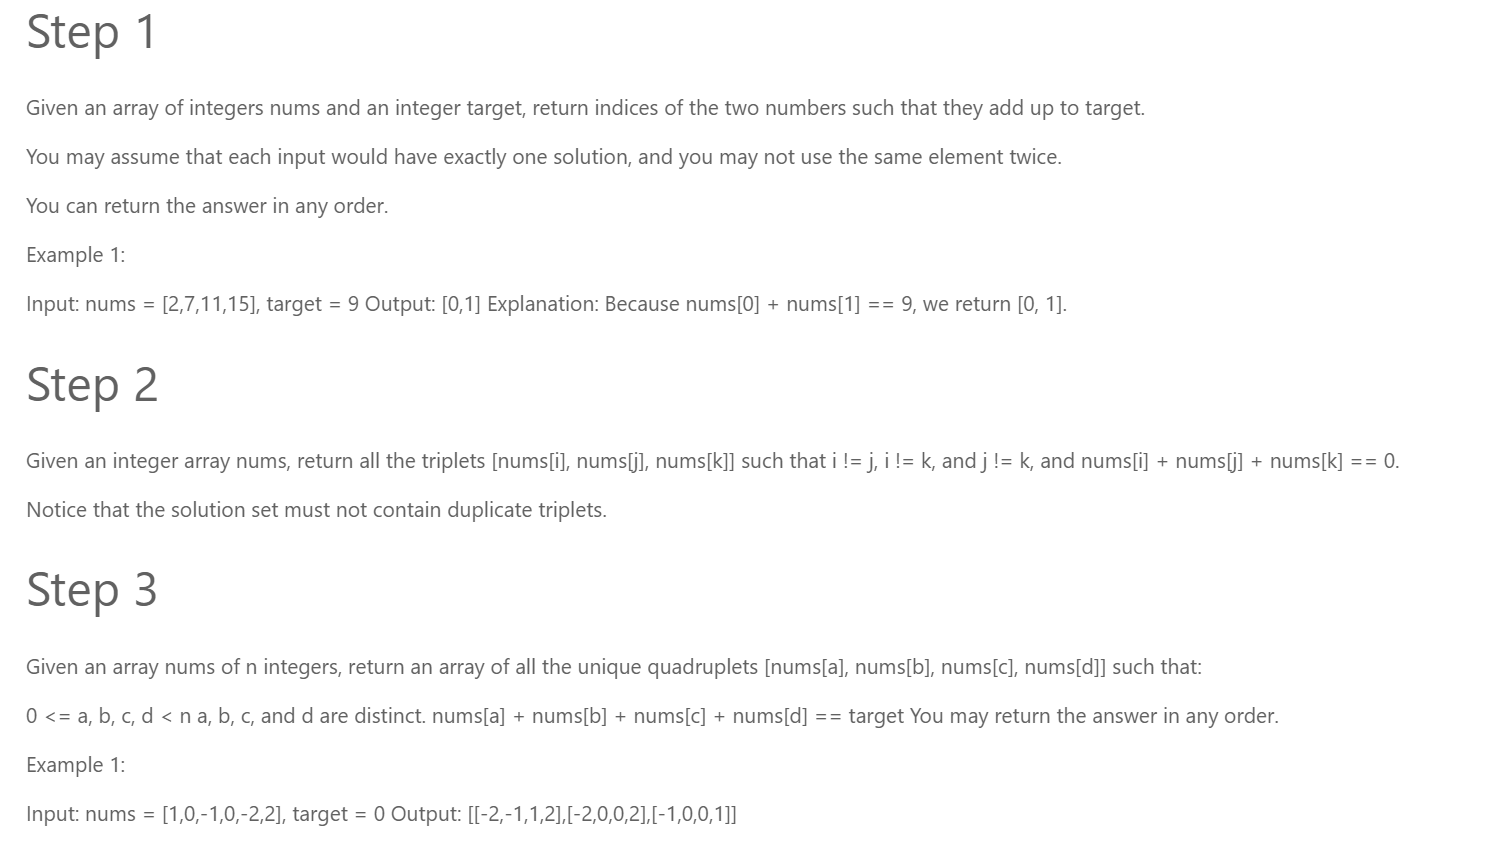
Participants were then presented with a programming task drawn randomly from a set of eight pre-selected tasks (Table 2). The task set was designed during the pilot phase so that individual tasks fit within a 20-minute block, and so that, together, the collection of tasks surfaces a sufficient diversity of programmer activities. It is crucial that the task is of reasonable duration so that participants are able to remember all their activities since they will be required to label their session immediately afterward. Since the CUPS taxonomy includes states of thought, participants must label their session immediately after coding, each study took approximately 60 minutes total. To further improve diversity, task instructions were presented to participants as raster images to encourage participants to author their own Copilot prompts rather than copying and pasting from a common problem description. The full set of tasks and instructions is provided as an Appendix.
Upon completing the task (or reaching the 20-minute mark), we loaded the participant’s screen recording and telemetry into the labeling tool (previously detailed in Section 4.1). The researcher then briefly demonstrated the correct operation of the tool and explained the CUPS taxonomy. Participants were then asked to annotate their coding session with CUPS labels. Critically, this labeling occurred within minutes of completing the programming task, so as to ensure accurate recall. We do not include a baseline condition where participants perform the coding task without Copilot, as the focus of this work is to understand and model the interaction with the current version of Copilot.
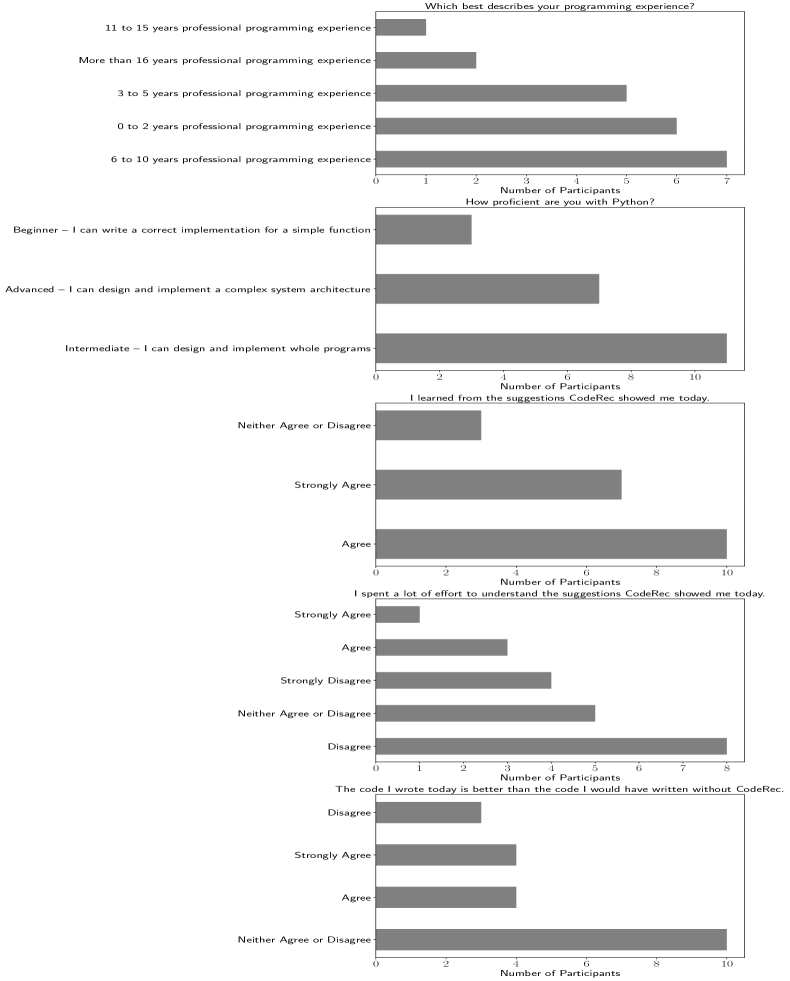
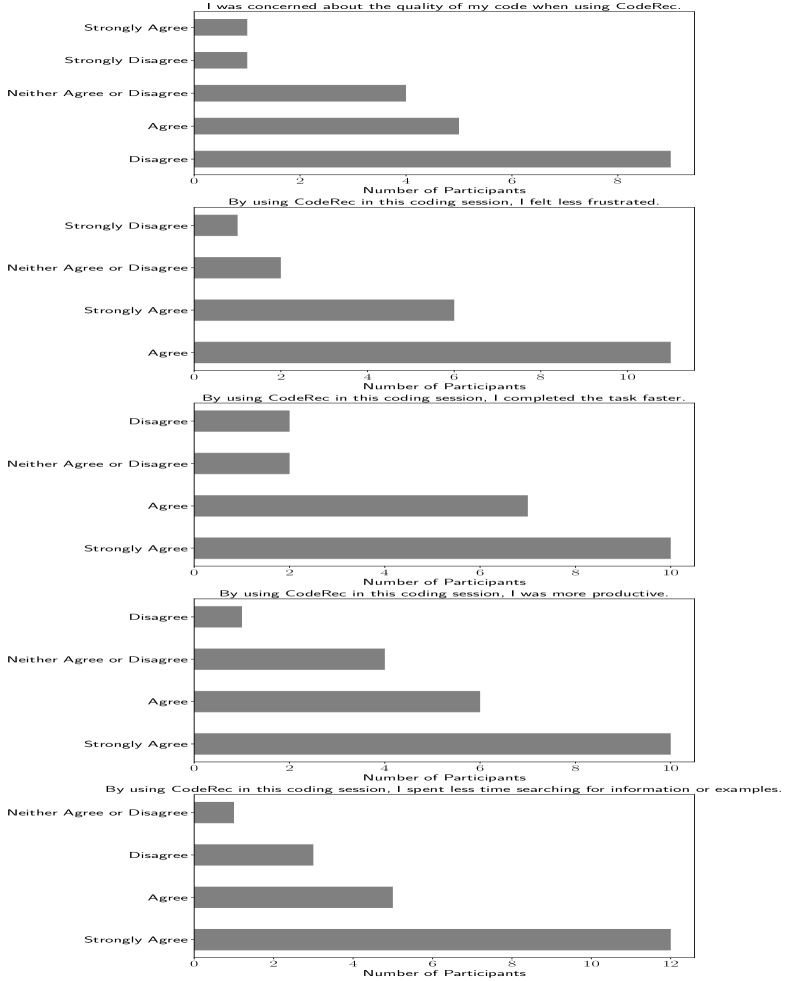
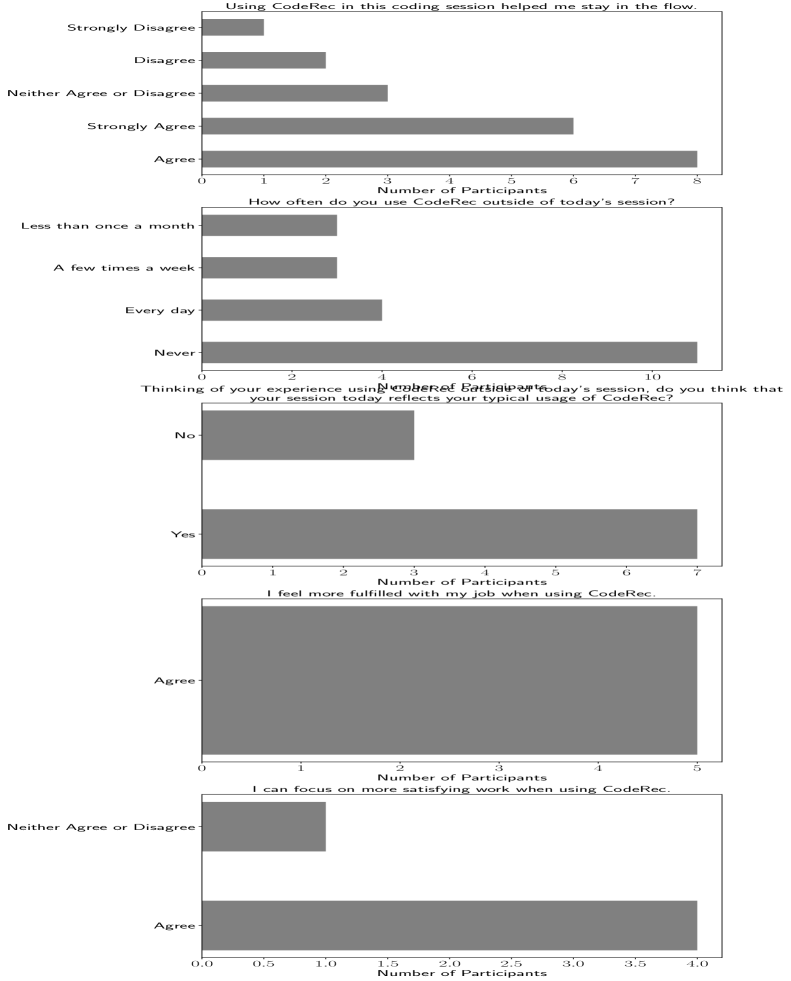
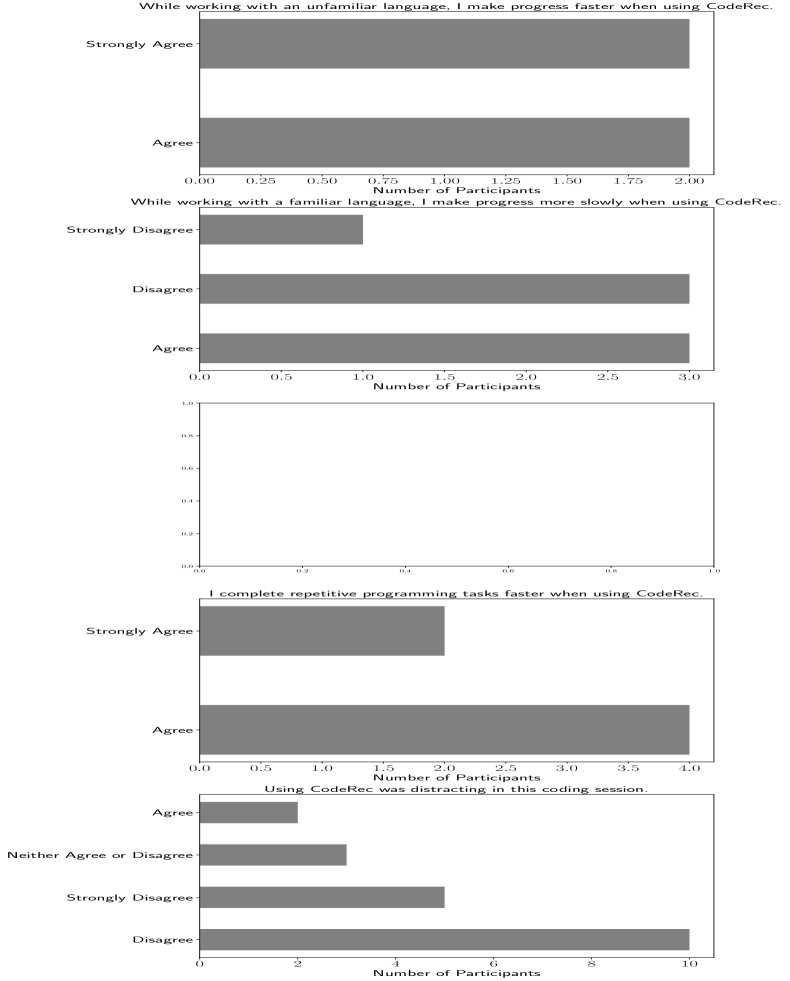
Finally, participants completed a post-study questionnaire about their experience mimicking the one in Ziegler et al. [2022]. The entire experiment was designed to last 60 minutes. The study was approved by our institutional review board, and participants received a $50.00 gift card as remuneration for their participation.
| Task Name | Participants | Description |
|---|---|---|
| Algorithmic Problem | P4,P17,P18 | Implementation of TwoSum, ThreeSum and FourSum |
| Data Manipulation | P1,P2,P11,P20 | Imputing data with average feature value and feature engineering for quadratic terms |
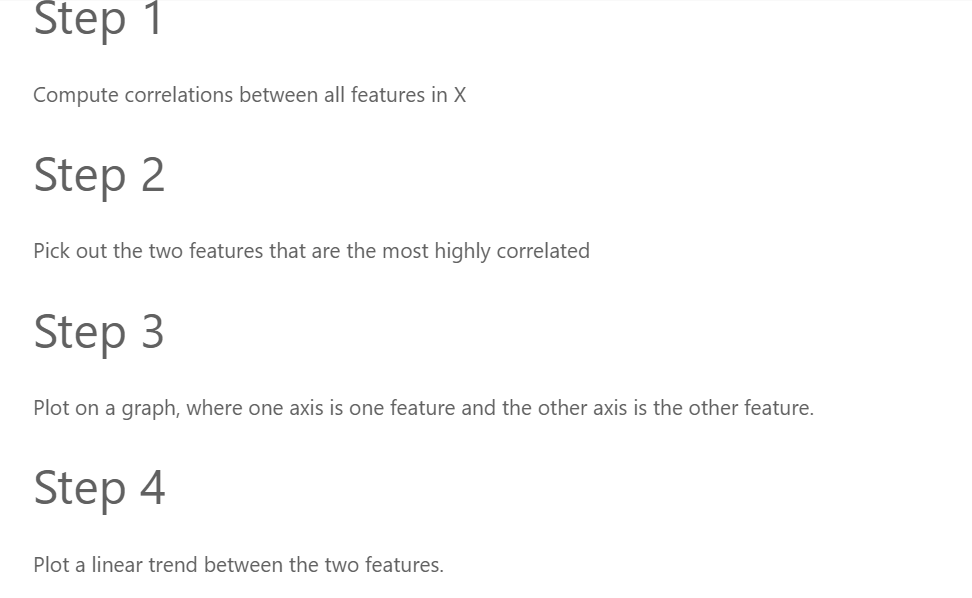
| Data Analysis | P5,P8 | Computing data correlations in a matrix and plotting of most highly correlated features |
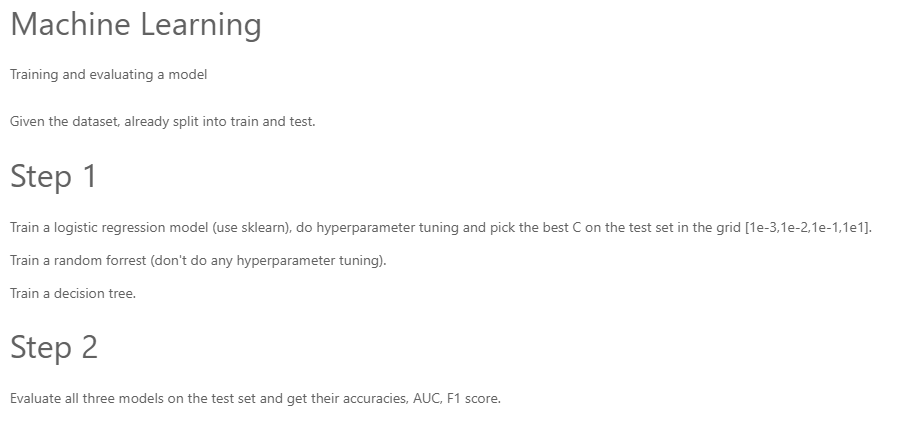
| Machine Learning | P3,P7,P12,P15 | Training and Evaluation of models using sklearn on given dataset |
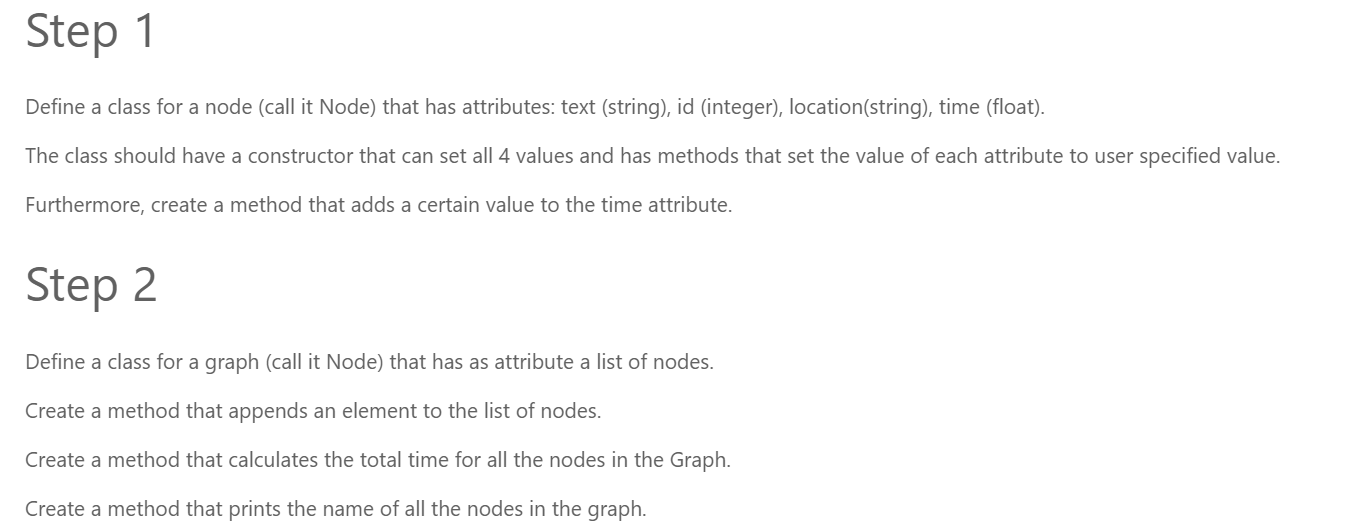
| Classes and Boilerplate Code | P6,P9 | Creating different classes that build on each other |
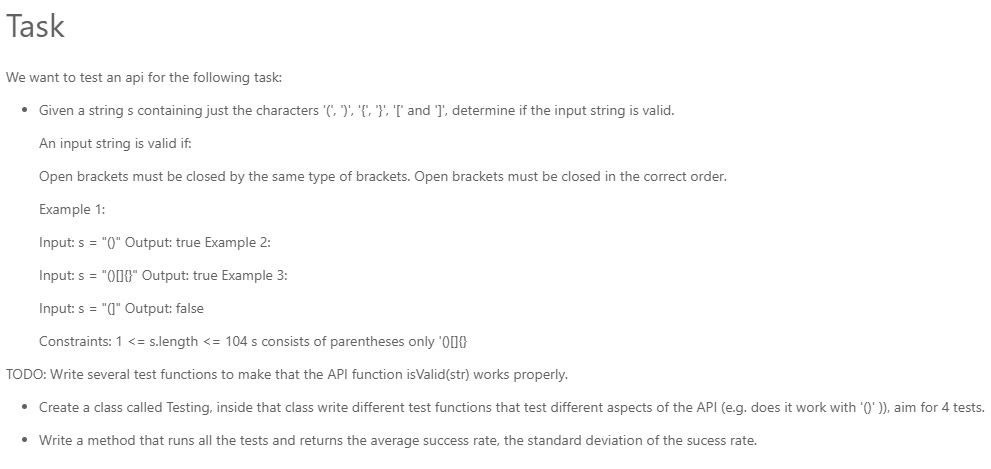
| Writing Tests | P16 | Writing tests for a black box function that checks if a string has valid formatting |
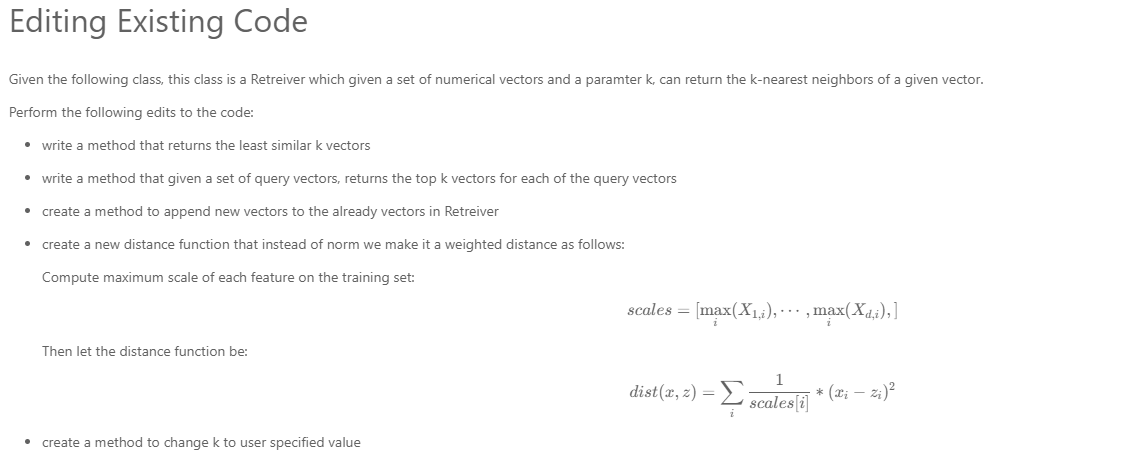
| Editing Code | P10,P14,P21 | Adding functionality to an existing class that implements a nearest neighbor retriever |
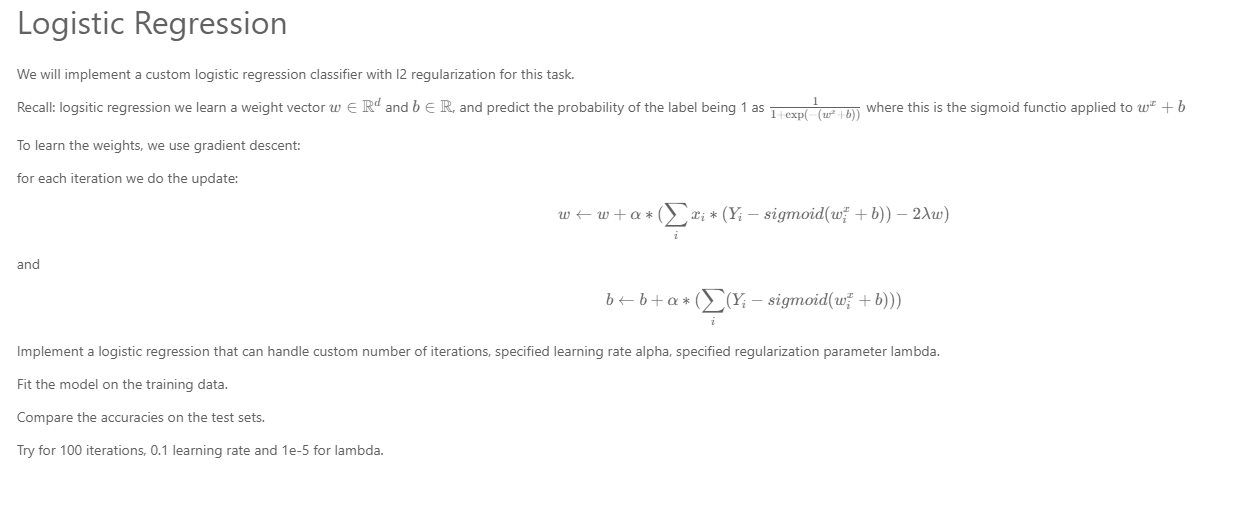
| Logistic Regression | P13,P19 | Implementing a custom Logistic Regression from scratch with weight regularization |
5.2 Participants
To recruit participants, we posted invitations to developer-focused email distribution lists within our large organization. We recruited 21 participants with varying degrees of experience using Copilot: 7 used Copilot more than a few times a week, 3 used it once a month or less, and 11 had never used it before. For participants who had never used it before, the experimenter gave a short oral tutorial on Copilot explaining how it can be invoked and how to accept suggestions. Participants’ roles in the organization ranged from software engineers (with different levels of seniority) to researchers and graduate student interns. In terms of programming expertise, only 6 participants had less than 2 years of professional programming experience (i.e., excluding years spent learning to program), 5 had between 3 to 5 years, 7 had between 6 to 10 years and 3 had more than 11 years of experience. Participants used a language in which they stated proficiency (defined as language in which they were comfortable designing and implementing whole programs). Here, 19 of the 21 participants used Python, one used C++, and the final participant used JavaScript.
On average, participants took minutes (sample standard deviation, minutes) to complete the coding task, with a maximum session length of 20.80 minutes. This task completion time is measured from the first line of code written for the task until the end of the allocated time. During the coding tasks, Copilot showed participants a total of 1024 suggestions out of which they accepted 34.0%. The average acceptance rate for participants was 36.5% (averaging over acceptance rate of each participant) and median 33.8% with standard error 11.9%, the minimum acceptance rate was 14.3%, and the maximum 60.7%. In the labeling phase, each participant labeled an average of () segments with CUPS, resulting in a total of 3137 CUPS labels. The participants used the ‘custom state’ text field only three times total, twice a participant wrote ‘write a few letters and expect suggestion’ which can be considered as ‘prompt crafting’ and once a participant wrote ‘I was expecting the function skeleton to show up[..]’ which was mapped to ’waiting for suggestion’. The IDK button was used a total of 353 times, this sums to 3137 CUPS + 353 IDKs = 3490 labels, the majority of its use was from two participants (244 times) where the video recording was not clear enough during consecutive spans, and was used by only 5 other participants more than once with the majority of the use also being due to the video not being clear or the segment being too short. We remove the IDK segments from the analysis and do not attempt to re-label them as their effect overall influence is negligible.
Together, these CUPS labels enable us to investigate various questions about programmer-CodeRec interaction systematically, such as exploring which activities programmers perform most frequently and how they spend most of their time. We study programmer-CodeRec interaction using the data derived from this study in the following Section 6 and derive various insights and interventions.
6 Understanding Programmer Behavior with CUPS
The study in the previous section allows us to collect telemetry with CUPS labels for each telemetry segment. We now analyze the collected data and highlight suggestions for 1) metrics to measure the programmer-CodeRec interaction, 2) design improvements for the Copilot interface, and finally 3) insights into programmer behavior.
6.1 Aggregated Time Spent in Various CUPSs
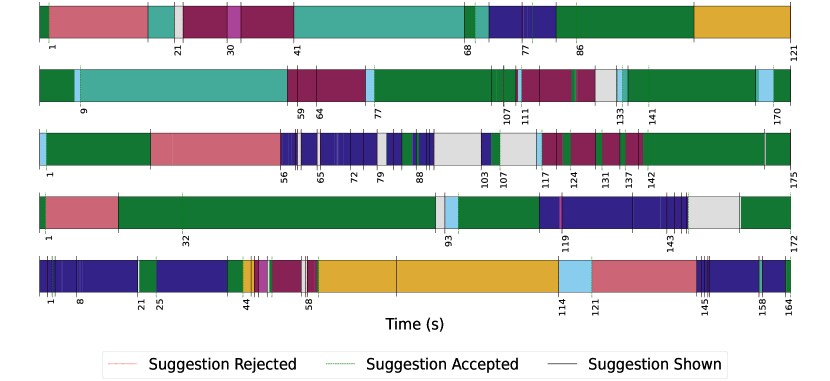
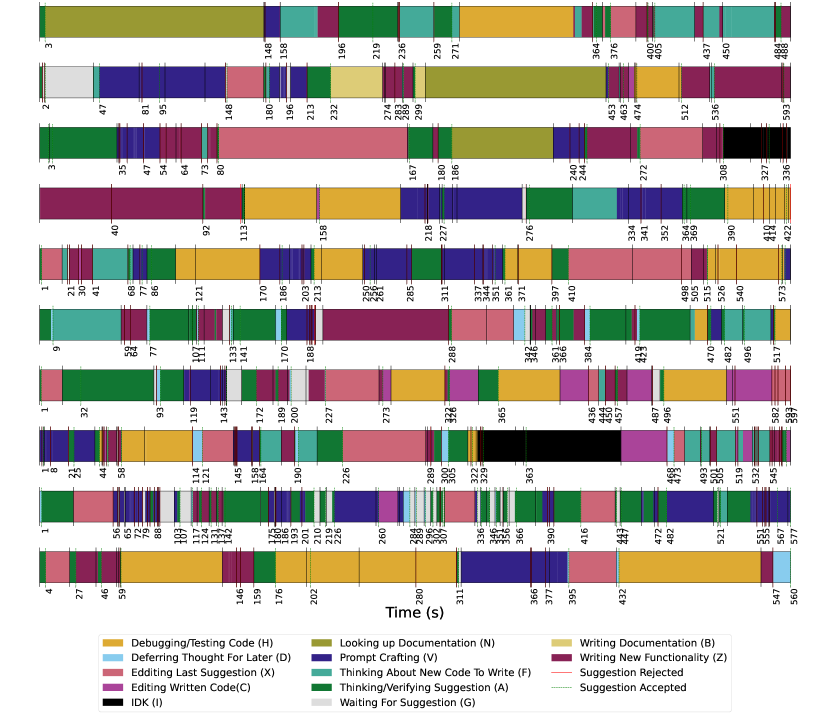
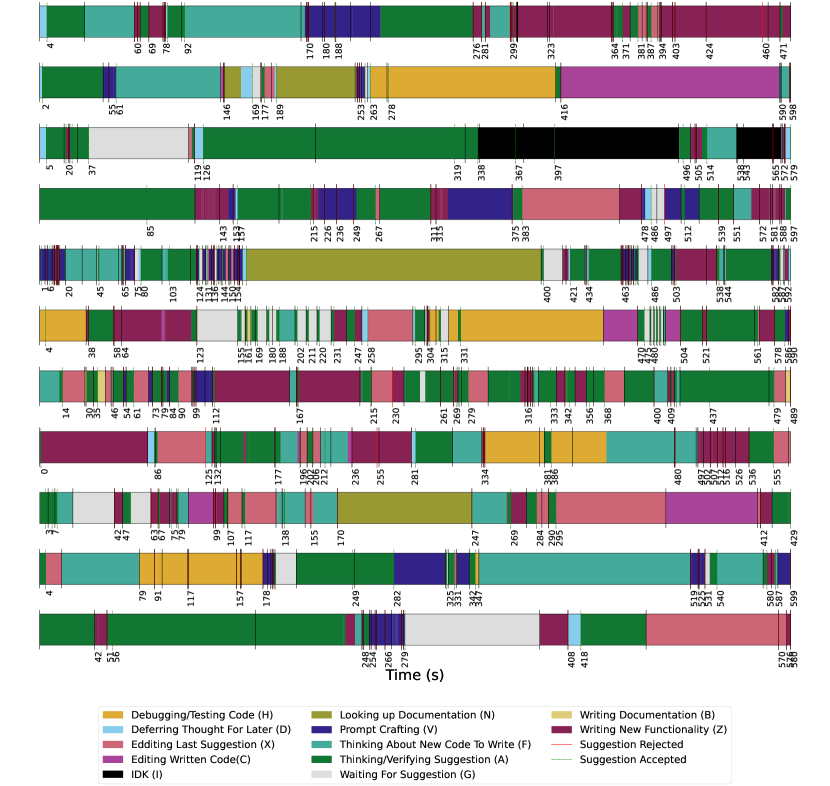
In Figure 5(a), we visualize the coding sessions of individual participants as CUPS timelines, where each telemetry segment is labeled with its CUPS label. At first glance, CUPS timelines show the richness in patterns of interaction with Copilot, as well as the variance in usage patterns across settings and people. CUPS timelines allow us to inspect individual behaviors and identify patterns, which we later aggregate to form general insights into user behavior.
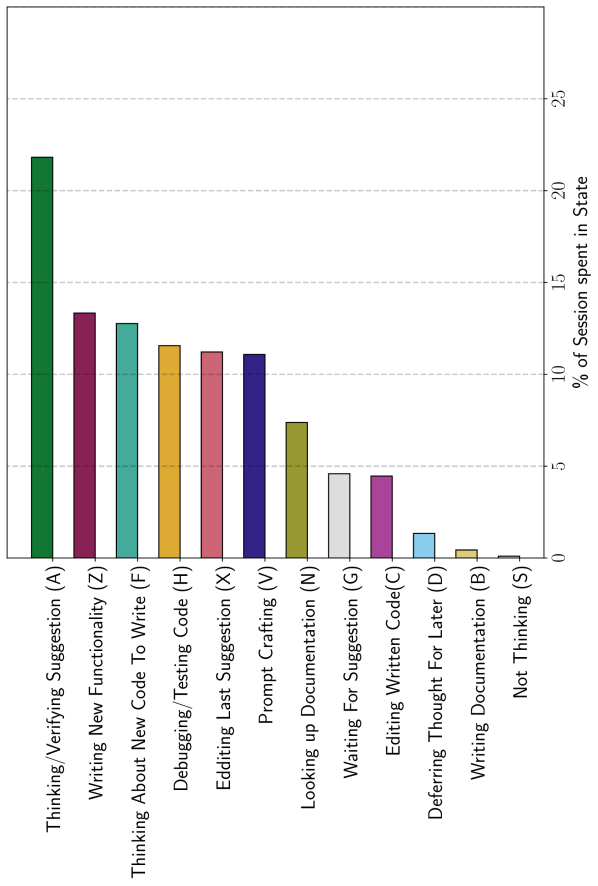
Figure 5(b) shows the average time spent in each state as a percentage normalized to a user’s session duration.
We find that averaged across all users, the ‘verifying suggestion’ state takes up the most time at 22.4% (), it is the top state for 6 participants and in the top 3 states for 14 out of 21 participants taking up at least 10% of session time for all but one participant. Notably, this is a new programmer task introduced by Copilot. The second-lengthiest state is writing new functionality’ 14.05% (), all but 4 participants spend more than 9% of session time in this state.
More generally, the states that are specific to interaction with Copilot include: ‘Verifying Suggestions’, ‘Deferring Thought for Later’, ‘Waiting for Suggestion’, ‘Prompt Crafting’ and ‘Editing Suggestion’. We found that the total time participants spend in these states is 51.4 % () of the average session duration. In fact, half of the participants spend more than 48% of their session in these Copilot states, and all participants spend more than 21% of their time in these states.
6.2 Programmer Behavior by Task and Expertise
By Task. The previous statistics in Figure 5 were aggregated across all participants (and hence tasks), we now investigate differences across the task the participants solved. Table 3 shows the acceptance rate of suggestion by task as well as the top 3 CUPS state by time spent. We first notice that there is variability in the acceptance rates, for example, the difference between the acceptance rate for the ‘Data Manipulation’ and ‘Classes and Boilerplate Code’ task is 17.1%. This difference was statistically significant according to a Pearson’s chi-squared test . When we look at the most frequented CUPS states for participants in these two tasks, we notice stark differences, those in the data manipulation task spent 20.63% of their time thinking about new code to write and 16.48% looking up documentation online, while those in the boilerplate code task spent most of their time verifying suggestions and prompt crafting (=56.36%). This could be due to the fact the boilerplate code is very suitable for an AI assistant like Copilot while the data manipulation requires careful transformation of a dataset. However, we find that ’Verifying Suggestion’ is in the top 3 states in terms of time spent in the coding session for all but two tasks, indicating similar behavior across tasks.
By Programmer Expertise and Copilot Experience. We investigate if there are any differences in how programmers interacted with Copilot based on their programming expertise and second their previous experience with Copilot. First, we split participants based on whether they have professional programming experience of more than 6 years (10 out of 21) and who have less than 6 years (11 out of 21). We notice the acceptance rate for those with substantial programming experience is 30% 2.1 while for those without is 37.6% , this difference is significant . Second, we split participants based on whether they have used Copilot previously (10 out of 21) and those who have never used it before (11 out of 21). The acceptance rate for those who have previously used Copilot is 37.6 % 2.0 and for those who have not it is 2.1, this difference is significant . We note, however, that with our limited sample size and confounders (task assignment), these results may not generalize broadly.
| Task Name | # Suggestions | Acceptance Rate % | Top 3 States (time %) |
|---|---|---|---|
| Algorithmic Problem | 124 | 30.6 4.1 |
Verifying Suggestion (25.58)
Writing New Functionality (22.31), Thinking About New Code To Write (19.23) |
| Data Manipulation | 238 | 24.8 2.8 |
Thinking About New Code To Write (20.63)
Looking up Documentation (16.48), Prompt Crafting (16.38) |
| Data Analysis | 114 | 29.8 4.3 |
Debugging/Testing Code (21.23)
Editing Last Suggestion (16.62) Prompt Crafting (16.00) |
| Machine Learning | 162 | 33.9 3.7 |
Looking up Documentation (19.98)
Verifying Suggestion (19.01) Debugging/Testing Code (12.52) |
| Classes and Boilerplate Code | 112 | 41.9 4.7 |
Verifying Suggestion (30.34)
Prompt Crafting (26.02) Writing New Functionality (13.56) |
| Writing Tests | 83 | 55.4 5.5 |
Verifying Suggestion (20.79)
Debugging/Testing Code (19.68) Writing New Functionality (16.91) |
| Editing Code | 117 | 23.9 3.9 |
Verifying Suggestion (30.18)
Editing Last Suggestion (14.65) Writing New Functionality (14.24) |
| Logistic Regression | 74 | 55.4 5.8 |
Verifying Suggestion (30.28)
Editing Last Suggestion (25.60) Writing New Functionality (15.69) |
6.3 Programmers Often Defer Thought About Suggestions
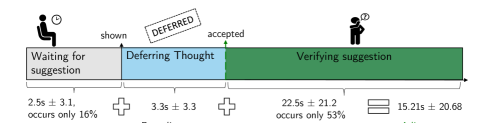
An interesting CUPS state is that of ’Deferring Thought About A Suggestion’. This is illustrated in Figure 6, where programmers accept a suggestion or series of suggestions without sufficiently verifying them beforehand. This occurs either because programmers wish to see the suggestion with code highlighting, or because they want to see where Copilot suggestions lead to. Figure 5(b) shows that programmers do in fact frequently defer thought– we counted 63 states labeled as such. What drives the programmer to defer their thought about a suggestion rather than immediately verifying it? We initially conjectured that the act of deferring may be explained by the length of the suggestions. So we compared the number of characters and the number of lines for suggestions depending on the programmer’s state. We find that there is no statistical difference according to a two-sample independent t-test in the average number of characters between deferred thought and suggestions (75.81 compared to 69.06) that were verified previously. The same holds for the average number of lines. However, when we look at the likelihood of editing an accepted suggestion, we find that it is 0.18 if it was verified before, but it is 0.53 if it was deferred. This difference was significant according to a chi-square test . We also observed that, when participants defer their thought, they spend on average 3.25s before accepting compared to spending 3.95s when they verify the suggestion before accepting, however, this difference is not statistically significant.
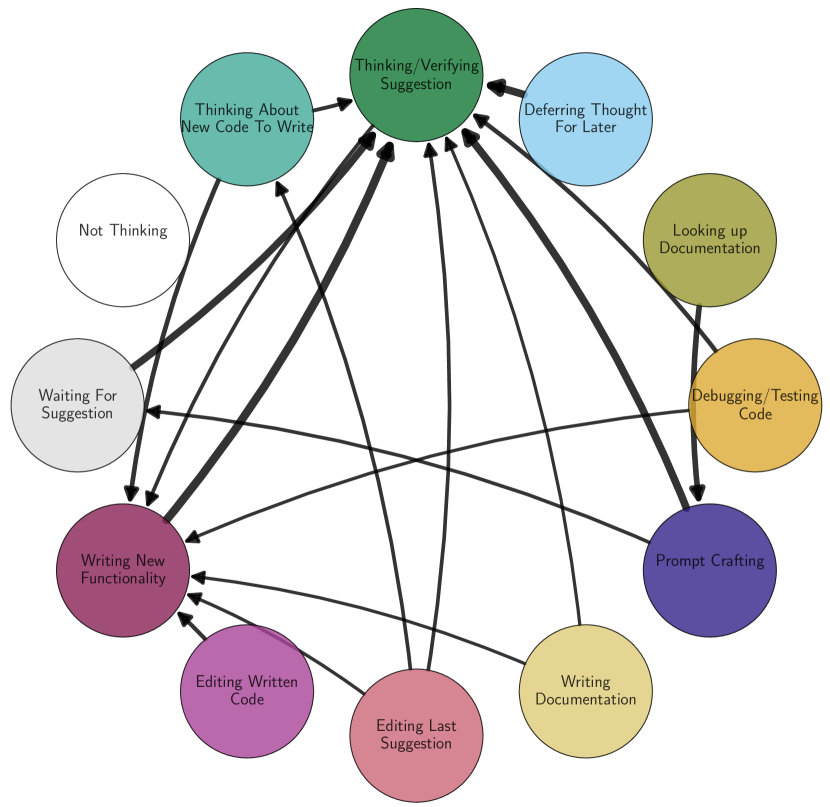
6.4 Patterns in Behavior as Transitions Between CUPS States
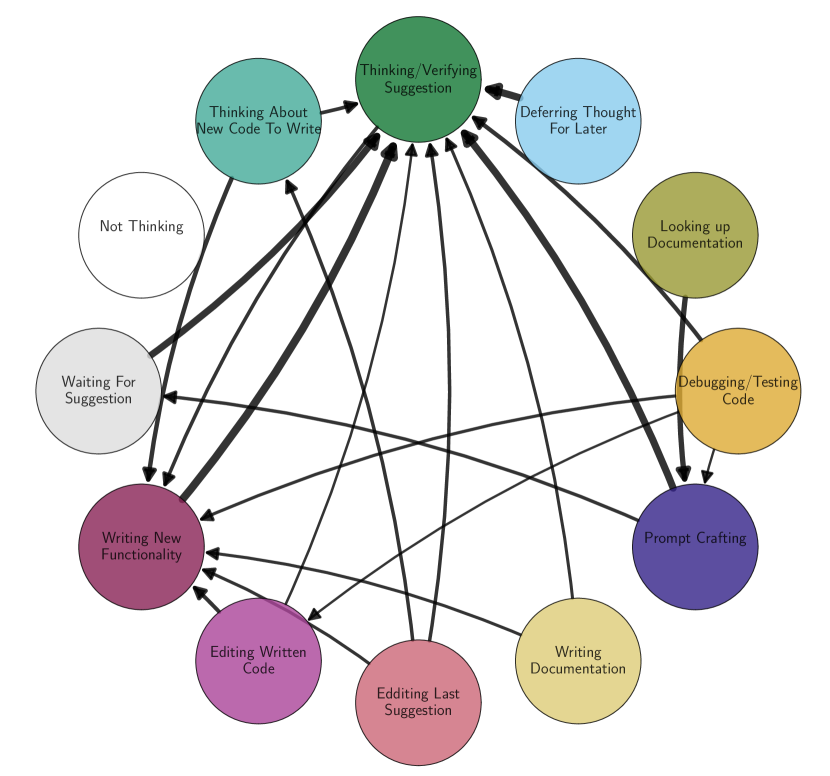
To understand if there was a pattern in participant behavior, we modeled transitions between two states as a state machine. We refer to the state machine-based model of programmer behavior as a CUPS diagram. In contrast to the timelines in Figure 5(a), which visualize state transitions with changes of colors, the CUPS diagram Figure 5(c) explicitly visualizes transitions using directed edges, where the thickness of arrows is proportional to the likelihood of transition. For simplicity, Figure 5(c) only shows transitions with an average probability higher than 0.17 ( quantile, selected for graph visibility).
The transitions in Figure 5(c) revealed many expected patterns. For example, one of the most likely transitions, ‘’ showed that when programmers were engineering prompts they were then likely to immediately transition to verifying the resultant suggestions (probability of 0.54). Likewise, Another probable transition was ‘’, indicating that if a programmer previously deferred their thought for an accepted suggestion, they would, with high probability, return to verify that suggestion. Stated differently: deference incurs verification dept, and this debt often “catches up” with the programmer. Finally, the single-most probable transition, ‘’, echos the observation from the previous section, indicating that programmers often see suggestions while writing code (rather than prompt crafting), then spend time verifying it. If suggestions are unhelpful, they could easily be seen as interrupting the flow of writing.
The CUPS diagram also revealed some unexpected transitions. Notably, the second-most probable transition from the ‘Prompt Crafting’ state is ‘’. This potentially reveals an unexpected and unnecessary delay and is a possible target for refinement (e.g., by reducing latency in Copilot). Importantly, each of these transitions occurs with a probability that is much higher than the lower bound/uniform baseline probability of transitioning to a random state in the CUPS diagram (1/12=0.083). In fact, when we compute the entropy rate (a measure of randomness) of the resulting Markov Chain Ekroot and Cover [1993] from the CUPS diagram we obtain a rate of 1.13, if the transitions were completely random the rate would be 3.58 and if the transitions were deterministic then the rate is 0.
What are the programmers doing before they accept a suggestion? We found that the average probability of accepting a suggestion was 0.34. But we observed that when the programmer was verifying a suggestion their likelihood of accepting was 0.70. In contrast, if the programmer was thinking about new code to write, the probability dropped to 0.20. This difference was statistically significant according to a Pearson’s chi-squared test . Conversely, when programmers are engineering prompts, the likelihood of accepting a suggestion drops to 0.16. One reason for this might be that programmers want to write the prompt on their own without the suggestions and Copilot interrupts them. We show the full results in the Appendix for the other states.
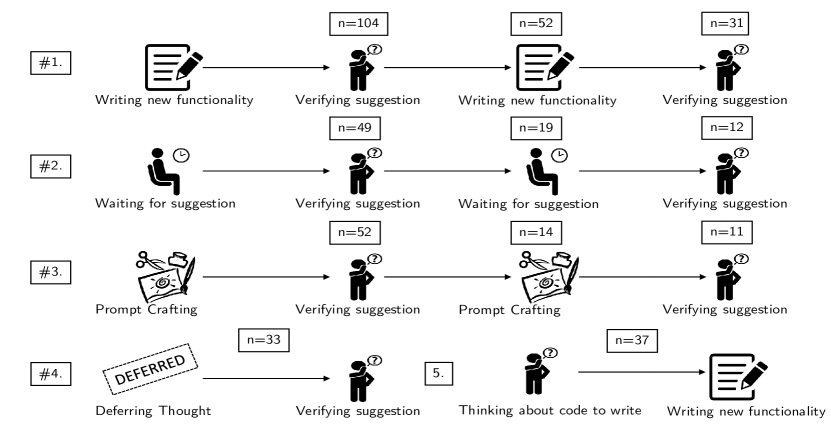
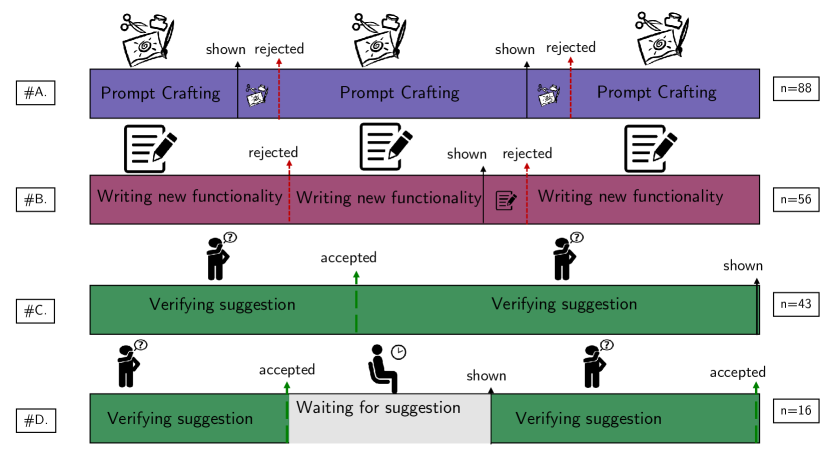
We also investigated longer patterns in state transitions by searching for the most common sequence of states of varying lengths. We achieved this by searching over all possible segment n-grams and counting their occurrence over all sessions. We analyzed patterns in two ways: in Figure 7(a) we merged consecutive segments that have the same state label into a single state (thus removing self-transitions) and in Figure 7(b) we looked at n-grams in the user timelines (including self-transitions) where we include both states and participants actions (shown, accepted and rejected). The most common pattern (#1) in Figure 7(a) was a cycle where programmers repeatedly wrote new code functionality and then spent time verifying shown suggestions, indicating a new mode for programmers to solve coding tasks. At the same time when we look at pattern (#B) in Figure 7(b) which takes a closer look into when programmers are writing new functionality, we observe that they don’t stop to verify suggestions and reject them as they continue to write. Other long patterns include (#1) (also shown as pattern #D ) where programmers repeatedly accepted successive Copilot suggestions after verifying each of them. Finally, we observe in (#1) and (#A) programmers iterating on the prompt for Copilot until they obtain the suggestion they want. We elaborate more on this in the next subsection.
6.5 CUPS Attributes Significantly More Time Verifying Suggestions than Simpler Metrics
We observed that programmers continue verifying the suggestion after they accept them. This happens by definition for ’deferred thought’ states before accepting suggestions, but we find it also happens when programmers verify the suggestion before accepting it and this leads to a significant increase in the total time verifying suggestions. First, when participants defer their thought about a suggestion, 53% of the time they verify the suggestion immediately afterward. When we adjust for the post-hoc time spent verifying, we compute a mean time of () seconds of verification and a median time of s. This is nearly a five-times increase in average time and a three-time increase in median time for the pre-adjustment scores of () mean and median time. These results are illustrated in Figure 8 and is a statistically significant increase according to a two-sample paired t-test . This phenomenon also occurs when programmers are in a ’Thinking/Verifying Suggestion’ state before accepting a suggestion where 19% of the time they posthoc verify the suggestion which increases total verification time from () to () on average which is statistically significant . On the other hand, programmers often have to wait for suggestions to show up due to either latency or Copilot not kicking in to provide a suggestion. If we sum the time between when a suggestion is shown and the programmer accepts or rejects this in addition to the time they spend waiting for the suggestion (this is indicated in the state ’Waiting for suggestion’), then we get an increase from s () to s () which is statistically significant from a paired t-test but is comparatively unnoticeable.
6.6 Insights About Prompt Crafting
Insights about Prompt Crafting.
We take a closer look into how participants craft prompts to obtain Copilot suggestions. Our first insight is that programmers consistently ignore suggestions while prompt crafting. Among 234 suggestions that were shown while participants were actively prompt crafting, defined as a suggestion that is between consecutive prompt crafting states, only 10.7% were accepted. We hypothesize this behavior could be due to programmers wanting to craft the prompt in their own language rather than with Copilot.
To better understand prompt crafting behavior, we consider the sessions of participants P5, P9 and P14. We observed their screen recordings and chosen state labels, and found: Programmers often iterate on their prompts until they obtain the suggestion they desire, and only rarely abandon prompt crafting without accepting a suggestion. Among 12 prompt crafting attempts we observed, only on one occasion, for P14, did they decide not to accept any suggestion. In this case, P14 simply started writing code on their own.
Prompt crafting is often an iterative process, where the programmer writes an initial prompt, observes the resulting suggestion, then iterates on the prompt by adding additional information about the desired code or by rewording the prompt. For example, P5 wanted to retrieve the index of the maximum element in a correlation matrix and wrote this initial prompt and got the suggestion: {python} # print the indices of the max value excluding 1 in corr maxval = np.amax(corr, axis=1) # CodeRec suggestion This code snipped returns the value of the maximum value rather than the index and so it was not accepted by the participant. They then re-wrote the prompt to be: {python} # print out the two features that are most correlated maxcor = np.where(corr == np.amax(corr)) # CodeRec suggestion and accepted the above suggestion.
Finally, we observe that there are three main ways participants craft prompts: 1) through writing a single line comment with natural language instructions, although the comment may resemble pseudo-code [Jiang et al., 2022] 2) through writing a docstring for the function, and finally, 3) through writing function signatures and variable names. Often programmers combine the three prompt crafting strategies to get better code suggestions.
7 Discussion and Future Work
7.1 Limitations
The observations from our study are limited by several decisions that we made. First, our participants solved time-limited, coding tasks that were provided by us instead of real tasks they may perform in the wild. We only conducted experiments with Python when CodeRec is capable of completing suggestions for myriads of other languages. We also made an assumption about the granularity of telemetry where each segment at most contained one state when in a more general setting programmers may perform multiple activities within a single segment. We also did not capture longer-term costs of interacting, e.g., from accepting code with security vulnerabilities or longer horizon costs. To this end, security vulnerabilities, and possible overreliance issues Pearce et al. [2022], Asare et al. [2022], Pearce et al. [2021], are important areas of research that we do not address in this paper.
7.2 Furthering Insights into Programmer Behavior with CUPS
We only investigated a limited number of programmer behaviors using the CUPS timelines and diagrams. There are many other aspects future work could investigate.
Predicting CUPS states.
To enable our insights derived in Section 6, we need to be able to identify the current programmers CUPS state. An avenue towards that is building predictive models using labeled telemetry data that is collected from our user study. Specifically, the input to such a model would be the current session context, for example whether the programmer accepted the last suggestion, the current suggestion being surfaced and the current prompt. We can leverage supervised learning methods to build such a model from collected data. Such models would need to run in real-time during programming and predict at each instance of time the current user CUPS state. This would enable the design suggestions proposed as well as serve to compute various metrics proposed. For example, if the model predicts that the programmer is deferring thought about a suggestion, we can group suggestions together to display them to the programmer. Moreover, we can leverage telemetry without CUPS labels to predict programmers acceptance or rejection of suggestion. This can be used to re-rank future suggestions, and selectively hide suggestions that are predicted to be rejected. Such predictive models are discussed in [Mozannar et al., 2023].
Assessing Individual Differences
There is an opportunity to apply the CUPS diagram to compare different user groups and compare how individuals differ from an average user. Does the nature of inefficiencies differ between user groups? Can we personalize interventions? Finally, we could also compare how the CUPS diagram evolves over time for the same set of users.
Effect of Conditions and Tasks on Behavior
We only studied the behavior of programmers with the current version of CodeRec. Future work could study how behavior differs with different versions of CodeRec– especially when versions use different models. In the extreme, we could study behavior when CodeRec is turned off. The latter could help assess the counterfactual cost of completing the task without AI assistance and help establish whether and where CodeRec suggestions add net value for programmers. For example, maybe the system did not add enough value because the programmer kept getting into prompt crafting rabbit holes instead of moving on and completing the functions manually, or with the assistance of web search.
Likewise, if developers create a faster version of CodeRec with less latency, the CUPS diagram could be used to establish whether it leads to reductions in time spent in the "Waiting for Suggestion" state.
Informing New Metrics
Since programmers’ value may be multi-dimensional, how can we go beyond code correctness and measure added value for users? If CodeRec improves productivity, which aspects were improved? Conversely, if it didn’t where are the efficiencies? One option is to conduct a new study where we compare the CUPS diagram with CodeRec assistance with a counterfactual condition where the programmers don’t have access to CodeRec. And use the two diagrams to determine where the system adds value or could have added value. For example, the analysis might reveal function competitions that are too hard for programmers to complete by themselves but much faster with CodeRec because the cost of double-checking and editing its suggestion is much less than the cost of spending effort on it by themselves. Conversely, the analysis might reveal that a new intervention for helping engineer prompts greatly reduced the time people spend in “Prompt Crafting”.
Another option is to design offline metrics based on these insights that developers can use during the model selection and training phase. For example, given that programmers spent a large fraction of the time verifying suggestions, offline metrics that can estimate this (e.g., based on code length and complexity) may be useful indicators of which models developers should select for deployment.
8 Conclusion
We developed and proposed a taxonomy of common programmer activities (CUPS) and combined it with real-time telemetry data to profile the interaction. At present, CUPS contains 12 mutually unique activities that programmers perform between consecutive CodeRec actions (e.g., such as accepting, rejecting, and viewing suggestions). We gathered real-world instance data of CUPS by conducting a user study with 21 programmers within our organization where they solved coding tasks with CodeRec and retrospectively label CUPS for their coding session. We collected over 3137 instances of CUPS and analyzed them to generate CUPS timelines that show individual behavior and CUPS diagram that show aggregate insights into the behavior of our participants. We also studied the time spent in these states, patterns in user behavior, and better estimates of the cost (in terms of time) of interacting with CodeRec.
Our studies with CUPS labels revealed that, when solving a coding task with CodeRec, programmers may spend a large fraction of total session time (34.3%) on just double-checking and editing CodeRec suggestions, and spend more than half of the task time on CodeRec related activities, together indicating that introducing CodeRec into an IDE can significantly change user behavior. We also found that programmers may defer thoughts on suggestions for later and simply accept them when displayed. Programmers also spend a significant amount of time waiting for suggestions, possibly due to latency in CodeRec’s current implementation. The CUPS diagram and patterns showed that, even if programmers defer thought, they end up spending time double-checking the suggestion later. We observed longer sequences such as cycles of accepts and verification, and sequences of consecutive accept with verification deferred at the end of these accepts.
We proposed new metrics to measure the interaction by computing the time spent in each CUPS state, and modification to existing time and acceptance metrics by accounting for suggestions that get verified only after they get accepted. We proposed new interface design suggestion: if we allow programmers to signal their current state, then we can better serve their needs, for example, by reducing latency if they are waiting for a suggestion. Future work will aim to test the effectiveness of these design suggestions as well.
Acknowledgements
HM partly conducted this work during an internship at Microsoft Research (MSR). We acknowledge valuable feedback from colleagues across MSR and GitHub including Saleema Amershi, Victor Dibia, Forough Poursabzi, Andrew Rice, Eirini Kalliamvakou, and Edward Aftandilian.
References
- Amazon [2022] Amazon. Ml-powered coding companion – amazon codewhisperer, 2022. URL https://aws.amazon.com/codewhisperer/.
- Asare et al. [2022] O. Asare, M. Nagappan, and N. Asokan. Is github’s copilot as bad as humans at introducing vulnerabilities in code? arXiv preprint arXiv:2204.04741, 2022.
- Barke et al. [2022] S. Barke, M. B. James, and N. Polikarpova. Grounded copilot: How programmers interact with code-generating models. arXiv preprint arXiv:2206.15000, 2022.
- Brown et al. [2020] T. Brown, B. Mann, N. Ryder, M. Subbiah, J. D. Kaplan, P. Dhariwal, A. Neelakantan, P. Shyam, G. Sastry, A. Askell, et al. Language models are few-shot learners. Advances in neural information processing systems, 33:1877–1901, 2020.
- Card et al. [1980] S. K. Card, T. P. Moran, and A. Newell. The keystroke-level model for user performance time with interactive systems. Communications of the ACM, 23(7):396–410, 1980.
- Chen et al. [2021] M. Chen, J. Tworek, H. Jun, Q. Yuan, H. P. d. O. Pinto, J. Kaplan, H. Edwards, Y. Burda, N. Joseph, G. Brockman, et al. Evaluating large language models trained on code. arXiv preprint arXiv:2107.03374, 2021.
- Dakhel et al. [2022] A. M. Dakhel, V. Majdinasab, A. Nikanjam, F. Khomh, M. C. Desmarais, Z. Ming, et al. Github copilot ai pair programmer: Asset or liability? arXiv preprint arXiv:2206.15331, 2022.
- Ekroot and Cover [1993] L. Ekroot and T. M. Cover. The entropy of markov trajectories. IEEE Transactions on Information Theory, 39(4):1418–1421, 1993.
- Evtikhiev et al. [2022] M. Evtikhiev, E. Bogomolov, Y. Sokolov, and T. Bryksin. Out of the bleu: how should we assess quality of the code generation models? arXiv preprint arXiv:2208.03133, 2022.
- Forsgren et al. [2021a] N. Forsgren, M.-A. Storey, C. Maddila, T. Zimmermann, B. Houck, and J. Butler. The space of developer productivity. Communications of the ACM, 64(6):46–53, 2021a.
- Forsgren et al. [2021b] N. Forsgren, M.-A. Storey, C. Maddila, T. Zimmermann, B. Houck, and J. Butler. The space of developer productivity: There’s more to it than you think. Queue, 19(1):20–48, 2021b.
- Github [2022] Github. Github copilot - your ai pair programmer, 2022. URL https://github.com/features/copilot.
- Hellendoorn et al. [2019] V. J. Hellendoorn, S. Proksch, H. C. Gall, and A. Bacchelli. When code completion fails: A case study on real-world completions. In 2019 IEEE/ACM 41st International Conference on Software Engineering (ICSE), pages 960–970. IEEE, 2019.
- Hendrycks et al. [2021] D. Hendrycks, S. Basart, S. Kadavath, M. Mazeika, A. Arora, E. Guo, C. Burns, S. Puranik, H. He, D. Song, et al. Measuring coding challenge competence with apps. arXiv preprint arXiv:2105.09938, 2021.
- Jiang et al. [2022] E. Jiang, E. Toh, A. Molina, K. Olson, C. Kayacik, A. Donsbach, C. J. Cai, and M. Terry. Discovering the syntax and strategies of natural language programming with generative language models. In CHI Conference on Human Factors in Computing Systems, pages 1–19, 2022.
- John and Kieras [1996] B. E. John and D. E. Kieras. The goms family of user interface analysis techniques: Comparison and contrast. ACM Transactions on Computer-Human Interaction (TOCHI), 3(4):320–351, 1996.
- Kalliamvakou [2022] E. Kalliamvakou. Research: Quantifying github copilot’s impact on developer productivity and happiness, Sep 2022. URL https://github.blog/2022-09-07-research-quantifying-github-copilots-impact-on-developer-productivity-and-happiness/.
- Li et al. [2022] Y. Li, D. Choi, J. Chung, N. Kushman, J. Schrittwieser, R. Leblond, T. Eccles, J. Keeling, F. Gimeno, A. D. Lago, et al. Competition-level code generation with alphacode. arXiv preprint arXiv:2203.07814, 2022.
- Mozannar et al. [2023] H. Mozannar, G. Bansal, A. Fourney, and E. Horvitz. When to show a suggestion? integrating human feedback in ai-assisted programming. arXiv preprint arXiv:2306.04930, 2023.
- Pearce et al. [2021] H. Pearce, B. Tan, B. Ahmad, R. Karri, and B. Dolan-Gavitt. Can openai codex and other large language models help us fix security bugs? arXiv preprint arXiv:2112.02125, 2021.
- Pearce et al. [2022] H. Pearce, B. Ahmad, B. Tan, B. Dolan-Gavitt, and R. Karri. Asleep at the keyboard? assessing the security of github copilot’s code contributions. In 2022 IEEE Symposium on Security and Privacy (SP), pages 754–768. IEEE, 2022.
- Sarkar et al. [2022] A. Sarkar, A. D. Gordon, C. Negreanu, C. Poelitz, S. S. Ragavan, and B. Zorn. What is it like to program with artificial intelligence? arXiv preprint arXiv:2208.06213, 2022.
- Tabachnyk and Nikolov [2022] M. T. Tabachnyk and S. Nikolov. Ml-enhanced code completion improves developer productivity, Jul 2022. URL https://ai.googleblog.com/2022/07/ml-enhanced-code-completion-improves.
- Vaithilingam et al. [2022] P. Vaithilingam, T. Zhang, and E. L. Glassman. Expectation vs. experience: Evaluating the usability of code generation tools powered by large language models. In CHI Conference on Human Factors in Computing Systems Extended Abstracts, pages 1–7, 2022.
- Vaswani et al. [2017] A. Vaswani, N. Shazeer, N. Parmar, J. Uszkoreit, L. Jones, A. N. Gomez, Ł. Kaiser, and I. Polosukhin. Attention is all you need. Advances in neural information processing systems, 30, 2017.
- Weisz et al. [2021] J. D. Weisz, M. Muller, S. Houde, J. Richards, S. I. Ross, F. Martinez, M. Agarwal, and K. Talamadupula. Perfection not required? human-ai partnerships in code translation. In 26th International Conference on Intelligent User Interfaces, pages 402–412, 2021.
- Ziegler et al. [2022] A. Ziegler, E. Kalliamvakou, X. A. Li, A. Rice, D. Rifkin, S. Simister, G. Sittampalam, and E. Aftandilian. Productivity assessment of neural code completion. In Proceedings of the 6th ACM SIGPLAN International Symposium on Machine Programming, pages 21–29, 2022.
Appendix A Details User Study
A.1 Interfaces
A.2 Task Instructions
The tasks are shown to participants as image files to deter copying of the instructions as a prompt.
A.3 Survey Questions Results
A.4 Full User Timelines
A.5 Full CUPS Graph
A.6 Probability of Accept by State
| State | Probability of Accepting Suggestion |
|---|---|
| Thinking/Verifying Suggestion (A) | 0.70 |
| Prompt Crafting (V) | 0.16 |
| Looking up Documentation (N) | 0.25 |
| Writing New Functionality (Z) | 0.19 |
| Thinking About New Code To Write (F) | 0.21 |
| Edditing Last Suggestion (X) | 0.16 |
| Waiting For Suggestion (G) | 0.42 |
| Editing Written Code(C) | 0.11 |
| Writing Documentation (B) | 0.36 |
| Debugging/Testing Code (H) | 0.25 |
| Deferring Thought For Later (D) | 0.98 |
Appendix B Details Action Prediction Model