* The authors contributed equally to this paper.
Vibrational properties of LiNbO3 and LiTaO3 under uniaxial stress
Abstract
Structural strain severely impacts material properties such as the linear and non-linear optical response. Moreover, strain plays a key role, e.g., in the physics of ferroelectrics and in particular of their domain walls. -Raman spectroscopy is a well-suited technique for the investigation of such strain effects, as it allows to measure the lattice dynamics locally. However, quantifying and reconstructing strain fields from Raman maps requires knowledge on the strain dependence of phonon frequencies. In this work, we have analyzed both theoretically and experimentally the phonon frequencies in the widely used ferroelectrics lithium niobate and lithium tantalate as a function of uniaxial strain via density functional theory and -Raman spectroscopy. Overall, we find a good agreement between our ab initio models and the experimental data performed with a stress cell. The majority of phonons show an increase in frequency under compressive strain, while the opposite is observed for tensile strains. Moreover, for E-type phonons, we observe the lifting of degeneracy already at moderate strain fields (i.e. at ) along the x and y directions. This work hence allows for the systematic analysis of 3D strains in modern-type bulk and thin-film devices assembled from lithium niobate and tantalate.
I Introduction
Lithium niobate (LN) and Lithium tantalate (LT) are cornerstone materials in nonlinear optics and optoelectronics, with established applications ranging from second-harmonic generation [1, 2], over optical ring resonators, to holographic memory devices [3], to name just a few. These devices are based on bulk single crystal platforms and have been constantly optimized over the last decades via meticulous analyses of crystal compositional aspects [4, 5, 6], degradation effects [7], defect distribution, and the precise imaging of domain structures [8, 9, 10]. Single crystalline LN (or LT) thin films on insulating substrates have recently opened up a completely new scenario. This new platform allows for much higher integrability into existing nanoelectronic and nanophotonic structures [11, 12] and outperforms bulk-based devices due to the submicron-scale confinement of optical modes [13, 14, 15].
Nevertheless, the transition towards thin-film LN (TFLN) devices emphasizes the importance of crystal properties that so far have played a minor role in LN bulk investigations and device fabrication. Among these, we count the increased influence of mechanical stress () fields [16, 17], e.g., due to the bonding process of the LN thin film onto the substrate, or occurring as a result of the poling procedure or waveguide fabrication, which is paramount for the reliable and reproducible production of highly efficient nonlinear optical devices. Accumulated stress does not only increase the chance of critical failure (e.g. due to delamination) [16, 17], but also influences optical key properties such as refractive indices [18, 19] and thus endangers the optical responses of a periodically-poled domain grid [20].
Among established imaging techniques applied for the analysis of LN platforms, Raman spectroscopy can provide critical information about internal mechanical stress. To discriminate the influence of stress fields from other factors, e.g. electrical fields [21] or compositional heterogeneity [22], and to quantify occurring stress markers, it is essential to gain fundamental knowledge on the relation of phonon properties and mechanical stress fields. To date, the only investigations in this regard were conducted via hydrostatic pressure-cells [23, 24]. However, such experiments only investigate the influence of isotropically applied stress. In reality, effects like stress fields in the vicinity of LN DWs, or mechanical stress in LN thin films, are not isotropic [25, 26]. Under these environments, the directionality of stress largely changes the materials properties. Therefore, it is necessary to theoretically predict and experimentally verify the influence of uniaxial stress on phonon properties. This then provides a fundamental reference for future investigations of mechanical stress fields, in analogy to the reference work of Stone et al. [21] for incident electrical fields.
In this work, we firstly provide the theoretical prediction on the evolution of the phonon properties in LN and LT crystals upon uniaxial compression along all three crystal axes via density functional theory (DFT) in Sec. II.1. Secondly, we combine a piezo-driven uniaxial stress cell with a -Raman spectroscopy setup to enable the experimental study of stress on the LN crystals. Experimentally, we compare stoichiometric and 5 MgO-doped LN samples compressed along the x,y, and z axes [see Sec. II.2]. Sec. III.3 then provides a discussion of the calculated and measured data.
With this work, we thus provide a basis for the quantitative, local stress analysis in LN and LT platforms via -Raman spectroscopy and give a reference for the deeper understanding and further optimization of LN- and LT-based devices.
II Methodology
II.1 Computational Approach
The DFT calculations are performed within the generalized gradient approximation (GGA) [27] in the formulation of Perdew, Burke, and Ernzerhof (PBE) [28] as implemented in the Vienna Ab Initio Simulation Package (VASP) [29]. Thereby, projector augmented wave (PAW) [30] potentials with projectors up to for Nb and Ta, and for Li and O have been used, which proved to be accurate enough as demonstrated in a previous work [31]. The electronic wave functions are expanded into a plane-wave basis set up to kinetic energy of . In order to model uniaxial stress, the lattice constants of the rhombohedral unit cell were adjusted according to the expression
| (1) |
where , , , and denote the strain tensor, the identity matrix, and the nth unstrained and strained lattice vector, respectively. The strain tensor was then calculated using the elastic compliance tensor from Ref. [32],
| (2) |
and the boundary conditions for uniaxial stress. This means that all components of the stress tensor are set to zero, except for the component in the direction of which uniaxial stress is to be exerted. For instance, if uniaxial stress is to be calculated along the x direction, (Voigt notation) is set as boundary condition. Due to constraints of the unit cell sizes, only stoichiometric LN and LT is calculated. However, as later demonstrated by experiments by comparing 5% MgO-doped and stoichiometric LN, it is shown that the results for 5% MgO-doped and stoichiometric LN are comparable, therefore this assumption is justified, to only calculate stoichiometric LN and LT.
The calculations were performed in two ranges for LN and LT: First, the effects of strain, i.e. compressive as well as tensile strain, on the phonon frequencies have been calculated in fine increments up to values reachable in the experiments. Second, calculations for higher values of strains, but more coarse increments, were performed. For LN and LT this procedure has been performed for lower strains up to , as well as for higher values up to . Here, increments of and have been chosen, respectively. The Hellmann-Feynman forces are minimized under a threshold value of by relaxation of the atomic positions. For our calculations of unstrained structures we have used commonly accepted experimental lattice constants (, and , ) [31].
| sample name | description | size | stress axis |
|---|---|---|---|
| sLN-x | z-cut stoichiometric LN | y z: 580 113 m2 | x |
| sLN-y | z-cut stoichiometric LN | x z: 580 113 m2 | y |
| 5Mg-LN-x | z-cut 5-MgO doped LN | y z: 500 140 m2 | x |
| 5Mg-LN-y | z-cut 5-MgO doped LN | x z: 400 100 m2 | y |
| 5Mg-LN-z | x-cut 5-MgO doped LN | y x: 400 100 m2 | z |
The -centered phonon frequencies and eigenvectors are derived by the frozen-phonon method [33] without symmetry constraints. For the calculation of the Hessian matrix, atomic displacements of in each Cartesian direction are considered. Since our approach does not take into account the long-range electric fields accompanying the longitudinal-optical (LO) phonons, our calculations are restricted to transversal-optical (TO) phonons, only. A k-point mesh is used to sample the first Brillouin-zone corresponding to the orthorhombic unit cell, which yields 192 irreducible points.
II.2 Experimental Procedure
In order to complement the above theoretical investigations, we measured the frequency shift of the phonon modes in LN by combining -Raman spectroscopy with a uniaxial stress cell [34]. All measurements were performed using a LabRAM HR spectroscope from Horiba in 180∘ back-scattering geometry. In this setup, a HeNe laser at wavelength was focused onto the samples using a 100X and 0.9 NA objective. For each data point, two acquisitions were collected for each, while using a diffraction grating of 1800 grid lines per millimeter for spectral analysis. For these settings, the corresponding spectral resolution is , which was determined as part of the calibration using a He-Ne gas discharge lamp. Here, the plasma line at a wavelength of 671.7 nm has a natural line width of 0.025 nm (), which corresponds to the spectral resolution i.e. the standard deviation, which only means how well the two overlapping peaks can be resolved. On the other hand, with the help of the standard error obtained from peak fitting, each peak center can be pinpointed with a 100-1000 times more precision, and this is the quantity we are interested in.
All the samples used in this work were firmly attached to the uniaxial stress cell using black stycast epoxy resin [35] such that the strain is fully transmitted to the sample through the epoxy resin. The force applied to the sample was directly measured through a force sensor attached to the back of the device. This force was later converted to stress using the relation
| (3) |
where denotes the cross-section of the samples provided in table 1, and is the force measured by the force sensor. In order to compensate for any charge-induced effects due to the piezoelectric effect, the top and bottom faces of the sample surfaces were electrically grounded using -thick chromium electrodes. All the measurements were always performed across the chromium electrodes, which at the given thickness are still sufficiently transparent and do not affect our measurements, as also shown in the past for in situ second-harmonic microscopy studies [36].
A total of five samples were measured [see Tab. 1]. First, stoichiometric LN, being close to the ideal crystals considered for the theoretical calculations, is measured and used to compare theory with experiment. Second, 5 MgO-doped LN samples are chosen, because they are widely used among the ferroelectrics and integrated optics community due to their low photorefraction and highly conductive domain walls [12, 37, 38, 39]. Comparing the results on the stoichiometric and MgO-doped crystals allows us to see whether or not there are any stoichiometry-specific changes in the responses, which would also not be covered by the DFT calculations.
II.2.1 Data extraction method
The Raman spectra of single-crystalline LN and LT are well understood and have been investigated thoroughly before [31, 40, 41, 42, 43]. The optical phonons of LN and LT consist of four A1, five A2, and nine doubly-degenerated E phonon branches. Here, A1 and E are optical branches and are both Raman and Infrared active. In contrast, the A2 branch is optically inactive. Furthermore, depending on the scattering geometry these branches either appear as TO or LO modes. Conveniently LN and LT peaks are labeled by type of symmetry (A1 or E), followed by the specific type (TO or LO) and consecutive number counting from low to high frequency. For example, the phonon E(TO9) labels the ninth, i.e. highest frequency, E-type TO phonon. The assignment of peaks in this work has been performed according to the most recent accepted assignment by Margueron et al., Sanna et al. and Rüsing et al. [41, 42, 31].
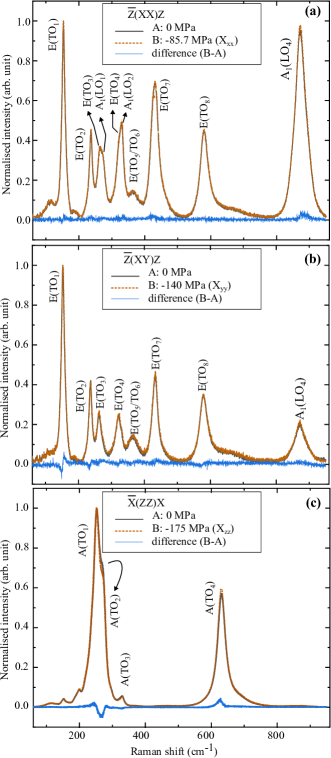
Figure 1(a), (b) and (c) shows example Raman spectra of the 5Mg-LN-x, 5Mg-LN-y, and 5Mg-LN-z samples, respectively. These spectra are measured in different scattering geometries represented by the Porto notation , where and represent the direction of incident and scattered light in crystal coordinates, and and denote the direction of polarization of both incoming and Raman scattered beams, respectively [41]. Here, each plot contains 3 spectra, where spectrum A belongs to the unstressed () state of the sample while spectrum B describes a compressed state of the sample. The third is the difference spectrum of the former two. To eliminate the intensity influences in the difference spectrum and to solely highlight the effect of the frequency shift due to applied stress, all the spectra were first normalized individually by subtracting the noise background (if applicable) and divided by the intensity of the highest peak [10]. From the different spectra of Fig. 1(b), it can be clearly noticed that the frequency of the E(TO1) phonon mode in (XY)Z geometry increased under compression, while the frequency for A1(TO1) in (ZZ)X geometry decreased. Apart from these large differences, further changes are difficult to notice. So, to quantify frequency shifts as a function of stress, the fitting of the spectra by Lorentzian functions is performed. In this way, the frequencies at the maxima of the phonon peaks were determined for different stress values and plotted against applied stress, such as shown in Fig. 2. Via statistical analysis of the phonon shifts, we are able to deduce the experimental phonon-stress-shift coefficients with a precision of 0.01 cm-1/.
Additionally, it is well-known [44, 45] that the spectra of congruent or MgO-doped LN show broader and less resolvable peaks as compared to the stoichiometric LN. Here, various peaks overlap with each other, that then leads to a more challenging peak assignment. For example, the pairs E(TO3)- A1(LO1), A1(LO2)-E(TO4), and A1(LO3)-E(TO7) overlap with each other in the (XX)Z and (YY)Z geometry of MgO-doped LN. Therefore, in Sec. III.1, to avoid any misleading conclusions, for these peaks the Raman shifts with the stress have not been fitted [see Table 2 and 4].
Furthermore, to find an optimum location on the sample, a series of optimization measurements [see SI for further information] are performed. As a result, all the measurements were performed in the center of the sample and 10 m below the sample surface.
III Results
III.1 Experimental Results
For the sake of simplicity, we only show the pressure dependency for selected phonon modes; the complete results are shown in the Supplement information (SI).
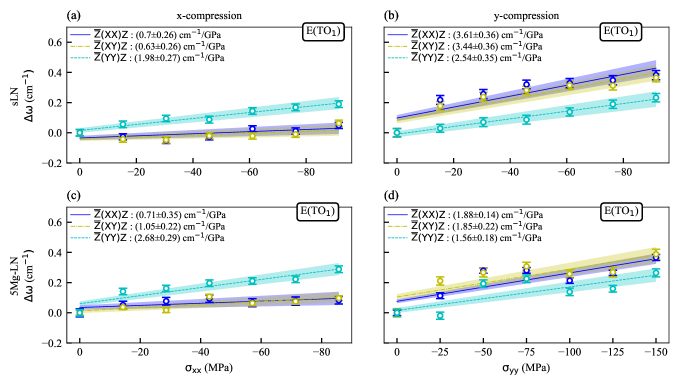
Fig. 2 shows the response of the E(TO1) phonon mode under x and y compression for both the stoichiometric and 5-MgO doped LN samples. The three curves in a single plot represent the three different scattering geometries given in Porto’s notation. Since the change of the frequency () with respect to the unstressed state is the quantity of interest, we have plotted the frequencies with respect to the value as a function of stress. Hence, we also account for any offset due to sample mounting or bending effects as discussed in the SI.
The coloured region around the fitted lines show the one-sigma confidence interval, calculated from linear fitting which included the standard error of individual peaks. The E(TO1) mode shows a linear positive slope for the compression in all cases. In the case of x compression for both sLN-x and 5Mg-LN-x samples, the slope is larger in measurement geometry. On the other hand, when the same samples are compressed along the y crystallographic axis, the slope is larger for and scattering geometries. We have observed this behavior for almost all the phonon modes [see SI]. The value of different slopes in different measurement geometry can be interpreted as the lifting of the two-fold degeneracy of the E-modes predicted by theory as discussed below.
When comparing 5Mg-LN-x/-y and sLN-x/-y, the slopes are similar as shown in Fig. 2. The origin of the small deviations could be due to the presence of defects in doped-LN. This argument is consistent with the work done by Tejerina et al., where they show that doping increases the phonon shift under hydrostatic pressure (/) [46], especially for the A1(TO2), A1(TO3), and E(TO4) phonon modes. The comparison for other peaks is also summarized in Table 2.
As will later be shown by theory, the phonon frequency should decrease under tension with a slightly different magnitude. That is why the phonon response of sample sLN-x is also measured experimentally in scattering geometry under tension. For tensile strain, the opposite response is observed as expected: the frequency decreased on applying tension to the sample. For example, phonon mode E(TO6) shows the largest response as for compression with a slope of 2.88 cm-1/GPa. The plot for E(TO6) and the slopes for all peaks are provided in SI.
| sLN-x (cm-1/GPa) | 5Mg-LN-x (cm-1/GPa) | |||||
| Phonon modes | (XX)Z | (XY)Z | (YY)Z | (XX)Z | (XY)Z | (YY)Z |
| 2.13 0.52 | * | 2.06 0.58 | - | * | - | |
| 3.29 0.17 | * | 3.66 0.17 | - | * | - | |
| 0.39 0.94 | * | 0.29 0.71 | - | * | - | |
| 1.96 0.21 | * | 2.32 0.19 | 3.07 0.83 | * | 3.79 0.80 | |
| 0.70 0.26 | 0.63 0.26 | 1.98 0.27 | 0.71 0.35 | 1.05 0.22 | 2.68 0.29 | |
| 0.34 0.17 | 0.26 0.25 | 1.68 0.16 | -0.51 0.45 | -0.63 0.52 | 1.52 0.3 | |
| 1.28 0.44 | 1.39 0.65 | 1.67 0.42 | - | - | - | |
| 2.12 0.35 | 1.56 0.59 | 3.02 0.4 | - | - | - | |
| 6.36 0.98 | 6.25 1.5 | 8.17 0.87 | 5.87 4.23 | 3.77 3.69 | 9.38 2.16 | |
| 0.44 0.37 | 0.86 1.51 | 1.24 0.22 | - | - | - | |
| -0.47 0.30 | 0.37 0.36 | 3.03 0.27 | -0.29 0.8 | 1.66 0.69 | 4.32 0.67 | |
III.2 Strain Simulation
First, to assess the quality of the models in this work, the calculated phonon frequencies of unstrained stoichiometric LN and LT are compared with previous works [31] (all data appear in the SI). Compared to our experiment, the largest deviation from the experimental values for LN and LT occurs for the A1(TO4) mode with and , respectively. The mean deviation from experimental values for LN and LT is about and . Thus, compared with the mean deviation of the theoretical results of Ref. [31] which was about and for LN and LT, there is a close agreement with both the theoretical and experimental values. In addition, the typical deviations are also consistent with literature values, such as Refs. [41, 47].
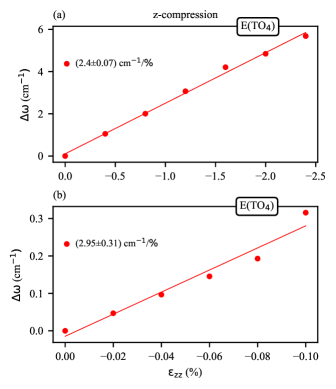
In order to demonstrate the dependence of the phonon frequencies predicted by our calculations, the E(TO4) mode of LN was chosen [see Fig. 3]. Figures 3(a) and (b) show the results of the calculations with lower and higher strains, respectively. The frequency shift of the E(TO4) mode has an approximately linear dependence on the applied compression. Such a linear dependence is observed in all of our calculations for each mode for both the compressive and tensile strain in stoichiometric LN and LT. This is consistent with the results of LN and LT under hydrostatic pressure by Mendes-Filho et al. [23]. In Fig. 3(a) the frequency increases up to and in (b) up to .
Our calculations predict for stoichiometric LN and LT that the degeneracy of the E modes is lifted under strain applied along the x and y direction due to the reduction of the threefold symmetry. This results in splitting into two branches, which is consistent with previous studies on various 2D materials, that reported a mode splitting under strain due to the reduction of symmetry [48, 49]. Consequently, for strains applied along the x and y direction, all E modes are considered separately. For example, the E(TO9) mode for compression in x and y directions has a significant splitting [see Fig. 4(a)]. In contrast, it is noticeable that the E(TO9) mode remains degenerate for z compression since the considered strains in the z direction of both LN and LT do not lead to any reduced symmetry. This is the case for all E modes of LN and LT under strain.
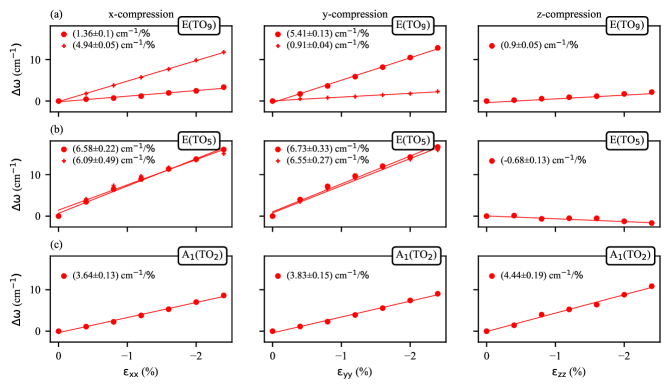
Since the slopes, for strains in the x and y directions of LN and LT, are very similar [see SI] due to the symmetry of the crystals, Table 3 shows only the slopes for strain in the x direction. With the exception of the A1(TO1) and A1(TO4) modes, compressive strain leads to an increase in frequency, while tensile strain leads to a decrease in frequencies, which is consistent with results from previous research on other materials [50, 51]. Comparing the slopes under the compressive and tensile strain of LN, we find that they hardly differ for the individual modes. This behavior is not surprising, however, it is not universal, as shown for a 2D material by Pak et al. [50]. Although under both compressive and tensile strain the E(TO5/6) modes have the largest frequency shifts, the E(TO6) mode has a larger slope than the E(TO5) mode under compression. However, this relation turns around under tensile strain as can be seen in Table 3. This applies to strain in the x and y direction for both LN and LT (see SI).
| Phonon | LN comp. | LN tens. | LT comp. |
|---|---|---|---|
| mode | |||
| 1.31 | -2.87 | 3.16 | |
| 3.64 | -4.78 | 4.51 | |
| 5.18 | -7.08 | 4.84 | |
| 3.95 | -3.79 | 3.93 | |
| 0.68/3.26 | -1.56/-3.37 | 1.32/1.45 | |
| 1.52/0.32 | -3.69/0.04 | 2.68/0.91 | |
| 1.09/2.24 | -4.40/-1.56 | 2.62/2.45 | |
| 2.19/1.98 | -3.42/-1.65 | 2.73/2.40 | |
| 6.58/6.09 | -9.57/-13.57 | 7.39/8.31 | |
| 12.84/12.39 | -4.93/-3.76 | 14.82/13.58 | |
| 4.18/2.72 | 1.01/-1.52 | 0.83/2.02 | |
| 3.63/0.91 | -0.67/-4.51 | 4.65/1.54 | |
| 1.36/4.94 | 0.70/-5.12 | 4.00/3.45 |
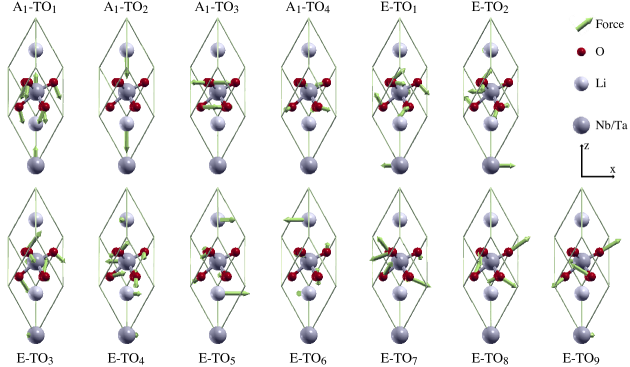
In addition, the results of LT under compression are listed in Table 3 for the same modes. In direct comparison with the results of LN, they are very similar along both directions, as well as magnitude. This is in agreement with Mendes-Filho et al. [23] and expected since LN and LT are isostructural. Nevertheless, there are some small deviations. In particular, the degeneracy lifting is attenuated compared to LN. For instance, the upper branch of the E(TO1) mode has a notable lower slope than that of LN. Also, the E(TO9) mode exhibits a significantly attenuated degeneracy lift for LT under compression than for LN. These deviations can be explained with the help of the eigenvectors. In Fig. 5 the eigenvectors of A1(TO1-4) and E(TO1-9) are shown in the rhombohedral unit cell [41, 31]. Such modes with high vibrational contributions from Nb and Ta ions, like the E(TO1) mode, lead to a slightly different vibrational behavior [31]. The modes that have in turn low contributions of Nb and Ta ions with respect to their eigenvectors, are very similar under compression of LN and LT. Since in the E(TO9) mode, the displacement of O is more involved than that of Nb/Ta, the reason for the difference between LN and LT may be due to the nature of Nb/Ta-O bond, similar to observations in Refs. [31, 41]. The mean Nb-O distance () is larger than that of Ta-O (). Stronger bonding with the oxygen atoms, and thus larger deformation of the oxygen octahedron, might be the reason for the difference between LN and LT concerning the E(TO9) mode. Also, slight differences in E(TO7) and E(TO8), which are pure distortions of the oxygen octahedron, might be related to the different Nb/Ta-O bonds.
The E(TO5/6) and A1(TO2) modes are characteristic for LN and LT under strain, since these have particularly high slopes, as shown in Table 3 and Fig. 4(b) and (c). This is also in agreement with Ref. [23]. The E(TO5/6) are especially sensitive to strain in the x and y directions. This can be explained by a simple analysis of their eigenvectors. In Fig. 5 it can be seen that these two modes, in contrast to all other modes, are characterized by particularly large displacements of the lithium ions parallel to the x-y-plane. Hence, these modes are most affected when the distances between the ions parallel to the x-y-plane are shortened. The A1(TO2) mode has among the largest slope for strain along the z direction. This can be reasonably explained in terms of the eigenvectors as well. As seen in Fig. 5, the ions of the A1(TO2) mode vibrate in z direction. When compression in the z direction shortens the bond length between the ions parallel to their displacement, the frequency is expected to increase. As the eigenvectors of the A1(TO2) mode point most in the z direction, it consequently has the largest slope compared to all other modes when compressed in the z-direction. All further data and results on LN and LT under compressive and tensile strain are provided in the SI.
III.3 Discussion: Comparing theory and experiment
As mentioned in the introduction section, the calculations are performed in units of strain and the experiments are performed in units of stress. In order to compare both results we have converted the experimental values of stress into values of strain using the equation given below:
| (4) |
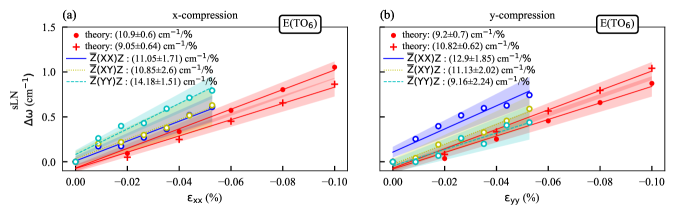
where is Young’s Modulus of a sample [52]. The calculated value of Young’s Moduli of LN along the x, y, and z axes are , , and , respectively [see calculations in SI]. For every measured stress, we calculated the respective strain value and plotted the corresponding frequency shift along with the theoretical data as a function of strain [see Fig. 6]. Since the stoichiometric samples are the closest system to the stoichiometric system considered for theoretical calculations, they are compared with theoretical data in Fig. 6.
For x compression, theoretically, the E(TO6) mode shows lifting of the degeneracy in accordance with the results of Sec. III.2. For a more accurate comparison, the slopes for higher strains for y and z compression are listed in Table 4. The theoretical results on the degeneracy lifting offer a new interpretation of the experimental results. In particular, comparing the data for the E(TO7) mode with compression in the x direction, it can be seen that the data for the (YY)Z resembles the upper branch, and its slope of the theoretical data, and the data for the (XY)Z and (XX)Z geometry is similar to the theoretical data and slope of the lower branch. For y compression, the same can be observed, with the (XY)Z and (XX)Z geometries having the higher slope, respectively, and the (YY)Z having the lower slope, i.e. the slopes flip for y compression. Consequently, it can be assumed that with the help of different scattering geometries the lifting of the degeneracy by x and y compression can be reproduced experimentally.
Based on this interpretation, it can be concluded that the experimental and theoretical data fit very well. For a more accurate comparison, the slopes for higher strains for y and z compression are listed in Table 4.
Interpreting the experimental data as lifting the degenerate E modes on x and y compression can also help characterize compressed LN. From the data, it can be implied that one has x compressed LN when the (YY)Z geometry measures a higher slope than for the (XY)Z and (XX)Z geometries. If, on the other hand, one has y compressed LN, this arguement just reverts. In contrast, if no splitting E modes are observed in different scattering geometries, it can be concluded that the LN under investigation must be a z-compressed sample. Furthermore, the experimental comparison in Fig. 6 and Table 4, confirms the prediction that the E(TO6) mode is the mode with highest slope for x and y compression. In comparison with Sec. III.1 and III.2, the slopes for x compression are very similar to those for y compression.
| sLN-y (cm-1/%) | 5Mg-LN-z (cm-1/%) | |||||||
|---|---|---|---|---|---|---|---|---|
| Modes | (XX)Z | (XY)Z | (YY)Z | Theory | (ZZ)X | (YZ)X | (YY)X | Theory |
| 8.01 1.41 | * | 6.31 0.68 | * | * | * | * | * | |
| 7.95 0.35 | * | 6.18 0.68 | * | * | * | * | * | |
| 4.24 1.94 | * | 2.82 0.68 | * | * | * | * | * | |
| 6.75 0.33 | * | 5.12 0.68 | * | * | * | * | * | |
| * | * | * | 1.15 | -4.97 0.93 | * | -5.10 5.63 | -2.97 | |
| * | * | * | 3.83 | 7.49 1.08 | * | 5.98 4.73 | 4.44 | |
| * | * | * | 4.47 | 4.54 1.24 | * | -0.19 1.4 | 0.65 | |
| * | * | * | 3.87 | -4.94 0.65 | * | -6.94 0.60 | -4.91 | |
| 6.27 0.63 | 5.97 0.63 | 4.41 0.60 | 3.25/0.83 | * | 0.40 0.44 | -0.15 0.54 | -0.61 | |
| 5.48 0.35 | 4.84 0.35 | 1.56 0.34 | -0.70/2.36 | * | 0.61 0.53 | 1.08 1.51 | -2.55 | |
| 7.56 1.04 | 5.81 1.04 | 4.68 1.07 | 1.34/2.21 | * | 1.46 1.75 | 1.44 7.44 | 0.50 | |
| 4.5 0.69 | 4.44 0.69 | 2.42 0.68 | 2.03/2.12 | * | 5.43 0.92 | -3.84 11.74 | 2.40 | |
| * | * | * | 6.73/6.55 | * | * | * | -0.68 | |
| 12.9 1.85 | 11.13 1.85 | 9.16 2.02 | 13.00/11.86 | * | 0.72 2.31 | 1.90 1.9 | -0.94 | |
| 3.41 0.68 | 1.64 0.68 | 1.23 0.82 | 4.12/2.01 | * | 7.21 2.64 | 7.69 0.59 | 4.75 | |
| 8.56 0.48 | 6.72 0.48 | 3.27 0.70 | 3.75/1.00 | * | 6.73 0.62 | 6.20 5.94 | 3.35 | |
| - | - | - | 5.41/0.91 | - | - | -7.95 13.41 | 0.90 | |
As concluded from the experimental results in Sec. III.1, the 5 MgO-doped LN responds equally well as the stoichiometric LN, upon compression. We compare the 5Mg-LN-z sample with theoretical data of stoichiometric LN for z compression. As theoretically predicted and confirmed by the experiment, both E(TO7) and A1(TO4) modes show a linear dependence on z compression [see Fig.7(a)-(b)]. For the E(TO7) mode, no degeneracy lifting occurs for z compression, which can also be seen in the experimental data. This investigation provides another rule for characterizing compressed LN.
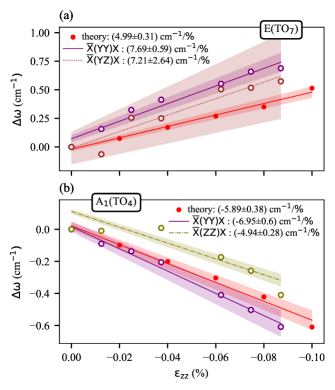
As described in Sec. III.2 the frequencies of most modes are linearly increasing with increasing compression. For a few modes, this is not the case, e.g., for the A1(TO4) modes. For this mode, a linear decrease in frequency with increasing compression is theoretically predicted. This is consistent with experimental measurements, as shown in Fig. 7(b). This unusual behavior can also be explained with the help of the eigenvectors. In Fig. 5 it can be seen that the oxygen ions move towards the positively charged niobium ions and then away from them. If z compression reduces the distance between the cations, then as the oxygen ions displace away from niobium, the restoring force towards niobium may be weakened by the shortened distance to the lithium ions, which also exert the Coulomb force on the negatively-charged oxygen ions. Thus, the frequency for z compression might be reduced. In a similar way, this explanation can also be applied to A1(TO1) modes. All other modes for comparison for z compression are shown in Table 4.
IV Conclusions
Experimental and theoretical phonon frequencies as a function of uniaxial strain have been evaluated and compared for LN and LT. This investigation has shown that all phonon modes are affected by strain. Both theoretical and experimental results are consistent with the roughly linear behavior of the modes and can be reasonably explained by an analysis of the calculated eigenvectors. The linearity of the slopes confirms the previous works under hydrostatic pressure and under external electric fields [21, 23].
Accordingly, the obtained slopes provide reference values for the peak shifts. Furthermore, with the help of the slopes, it is possible to characterize compressed LN crystals and, hence, the vicinity of domain walls and wave guides in LN. Our experimental and theoretical investigations show that x and y compressed LN has particularly high peak shifts for the E(TO5/6) modes and z compressed LN for the A1(TO2), E(TO7) and E(TO8) modes [23].
Furthermore, calculations have shown that the degeneracy of the E modes is lifted for x and y compression upon symmetry reduction. The splitting has also been observed in our experiments when measured under different scattering geometries. Based on our theoretical and experimental investigations three rules can be formulated to characterize the direction of uniaxial compression of a LN sample using different scattering geometries. This only concerns the E modes. The sample is x compressed if higher frequency shifts are observed for the (YY)Z geometry than for the (XY)Z and (XX)Z geometries when applying the same compressive stress. For y compression, the opposite is the case. In contrast, when no differences are observed between the frequency shift of the E modes for various scattering geometries, it can be concluded that the sample under investigation must be z compressed.
Furthermore, the calculation has shown that the behavior of LT under strain is not significantly different from that of LN. Experimentally, it has additionally revealed that the frequency shifts under compression of stoichiometric and 5% MgO-doped LN are comparable. As DWs in LN and LT can be represented in the first approximation as strained lattices, our investigation might be helpful to understand the Raman signal of DWs. Further studies of strained samples, concerning e.g., their linear and non-linear optical response might further help to characterize ferroelectric DWs.
Acknowledgements.
We thank Dr Clifford W. Hicks for the help in designing the stress cell used in the measurements. The authors gratefully acknowledge the financial support by the Deutsche Forschungsgemeinschaft (DFG) through joint DFG-ANR project TOPELEC (No. EN-434/41-1 and No. ANR-18-CE92-0052), FOR5044 (ID: 426703838; http:www.For5044.de), as well as the Würzburg-Dresden Cluster of Excellence ”ct.qmat” (EXC 2147). Calculations for this research were conducted on the Lichtenberg high-performance computer of the TU Darmstadt and at the Höchstleistungrechenzentrum Stuttgart (HLRS). The authors furthermore acknowledge the computational re- sources provided by the HPC Core Facility and the HRZ of the Justus-Liebig-Universität Gießen. Furthermore, we thank D. Bieberstein and T. Gemming from IFW Dresden for assistance with dicing of the wafers and support from the International Max Planck Research School for Chemistry and Physics of Quantum Materials.
References
- [1] G. D. Miller, R. G. Batchko, W. M. Tulloch, D. R. Weise, M. M. Fejer, and R. L. Byer, “42%-efficient single-pass cw second-harmonic generation in periodically poled lithium niobate,” Optics Letters, vol. 22, p. 1834, dec 1997.
- [2] R. Mouras, M. D. Fontana, P. Bourson, and A. V. Postnikov, “Lattice site of Mg ion in LiNbO3 crystal determined by Raman spectroscopy,” Journal of Physics: Condensed Matter, vol. 12, pp. 5053–5059, jun 2000.
- [3] A. Yariv, S. S. Orlov, and G. A. Rakuljic, “Holographic storage dynamics in lithium niobate: theory and experiment,” Journal of the Optical Society of America B, vol. 13, p. 2513, nov 1996.
- [4] N. Iyi, K. Kitamura, F. Izumi, J. Yamamoto, T. Hayashi, H. Asano, and S. Kimura, “Comparative study of defect structures in lithium niobate with different compositions,” Journal of Solid State Chemistry, vol. 101, pp. 340–352, dec 1992.
- [5] A. Bartasyte, S. Margueron, T. Baron, S. Oliveri, and P. Boulet, “Toward High-Quality Epitaxial LiNbO3 and LiTaO3 Thin Films for Acoustic and Optical Applications,” Advanced Materials Interfaces, vol. 4, no. 8, 2017.
- [6] Y. Li, W. G. Schmidt, and S. Sanna, “Defect complexes in congruent LiNbO3 and their optical signatures,” Physical Review B, vol. 91, p. 174106, may 2015.
- [7] Y. Furukawa, K. Kitamura, S. Takekawa, A. Miyamoto, M. Terao, and N. Suda, “Photorefraction in LiNbO3 as a function of [Li]/[Nb] and MgO concentrations,” Applied Physics Letters, vol. 77, pp. 2494–2496, oct 2000.
- [8] G. Stone and V. Dierolf, “Influence of ferroelectric domain walls on the Raman scattering process in lithium tantalate and niobate,” Optics Letters, vol. 37, p. 1032, mar 2012.
- [9] G. F. Nataf, M. Guennou, A. Haußmann, N. Barrett, and J. Kreisel, “Evolution of defect signatures at ferroelectric domain walls in Mg-doped LiNbO,” physica status solidi (RRL) - Rapid Research Letters, vol. 10, pp. 222–226, mar 2016.
- [10] M. Rüsing, S. Neufeld, J. Brockmeier, C. Eigner, P. Mackwitz, K. Spychala, C. Silberhorn, W. G. Schmidt, G. Berth, A. Zrenner, and S. Sanna, “Imaging of 180∘ ferroelectric domain walls in uniaxial ferroelectrics by confocal Raman spectroscopy: Unraveling the contrast mechanism,” Physical Review Materials, vol. 2, p. 103801, oct 2018.
- [11] X. Wang, P. O. Weigel, J. Zhao, M. Ruesing, and S. Mookherjea, “Achieving beyond-100-GHz large-signal modulation bandwidth in hybrid silicon photonics Mach Zehnder modulators using thin film lithium niobate,” APL Photonics, vol. 4, p. 096101, sep 2019.
- [12] M. Rusing, P. O. Weigel, J. Zhao, and S. Mookherjea, “Toward 3D Integrated Photonics Including Lithium Niobate Thin Films: A Bridge Between Electronics, Radio Frequency, and Optical Technology,” IEEE Nanotechnology Magazine, vol. 13, pp. 18–33, aug 2019.
- [13] D. Zhu, L. Shao, M. Yu, R. Cheng, B. Desiatov, C. J. Xin, Y. Hu, J. Holzgrafe, S. Ghosh, A. Shams-Ansari, E. Puma, N. Sinclair, C. Reimer, M. Zhang, and M. Lončar, “Integrated photonics on thin-film lithium niobate,” Advances in Optics and Photonics, vol. 13, p. 242, jun 2021.
- [14] M. G. Vazimali and S. Fathpour, “Applications of thin-film lithium niobate in nonlinear integrated photonics,” Advanced Photonics, vol. 4, pp. 1–18, may 2022.
- [15] C. Wang, M. Zhang, B. Stern, M. Lipson, and M. Lončar, “Nanophotonic lithium niobate electro-optic modulators,” Optics Express, vol. 26, p. 1547, jan 2018.
- [16] R. Takigawa, T. Tomimatsu, E. Higurashi, and T. Asano, “Residual Stress in Lithium Niobate Film Layer of LNOI/Si Hybrid Wafer Fabricated Using Low-Temperature Bonding Method,” Micromachines, vol. 10, p. 136, feb 2019.
- [17] K. Prabhakar, R. J. Patton, and R. M. Reano, “Stress reduction and wafer bow accommodation for the fabrication of thin film lithium niobate on oxidized silicon,” Journal of Vacuum Science & Technology B, vol. 39, p. 062208, dec 2021.
- [18] M. Friedrich, W. G. Schmidt, A. Schindlmayr, and S. Sanna, “Optical properties of titanium-doped lithium niobate from time-dependent density-functional theory,” Physical Review Materials, vol. 1, p. 034401, aug 2017.
- [19] G. Zisis, C. Y. J. Ying, P. Ganguly, C. L. Sones, E. Soergel, R. W. Eason, and S. Mailis, “Enhanced electro-optic response in domain-engineered LiNbO3 channel waveguides,” Applied Physics Letters, vol. 109, p. 021101, jul 2016.
- [20] S. Reitzig, M. Rüsing, J. Zhao, B. Kirbus, S. Mookherjea, and L. M. Eng, ““Seeing Is Believing”—In-Depth Analysis by Co-Imaging of Periodically-Poled X-Cut Lithium Niobate Thin Films,” Crystals, vol. 11, p. 288, mar 2021.
- [21] G. Stone, B. Knorr, V. Gopalan, and V. Dierolf, “Frequency shift of Raman modes due to an applied electric field and domain inversion in LiNbO3,” Physical Review B, vol. 84, p. 134303, oct 2011.
- [22] M. D. Fontana and P. Bourson, “Microstructure and defects probed by Raman spectroscopy in lithium niobate crystals and devices,” Applied Physics Reviews, vol. 2, p. 040602, dec 2015.
- [23] J. Mendes-Filho, V. Lemos, and F. Cerdelra, “Pressure dependence of the Raman spectra of LiNbO3 and LiTaO3,” Journal of Raman Spectroscopy, vol. 15, pp. 367–369, dec 1984.
- [24] A. M. Heyns and J. B. Clark, “Effect of pressure on the Raman spectra of solids: 1-KC103,” Journal of Raman Spectroscopy, vol. 14, pp. 342–346, oct 1983.
- [25] T. Jach, S. Kim, V. Gopalan, S. Durbin, and D. Bright, “Long-range strains and the effects of applied field at 180∘ ferroelectric domain walls in lithium niobate,” Physical Review B, vol. 69, p. 064113, feb 2004.
- [26] D. A. Scrymgeour, V. Gopalan, A. Itagi, A. Saxena, and P. J. Swart, “Phenomenological theory of a single domain wall in uniaxial trigonal ferroelectrics: Lithium niobate and lithium tantalate,” Physical Review B, vol. 71, p. 184110, may 2005.
- [27] J. P. Perdew, J. A. Chevary, S. H. Vosko, K. A. Jackson, M. R. Pederson, D. J. Singh, and C. Fiolhais, “Erratum: Atoms, molecules, solids, and surfaces: Applications of the generalized gradient approximation for exchange and correlation,” Physical Review B, vol. 48, pp. 4978–4978, aug 1993.
- [28] J. P. Perdew, K. Burke, and M. Ernzerhof, “Generalized Gradient Approximation Made Simple,” Physical Review Letters, vol. 77, pp. 3865–3868, oct 1996.
- [29] G. Kresse and J. Furthmüller, “Efficient iterative schemes for ab initio total-energy calculations using a plane-wave basis set,” Physical Review B, vol. 54, pp. 11169–11186, oct 1996.
- [30] P. E. Blöchl, “Projector augmented-wave method,” Physical Review B, vol. 50, pp. 17953–17979, dec 1994.
- [31] S. Sanna, S. Neufeld, M. Rüsing, G. Berth, A. Zrenner, and W. G. Schmidt, “Raman scattering efficiency in LiTaO3 and LiNbO3 crystals,” Physical Review B, vol. 91, p. 224302, jun 2015.
- [32] A. W. Warner, M. Onoe, and G. A. Coquin, “Determination of Elastic and Piezoelectric Constants for Crystals in Class (3 m),” The Journal of the Acoustical Society of America, vol. 42, pp. 1223–1231, dec 1967.
- [33] W. G. Schmidt, F. Bechstedt, and G. P. Srivastava, “III-V(110) surface dynamics from an ab initio frozen-phonon approach,” Physical Review B, vol. 52, pp. 2001–2007, jul 1995.
- [34] E. Singh, H. Beccard, Z. H. Amber, J. Ratzenberger, C. W. Hicks, M. Rüsing, and L. M. Eng, “Tuning domain wall conductivity in bulk lithium niobate by uniaxial stress,” Phys. Rev. B, vol. 106, p. 144103, Oct 2022.
- [35] Henkel Loctite®, “Loctite stycast 2850ft,” 2014.
- [36] B. Kirbus, C. Godau, L. Wehmeier, H. Beccard, E. Beyreuther, A. Haußmann, and L. M. Eng, “Real-Time 3D Imaging of Nanoscale Ferroelectric Domain Wall Dynamics in Lithium Niobate Single Crystals under Electric Stimuli: Implications for Domain-Wall-Based Nanoelectronic Devices,” ACS Applied Nano Materials, vol. 2, pp. 5787–5794, sep 2019.
- [37] C. Godau, T. Kämpfe, A. Thiessen, L. M. Eng, and A. Haußmann, “Enhancing the Domain Wall Conductivity in Lithium Niobate Single Crystals,” ACS Nano, vol. 11, pp. 4816–4824, may 2017.
- [38] P. S. Bednyakov, B. I. Sturman, T. Sluka, A. K. Tagantsev, and P. V. Yudin, “Physics and applications of charged domain walls,” npj Computational Materials, vol. 4, p. 65, dec 2018.
- [39] C. S. Werner, S. J. Herr, K. Buse, B. Sturman, E. Soergel, C. Razzaghi, and I. Breunig, “Large and accessible conductivity of charged domain walls in lithium niobate,” Scientific Reports, vol. 7, p. 9862, dec 2017.
- [40] A. Bartasyte, S. Margueron, A. M. Glazer, E. Simon, I. Gregora, S. Huband, and P. A. Thomas, “Vibrational modes and overlap matrix of LiNb1-x TaxO3 mixed crystals,” Physical Review B, vol. 99, p. 094306, mar 2019.
- [41] M. Rüsing, S. Sanna, S. Neufeld, G. Berth, W. G. Schmidt, A. Zrenner, H. Yu, Y. Wang, and H. Zhang, “Vibrational properties of LiNbO1-xTaxO3 mixed crystals,” Physical Review B, vol. 93, p. 184305, may 2016.
- [42] S. Margueron, A. Bartasyte, A. M. Glazer, E. Simon, J. Hlinka, I. Gregora, and J. Gleize, “Resolved E-symmetry zone-centre phonons in LiTaO3 and LiNbO3,” Journal of Applied Physics, vol. 111, p. 104105, may 2012.
- [43] A. Irzhak, D. Irzhak, V. Khvostikov, K. Pundikov, D. Roshchupkin, and R. Fahrtdinov, “Effect of local changes in the composition of the LiNb1-x TaxO3 single crystal on the Raman spectra,” Journal of Raman Spectroscopy, vol. 53, pp. 969–976, may 2022.
- [44] N. V. Sidorov and M. N. Palatnikov, “Raman spectra of lithium niobate crystals heavily doped with zinc and magnesium,” Optics and Spectroscopy, vol. 121, pp. 842–850, dec 2016.
- [45] A. Ridah, P. Bourson, M. D. Fontana, and G. Malovichko, “The composition dependence of the Raman spectrum and new assignment of the phonons in LiNbO3,” Journal of Physics: Condensed Matter, vol. 9, pp. 9687–9693, nov 1997.
- [46] M. Tejerina, K. Pereira da Silva, A. Goñi, and G. Torchia, “Hydrostatic-pressure dependence of raman-active optical phonons in nd:mg:linbo3,” Optical Materials, vol. 36, no. 2, pp. 581–583, 2013.
- [47] P. Hermet, M. Veithen, and P. Ghosez, “First-principles calculations of the nonlinear optical susceptibilities and Raman scattering spectra of lithium niobate,” Journal of Physics: Condensed Matter, vol. 19, p. 456202, nov 2007.
- [48] D. Doratotaj, J. R. Simpson, and J.-A. Yan, “Probing the uniaxial strains in MoS2 using polarized Raman spectroscopy: A first-principles study,” Physical Review B, vol. 93, p. 075401, feb 2016.
- [49] M. Huang, H. Yan, C. Chen, D. Song, T. F. Heinz, and J. Hone, “Phonon softening and crystallographic orientation of strained graphene studied by Raman spectroscopy,” Proceedings of the National Academy of Sciences of the United States of America, vol. 106, no. 18, pp. 7304–7308, 2009.
- [50] S. Pak, J. Lee, Y.-W. Lee, A.-R. Jang, S. Ahn, K. Y. Ma, Y. Cho, J. Hong, S. Lee, H. Y. Jeong, H. Im, H. S. Shin, S. M. Morris, S. Cha, J. I. Sohn, and J. M. Kim, “Strain-Mediated Interlayer Coupling Effects on the Excitonic Behaviors in an Epitaxially Grown MoS2/WS2 van der Waals Heterobilayer,” Nano Letters, vol. 17, pp. 5634–5640, sep 2017.
- [51] B. G. Oliveira, A. Zabardasti, H. Goudarziafshar, and M. Salehnassaj, “The electronic mechanism ruling the dihydrogen bonds and halogen bonds in weakly bound systems of H3SiHHOX and H3SiHXOH (X = F, Cl, and Br),” Journal of Molecular Modeling, vol. 21, p. 77, apr 2015.
- [52] R. E. Newnham, Properties of Materials. Oxford University Press, nov 2004.