Discharge of elongated grains in silos under rotational shear
Abstract
The discharge of elongated particles from a silo with rotating bottom is investigated numerically. The introduction of a slight transverse shear reduces the flow rate by up to 70% compared to stationary bottom, but the flow rate shows a modest increase by further increasing the external shear. Focusing on the dependency of flow rate on orifice diameter , the spheres and rods show two distinct trends. For rods, in the small aperture limit seems to follow an exponential trend, deviating from the classical power-law dependence. These macroscopic observations are in good agreement with our earlier experimental findings [Phys. Rev. E 103, 062905 (2021)]. With the help of the coarse-graining methodology we obtain the spatial distribution of the macroscopic density, velocity, kinetic pressure, and orientation fields. This allows us detecting a transition from funnel to mass flow pattern, caused by the external shear. Additionally, averaging these fields in the region of the orifice reveals that the strong initial decrease in is mostly attributed to changes in the flow velocity, while the weakly increasing trend at higher rotation rates is related to increasing packing fraction. Similar analysis of the grain orientation at the orifice suggests a correlation of the flow rate magnitude with the vertical orientation and the packing fraction at the orifice with the order of the grains. Lastly, the vertical profile of mean acceleration at the center of the silo denotes that the region where the acceleration is not negligible shrinks significantly due to the strong perturbation induced by the moving wall.
I Introduction
Granular materials are everywhere in nature and they are often used in industrial processes. Since long time, humans have employed containers like silos and bins to store them, so it is technologically important to understand their mechanical response under these specific boundary conditions. Thus, notable research efforts have been undertaken in this direction, where the ultimate aim is to derive the macroscopic response of a granular sample from the contact interactions of the whole particle ensemble [1, 2].
Developing technological solutions, several types of silo flow patterns have been detected. For instance, a funnel flow pattern is characterized by the initial particle flow in the central region of the silo. Consequently, funnel flow silos often have stagnant grains near the walls, leading to undesired in-service issues. In contrast, mass flow pattern provides a uniform outflow without a central flow channel, and the material flows down as a continuum column. Achieving mass flow condition is ideal, in particular, for mixtures of particles that are susceptible to segregation.
The dependence of the particle flow rate on the orifice diameter also has a significant technological interest. Due to its simplicity, the most used expression is the well-known Beverloo’s correlation: [3]. In the formulation is the particle diameter and the parameter enables a good fit of the experimental data for small orifices. In the large-orifice limit (), however, a simple power-law is obtained. Recently, Janda et al. presented a different approach to predict the particle flow rate [4]. Examining the kinetic spatial profiles of density and velocity at the orifice of a two-dimensional (2D) silo, they obtained self-similar functions, when using the orifice size as a characteristic length. This analysis led them to the formulation of the expression in which the term in the parentheses accounts for the scaling of the packing fraction and thus the density. They found the fitting parameters , to be around , and 6 particle diameters, respectively. In all the described approaches, the value of the exponent can be justified by arguing that once a particle reaches a distance to the orifice, it starts accelerating. The region of accelerating flow is historically known as the free fall arch region.
To control the outflow in silos, several approaches have been used. Typically, the silos and hoppers have been perturbed, for instance, using electric fields to control the outflow of metallic beads [5], magnetic fields to introduce vibrations in the orifice region [6], or inducing a repulsive force between the grains [7, 8]. The impact of external vibration on the macroscopic flow rate of a silo is far from being understood. More than thirty years ago, Hunt et al. experimentally observed a flow rate enhancement when increasing the intensity of a horizontal vibration [9]. Vertical vibrations, however, produce a more complex response, showing a flow rate decrease when rising the dimensionless acceleration amplitude . On the contrary, when using a higher oscillation frequency, , a slight increase of against the same parameter was encountered [10]. Pascot et al. have recently obtained experimentally and numerically the existence of two different regimes when varying the oscillation amplitude , and fixing the frequency [11]. In particular, when analyzing small orifices, it is accepted that introducing vibrations alters the arches’ stability [12, 13], and the distributions of the unclogging times [14, 15].
Imposing an external shear is also a promising alternative to avoid the formation of stable arches in silos. In the past, the discharge of a cylindrical silo with rotating bottom was explored [16]. However, the authors only focused their attention on the dynamics of the system’s surface [16]. Later on, Hilton and Cleary [17] examined the impact of the external shear on the flow rate , finding that it is unaffected when a low shear rate is applied. However, after reaching a critical value, increases monotonically with the rotational frequency.
Very recently, the discharge of wooden rods from a cylindrical silo perturbed by a rotating bottom wall was investigated experimentally [18]. It was mainly found that, for small orifices, the flow rate deviates from the classical power-law correlation , and an exponential dependence is detected. More interestingly, in the continuous flow regime, the introduction of transversal shear induced by the bottom wall’s movement decreases the flow rate significantly [18] compared to spheres with similar effective dimensions [19]. Further increasing the rotation rate results in an increase in the flow rate, which is more significant for smaller orifice sizes, where the flow is intermittent. Since elongated particles in a shear flow develop orientational ordering [20, 21], it is expected that changes in particle orientations due to the external shear will alter the discharge rate. The complex behavior observed in the experiments was not fully explained since the experimental approach has the limitation of not accessing the velocity field, the density distribution and the particle orientations inside the silo.
In this work, we introduce a numerical approach, which replicates the experimental scenario examined in Ref. [18], reproducing their main macroscopic observations. Our aim is to extract relevant features of the process, which were not accessible experimentally. Thus, our approach shed light on understanding, how silo discharge of nonspherical grains is influenced by an external transversal shear.
II Numerical Model
The numerical simulation consists in, using a Discrete Element Method (DEM) implementation [22], modeling the mechanical behavior of elongated particles. The modeled system is a cylindrical flat silo with a diameter of cm, and bottom wall with a circular orifice in the center, with diameter . As a novelty, an external transversal shear is imposed by the rotation of the silo bottom wall (see Fig. 1).
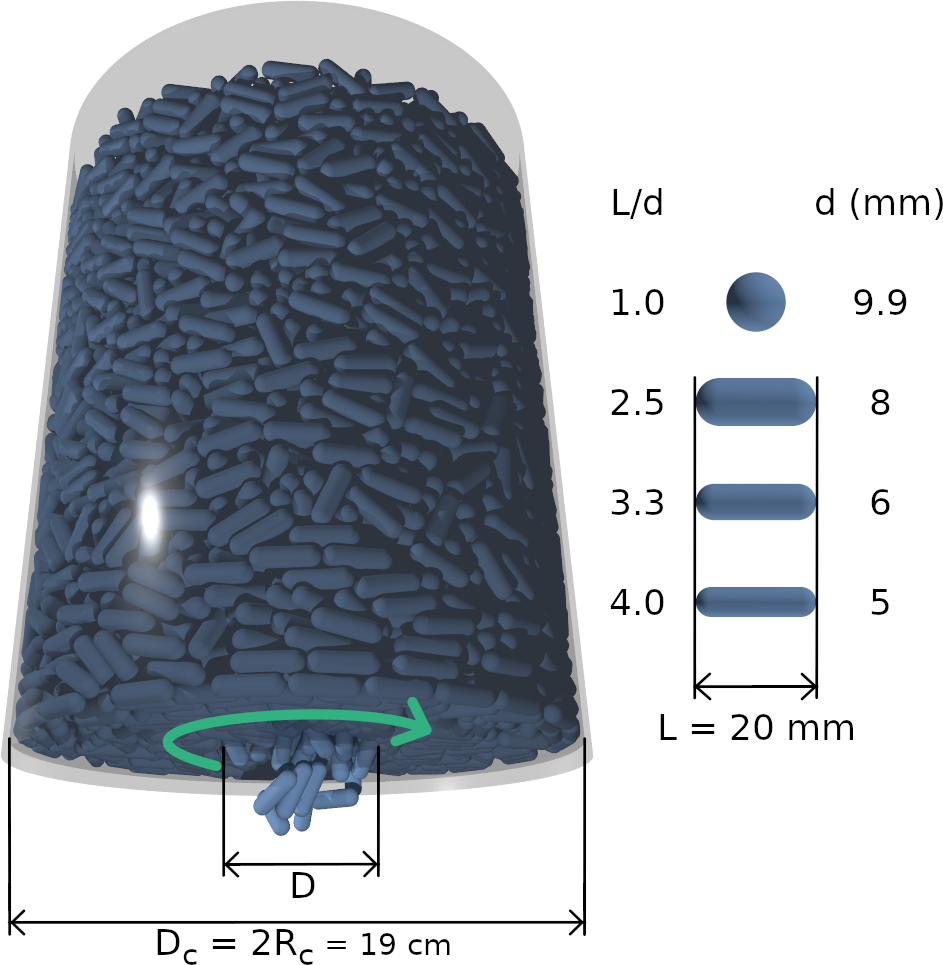
We examine the silo discharge, varying systematically the particle elongation. For simplicity, we employ spherocylinders to model the experimental wooden rods (see Ref. [18]). The model defines pairwise forces between contacting particles. The particle-particle interaction is computed using an algorithm for interacting spheropolyhedra [23, 24]; in particular, an implementation on GPU architecture [22]. A spherocylinder is defined by the location of its two vertices and its sphero-radius . The spherocylinder’s surface is depicted by the set of points at a distance from the segment which connects its two vertices. The contact detection between two spherocylinders involves finding the closest point between the two edges [25]. The overlap distance between two spherocylinders equals the overlap distance of two spheres of radius , located at each edge. Then, the contact force is determined as the sum of the normal and tangential components . The normal unit vector points from the center of one sphere to another, while the tangential is parallel to the tangential velocity. The normal force is calculated by a simple linear spring-dashpot model where is a spring coefficient, a damping coefficient, is the overlap between two particles, and is the relative velocity in the normal direction. The tangential force represents the friction between two particles, it is also modeled with a spring-dashpot but taking into account the constraint of Coulomb friction: . Here the first term represents a spring with coefficient and tangential deformation which is integrated from the following where is the relative tangential velocity. The vector is kept parallel to the contact plane by truncation [26]. The second term is proportional to the tangential velocity with a coefficient , while the particle friction sets the constraint for the force.
The DEM algorithm integrates the equations of motion for both translational and rotational degrees of freedom, accounting for gravity and the force acting between contacting particles. A velocity Verlet method [27] is used to integrate the translational, and a modified leapfrog [28] resolves the rotational ones.
As initial conditions, packing of monodisperse rods were created by letting a dilute granular gas settle inside the closed silo by gravity m/s. The system is composed of particles, and only in the case of is set to to reach a bit higher initial packing (note that in this case the particle’s volume is smaller). The discharge process starts by opening the orifice and simultaneously setting the rotation frequency of the bottom wall to one of the following values: and Hz. Simulation time for the discharge was in the range of 1–7 hours depending on the flow rate, thus overall discharge time, particle shape and the type of GPU used (NVIDIA GeForce RTX 2070 and 3080).
The simulation mimics the behavior of wooden particles, thus, the particle density is set to , a spring stiffness is used [29]. Other model parameters were and . The normal damping constant is dependent on the coefficient of restitution in the following way: [30]. The time step is s, which is smaller than 2% of the contact time between two colliding particles [31].
The DEM algorithm provides the evolution of the trajectories of all the particles, and their contact network, with the desired time resolution. Post-processing this data employing a coarse-graining methodology enables a well-defined continuous description of the granular flows, via the packing fraction
| (1) |
linear momentum , and velocity
| (2) |
fields [32, 33]. Here , are the mass and velocity of particle , and is non-negative integrable function that serves to coarse-grain our particles. In particular, we use a truncated Gaussian function , with chosen so that the integral of over all the space results in 1, the cutoff distance is and , where is the sphere equivalent diameter , with corresponding to the volume of the particle. Additionally, the contact and kinetic stress tensor fields are calculated in the following way:
| (3) |
| (4) |
While the former is computed by a line integral over considering the force acting between particles and , the kinetic stress represents a granular temperature due to the multiplication of the velocity fluctuation terms . In the case of elongated particles, the components of the mean orientational tensor also provide very useful information during the analysis. We have used the following formula for its coarse-graining:
| (5) |
where is the unit vector representing the particle’s direction. By definition, the diagonal elements of the orientation tensor are non-negative and fall between and , representing the degree of alignment in the specific direction. In this way, the quantity expressing the nematic order of the ensemble of particles is the largest eigenvalue of the tensor. With our convention takes values from (completely disordered) up to (fully ordered). In this work, we discuss the orientation of the particles in the cylindrical coordinate system due to the specific symmetry of the silo. Furthermore, for all the coarse-grained quantities we applied an averaging in the azimuthal direction in the following way: . More details about the data post-processing can be found in Ref. [32, 33, 34, 35, 26].
In our analysis, we are interested in steady-state conditions, namely, the part of the process in which the flow is stationary. In the case of the static bottom, the discharge slows down near the end of the process due to the lack of particles outside the stagnant zone. While in the case of the quickly rotating bottom, when the height of the material in the silo goes below about , the whole ensemble starts spinning faster. To exclude these initial and final effects, we focus on a time interval, where the flow is stationary in all cases. To have a better statistics, we ran simulations for each set of parameters, starting from three slightly different initial configurations, and apply time and ensemble averaging. Different seeds have been used for the random generator in order to construct different dilute granular gases at the beginning, which yielded distinct initial packings. In the case of small orifices with rotating bottom, we observed intermittent flow. To handle this, during the calculation of the flow rate we excluded the intervals larger than s where there was no flow.
III Results
III.1 Effect of rotational shear on the flow rate
Using a numerical approach, we aim to elucidate how the external transversal shear introduced by the bottom wall rotation impacts the discharge process. As mentioned earlier, a recent experimental work examined the flow of particles with aspect ratio and . Here, we extend these findings by systematically varying over a wider range. In line with the experiments, the length of the spherocylinder (measured from end-to-end) is the same mm, in all the cases. However, the aspect ratio is varied by changing the spherodiameter . In particular, we investigate the behavior of grains with the following aspect ratios: and , whereby refers to spherical particles. The diameter of the spherical particle is chosen so that its volume would be equal to the volume of a rod with : mm, which is also the definition for their equivalent diameter.
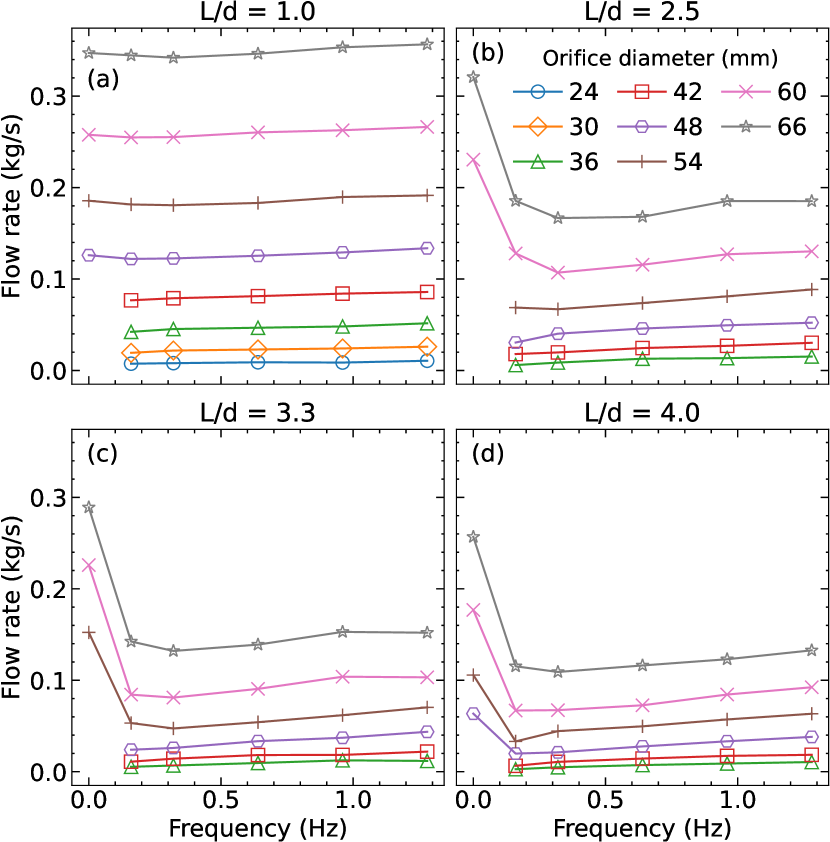
In Fig. 2 we present the flow rate as a function of the bottom rotation frequency, obtained for several aspect ratios and orifice sizes. For comparison, the first panel includes the results corresponding to spheres with diameter mm. As expected, we find that for small orifice diameters (), a stationary flow does not develop, in any of the cases. However, the imposition of an external transversal shear induces the particle flow. For the case of the spheres, we obtain a slight increase with increasing rotational frequency below mm or even a weak nonmonotonic behavior ( initial drop then increase) for the larger orifices which we consider. A more in-depth analysis of the behavior of the spheres in this system can be found in our earlier works [19, 36]. In contrast, elongated particles show a completely different behavior, regardless the particle aspect ratio, either the orifice size, applying external shear significantly reduces the particle flow rate in the range of examined frequencies. It is worth mentioning that at faster rotations the increase of the rotation frequency leads to a slight increase of the flow rate. Remarkably, these results nicely agree with the experimental analysis executed using wooden rods [18].
Next, we extend the analysis, exploring the impact of the particle effective diameter . The data presented in Fig. 2 suggest that generally reaches a minimum value in the range of rotational frequency of Hz. To quantify the drop, in Fig. 3(a), we plot the ratio of the minimum flow rate and the one corresponding to the stationary bottom . A general trend becomes apparent: the increasing aspect ratio of the particles causes a larger decrease in the flow rate. After the initial decrease in , an increase is observed for fast rotation speeds. In Fig. 3(b), we quantify this increase as the ratio of the flow rate at Hz and at the minimum. This clearly shows that the relative increase gets larger as the grains are more elongated or as the orifice size is decreased. Since our particles have different effective diameters, we include two groups of curves in the figure: one with fixed absolute orifice sizes (dashed curves) and one with fixed orifice sizes relative to the effective diameter of the particles (lines). In both cases, our findings are very conclusive; the particle aspect ratio has a significant impact on the system flow rate, which could drop by even for very elongated grains.
In the following, we examine the dependence of the flow rate on the orifice size . In Fig. 4, we present data vs , in a log-log plot; additionally, a dashed line representing the classic power-law function with an exponent of is included. One visible tendency is that the more elongated the particles are, the lower the flow rate for a fixed orifice is. For the case of spheres, we observe a concave line in the plots, which is in agreement with earlier findings [19, 36]. This behavior can be explained by either the Beverloo law or type of dependence. In the cases of rods, in the limit of small orifices, we obtain power-law relation but with a larger exponent, although in the limit of large orifices, the power-law correlation is also reproduced. Complementarily, in Fig. 5 we present the flow rate data in semilog plots. It highlights that the flow rate is also compatible with an exponential trend , when decreasing the orifice diameter. In general, the value of mm-1, fits with a good accuracy our observations. Remarkably, a similar trend was obtained experimentally in Ref. [18], reporting mm-1. However, it is worth mentioning that the range of examined orifice sizes is narrower than in the experiments [18], due to higher probability of clogging obtained numerically.

III.2 Continuum analysis of the particle flow
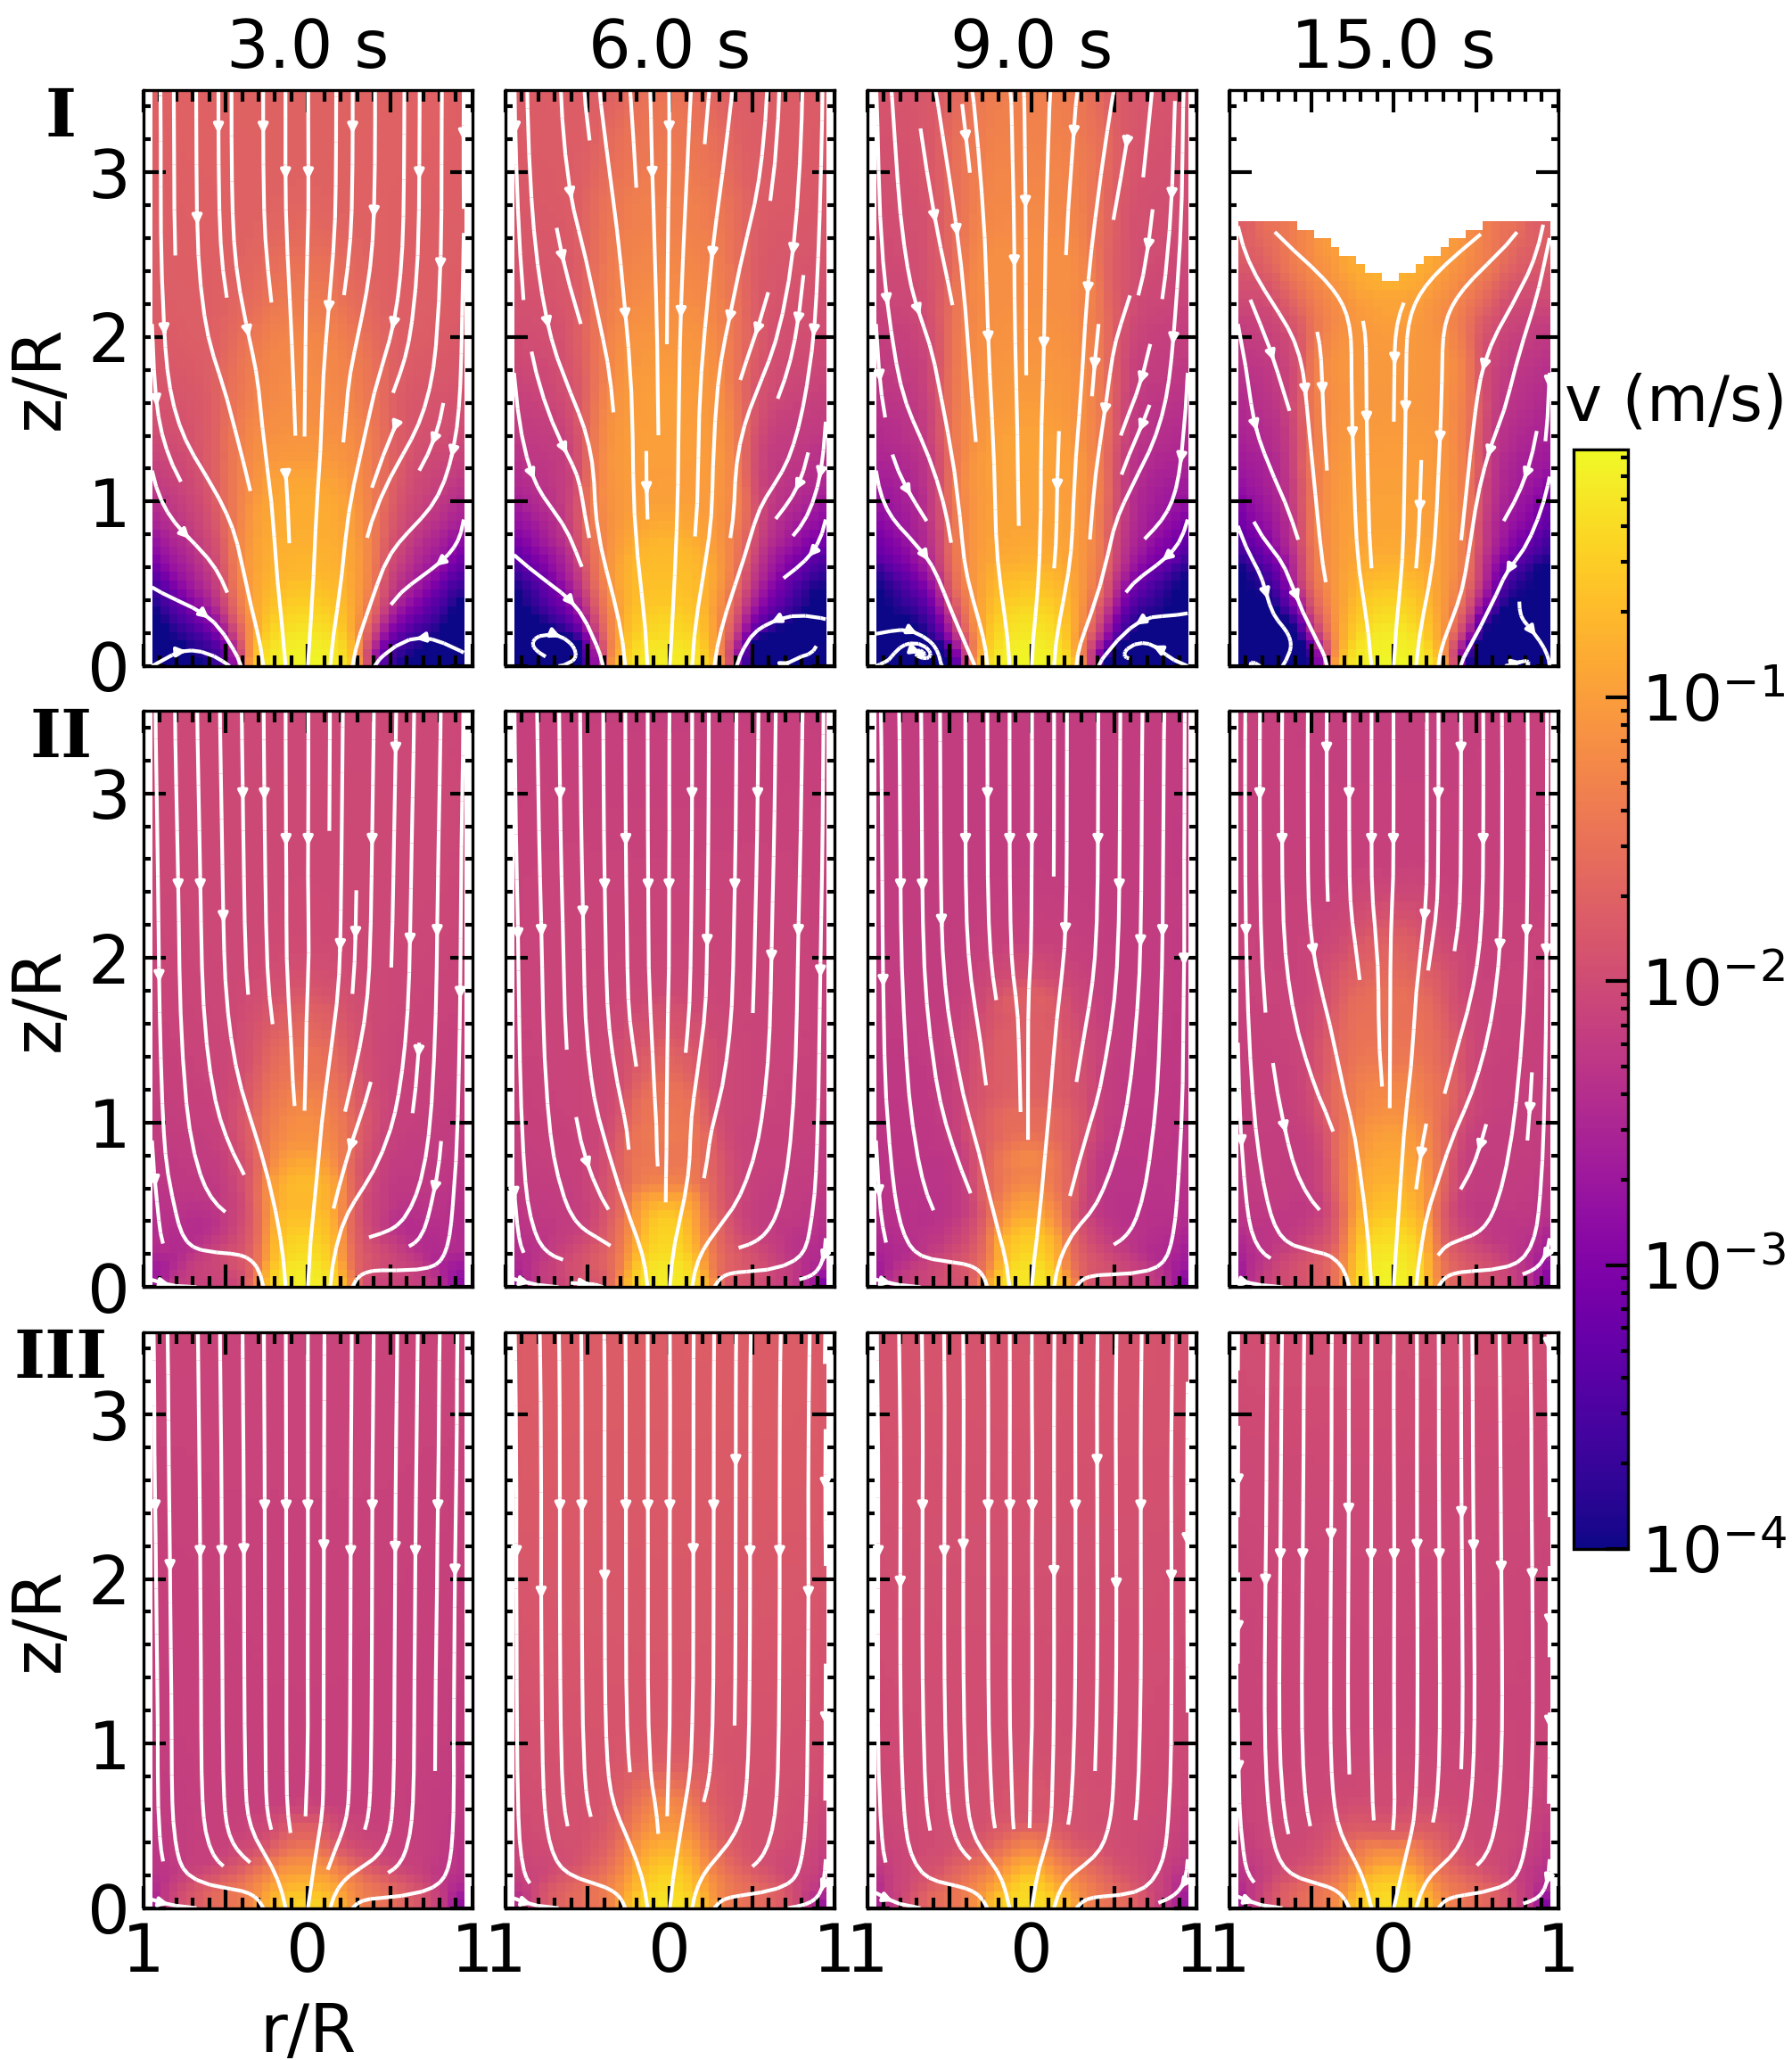
To gain insight into how the macroscopic properties of the flow are related to the flow patterns inside the silo, we employ a coarse-graining methodology, and derive the most relevant macroscopic fields from the data provided by the DEM simulations (see Sec. II). In Fig. 6, the colormaps represent the spatial profiles of the packing fraction . The data presented in rows I-III correspond to rotation frequencies and Hz (up-down), respectively. The graphs included in each column illustrate the system at different stages of the process, the indicated time is measured from the beginning of the discharge. Although the computation is done in cylindrical coordinates, the fields represent spatial averages in the azimuthal direction , within a time window of 1 s, s around the indicated time instant. Note that the fluctuations are larger in the center of the silo due to the cylindrical averaging having less data points there. Furthermore, the orifice region also shows larger noise; consequently, it should not be taken as representative of the whole discharge process.
As mentioned earlier, in Fig. 6 the silo with a fixed bottom wall is again used as a baseline, which denotes the presence of funnel type of flow pattern. It is worth mentioning that this pattern is more noticeable when examining more elongated particles (see the Supplemental Material [37]). This is characterized by a low-density region at the center of the silo and by the presence of a stagnant zone close to the lateral walls. Moreover, a surface depression is formed in the central region. Interestingly, two significant changes occur when the bottom wall rotation is applied to the system: the top surface of the column becomes flat, and the funnel-shaped low packing fraction region disappears. A less visible change happens near the bottom wall, where the stagnant zone disappears, and the external shear causes a slight dilation (see below about ). We also note that the low packing fraction region in the center near the orifice at Hz shrinks compared to the Hz case. The spatial distributions of other particle elongations show qualitatively the same response to the rotational shear [37]. Similar to previous studies of flow of elongated particles [20, 38], we also obtained a significant increase of the orientational ordering and the particle realignment in the sheared regions. These feactures were quantified using the orientational field and nematic order fields (see Supplemental Material [37]).
The flow pattern features are also highlighted by the color maps of the magnitude of the in-plane speed (see Fig. 7). For clarity, the panels also include the streamlines of , drawn with the radial and the vertical components. Columns and rows represent the same cases illustrated in Fig. 6. In the absence of external shear (stationary bottom wall), the velocity fields are rather heterogeneous, denoting a funnel flow pattern with strong velocity gradients in the radial direction. The streamlines are considerably curved, drawing a complex flow pattern. Moreover, at the center of the silo, the material speed , is significantly larger in comparison with the region close to the wall (stagnant zone), and significantly increases in the region of the orifice.
Interestingly, the appearance of the mass flow pattern seems counterintuitive, since the rotation of the bottom induces the movement of the grains in the tangential direction. It would pair with an outwards pointing fictitious force in the rotating frame. Thus, it would imply that particles go to the lateral wall of the silo, similar to what happens to water when it is put into a rotating cylinder. As our results indicate (see Fig. 6), this is not the case, and it is explained by the low magnitude of the fictitious force. Instead, we argue that the mass flow pattern emerges since the stability of the stagnant zone is affected by the rotational shear. As a result, particles are mobilized by the momentum transfer of the bottom wall, inducing the system’s dilatancy and the reduction of the effective friction. Consequently, the gravity action drives the homogeneous advective particle flow, and the material moves down the silo as a column (see Fig. 7).
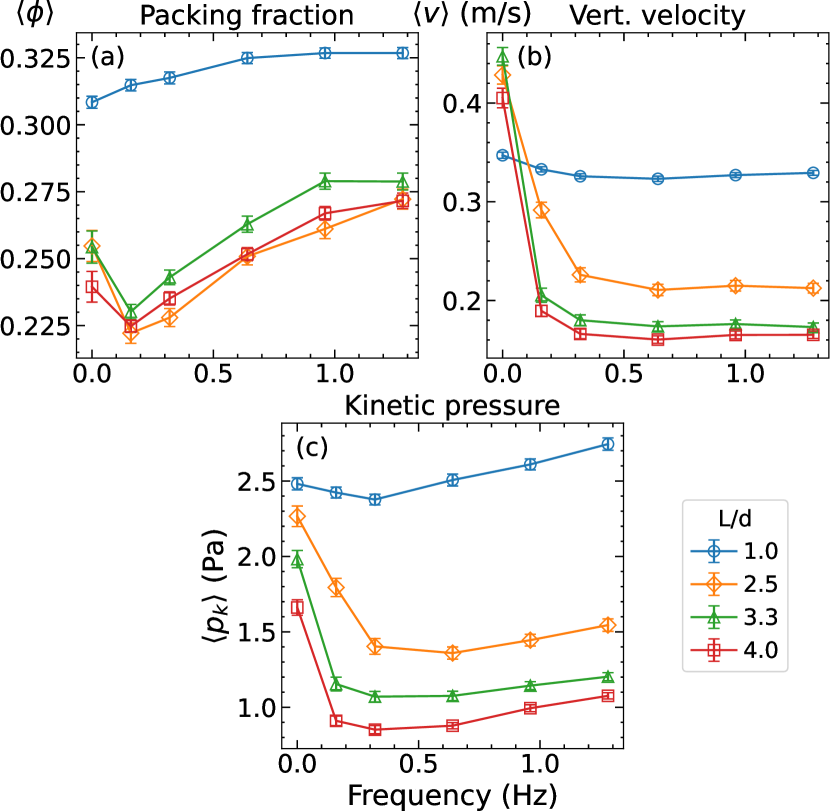
Next, we thoroughly investigate the cause of the sharp decrease in , when applying the external shear, focusing on the details of the particle flow in the region of the orifice. The volumetric flow rate through a surface is defined as the integral of the density times the velocity perpendicular to the surface . Thus, to better quantify and differentiate the roles played by and in relation to the flow rate, we have averaged these quantities in the area of the orifice during the stationary part of the flow, namely, computing the mean of the quantity using the formula . Here we use as a weight to account for the different number of particles in different cells. The region of averaging is a 1 cm high cylinder which has its base at the orifice and its diameter is the same as the orifice size . After this spatial integration, time and ensemble averaging is also applied. The panels in Fig. 8 illustrate the dependence of and on the rotational frequency , obtained for particles with several aspect ratios at an orifice diameter of mm. Interestingly, the evolution of suggests a slightly increasing trend for spheres but a nonmonotonic behavior for rods, when varying (see first panel of Fig. 8). However, the magnitude of the variation does not justify the abrupt decay of the particle flow rate of the rods. Contrarily, when raising the rotational frequency the particles notably slow down and a significant reduction of is observed (see second panel of Fig. 8). In fact, it strongly correlates with the trend of (see Fig. 2), meaning that it is the larger contributing factor to the flow rate. Nevertheless the increase of the flow rate for Hz can only be explained by the increase of . Additionally, the third panel of Fig. 8 displays the evolution of the averaged kinetic pressure . The latter quantity is often interpreted as a granular temperature since it is proportional to the square of the velocity fluctuations. As observed in the figure, the behavior of is also in line with the obtained trend for vs , even resembling the slight nonmonotonic response reported earlier for spheres [36].
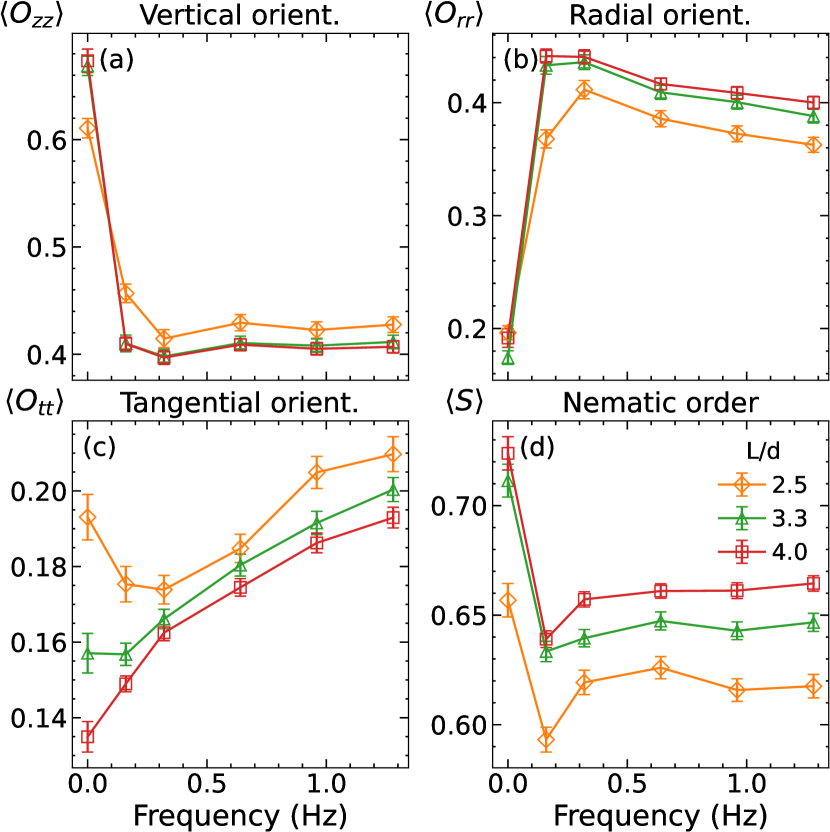
Furthermore, we also inspect the influence of the rotational shear on the particle orientation. Performing the analysis, the attention focuses on the response of the diagonal components (in cylindrical coordinates) of the orientation tensor , averaged in the region of the orifice. Figure 9 displays the diagonal elements, averaged in the same way as the quantities in Fig. 8, as well as the mean nematic order . To obtain a meaningful measure of the actual particle order, first we averaged the orientation matrix in the region of the orifice and using the largest eigenvalue of this matrix we carried out ensemble and time averaging to acquire . Interestingly, the graph indicates that in the absence of external shear ( Hz), the rods achieve an orientation parallel to the flow direction, which is indicated by the high value of , in comparison with and . However, there is an abrupt change in the orientation of the particles even when a weak rotation is applied. Specifically, the grains seem to prefer a more horizontal (radial) direction compared to the vertically aligned case with the stationary bottom. Interestingly, this effect is stronger for longer particles, denoting that more elongated particles seem to face the orifice with a larger effective size. Note that the decrease of is in the same order of magnitude as the increase in for small . There are two contributing factors that can explain the latter. On one hand horizontal particles lying on the silo bottom are being pushed towards the orifice due to the mass flow pattern (see Fig. 7). On the other hand particles coming from above the orifice are more horizontally aligned [37] since they are not sheared (mass flow) until very near the orifice, while in the stationary bottom case, grains align more vertically due to the shear [39]. Once again, we can argue that this tendency totally correlates with the trend of the particle flow rate (see Fig. 2). The orientation in the azimuthal angular direction is of low magnitude but shows a nonmonotonic or increasing trend with increasing , which can be accounted to the better alignment of grains due to the external shear. Curiously, the order of the particles reduces when a slow rotation is applied but increases by further increasing the frequency, which is in correlation with the packing fraction . These findings suggest that the level of alignment and ordering of the particles determines the macroscopic volume fraction at the orifice, impacting indirectly the macroscopic flow rate .
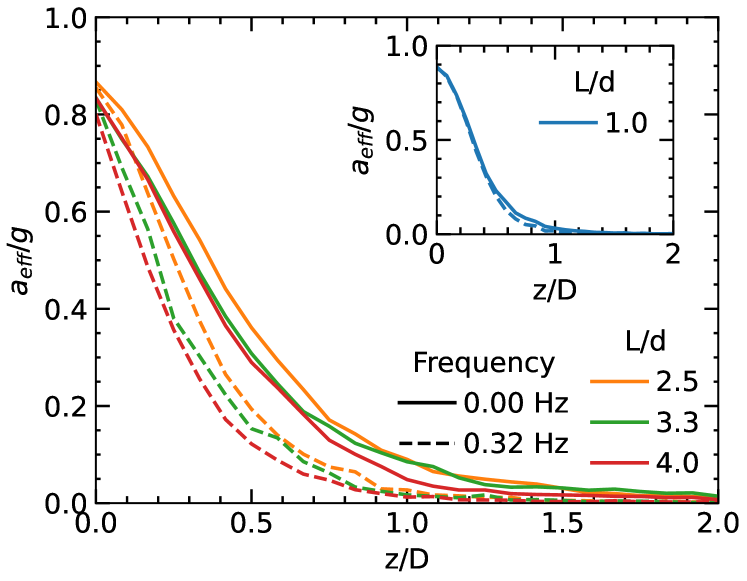
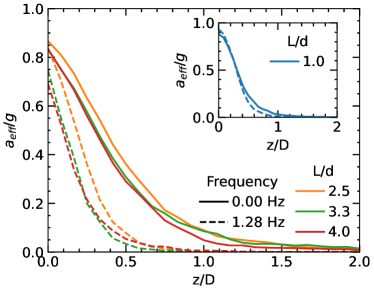
In silo discharge, it is known that the particle dynamics in a distinct region above the orifice determines the exit velocity [40]. Thus, the magnitude of can be derived from the integral of the momentum balance equation. Figure 10 shows the profiles of mean acceleration , obtained for several particle elongations; for comparison, the inset illustrates the data for spheres. We define , where is the mean of velocity difference of individual particles in two consecutively printed time steps ( ms). The spatial averaging was computed in the middle of the silo along the vertical axis within a cylinder with diameter , and the time averaging during the stationary part of the flow. The graphs include the data corresponding to a rotational velocity of Hz, and the stationary case. From these results, the message is conclusive. For flows of nonspherical particles, the rotational shear induces a sharper increase of the acceleration when approaching the exit (see dashed lines). This means that the region where the grains are accelerating is less extended for a silo under external rotational shear compared to the case of a silo with nonmoving bottom. In other words, the height of the so-called free fall arch region appears to be shrinking due to the applied rotational shear. As a result, the areas under the curves are significantly lower than those of the static cases (see continuous lines). Remarkably, it explains the abrupt decrease of the particle velocity (and flow rate) produced by the external rotational shear, obtained for elongated grains numerically and experimentally [18]. Examining flows of spheres (see inset of Fig. 10), however, the difference between the perturbed and nonperturbed case results is notably smaller. Consequently, the mean velocity at the orifice and the particle flow rate are only affected slightly. It is worth mentioning that the same behavior is observed when exploring other rotation frequencies (see Supplemental Material [37]).
IV Summary
We executed a numerical analysis of the discharge of elongated particles from a silo with a rotating bottom. Interestingly, we obtain that introducing a small transverse shear might reduce the flow rate by up to 70% compared to a stationary bottom and by further increasing , the value of increases. We find that the relative increase is much larger in the case of rods, specifically it is larger for longer rods and smaller orifices. These macroscopic observations are in very good agreement with our earlier experimental findings [18]. Stepping forward, we extend the analysis, enlarging the domain of particle elongations and the effective particle diameters. Focusing attention on the dependency of the flow rate on the orifice diameter , the spheres and rods show two distinct trends. In the cases of rods, in the limit of small apertures, we obtain power-law relation but with a larger exponent, although in the limit of large orifices, the power-law correlation is also reproduced. However, the obtained results are also compatible with an exponential trend , when decreasing the orifice diameter. Very similar results have been recently obtained experimentally (see Ref. [18]). However, it is worth mentioning that the range of examined orifice sizes is narrower than in the experiments [18], due to the higher probability of clogging obtained numerically. The reason behind the exponential trend obtained experimentally [18] and numerically is nontrivial. However, in the small orifice limit, the particles flow out of the silo practically one by one, and the particle flow could be understood as a stochastic process with a constant probability of passing. Employing a coarse-graining methodology, we compute the most relevant macroscopic fields of the particle flow. Their analysis allows us to detect a transition from a funnel to a mass flow pattern as a result of the applied external shear. The averaged fields in the orifice region reveal that the initial decrease in is mainly attributed to the velocity changes. Besides, the increase of the packing fraction near the orifice explains the increase in for large rotation frequencies. Furthermore, the flow rate correlates with the particle orientation in the vertical direction and the packing fraction with the order of grains in the region of the orifice. Finally, we also found that the vertical profiles of mean acceleration at the center of the silo are notably affected by the rotation of the bottom wall. In flows of elongated rods, it is observed that the region where the acceleration is not negligible (so-called free fall arch region) shrinks significantly due to the perturbation induced by the moving wall.
Acknowledgements.
We wish to acknowledge discussions with K. To and E. Somfai and financial support by the European Union’s Horizon 2020 Marie Skłodowska-Curie grant ”CALIPER” (No. 812638). R.C. Hidalgo acknowledges the Ministerio de Ciencia e Innovación (Spanish Government) Grant PID2020-114839GB-I00 funded by MCIN/AEI/10.13039/501100011033.References
- Nedderman [1992] R. M. Nedderman, Statics and Kinematics of Granular Materials (Cambridge University Press, 1992).
- Andreotti et al. [2013] B. Andreotti, Y. Forterre, and O. Pouliquen, Granular Media: Between Fluid and Solid (Cambridge University Press, 2013) p. 462.
- Beverloo et al. [1961] W. Beverloo, H. Leniger, and J. van de Velde, The flow of granular solids through orifices, Chemical Engineering Science 15, 260 (1961).
- Janda et al. [2012] A. Janda, I. Zuriguel, and D. Maza, Flow rate of particles through apertures obtained from self-similar density and velocity profiles, Phys. Rev. Lett. 108, 248001 (2012).
- Chen et al. [2001] W. Chen, M. Hou, K. Lu, Z. Jiang, and L. Lam, Granular flows through vertical pipes controlled by an electric field, Phys. Rev. E 64, 061305 (2001).
- Dave et al. [2000] R. N. Dave, C.-Y. Wu, B. Chaudhuri, and S. Watano, Magnetically mediated flow enhancement for controlled powder discharge of cohesive powders, Powder Technology 112, 111 (2000).
- Hernández-Enríquez et al. [2017] D. Hernández-Enríquez, G. Lumay, and F. Pacheco-Vázquez, Discharge of repulsive grains from a silo: Experiments and simulations, in EPJ Web of Conferences. Powders and Grains 2017, Vol. 140 (2017) pp. 8–11.
- Thorens et al. [2021] L. Thorens, M. Viallet, K. J. Måløy, M. Bourgoin, and S. Santucci, Discharge of a 2D magnetic silo, in EPJ Web of Conferences. Powders and Grains 2021, Vol. 249, edited by M. Aguirre, S. Luding, L. Pugnaloni, and R. Soto (2021) p. 03017.
- Hunt et al. [1999] M. L. Hunt, R. C. Weathers, A. T. Lee, C. E. Brennen, and C. R. Wassgren, Effects of horizontal vibration on hopper flows of granular materials, Physics of Fluids 11, 68 (1999).
- Wassgren et al. [2002] C. R. Wassgren, M. L. Hunt, P. J. Freese, J. Palamara, and C. E. Brennen, Effects of vertical vibration on hopper flows of granular material, Physics of Fluids 14, 3439 (2002).
- Pascot et al. [2020] A. Pascot, N. Gaudel, S. Antonyuk, J. Bianchin, and S. Kiesgen De Richter, Influence of mechanical vibrations on quasi-2D silo discharge of spherical particles, Chemical Engineering Science 224, 115749 (2020).
- Janda et al. [2009] A. Janda, D. Maza, A. Garcimartín, E. Kolb, J. Lanuza, and E. Clément, Unjamming a granular hopper by vibration, EPL (Europhysics Letters) 87, 24002 (2009).
- Mankoc et al. [2009] C. Mankoc, A. Garcimartín, I. Zuriguel, D. Maza, and L. A. Pugnaloni, Role of vibrations in the jamming and unjamming of grains discharging from a silo, Phys. Rev. E 80, 011309 (2009).
- Merrigan et al. [2018] C. Merrigan, S. K. Birwa, S. Tewari, and B. Chakraborty, Ergodicity breaking dynamics of arch collapse, Phys. Rev. E 97, 040901 (2018).
- Guerrero et al. [2019] B. V. Guerrero, B. Chakraborty, I. Zuriguel, and A. Garcimartín, Nonergodicity in silo unclogging: Broken and unbroken arches, Phys. Rev. E 100, 32901 (2019).
- Corwin [2008] E. I. Corwin, Granular flow in a rapidly rotated system with fixed walls, Phys. Rev. E 77, 031308 (2008).
- Hilton and Cleary [2010] J. E. Hilton and P. W. Cleary, The effect of rotational shear on granular discharge rates, Physics of Fluids 22, 071701 (2010).
- To et al. [2021] K. To, Y.-K. Mo, T. Pongó, and T. Börzsönyi, Discharge of elongated grains from silo with rotating bottom, Phys. Rev. E 103, 062905 (2021).
- To et al. [2019] K. To, Y. Yen, Y.-K. Mo, and J.-R. Huang, Granular flow from silos with rotating orifice, Phys. Rev. E 100, 012906 (2019).
- Börzsönyi et al. [2012] T. Börzsönyi, B. Szabó, G. Törös, S. Wegner, J. Török, E. Somfai, T. Bien, and R. Stannarius, Orientational order and alignment of elongated particles induced by shear, Phys. Rev. Lett. 108, 228302 (2012).
- Börzsönyi et al. [2012] T. Börzsönyi, B. Szabó, S. Wegner, K. Harth, J. Török, E. Somfai, T. Bien, and R. Stannarius, Shear-induced alignment and dynamics of elongated granular particles, Phys. Rev. E 86, 051304 (2012).
- Rubio-Largo et al. [2016] S. M. Rubio-Largo, F. Alonso-Marroqin, T. Weinhart, S. Luding, and R. C. Hidalgo, Homogeneous cooling state of frictionless rod particles, Physica A 443, 477 (2016).
- Alonso-Marroquín [2008] F. Alonso-Marroquín, Spheropolygons: A new method to simulate conservative and dissipative interactions between 2d complex-shaped rigid bodies, Europhys. Lett. 83, 14001 (2008).
- Alonso-Marroquín and Wang [2009] F. Alonso-Marroquín and Y. Wang, An efficient algorithm for granular dynamics simulations with complex-shaped objects, Granular Matter 11, 317 (2009).
- Vega and Lago [1994] C. Vega and S. Lago, A fast algorithm to evaluate the shortest distance between rods, Computers & chemistry 18, 55 (1994).
- Weinhart et al. [2012] T. Weinhart, A. R. Thornton, S. Luding, and O. Bokhove, Closure relations for shallow granular flows from particle simulations, Granular Matter 14, 531 (2012).
- Hairer et al. [2003] E. Hairer, C. Lubich, and G. Wanner, Geometric numerical integration illustrated by the störmer–verlet method, Acta Numerica 12, 399 (2003).
- Wang et al. [2006] Y. Wang, S. Abe, S. Latham, and P. Mora, Implementation of particle-scale rotation in the 3-d lattice solid model, in Computational Earthquake Physics: Simulations, Analysis and Infrastructure, Part I (Springer, 2006) pp. 1769–1785.
- Silbert et al. [2001] L. E. Silbert, D. Ertaş, G. S. Grest, T. C. Halsey, D. Levine, and S. J. Plimpton, Granular flow down an inclined plane: Bagnold scaling and rheology, Phys. Rev. E 64, 051302 (2001).
- Schwager and Pöschel [2007] T. Schwager and T. Pöschel, Coefficient of restitution and linear–dashpot model revisited, Granular Matter 9, 465 (2007).
- Huang et al. [2014] Y. J. Huang, O. J. Nydal, and B. Yao, Time step criterions for nonlinear dense packed granular materials in time-driven method simulations, Powder Technology 253, 80 (2014).
- Babic [1997] M. Babic, Average balance equations for granular materials, Int. J. of Eng. Sci. 35, 523 (1997).
- Goldhirsch [2010] I. Goldhirsch, Stress, stress asymmetry and couple stress: from discrete particles to continuous fields, Granular Matter 12, 239 (2010).
- Zhang et al. [2010] J. Zhang, R. P. Behringer, and I. Goldhirsch, Coarse-graining of a physical granular system, Progress of Theoretical Physics Supplement 184, 16 (2010).
- Richard et al. [2005] P. Richard, M. Nicodemi, R. Delannay, P. Ribière, and D. Bideau, Slow relaxation and compaction of granular systems, Nature Materials 4, 121 (2005).
- Hernández-Delfin et al. [2020] D. Hernández-Delfin, T. Pongó, K. To, T. Börzsönyi, and R. Hidalgo, Particle flow rate in silos under rotational shear, Phys. Rev. E 102, 042902 (2020).
- [37] See Supplemental Material at URLwillbeinsertedbypublisher for additional color maps corresponding to different particle elongations and for the orientations distributions.
- Börzsönyi et al. [2016] T. Börzsönyi, E. Somfai, B. Szabó, S. Wegner, P. Mier, G. Rose, and R. Stannarius, Packing, alignment and flow of shape-anisotropic grains in a 3d silo experiment, New J. Phys. 18, 093017 (2016).
- Wegner et al. [2012] S. Wegner, T. Börzsönyi, T. Bien, G. Rose, and R. Stannarius, Alignment and dynamics of elongated cylinders under shear, Soft Matter 8, 10950 (2012).
- Rubio-Largo et al. [2015] S. M. Rubio-Largo, A. Janda, D. Maza, I. Zuriguel, and R. C. Hidalgo, Disentangling the free-fall arch paradox in silo discharge, Phys. Rev. Lett. 114, 238002 (2015).
Supplementary material
This supplementary material includes figures that are not essential for understanding our main arguments but may provide additional insight for the interested. The coarse-grained fields were computed as it is described in section II of the main document. Fig. 11a and Fig. 11b show the orientational field and nematic order field , respectively. The illustrated data correspond to the same cases introduced in Figure 6 of the main document. Complementary, Figures 12 and 13 display the packing fraction and velocity fields of the discharge process for two elongations but for a slightly different orifice size ( mm) than what is presented in the article due to clogging in one case.
(a)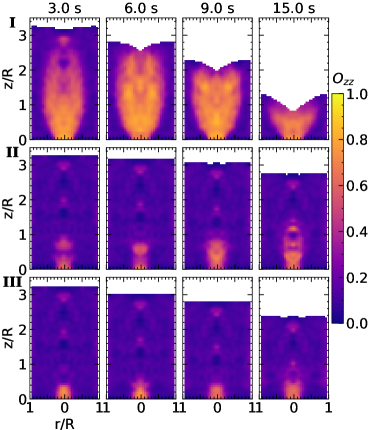 (b)
(b)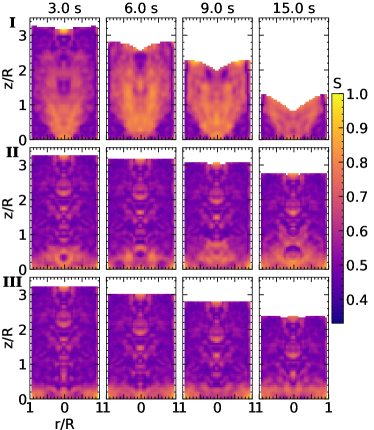
(a)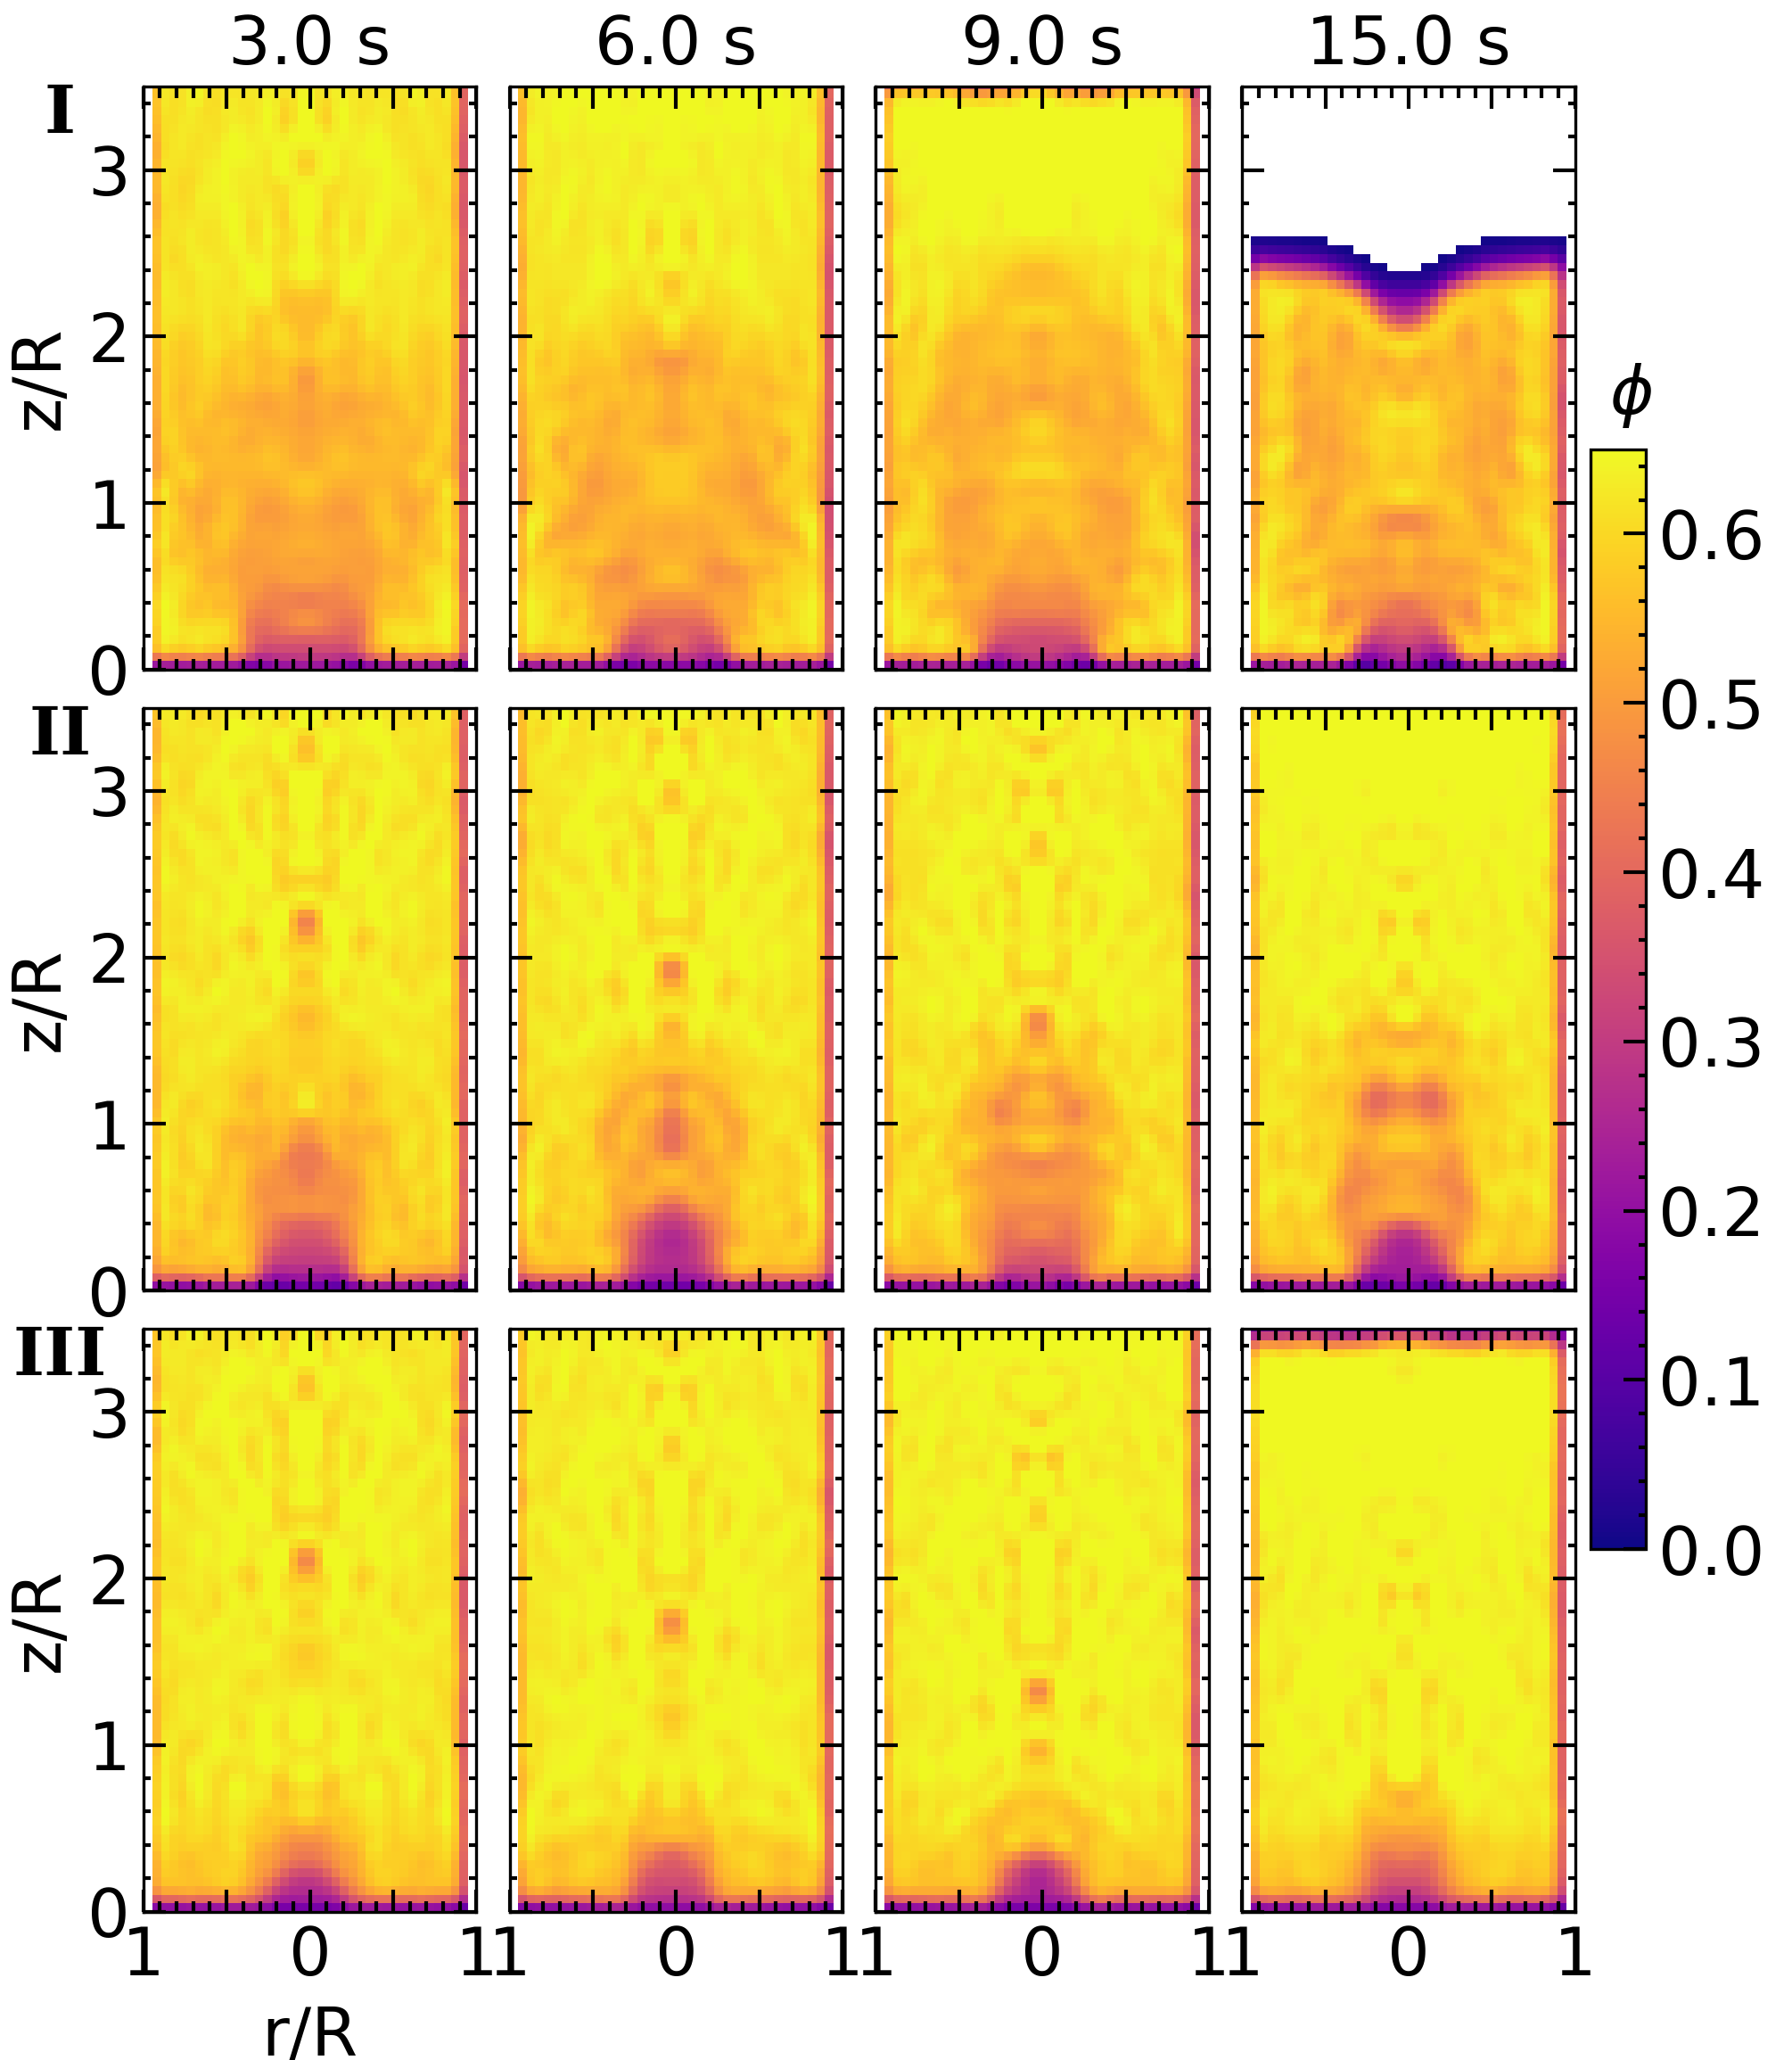 (b)
(b)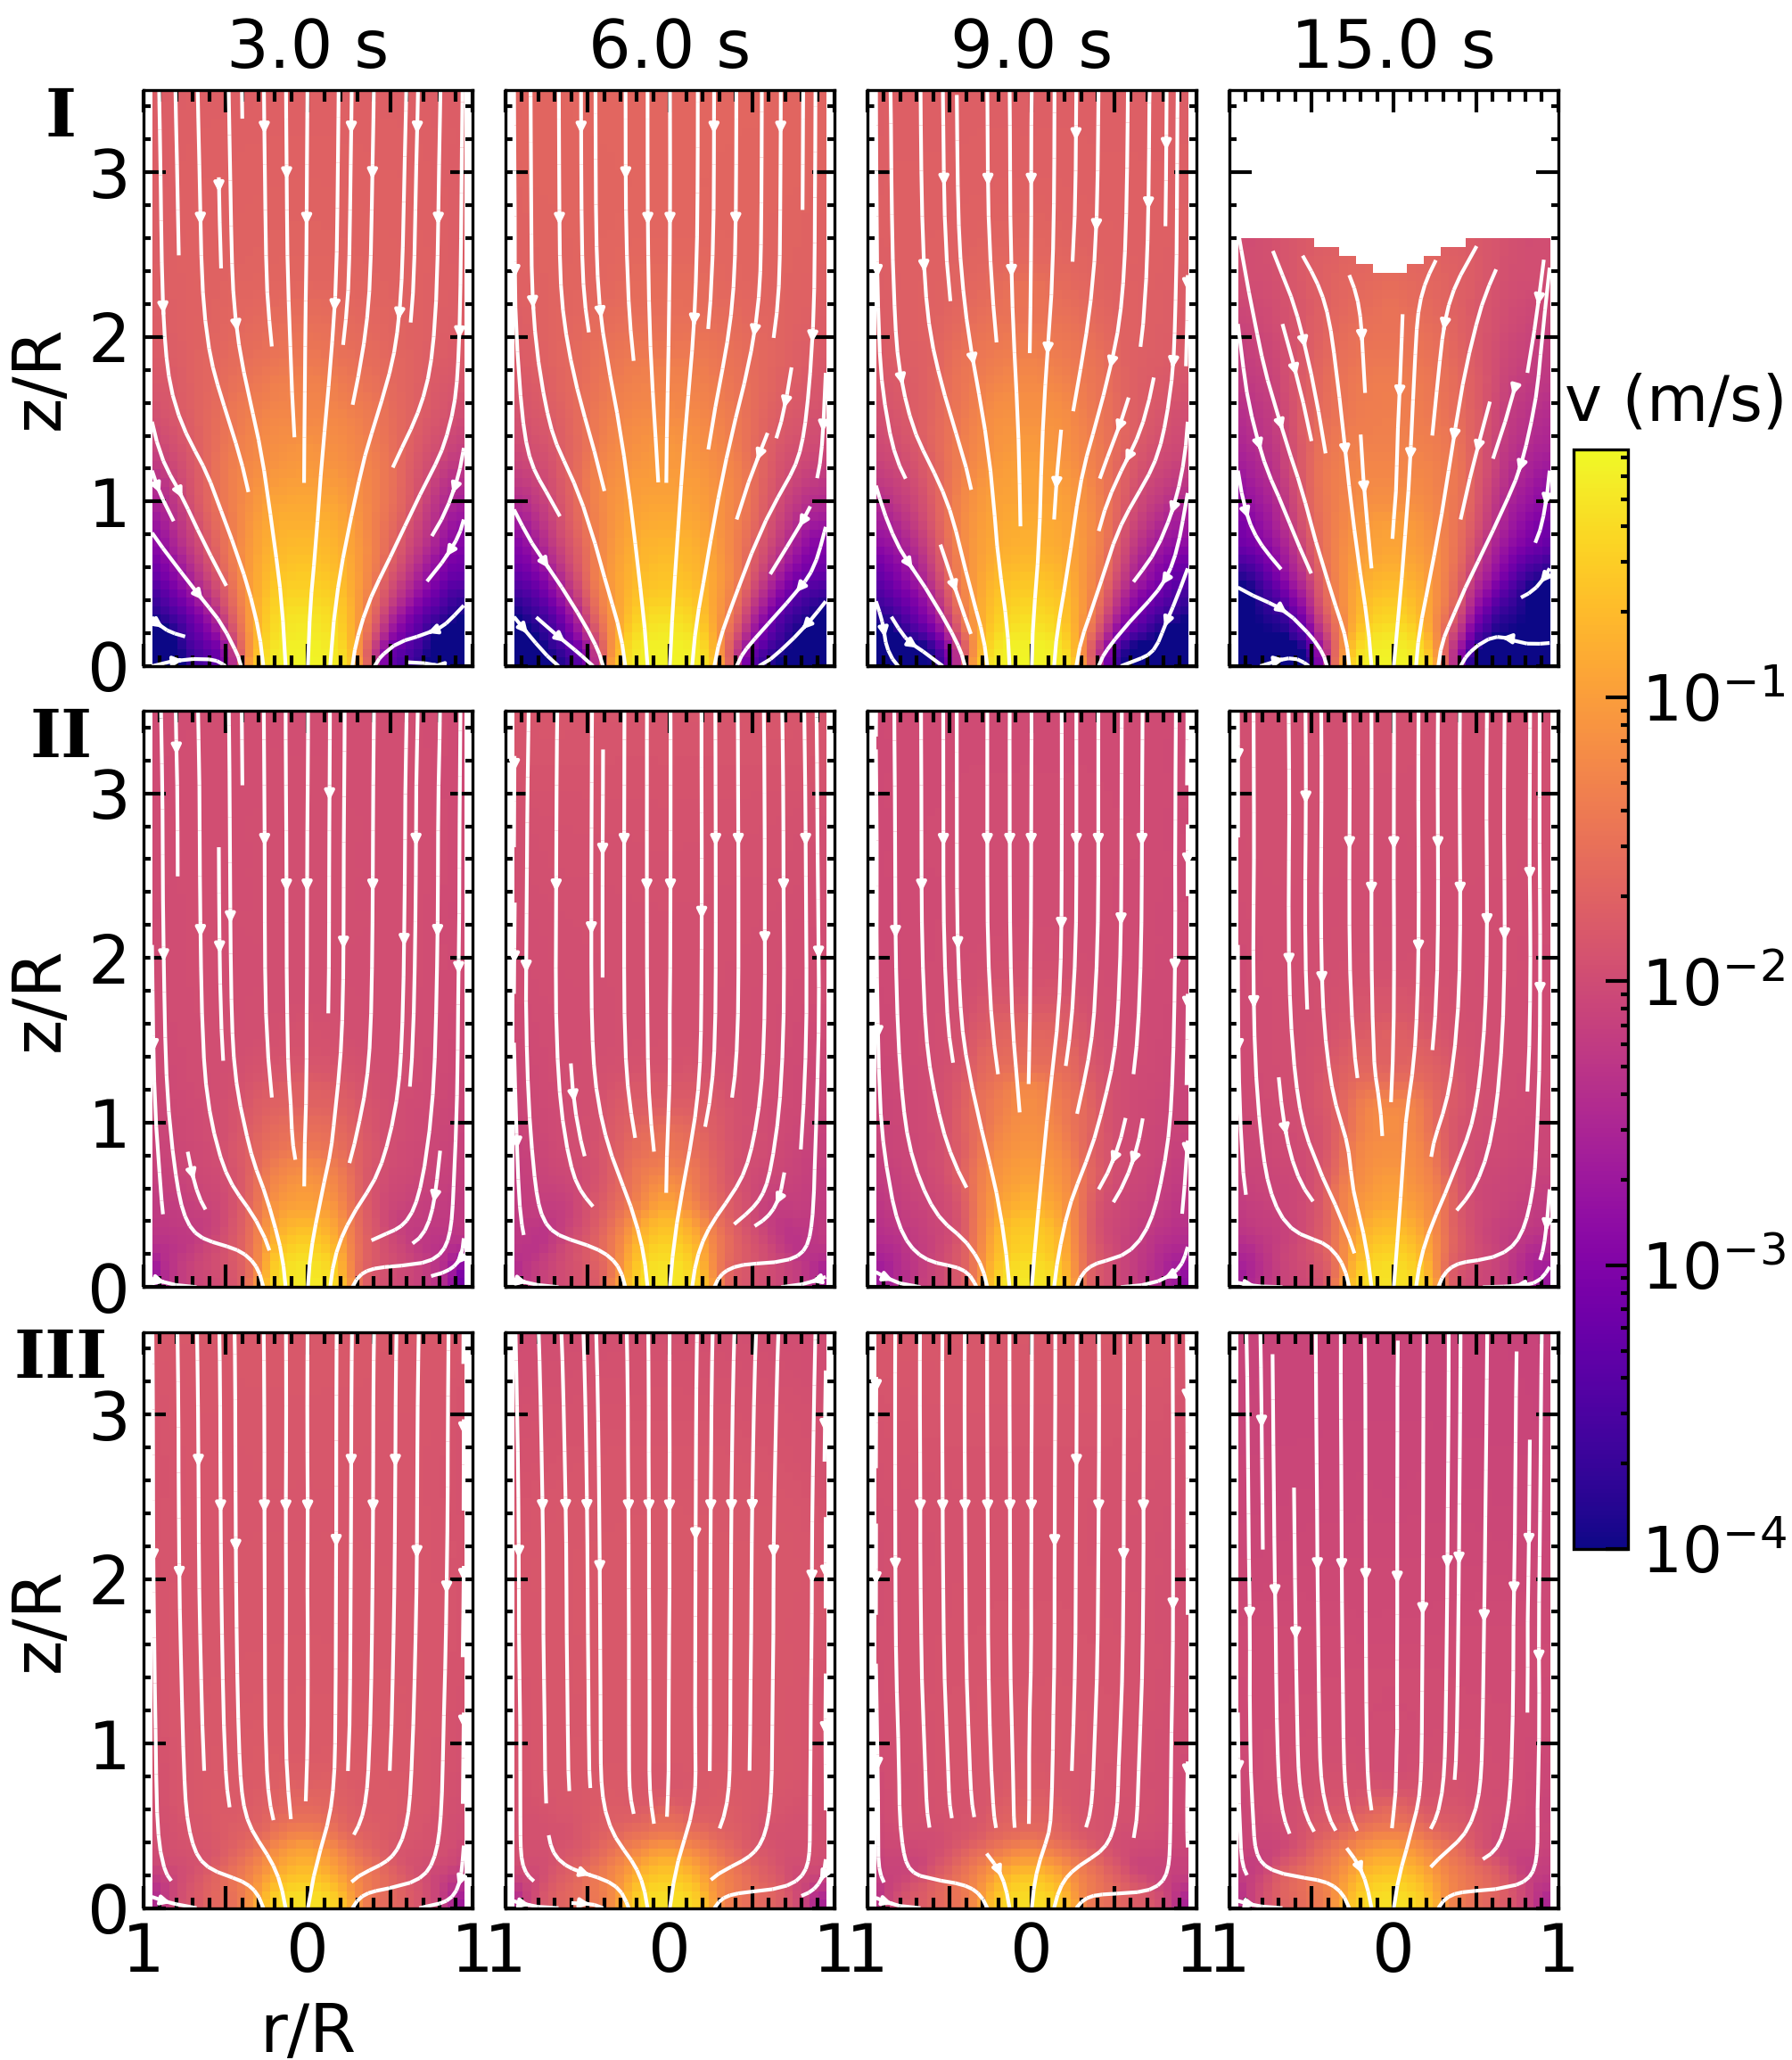
(a)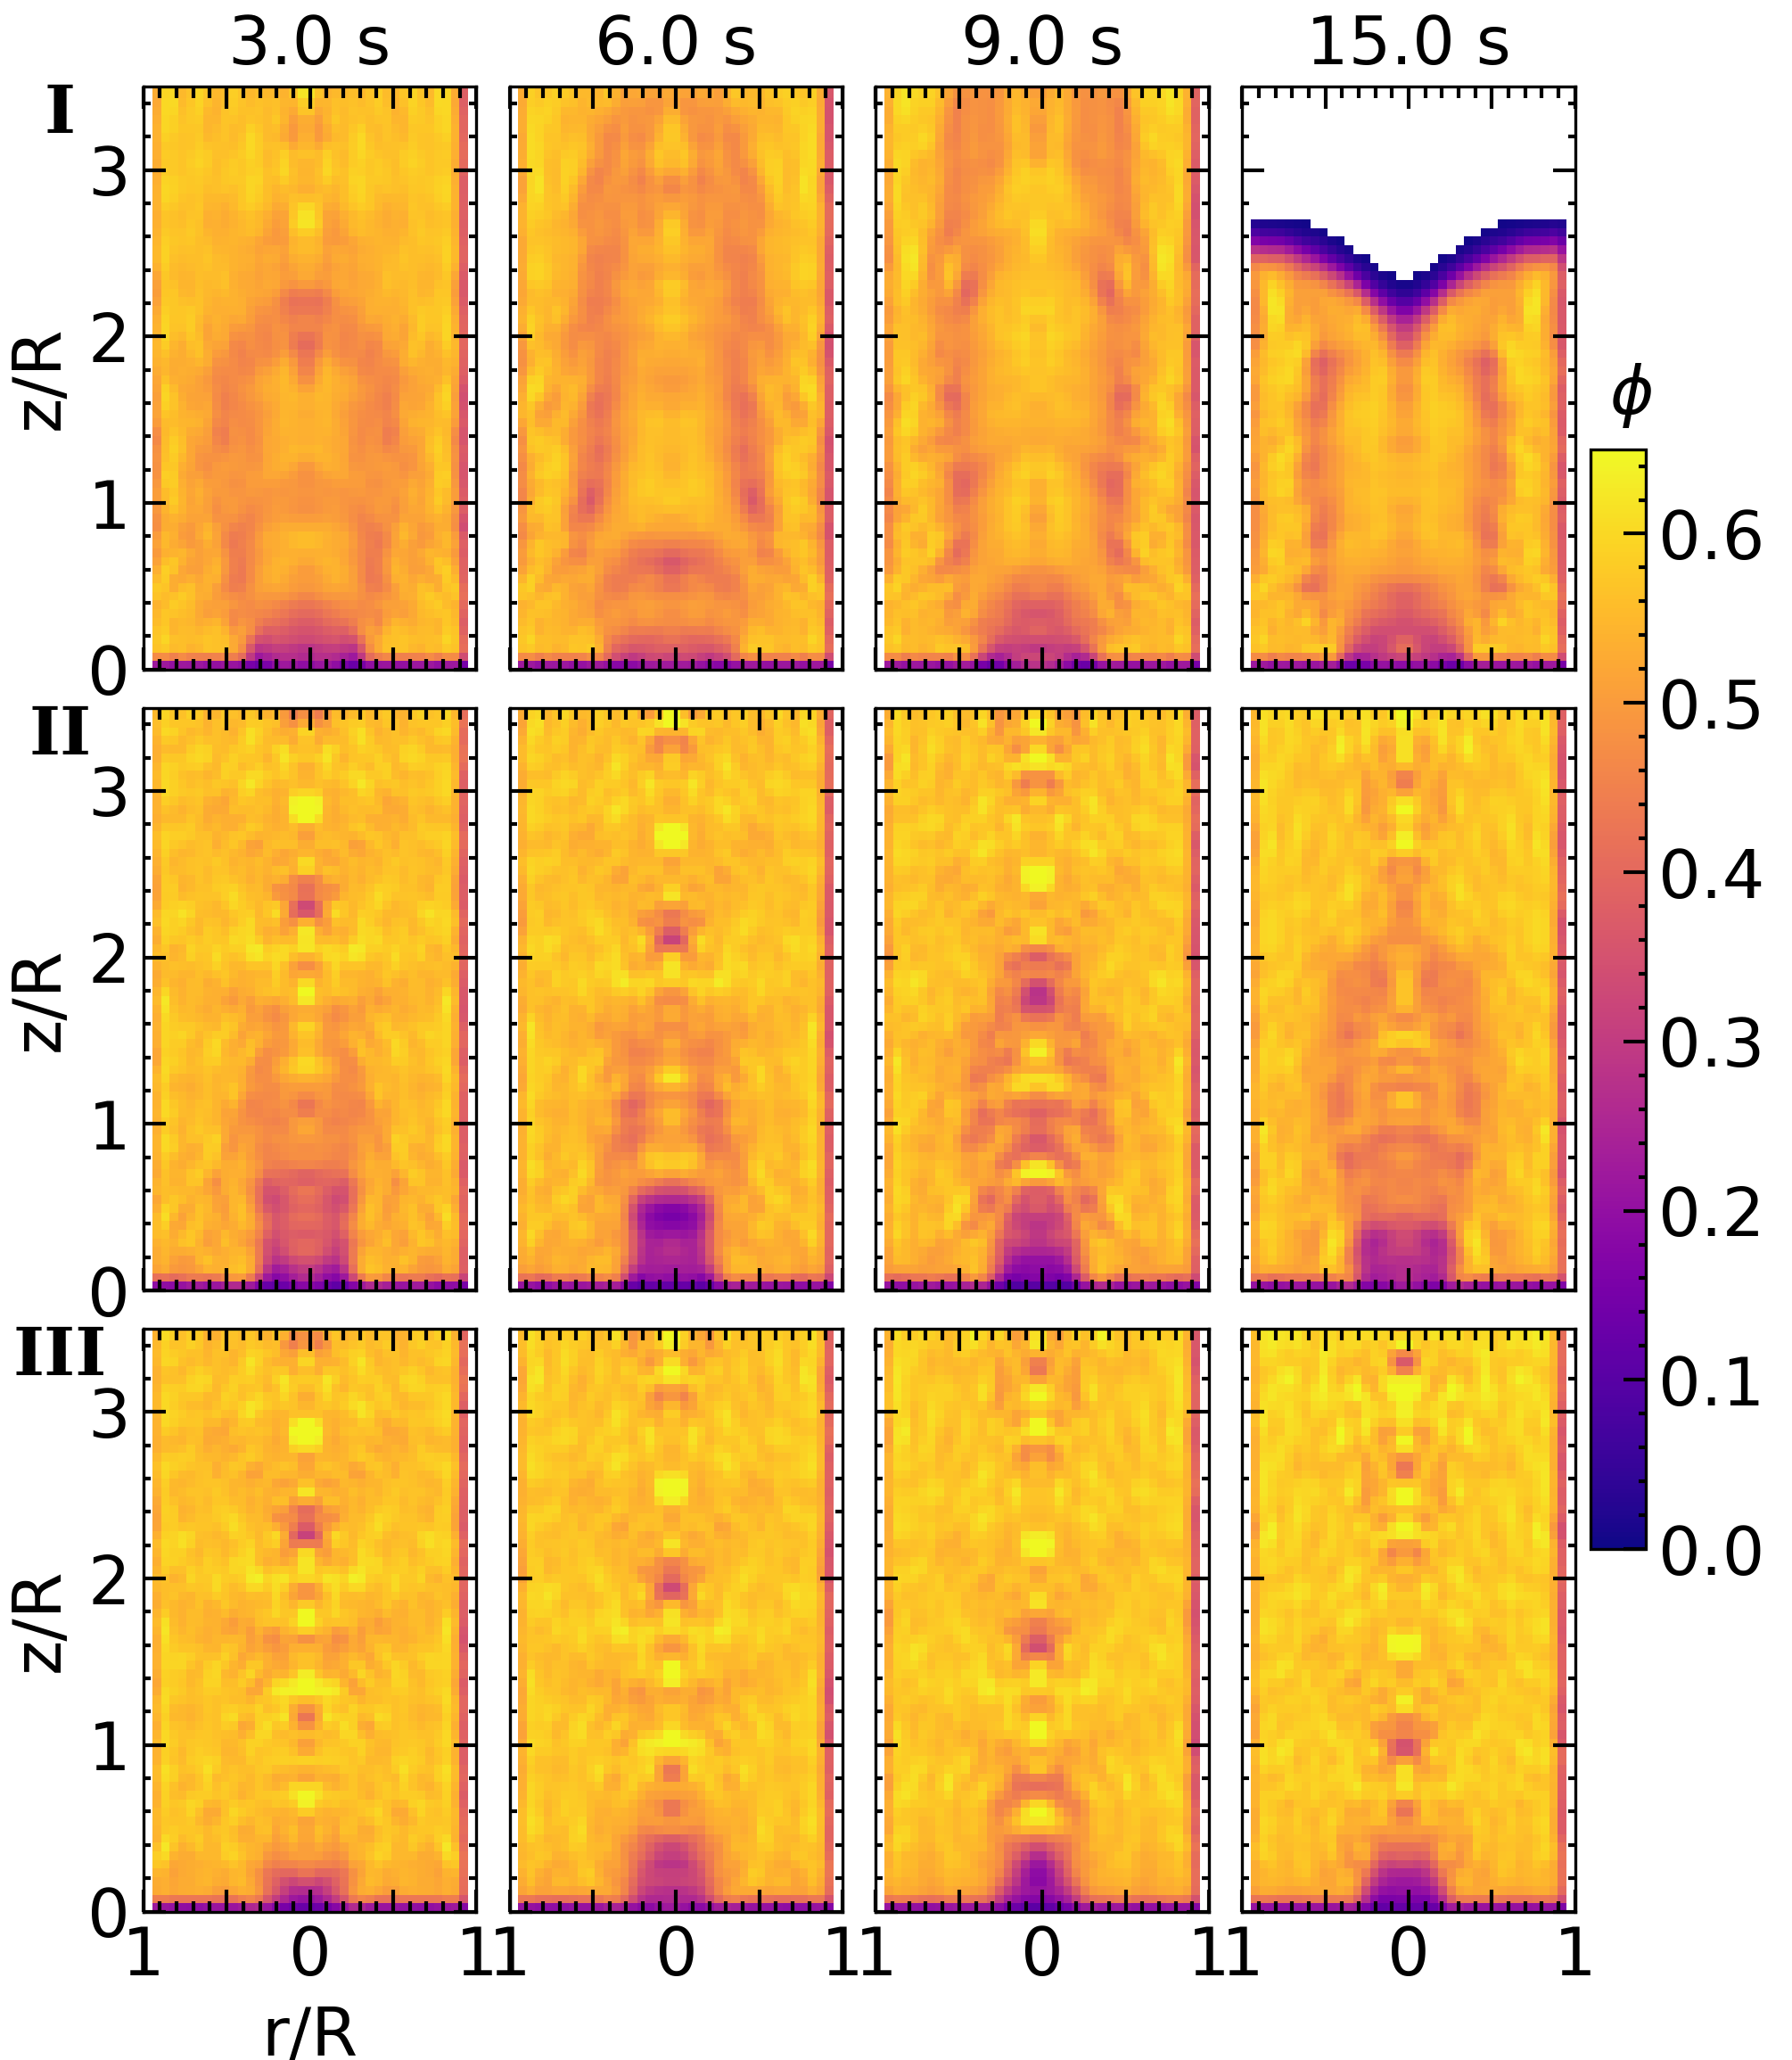 (b)
(b)