First-principles calculation of electron-phonon coupling in doped \ceKTaO3
Abstract
Motivated by the recent experimental discovery of strongly surface-plane-dependent superconductivity at surfaces of \ceKTaO3 single crystals, we calculate the electron-phonon coupling strength, , of doped \ceKTaO3 along the reciprocal-space high-symmetry directions. Using the Wannier-function approach implemented in the EPW package, we calculate across the experimentally covered doping range and compare its mode-resolved distribution along the [001], [110] and [111] reciprocal-space directions. We find that the electron-phonon coupling is strongest in the optical modes around the point, with some distribution to higher values in the [001] direction. The electron-phonon coupling strength as a function of doping has a dome-like shape in all three directions and its integrated total is largest in the [001] direction and smallest in the [111] direction, in contrast to the experimentally measured trends in critical temperatures. This disagreement points to a non-BCS character of the superconductivity. Instead, the strong localization of in the soft optical modes around suggests an importance of ferroelectric soft-mode fluctuations, which is supported by our findings that the mode-resolved values are strongly enhanced in polar structures. The inclusion of spin-orbit coupling has negligible influence on our calculated mode-resolved values.
I Introduction
Perovskite-structure potassium tantalate (\ceKTaO3, KTO) exhibits many interesting phenomena, resulting from its high dielectric constant [1], strong spin orbit coupling [2] and charged ionic layers [3]. The strong spin-orbit coupling (SOC), caused mainly by the heavy tantalum ion, leads to a band splitting of up to [4, 2] and possible applications in spintronic devices [5, 6]. The high dielectric constant, associated with a quantum paraelectric state [7] similar to that of \ceSrTiO3 (STO) [8], indicates proximity to ferroelectricity, which is predicted to yield a large strain-dependent Rashba spin splitting [9, 10]. The need to compensate the alternating charged ionic layers at the surfaces is predicted to induce lattice polarization in thin films [11], and leads to the accumulation of compensating charges at the surfaces of bulk samples [3]. The origin and nature of the compensating charge are still open questions, with reports of conducting two-dimensional electron gases (2DEGs) [12, 13], charge-density waves with strongly-localized electron polarons [14], and terrace-like structures of alternating termination [15], depending on the annealing atmosphere and temperature.
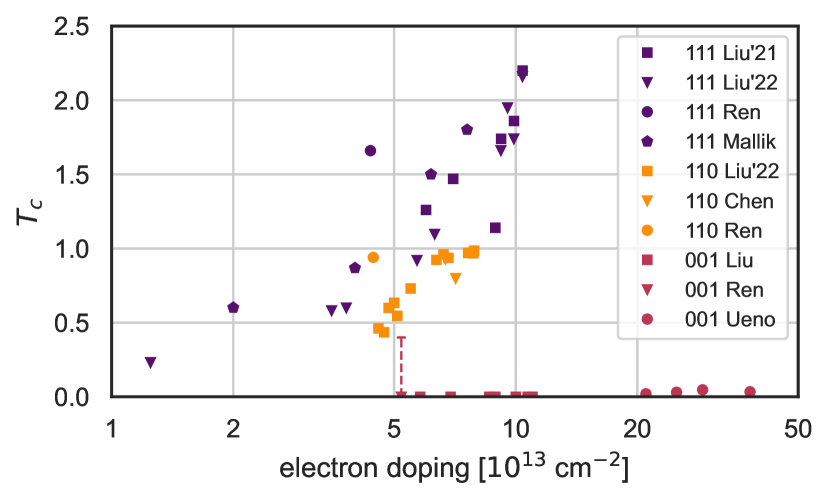
Perhaps the most intriguing behavior of KTO is its recently discovered low-temperature superconductivity on electron doping [16]. Superconductivity was first achieved using ionic liquid gating on the (001) surfaces of KTO single crystals, for which critical temperatures (Tc) of up to were found at 2D doping concentrations of between nd [16, 17]. Note that these values correspond to 3D doping concentrations of approximately , considerably higher than the possible using chemical doping with barium in bulk KTO [18]. (For the conversion between 2D and 3D carrier concentrations see Ref. 16 and the Appendix). A subsequent study of LaAlO3-capped KTO (110) surfaces, with 2D doping concentrations of , reached markedly higher critical temperatures up to [19]; (111)-oriented KTO interfaces with either \ceEuO or \ceLaAlO3 showed even higher Tcs of up to at similar carrier concentrations [20]. Note that no superconductivity was found down to at (001)-oriented KTO interfaces at these lower carrier concentrations [20]. More recently, in an ionic liquid gating setup similar to that of Ref. 16, but at lower 2D doping densities of around , superconductivity was found at the (110) and (111) surfaces with Tc of around and respectively, and not at the (001) surface down to [21]. The reported critical temperatures from the literature are collected as a function of carrier concentration in figure 1.
The mechanism underlying the superconductivity, as well as its strong and unusual dependence on the orientation of the surface or interfacial plane, are not yet established. Indeed, even in the related quantum paraelectric STO, in which superconductivity was found more than half a century ago [22, 23], the pairing mechanism remains a subject of heated debate (for a recent review see Ref. 24). While the persistence to low carrier concentrations [23] and the anomalous isotope effect [25] challenge conventional BCS theories [26, 27], it is likely that electron-phonon coupling in some form, as well as proximity to ferroelectricity [28, 29, 30, 31, 32, 33] play a role. Spin-orbit coupling has also been implicated [34, 35, 36, 37], and would be consistent with the observed higher critical temperatures in KTO, with its heavy tantalum ion, compared to STO [32, 33, 38]. The surface-plane dependence in KTO is captured by a model in which out-of-plane polar displacements of the Ta and O ions allow a linear coupling of the transverse optical (TO) phonon to the electrons in the t2g (dxy, dyx and dzx) orbitals; this coupling would otherwise go to zero as the phonon wavevector q approached [39]. The strong dependence of the superconducting Tc on surface orientation is then explained by different inter-orbital hopping of electrons between adjacent tantalum sites via the oxygen orbitals, with the highest hopping at (111) surfaces, followed by (110) surfaces, and no hopping allowed by symmetry at (001) surfaces.
It is clear that a thorough picture of the electron-phonon coupling as a function of electron doping and throughout the Brillouin Zone in KTO is an essential step towards developing a complete theory of its superconductivity. While the electron-phonon coupling has been calculated from first principles for STO [41], to our knowledge it is lacking for KTO, and the goal of this work is to remedy this gap. Here we report the mode-resolved electron-phonon coupling strengths, , obtained using first-principles calculations based on density functional theory, for cubic \ceKTaO3 across the range of experimentally accessible electron doping values. We extract the mode-resolved total as a function of carrier density, and focus in particular on differences between the [001], [110] and [111] high-symmetry directions, which are reciprocal to the corresponding experimentally measured surface and interfacial planes. Additionally, for one doping value, we compare the behavior with and without spin-orbit coupling, and for polar and non-polar structures to determine the effect of both properties. Our main findings are that i) the calculated total electron-phonon coupling strengths do not follow the measured trends in superconducting Tc; ii) is concentrated in the optical modes around and polar distortions increase by a factor of approximately five, suggesting a mechanism involving the polar soft mode; iii) spin-orbit coupling has negligible influence on the calculated electron-phonon coupling.
II Methods
To calculate the forces and total energies we use density functional theory within the generalized gradient approximation (GGA) as implemented in the Quantum ESPRESSO 7.0 and 7.1 codes [42, 43, 44]. We describe the exchange and correlation using the PBEsol functional [45], and perform the core-valence separation with the ultrasoft GBRV [46, 47] and pslibrary (to compare results with and without spin-orbit coupling) pseudopotentials [48]. We use a kinetic energy cutoff of () for the wavefunctions and a k-point mesh including for all unit cells. Doping is achieved in the range from electrons/formula unit (e/fu) using the background-charge method with Gaussian smearing of width. Total energies are converged to () and forces to ().
Both unit-cell size and shape, as well as internal coordinates, are fully relaxed, resulting in a non-polar cubic perovskite structure with a lattice constant of , which is very close to the experimental one of [49]. Phonons are calculated on a q-point mesh, with convergence tests on and q-point meshes showing only minor quantitative differences (see appendix on page Appendix). The resulting phonon dispersion for very low doping, using the PBEsol-relaxed unit cell, corresponds well with the room-temperature phonon dispersion calculated recently using Quantum Self-Consistent Ab Initio Lattice Dynamics (QSCAILD), which is based on DFT and a self-consistent sampling method to capture both thermal and quantum fluctuations [50]. Note that, since our study is for doped KTO, we neglect the LO-TO splitting, assuming that it will be screened by the metallicity. To our knowledge, the evolution of the LO-TO splitting from the insulating to the metallic state as a function of doping in transition-metal oxides has not been determined, and this would be an important topic for future work.
The electron-phonon coupling properties are calculated using the EPW 5.4.1 and 5.5 codes [51, 52], which are included in the Quantum ESPRESSO package. The relevant electronic bands in \ceKTaO3 are the three Ta- t2g bands, which are reproduced using maximally localized Wannier functions as implemented in the Wannier90 code [53], used internally by EPW. The electron-phonon matrix elements are first calculated on coarse k-point and q-point meshes and then interpolated onto fine grids using maximally localized Wannier functions. We use a random fine mesh with k points to calculate the mode-resolved electron-phonon coupling strengths, , along a path between cubic high-symmetry points with 200 q points between each point. Convergence test results can be found in the appendix on page Appendix.
III Results and Discussion
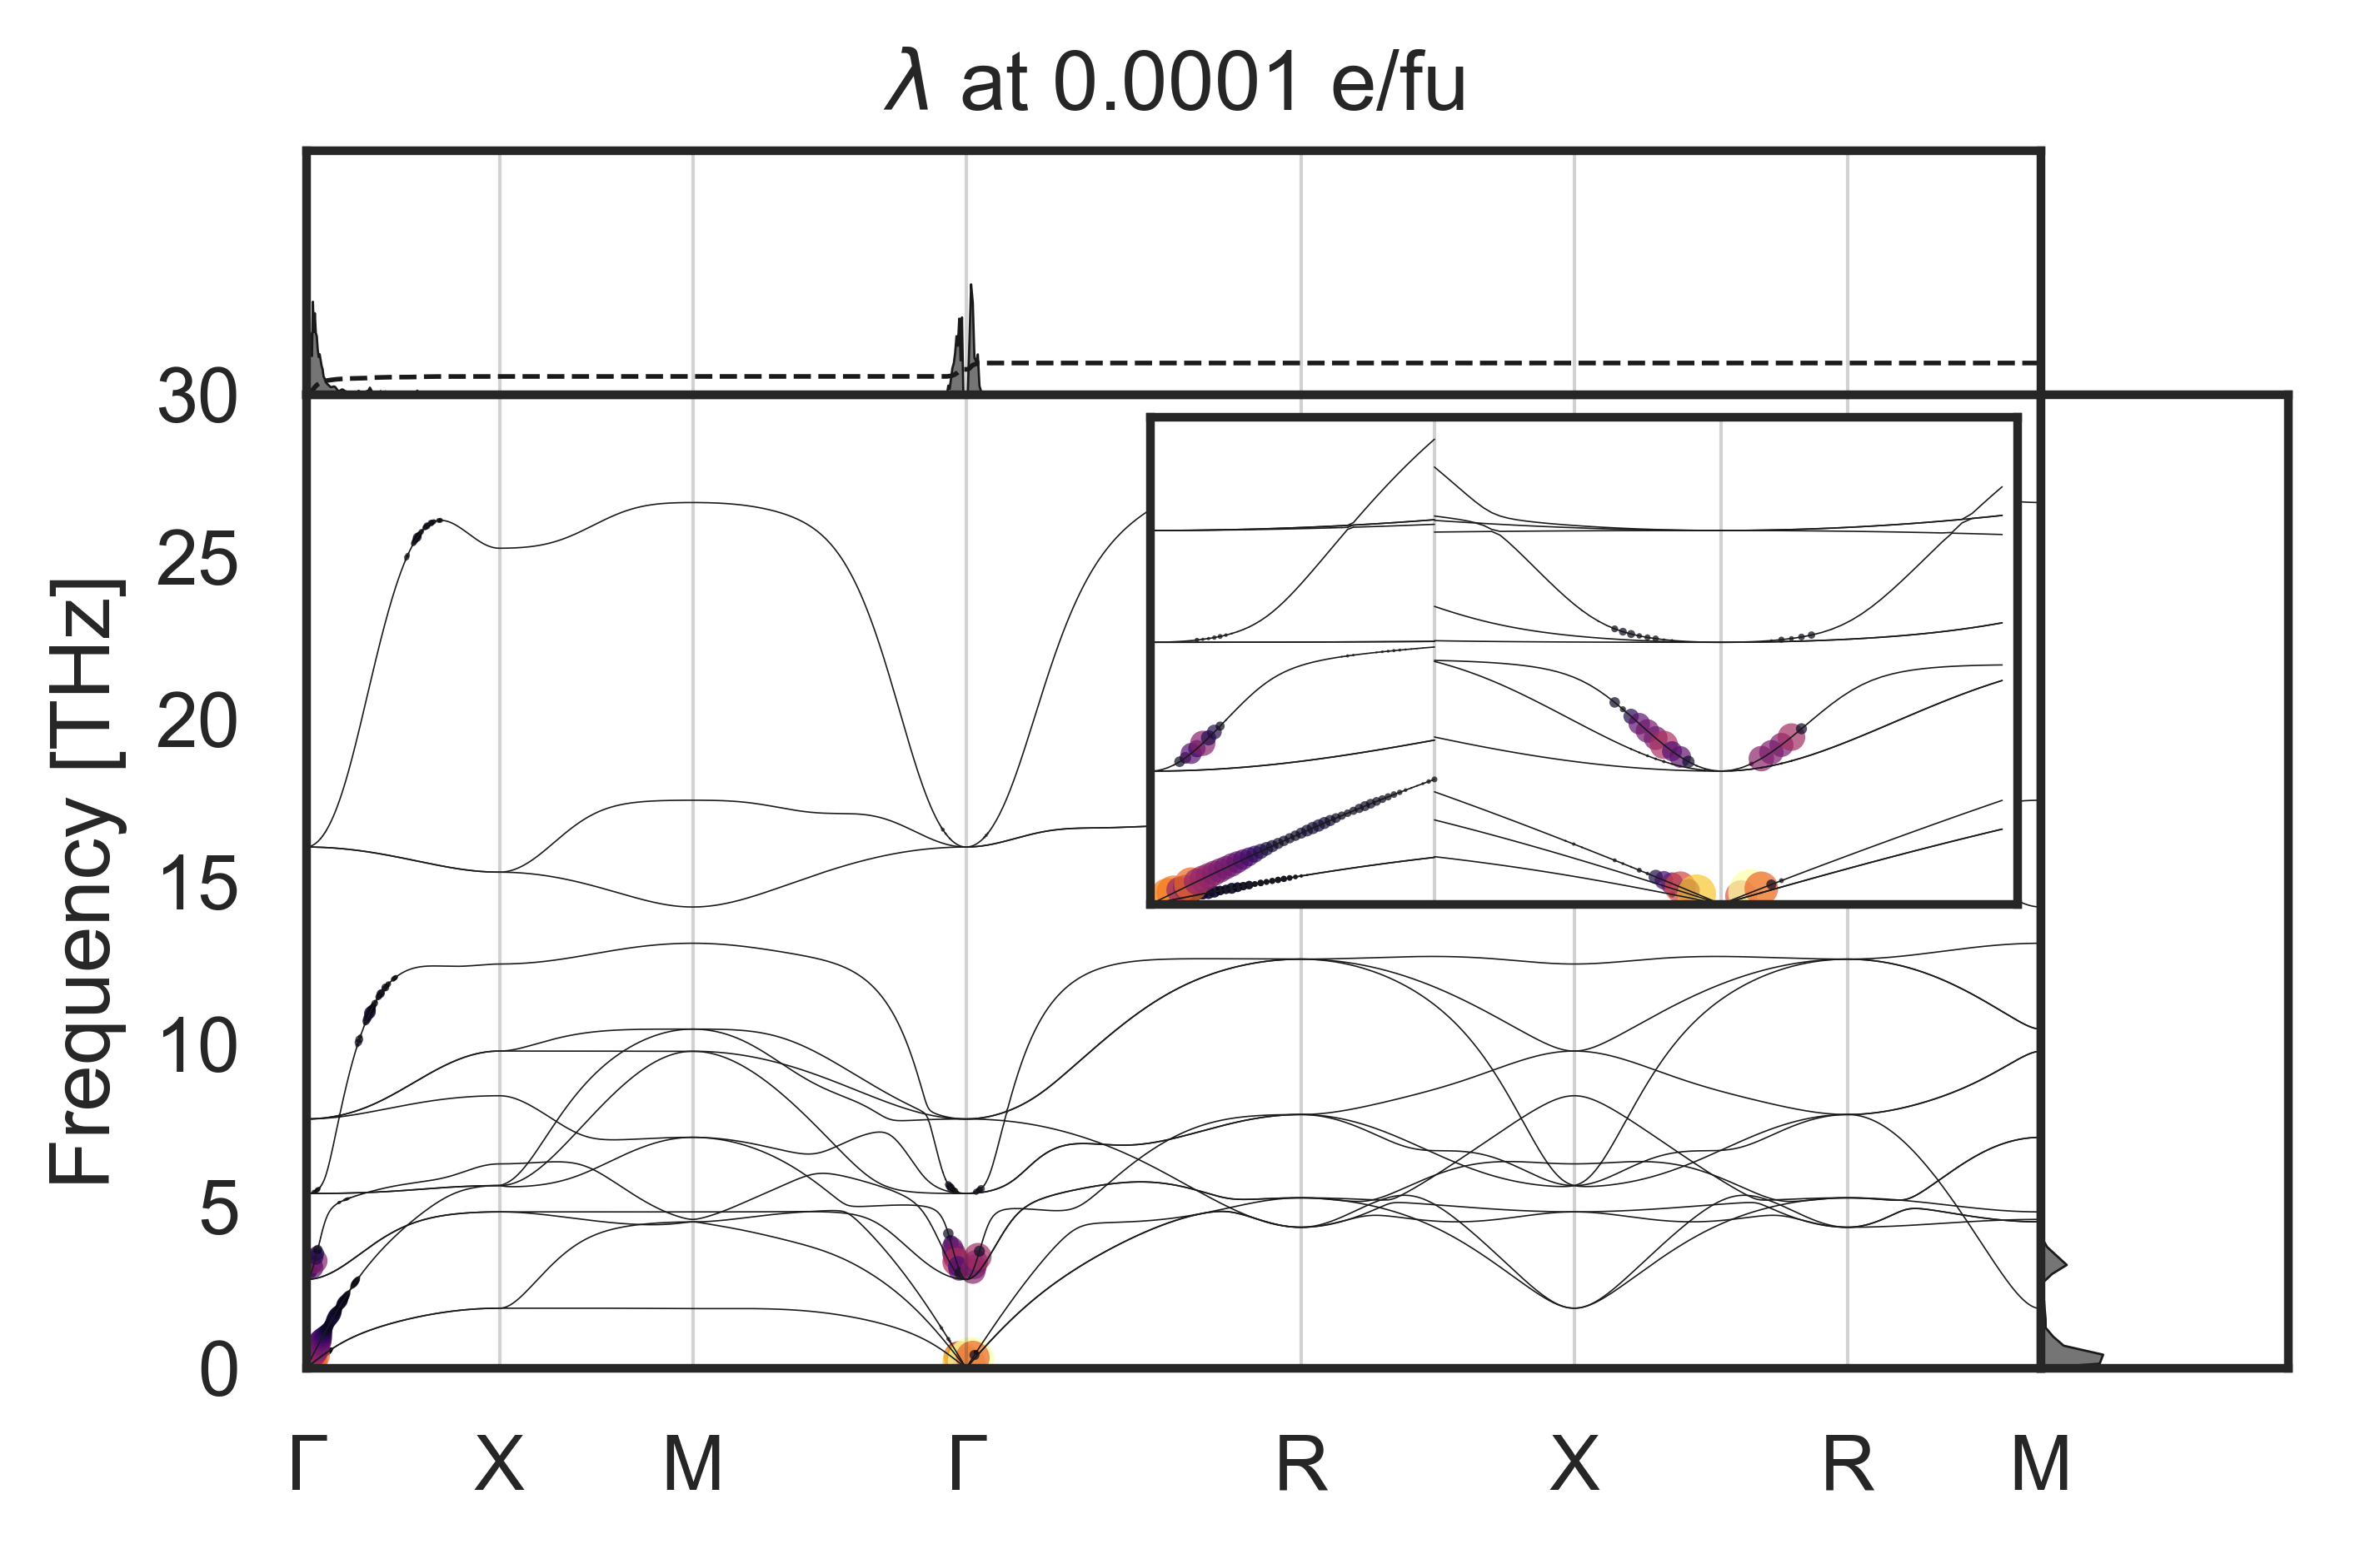
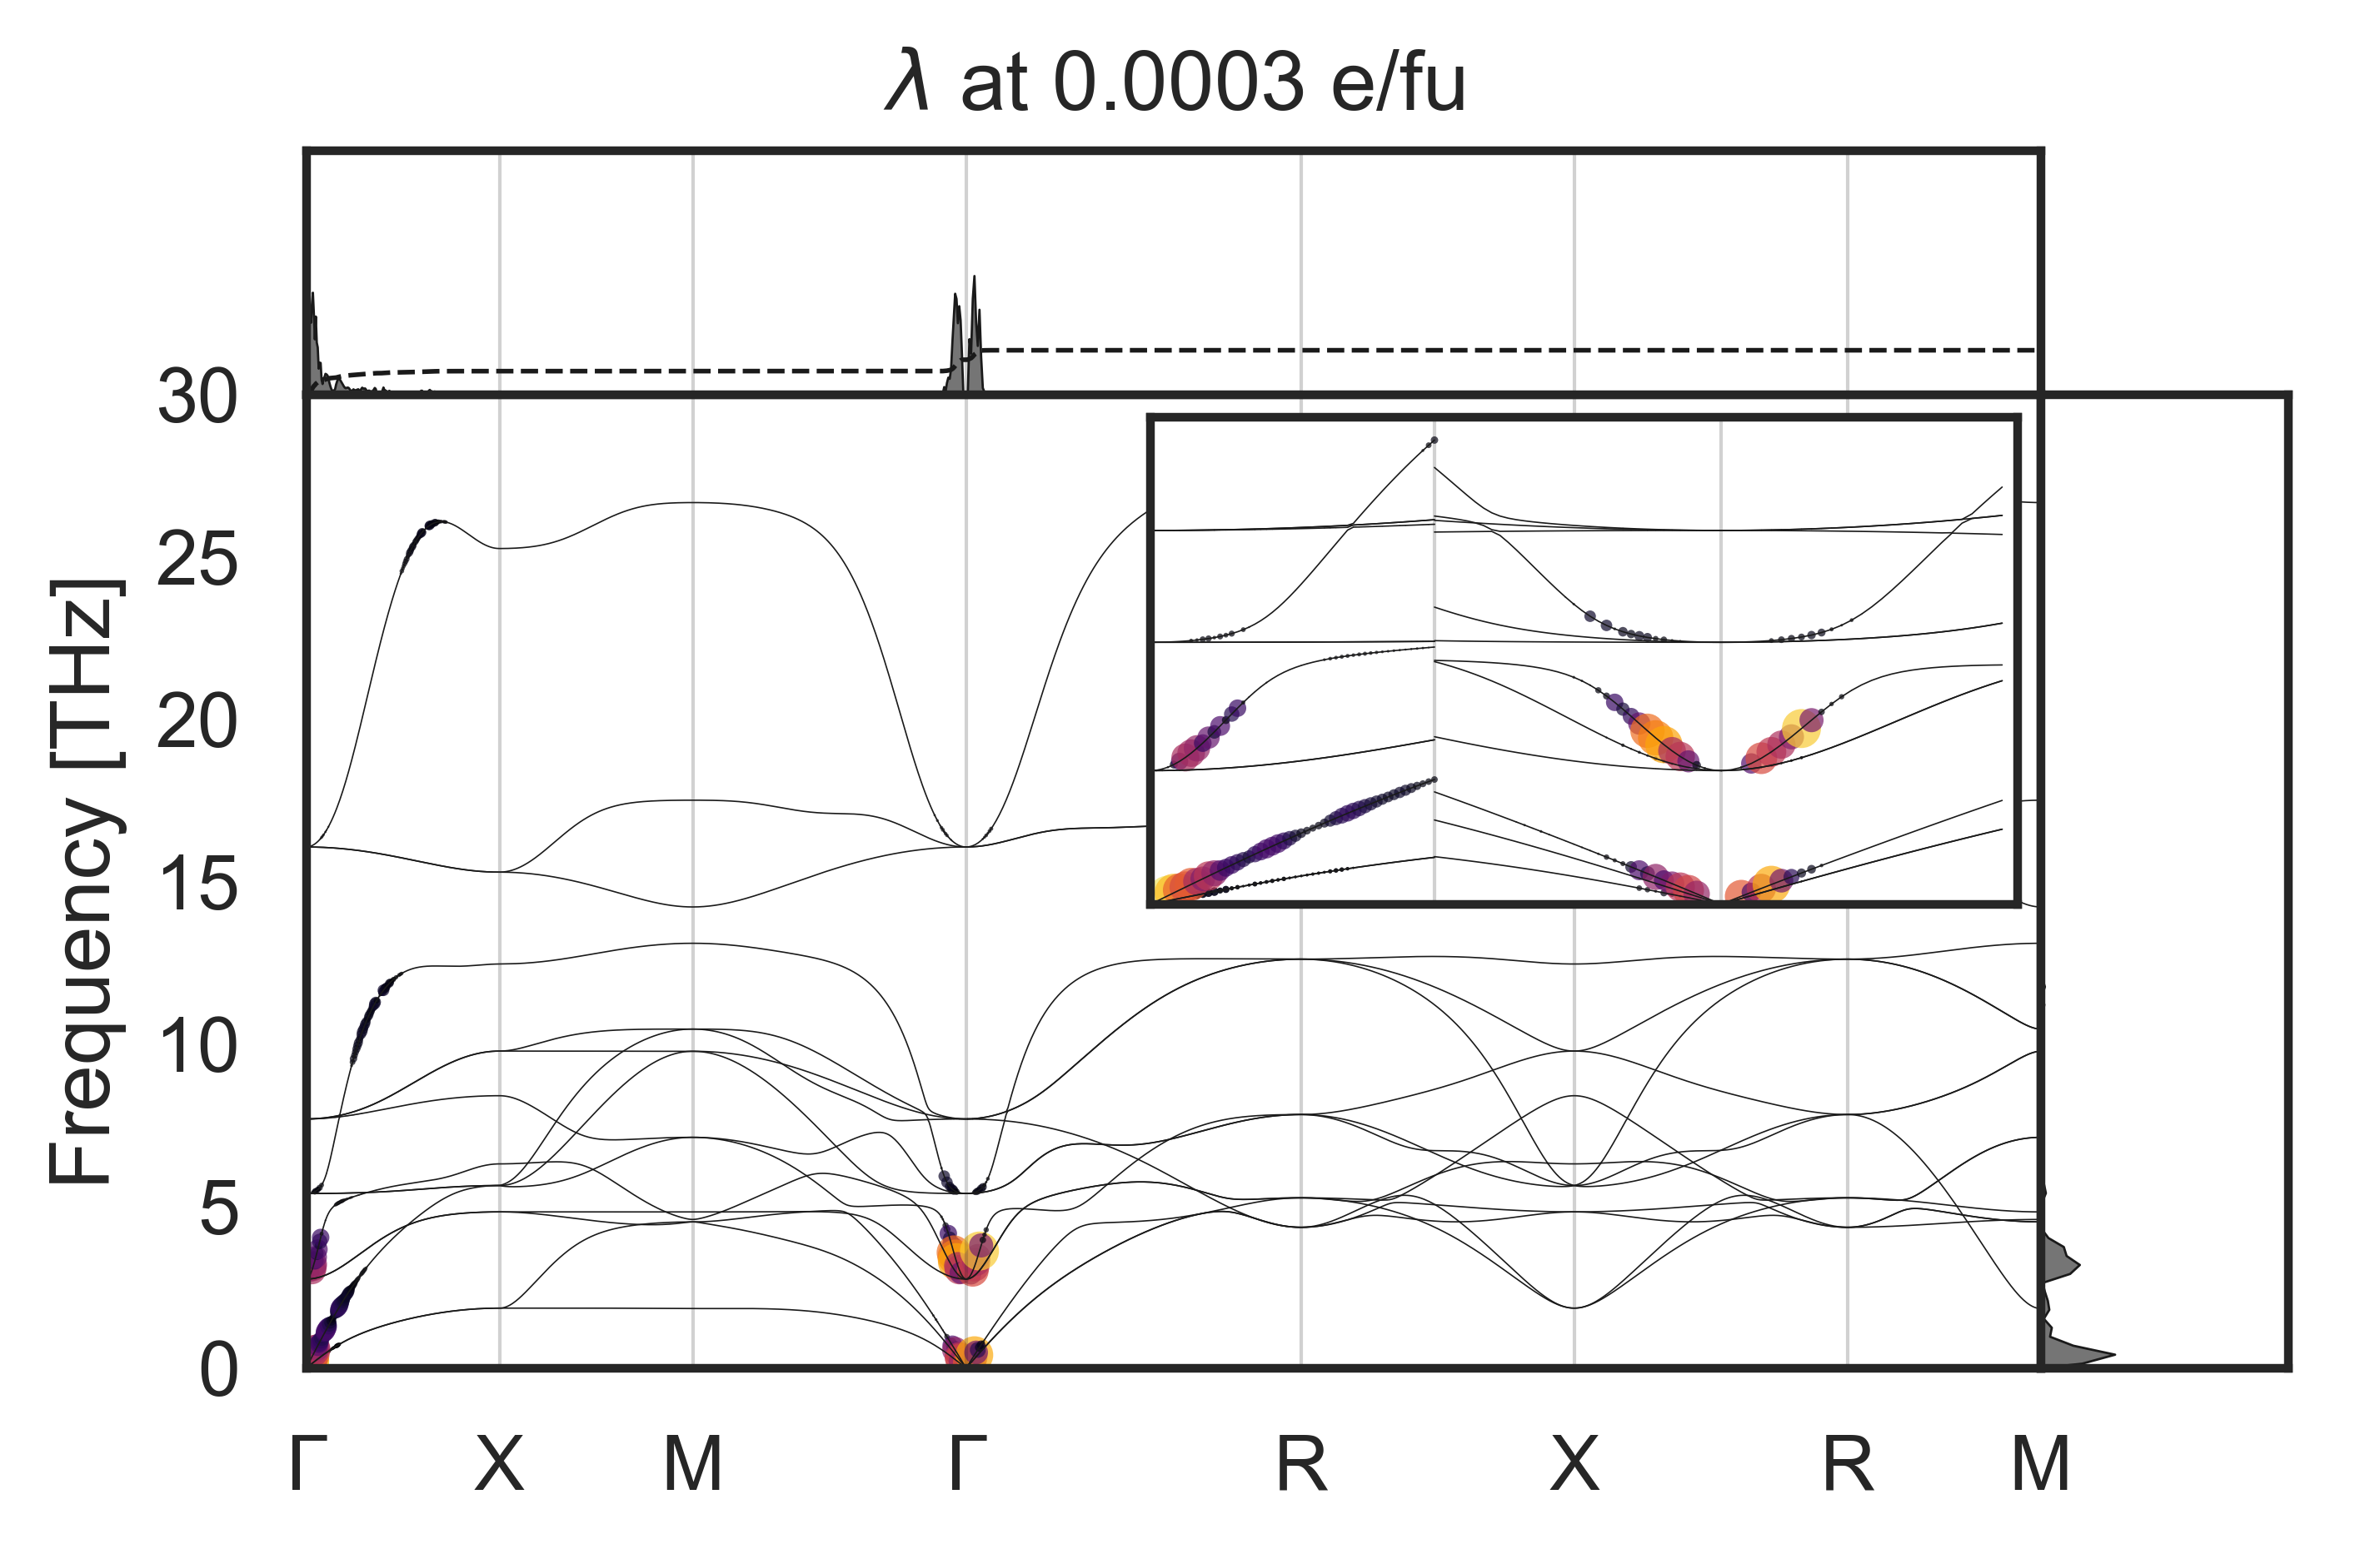
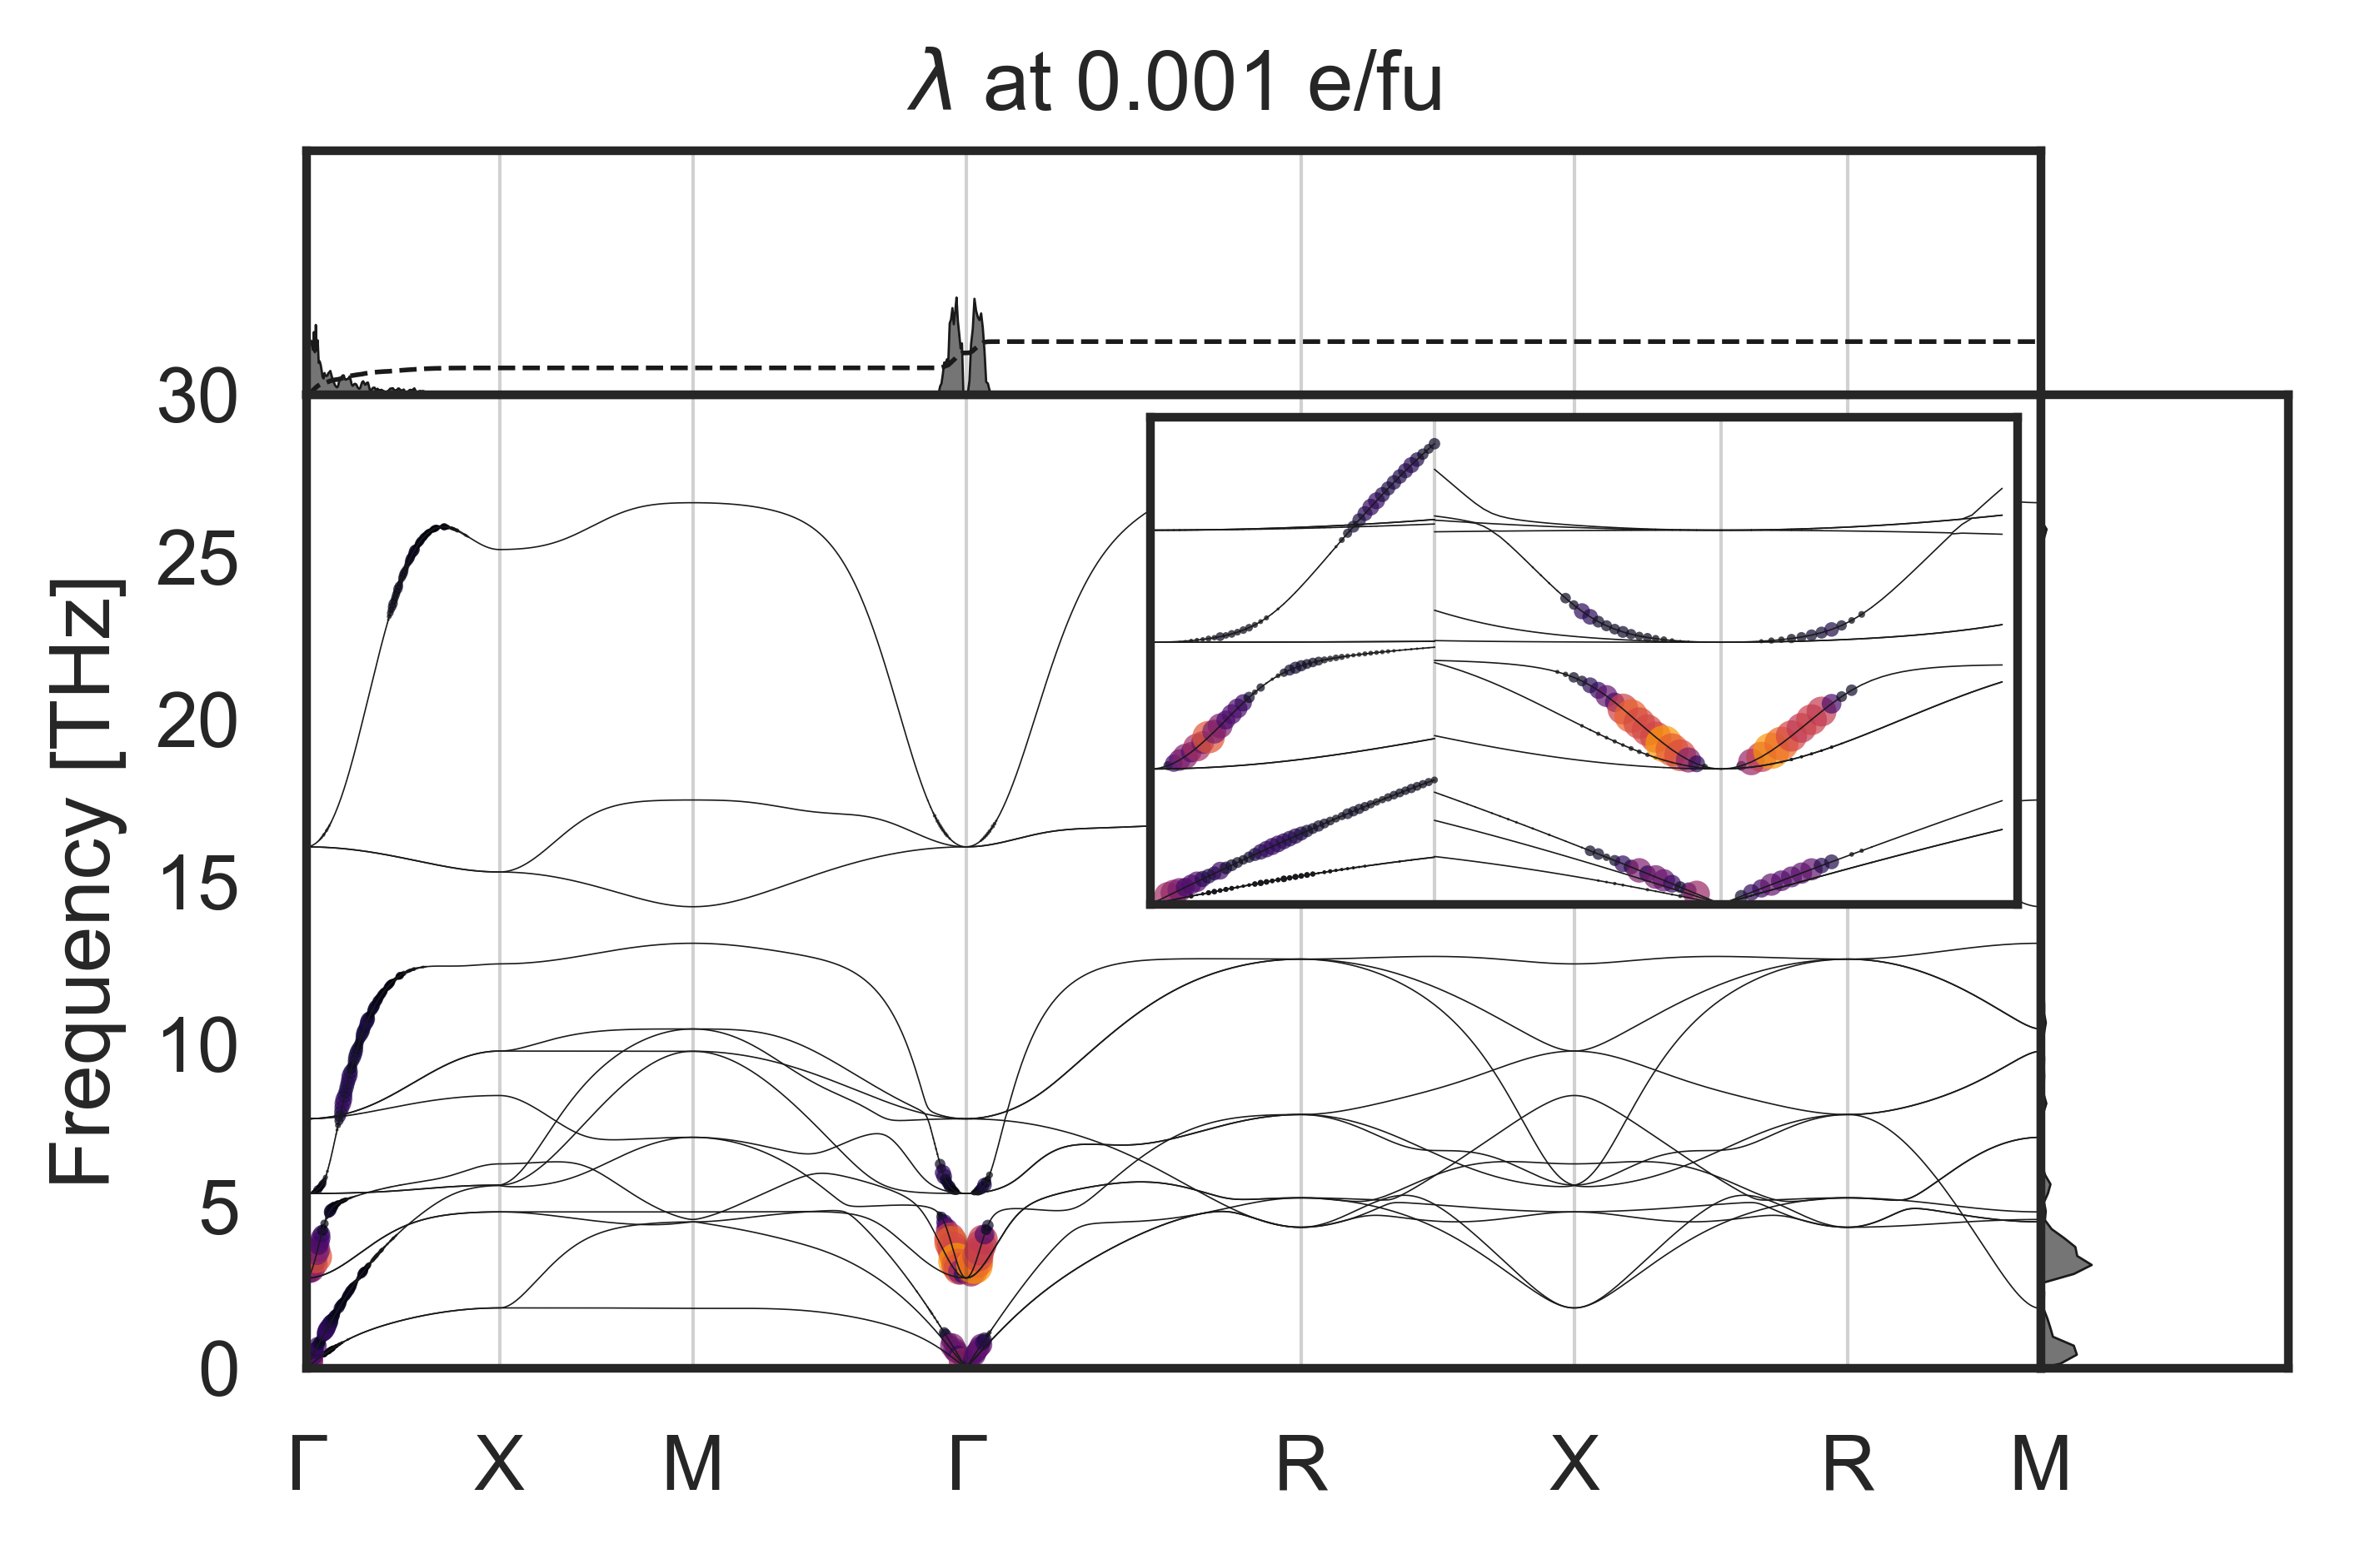
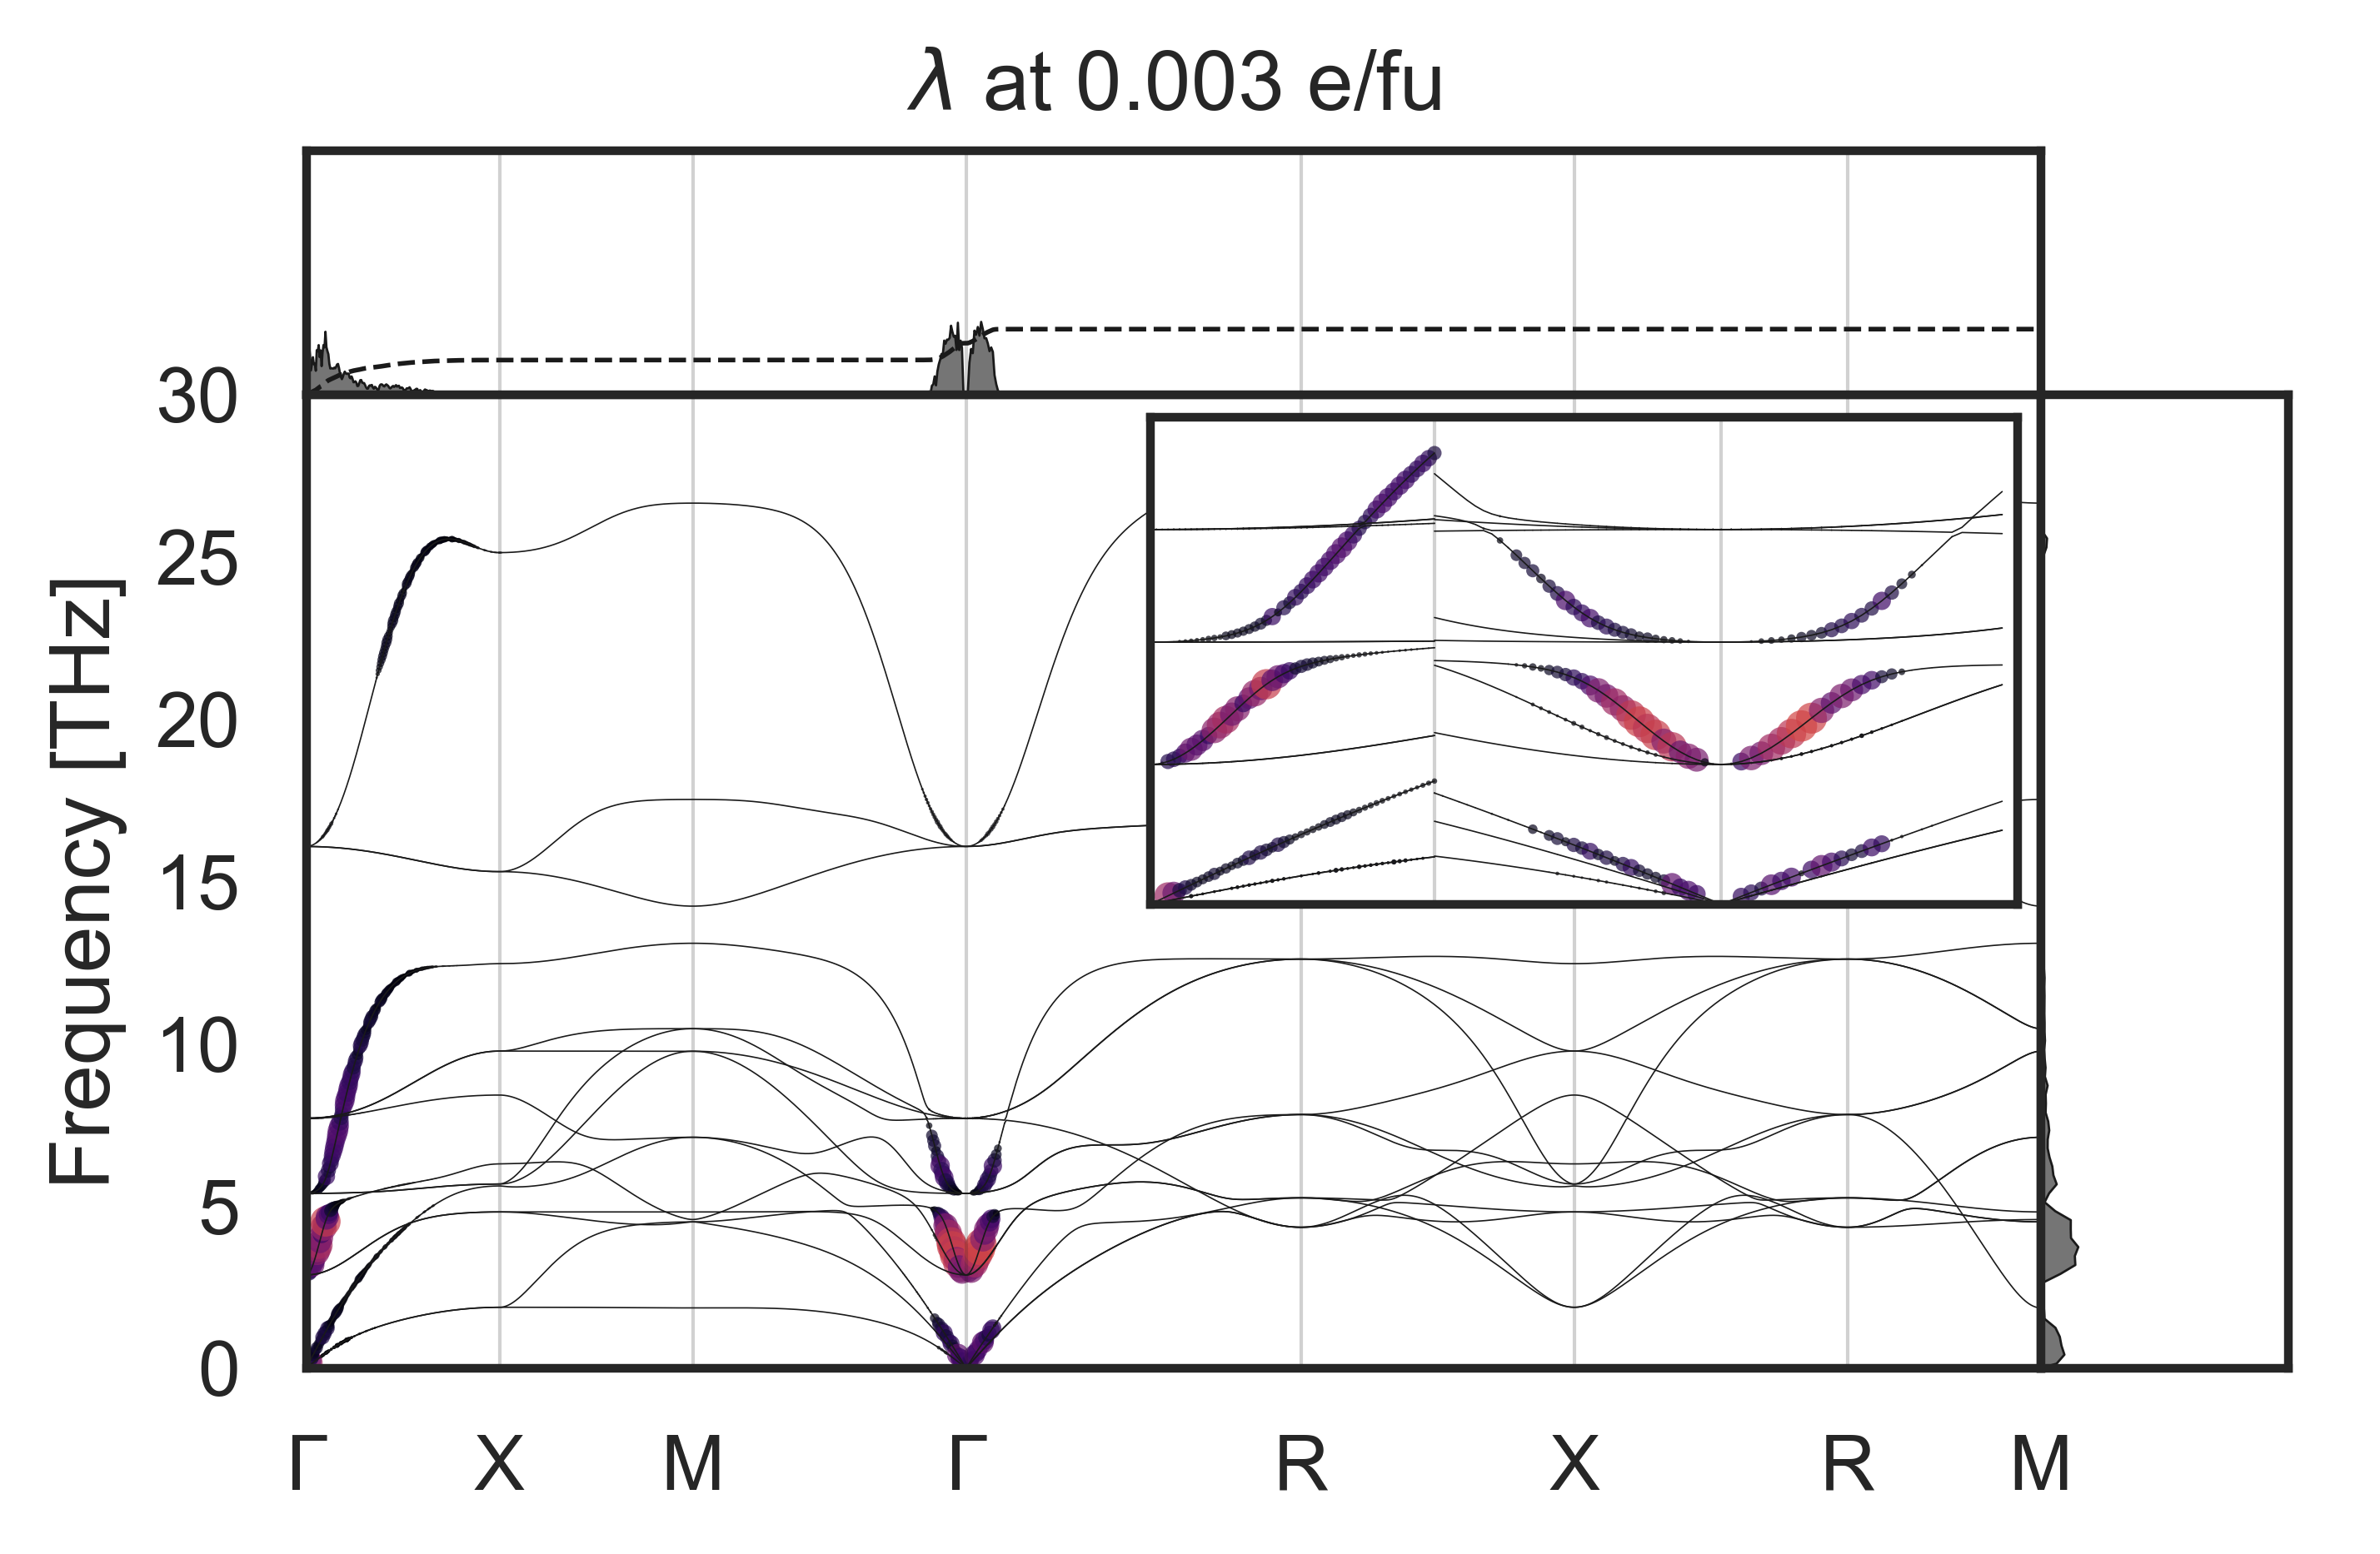
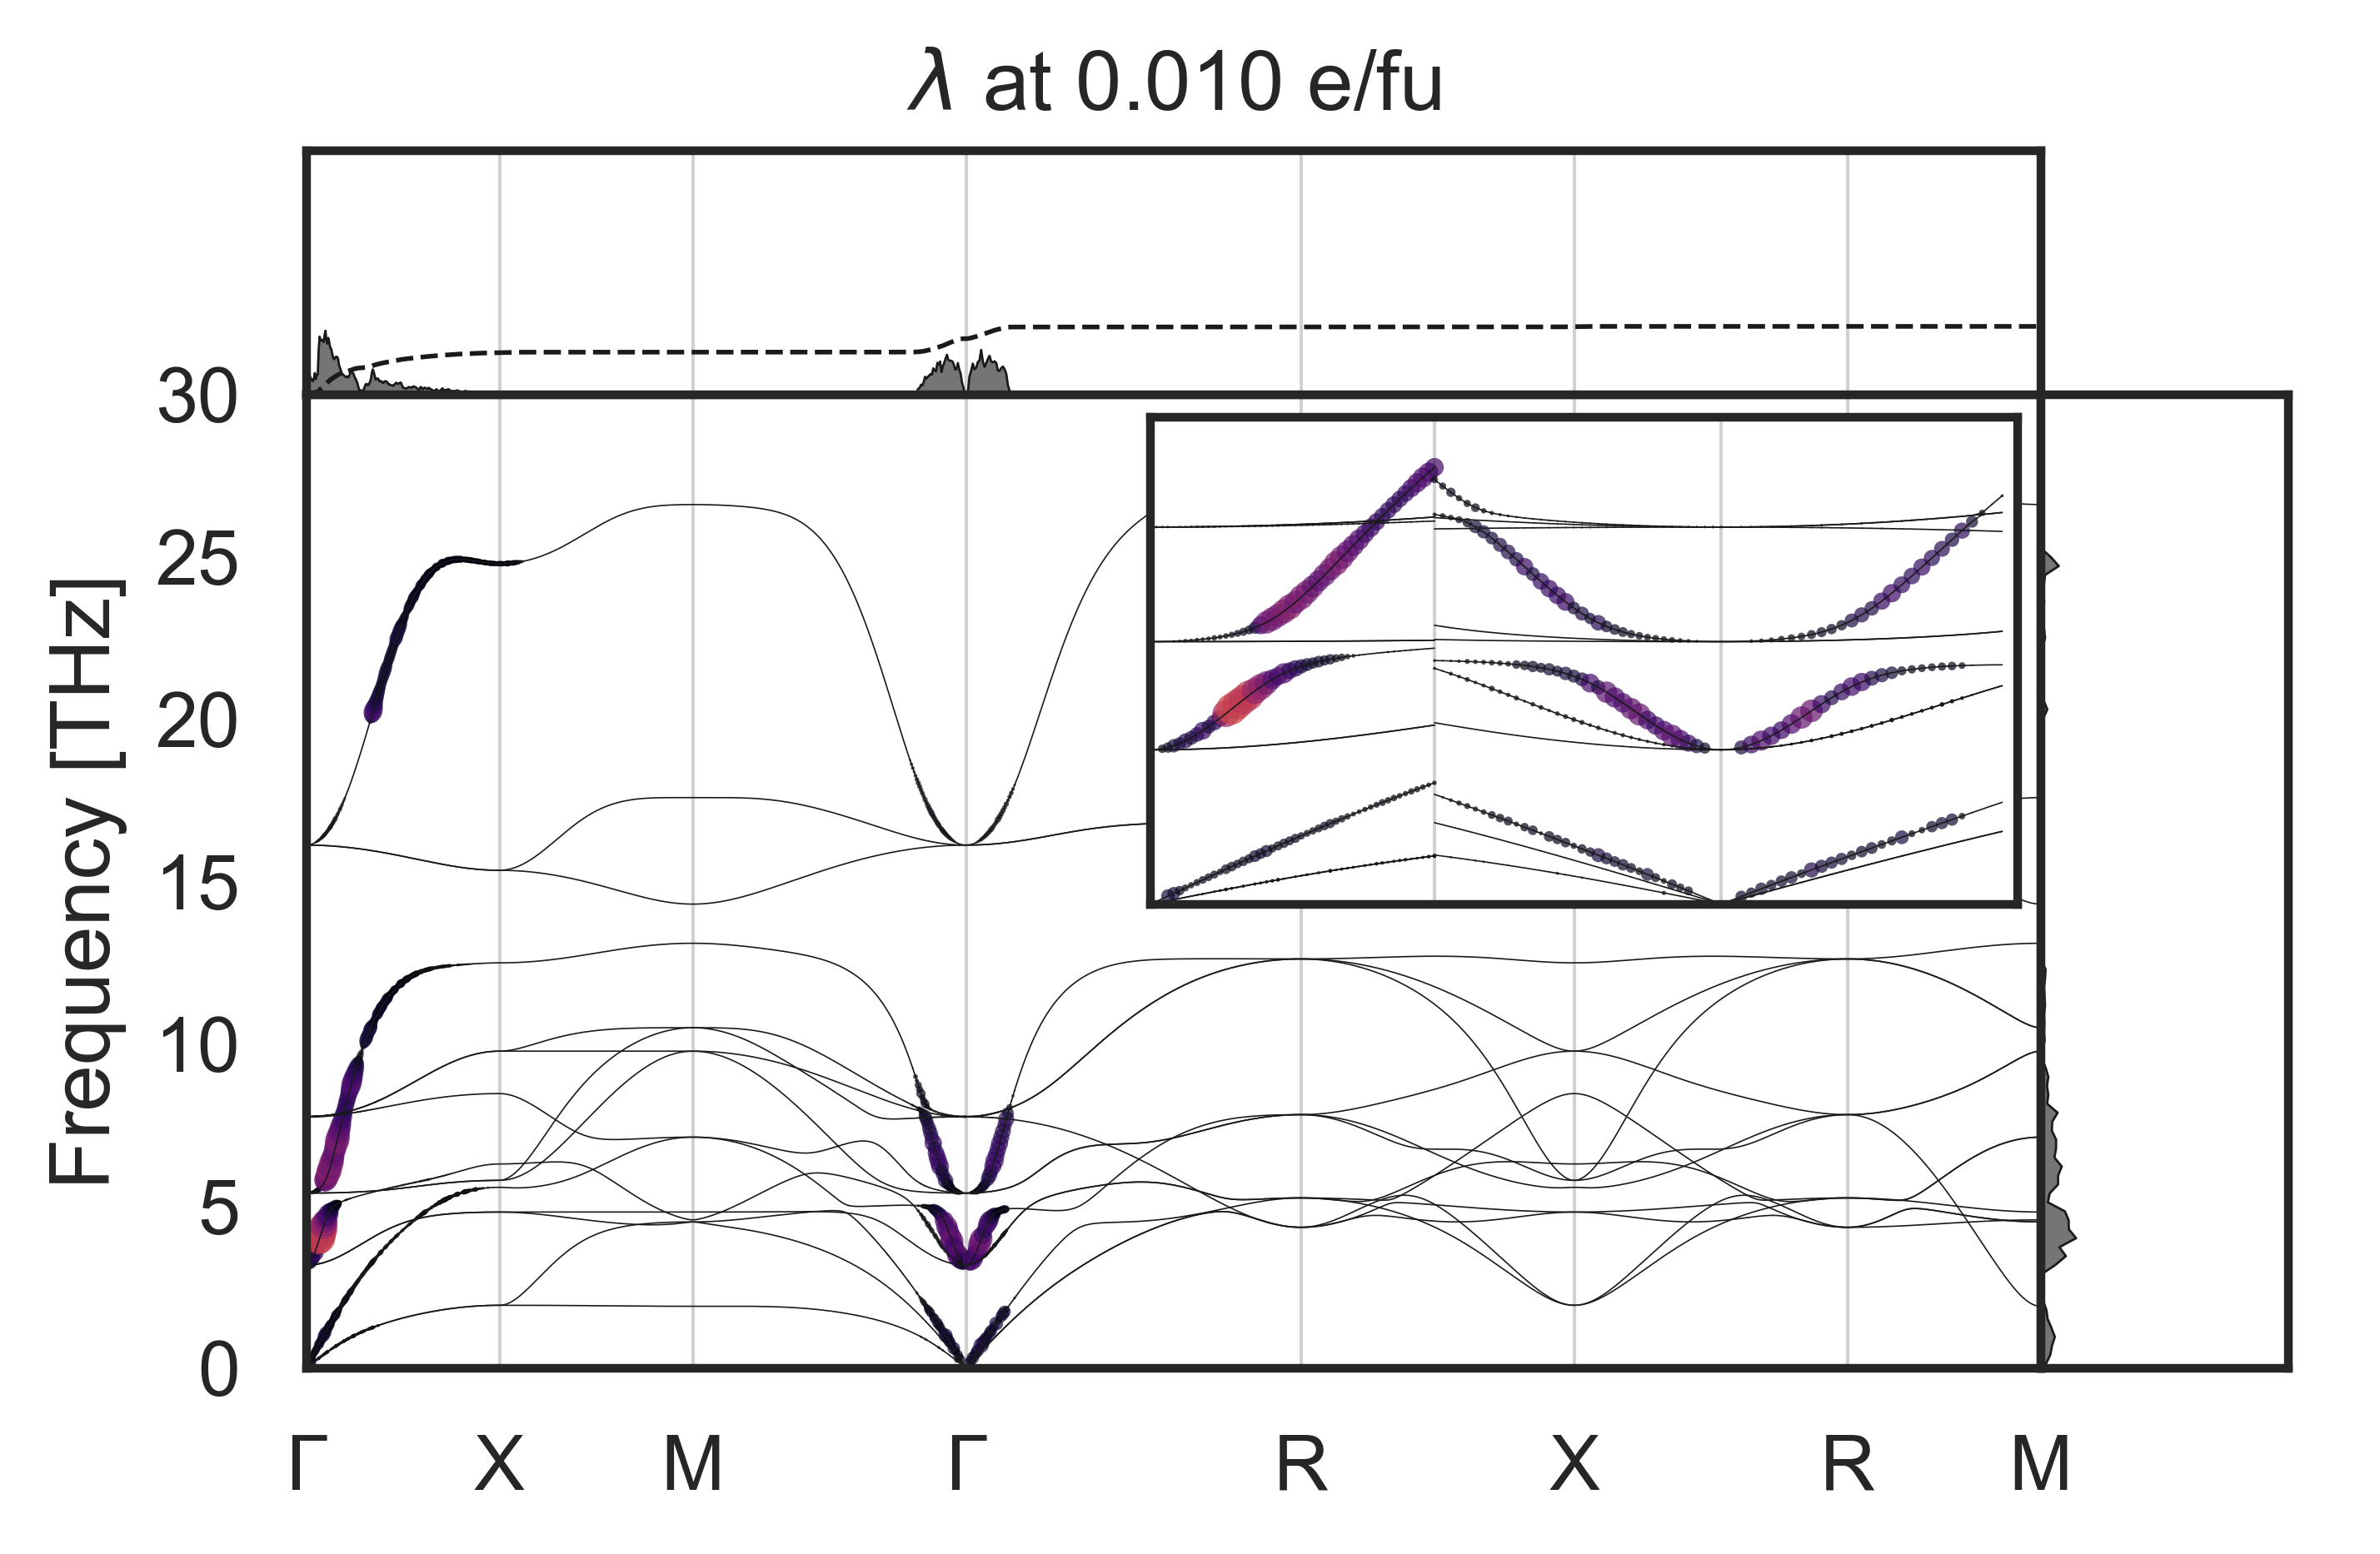
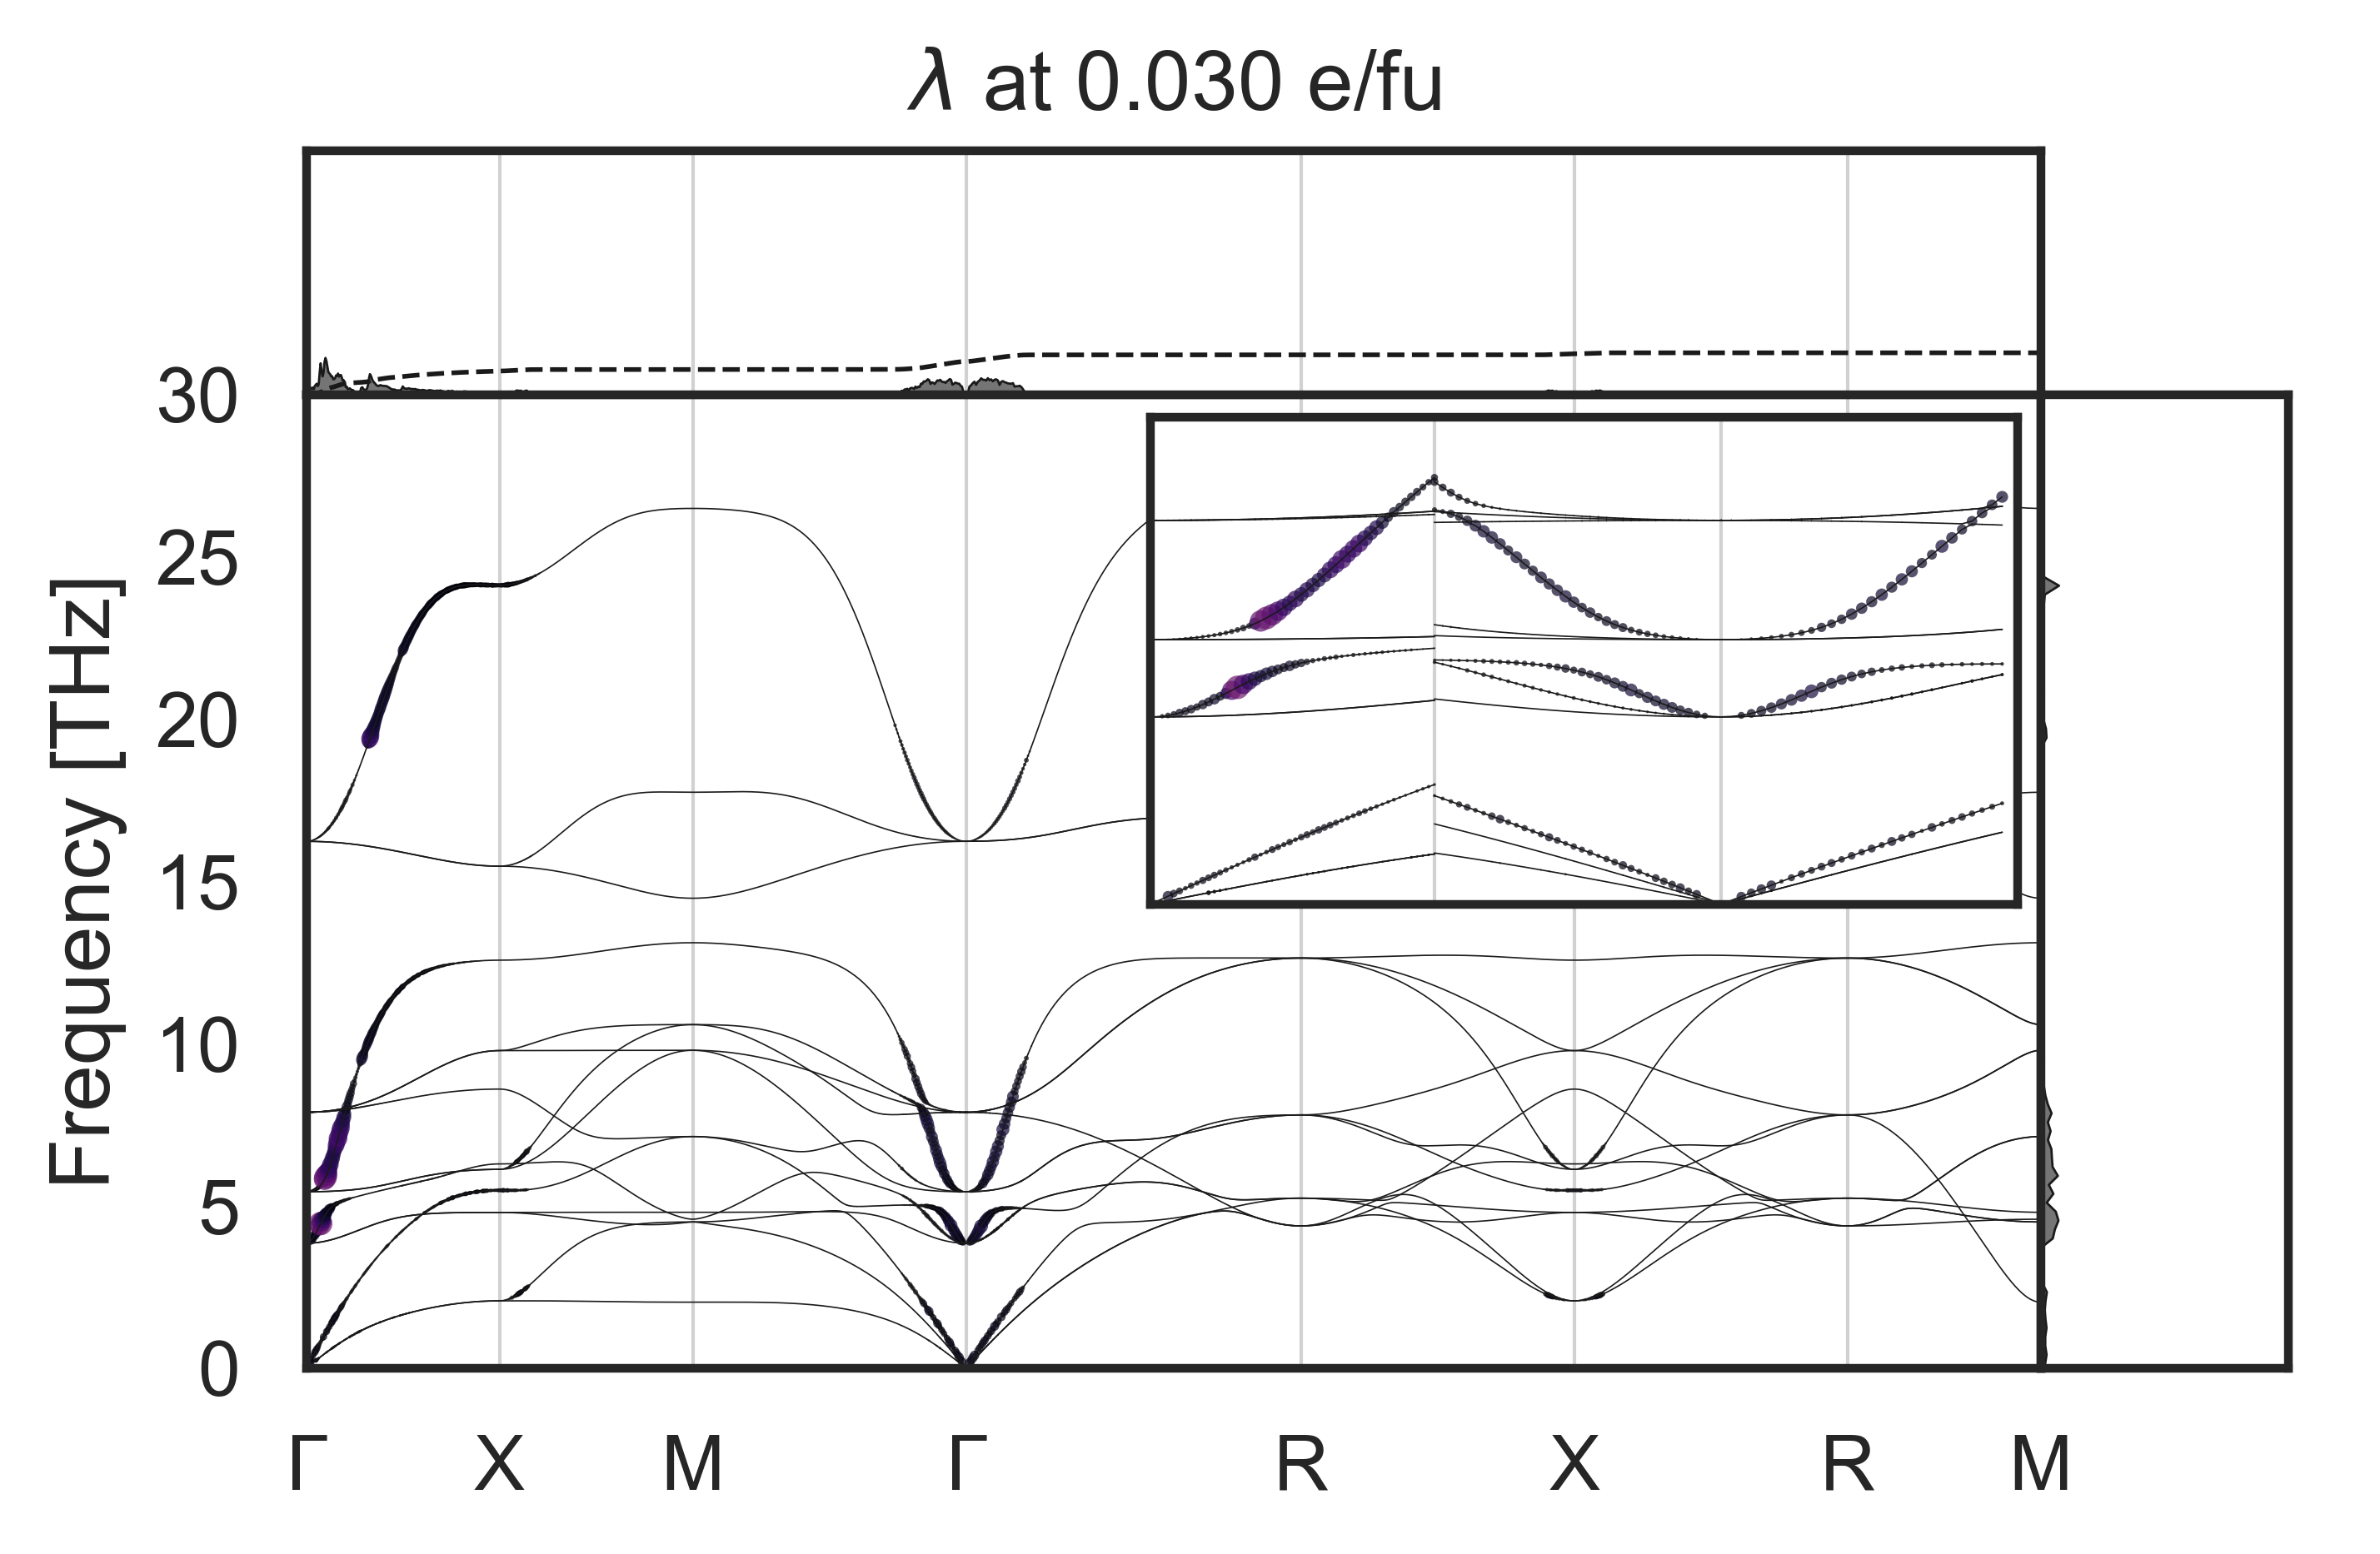
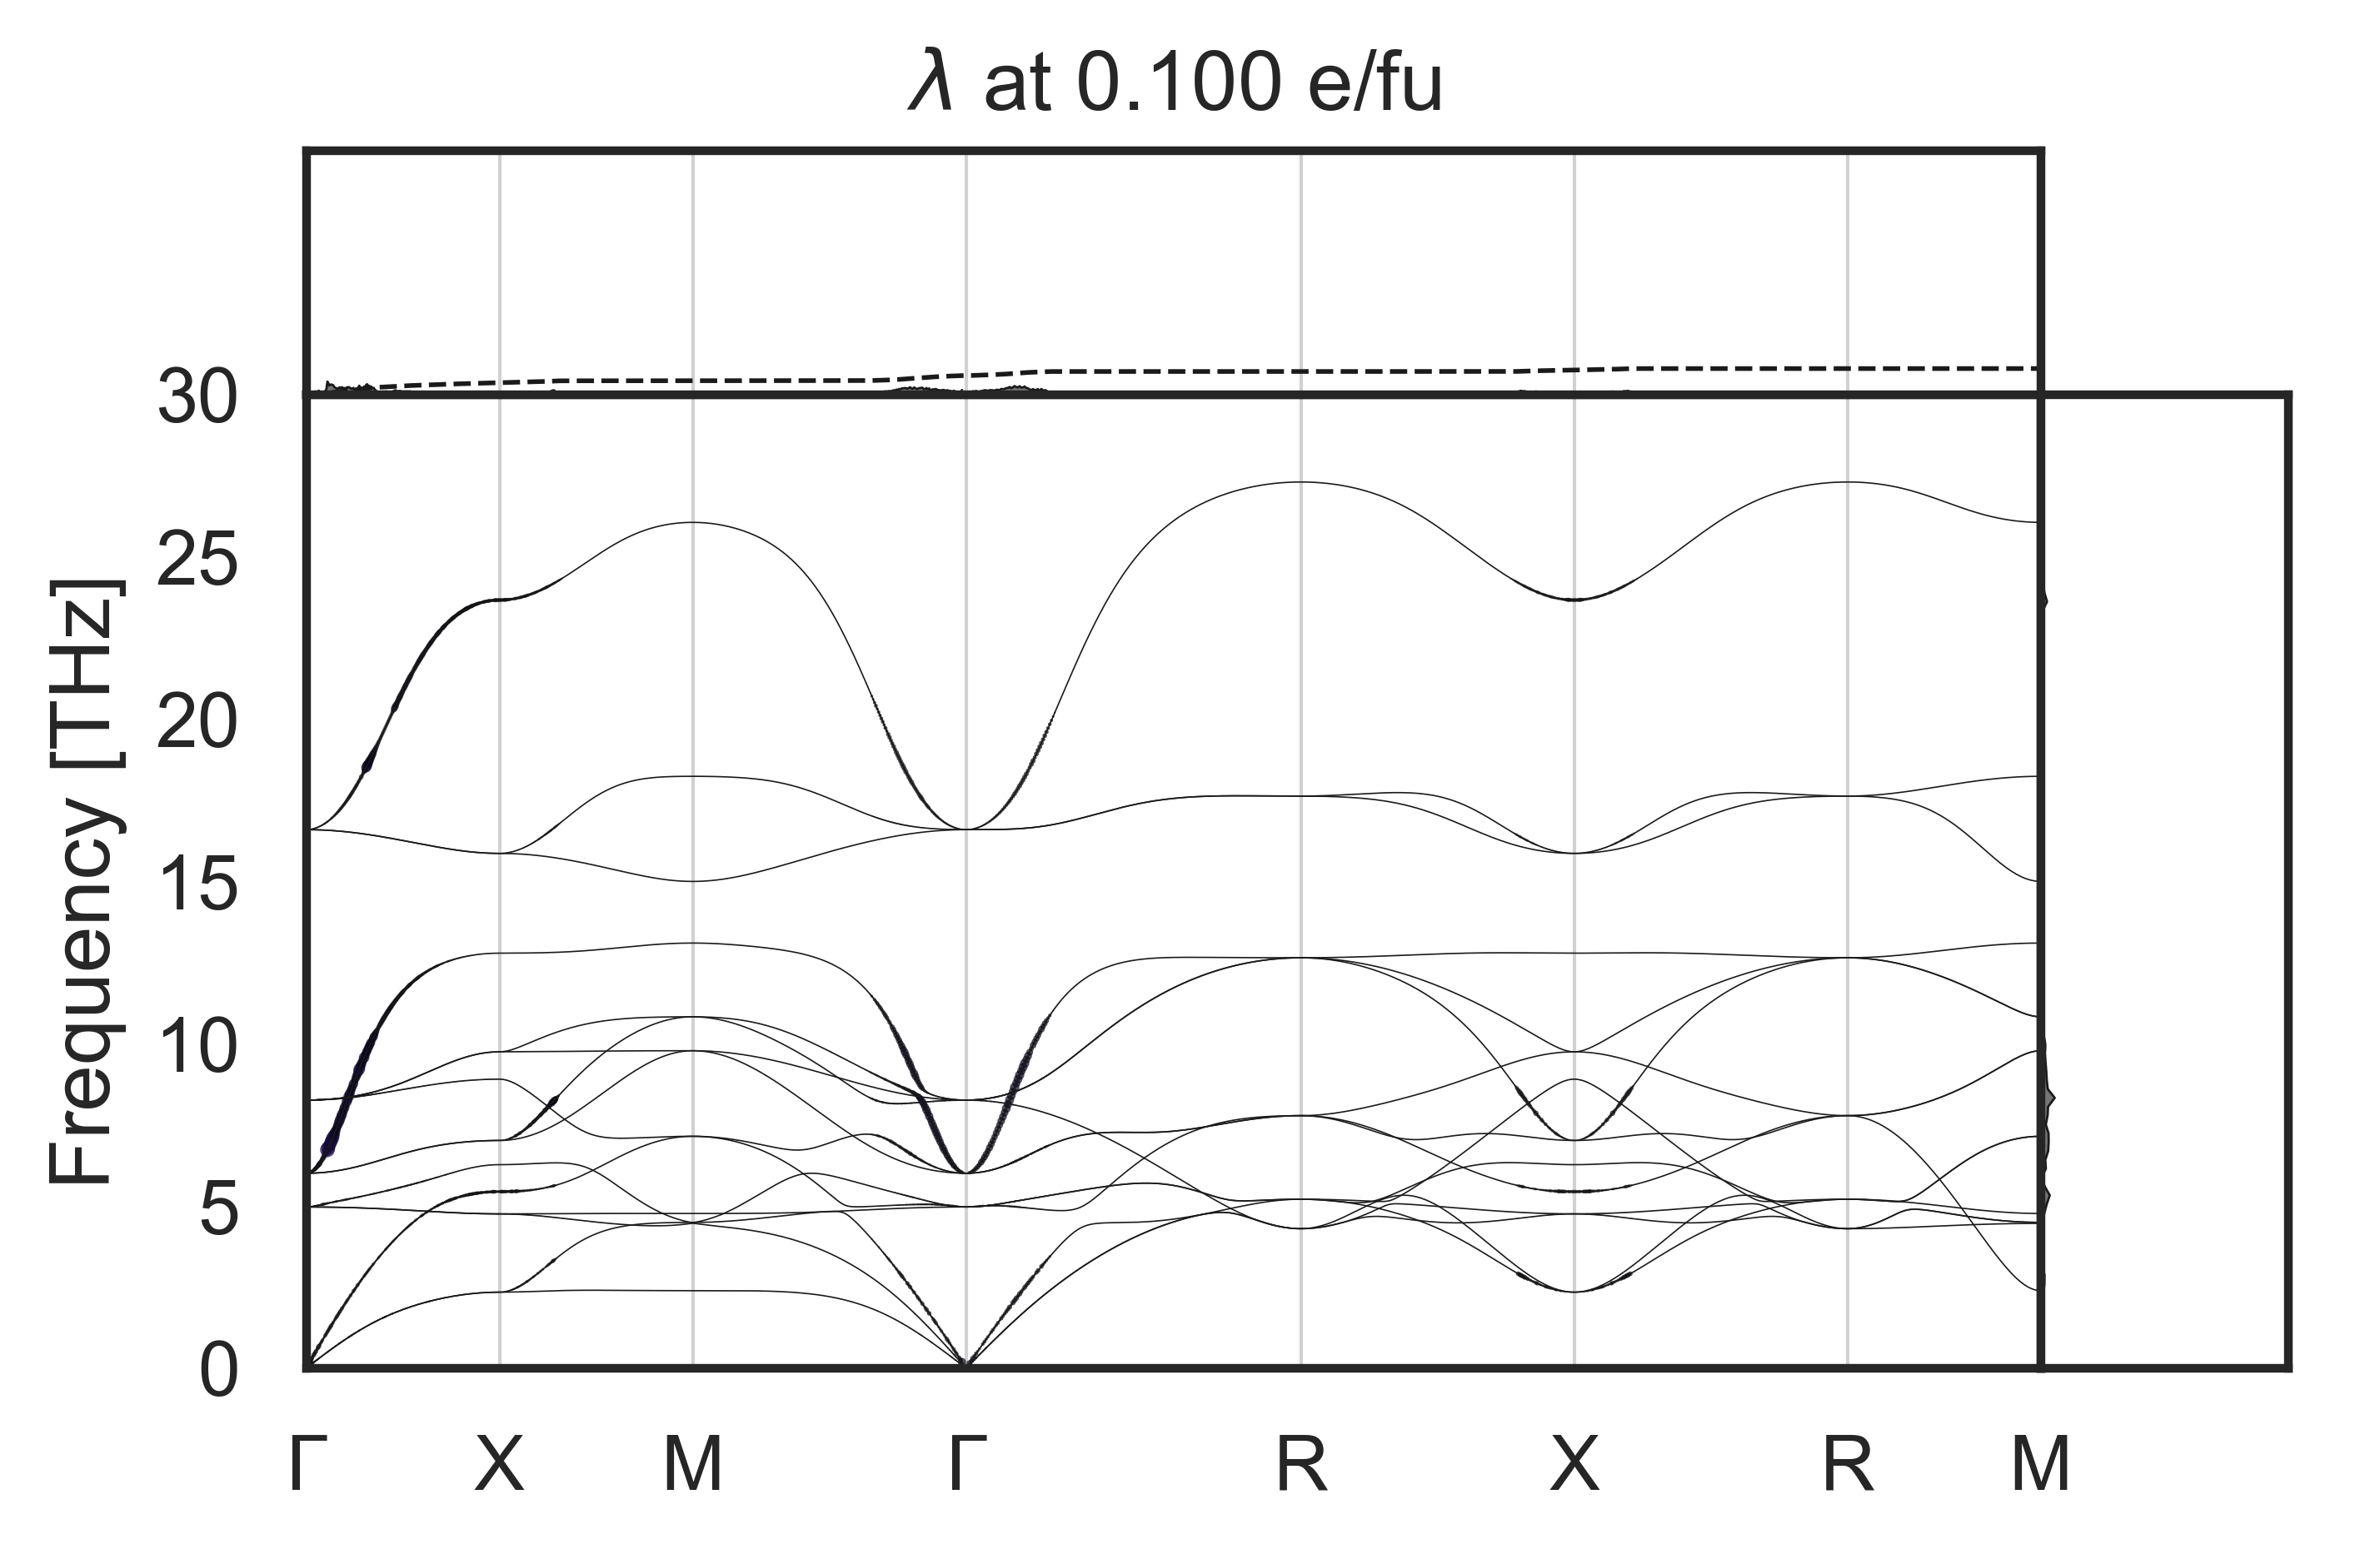
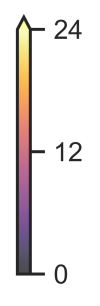
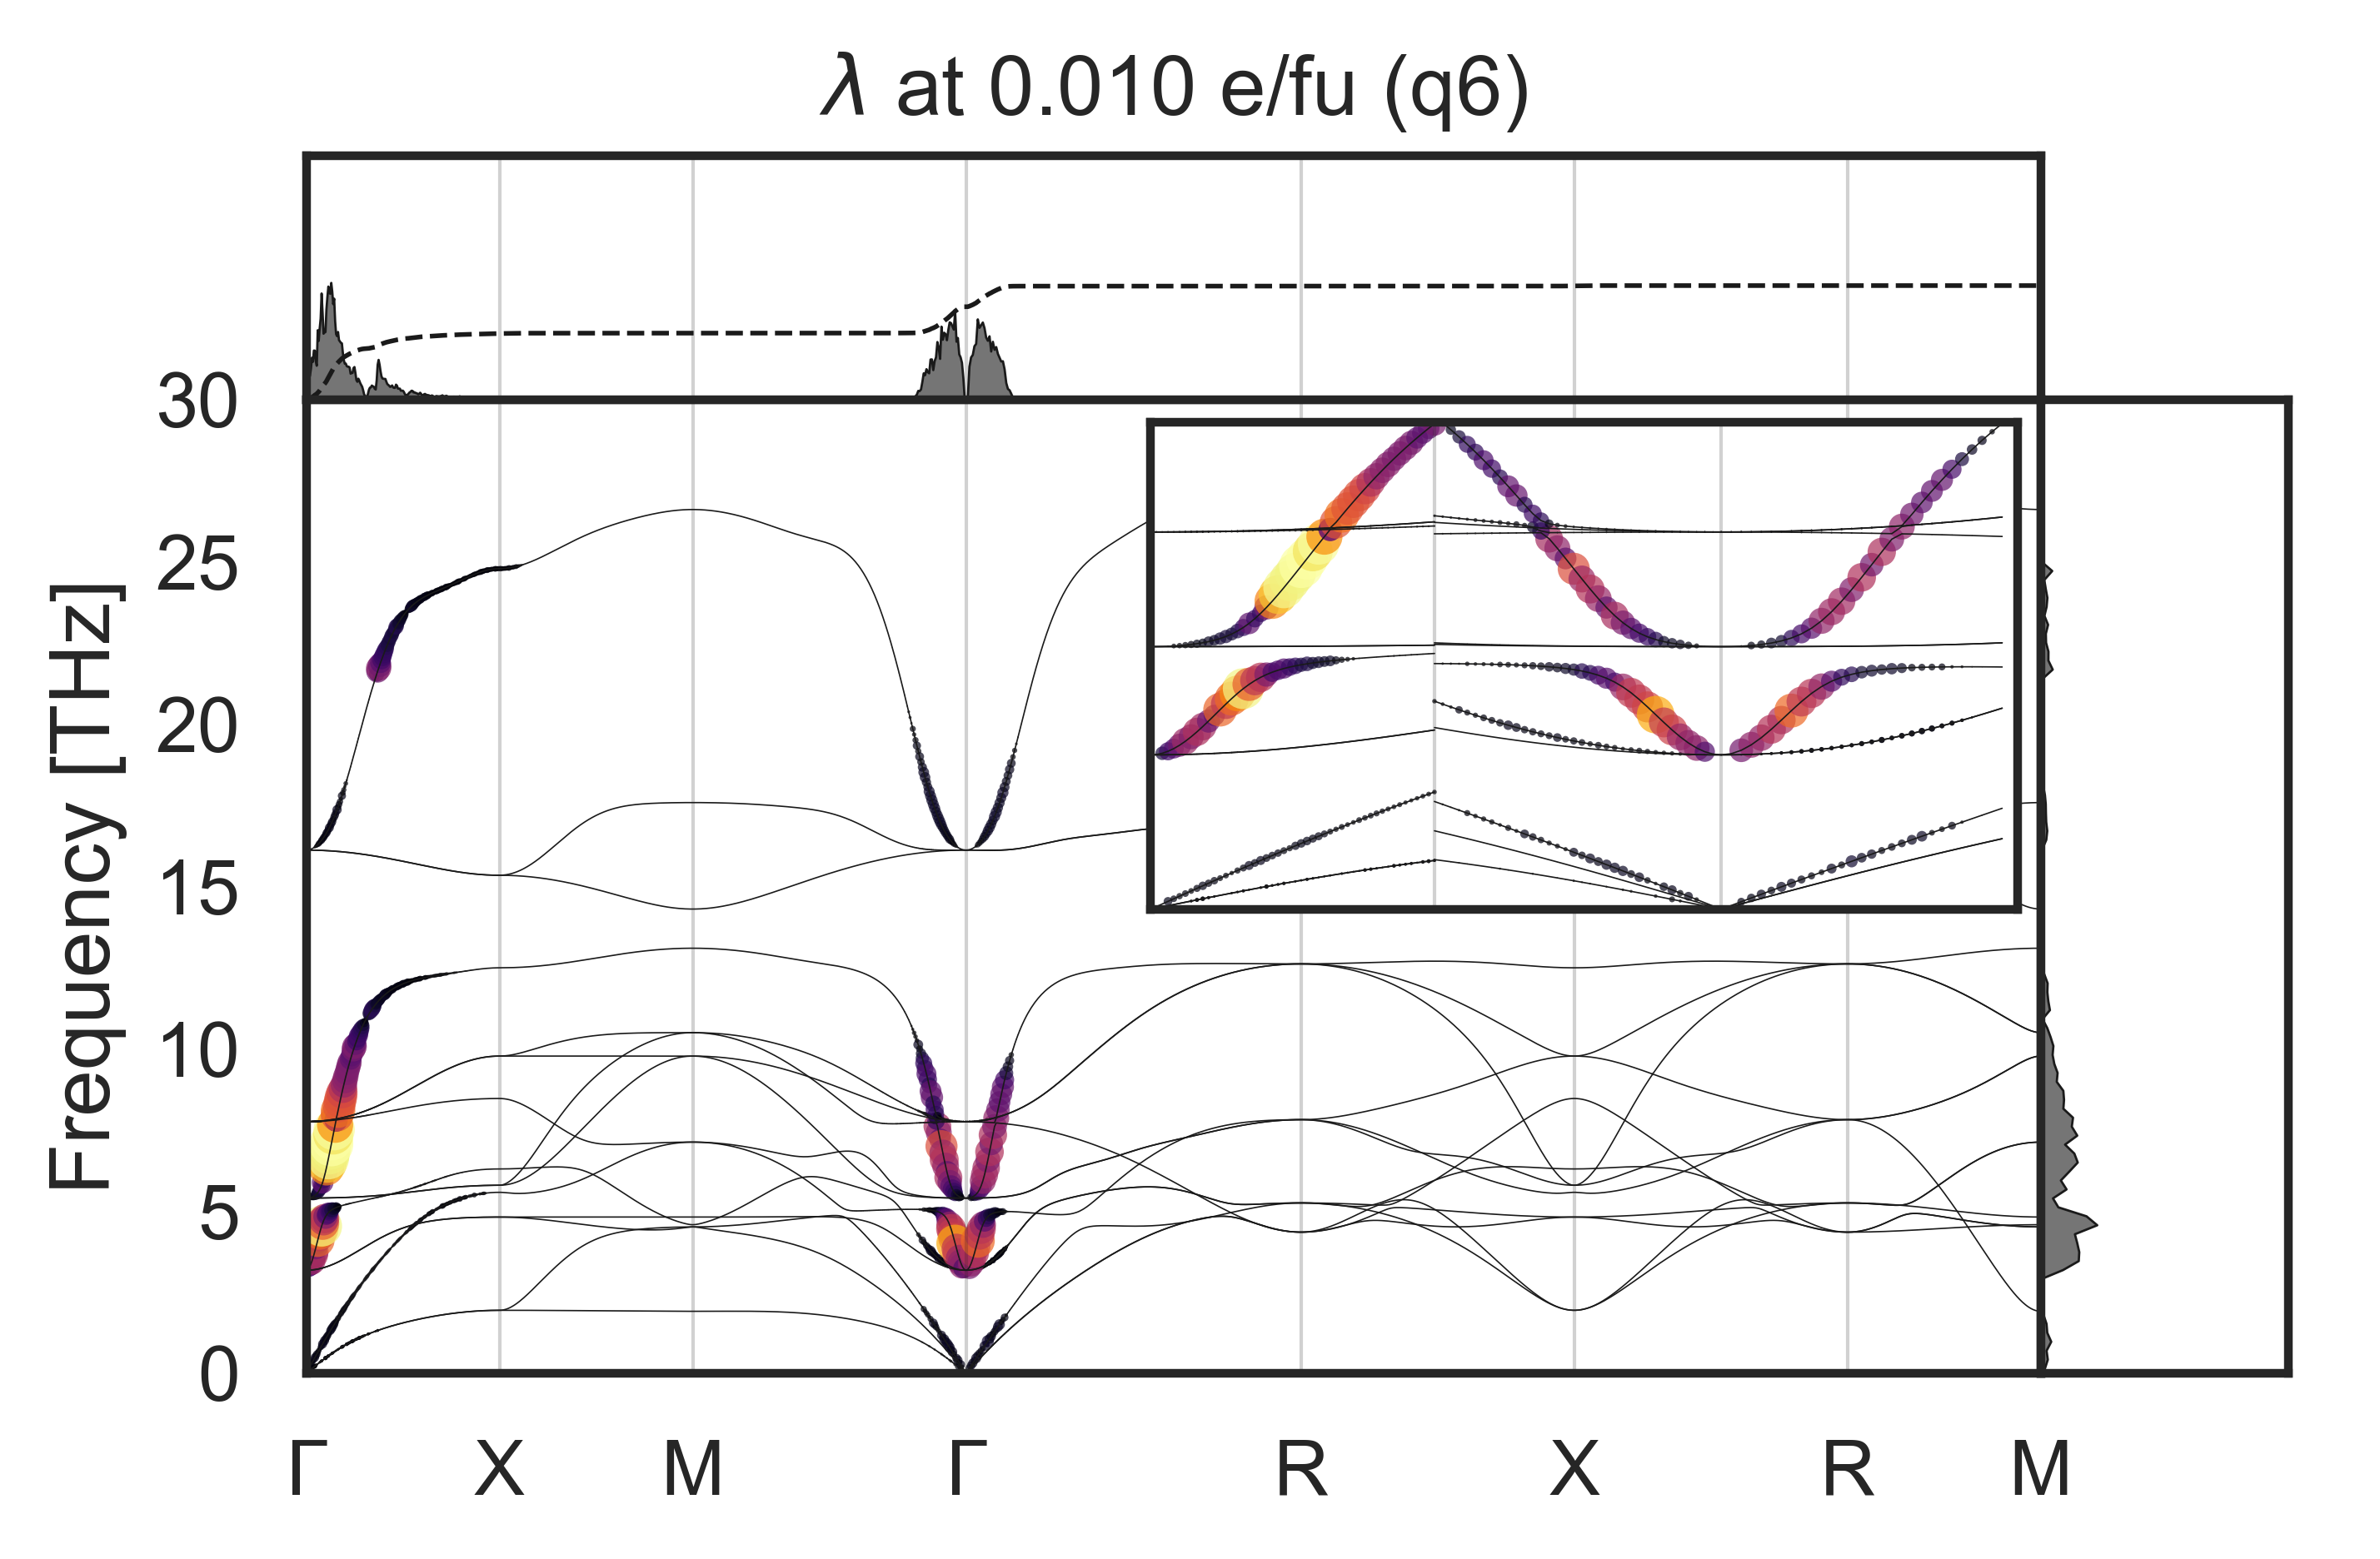
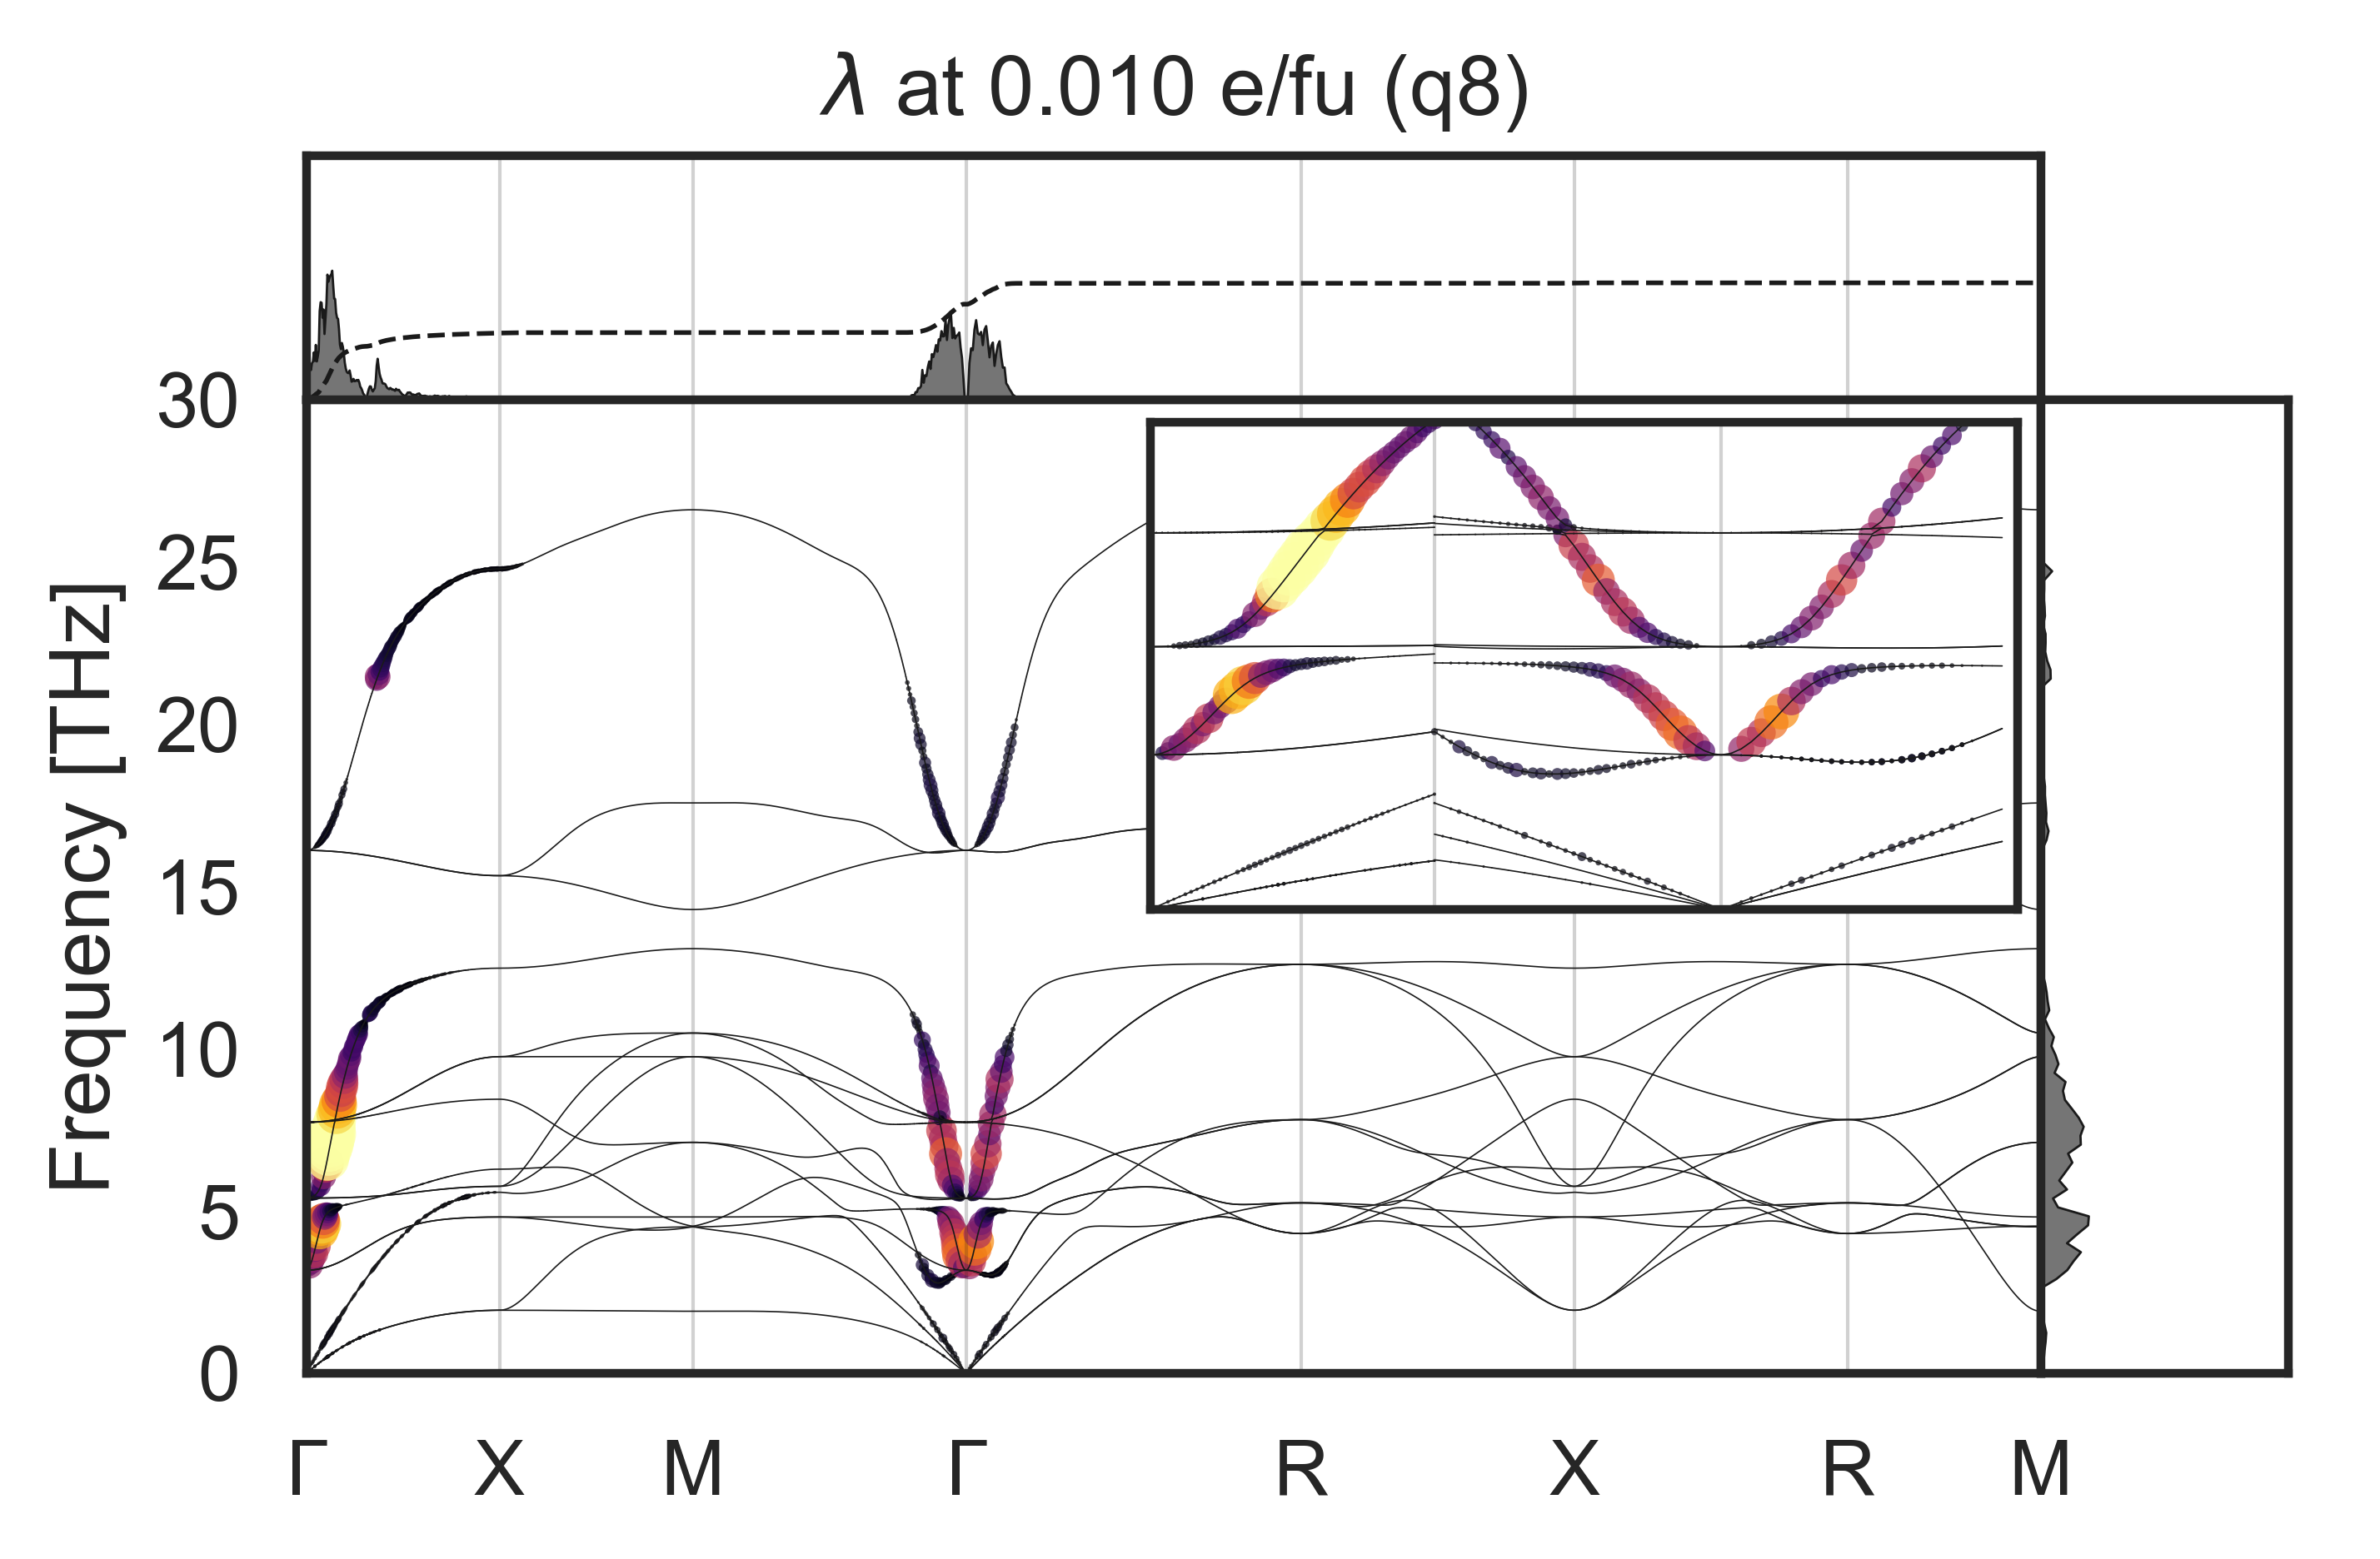
Our calculated mode-resolved electron-phonon coupling strengths at seven different doping levels, covering the experimental range, are shown in figure 2, along the high symmetry directions of the Brillouin zone, with integrated at each q point shown in the top part of each subplot, and integrated over frequency (decomposed into 100 frequency bins) shown on the right of each subplot.
There are several points to note. First, there are no imaginary frequencies, as the structural relaxation of KTO using the PBEsol functional results in a cubic unit cell with no structural instabilities. The frequency of the polar soft mode at , which can be imaginary using the PBE functional, is for the lowest doping value of , and hardens to at the highest doping value of . It has the strongest electron-phonon coupling strength throughout the whole doping range. Additionally, contributions to can be seen in the higher-energy optical modes around . The strong coupling of the electrons to the polar modes at the point suggests that the ferroelectric fluctuations associated with quantum paraelectricity could play a key role in the superconductivity in KTO, as already suggested for quantum paraelectric STO [28, 31, 24].
In the [110] ( to M) and [111] ( to R) directions, the electron-phonon coupling occurs only close to the point; here the optical phonons correspond to long-wavelength ferroelectric displacements. In the [001] -X direction, in contrast, the coupling, while strongest close to , remains present along the entire high-symmetry line, also at higher doping. This results also in a larger total contribution along the [001] direction than along [110] and [111]. We note that the form of in reciprocal space closely follows that of the Fermi surface, which at these doping levels is close to spherical except for elongations along the cartesian reciprocal axes reflecting the flat electronic bands along to X (see e.g. fig 3.3 of Ref. 54). As expected, at low doping, the electron-phonon coupling is limited largely to the lowest phonon frequencies, then extends to higher frequencies as the doping is increased and higher energy electronic bands are populated.
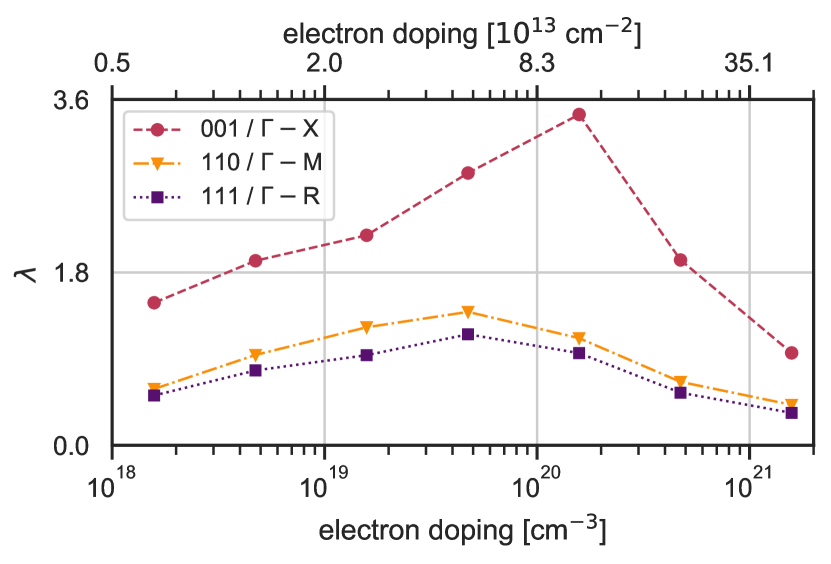
The calculated integrated values along the three high-symmetry directions, which we use as proxies for the total electron-phonon coupling strength in each reciprocal direction, are shown as a function of doping concentration in figure 3. In all directions in reciprocal space there is a dome-like structure in the calculated , with a smooth maximum between () for the [110] and [111] directions. The more pronounced peak around in the [001] direction coincides with the electron doping reaching the X point of the phonon band structure, as can also be seen in the third row of figure 2.
If KTO were a conventional BCS-theory superconductor, we would expect the critical temperatures of figure 1 to follow roughly the electron-phonon coupling strength of figure 3. Comparing those two figures, it is clear that there is no obvious correlation. First, the experimental data do not show such a dome-like trend, with the (111) surfaces/interfaces in particular showing a linear increase of Tc with increasing doping. Second, while experimentally the highest Tc is observed for the (111) surfaces/interfaces, and the Tc for the (001) surfaces/interfaces is very low, the electron-phonon coupling is strongest for the [001] direction, and weakest for the [111] direction.
Influence of spin-orbit coupling and polar symmetry breaking
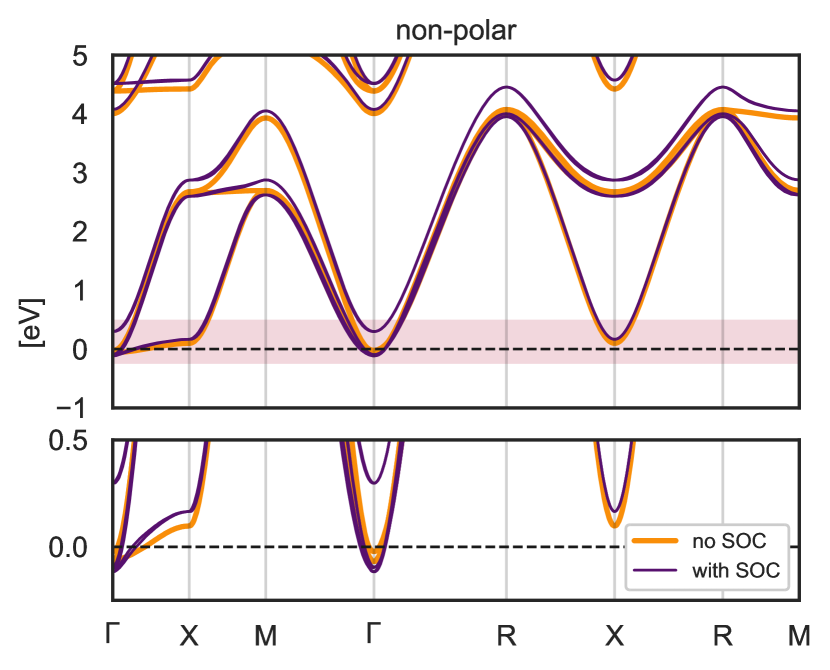
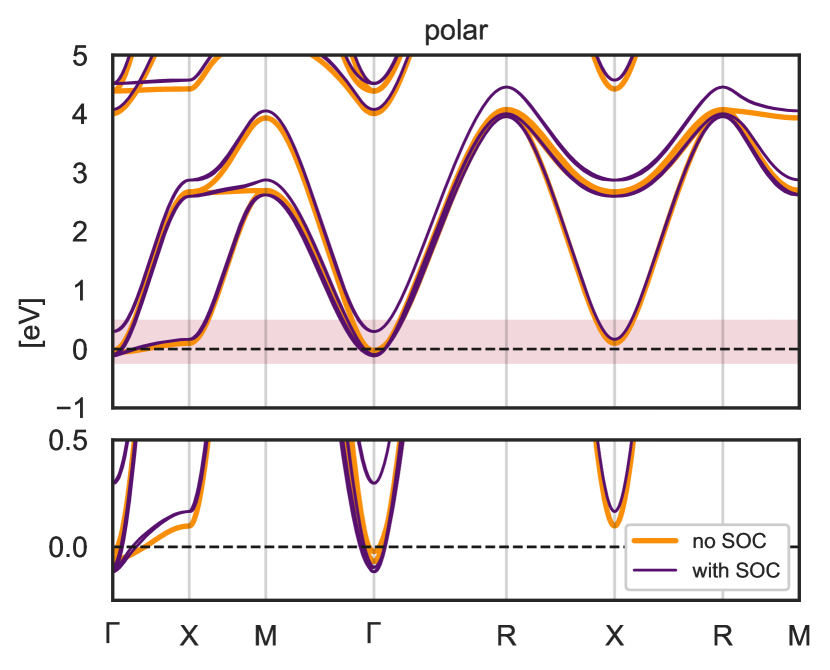
Finally, to determine the influence of spin-orbit coupling and polar structural distortions, we present in figure 4 our calculated mode-resolved for both non-polar and [111]-polarized KTO with and without spin-orbit coupling (SOC). (The influence of SOC on the electronic bands is shown in figure A4.) The polar structure is obtained by increasing the cubic lattice constant to and relaxing the internal coordinates; the soft mode frequency is then close to that of the original cubic structure ().
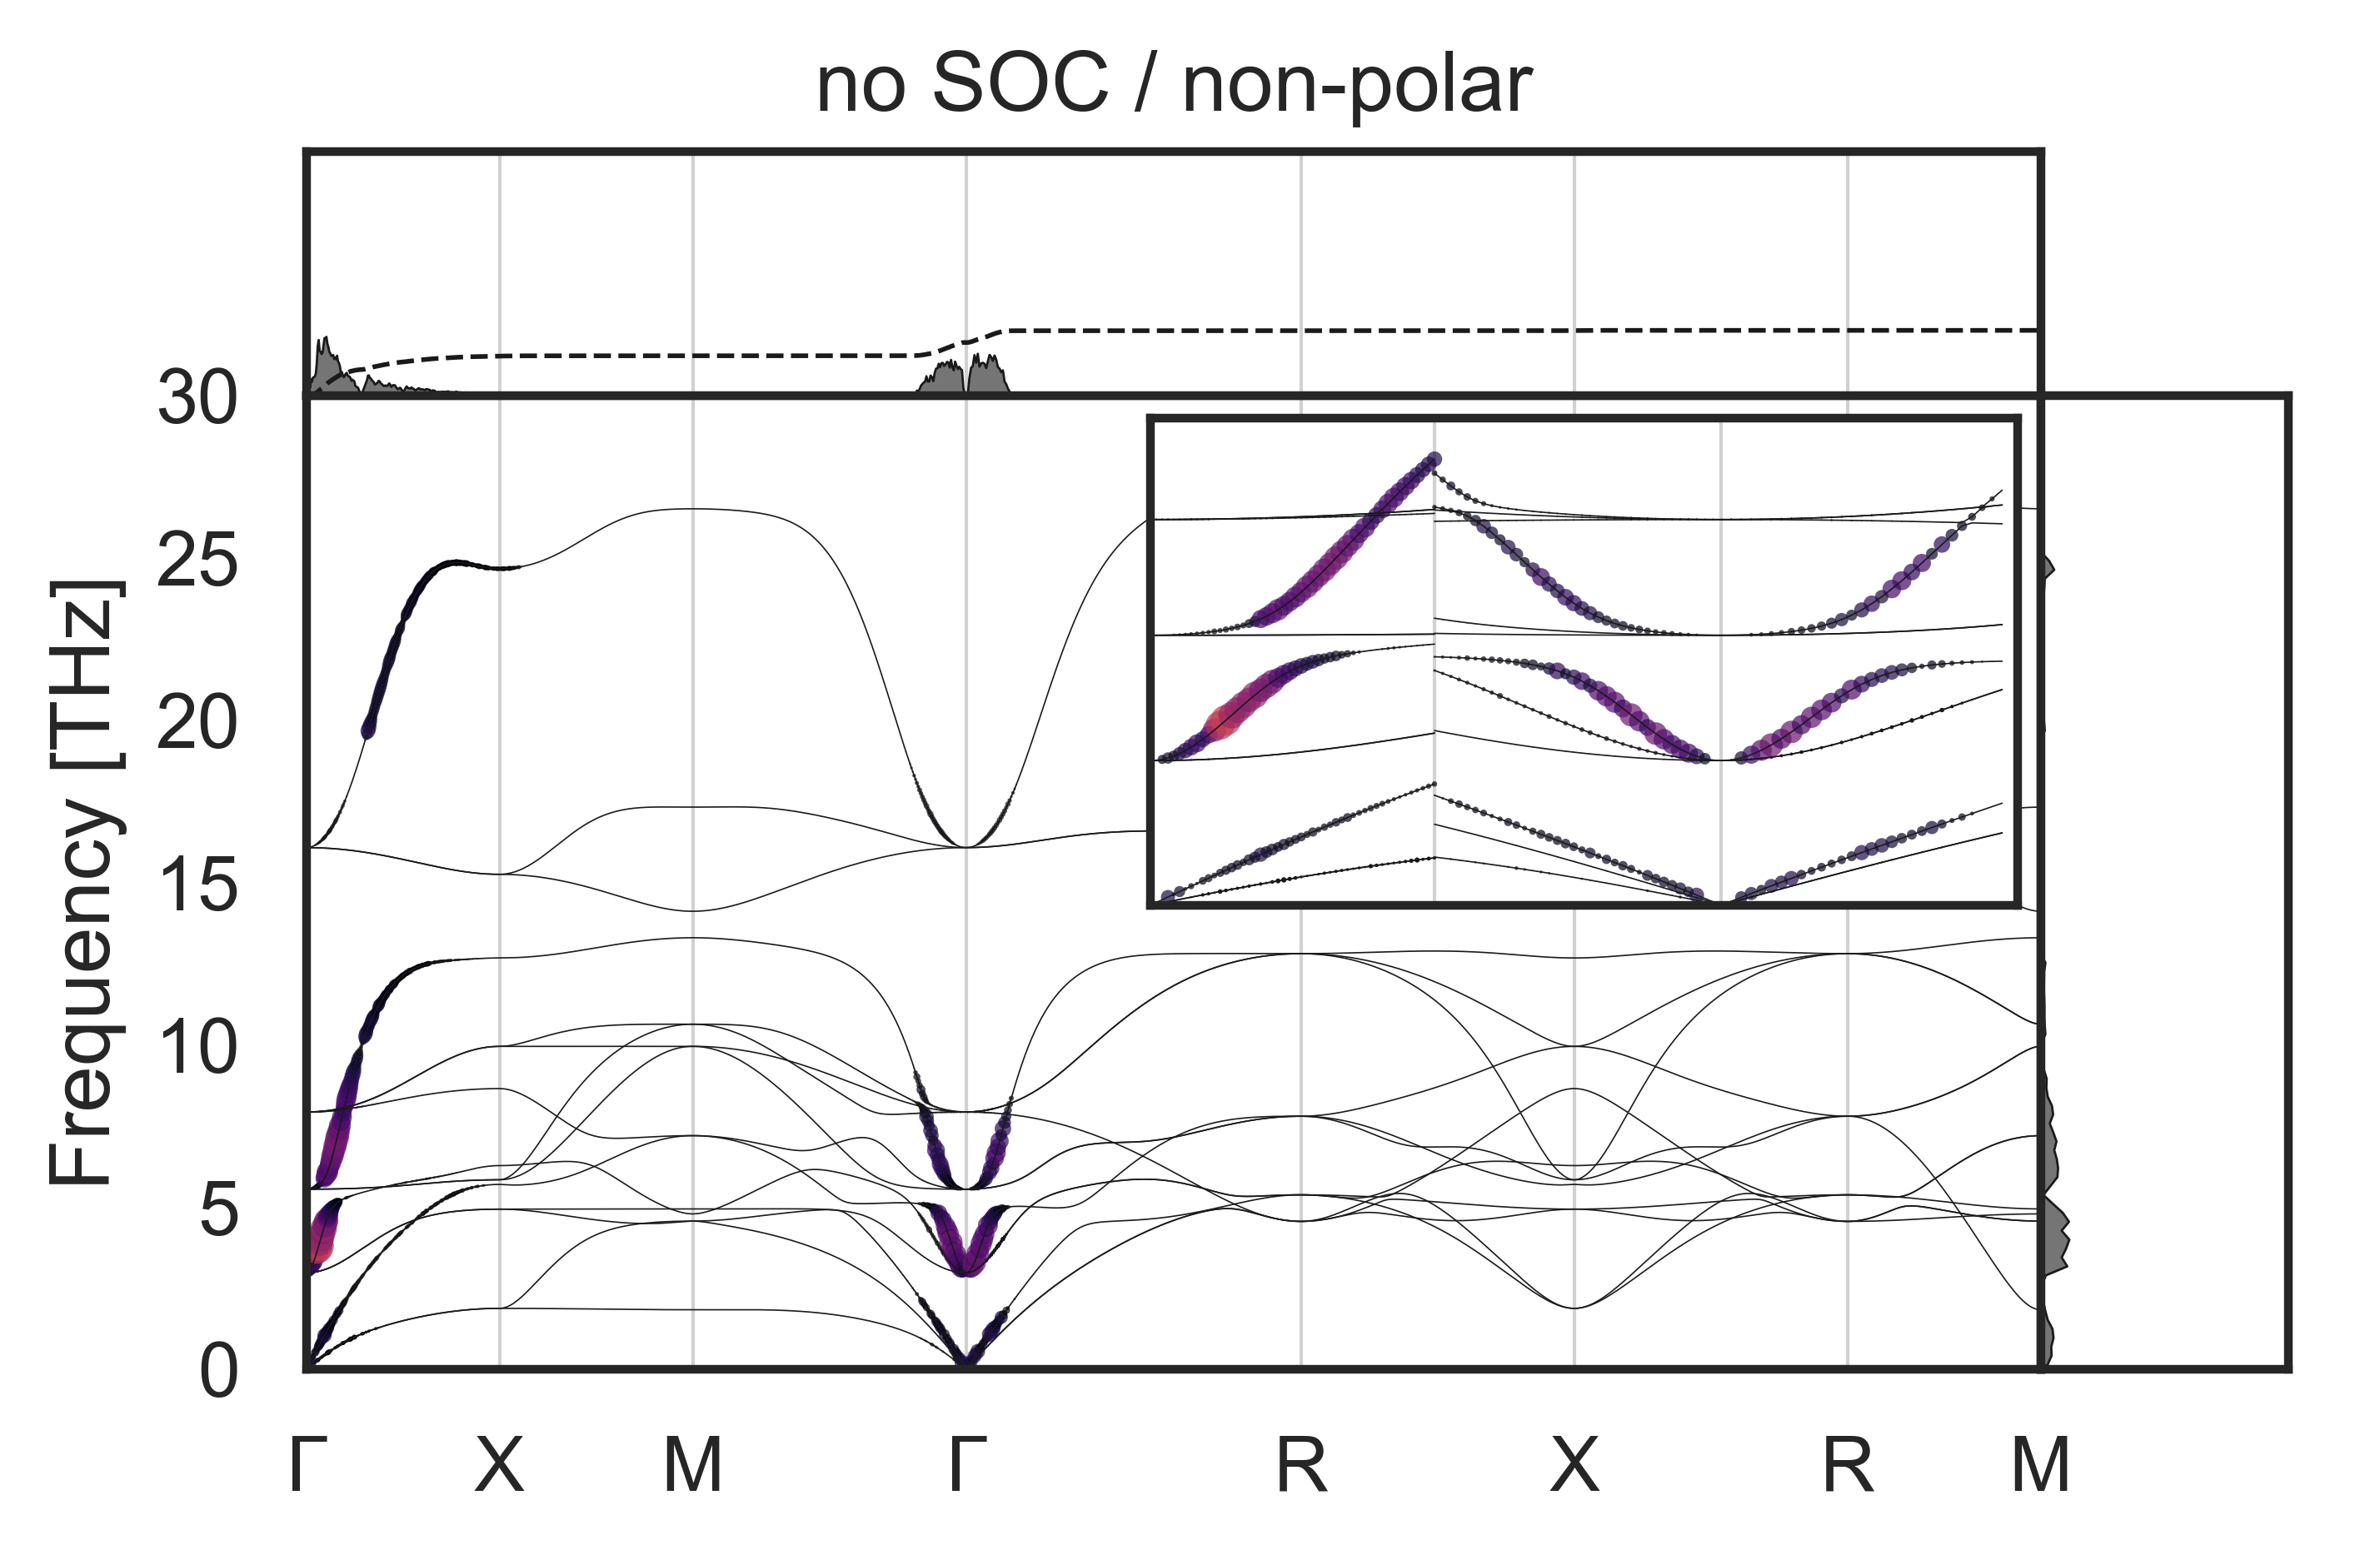
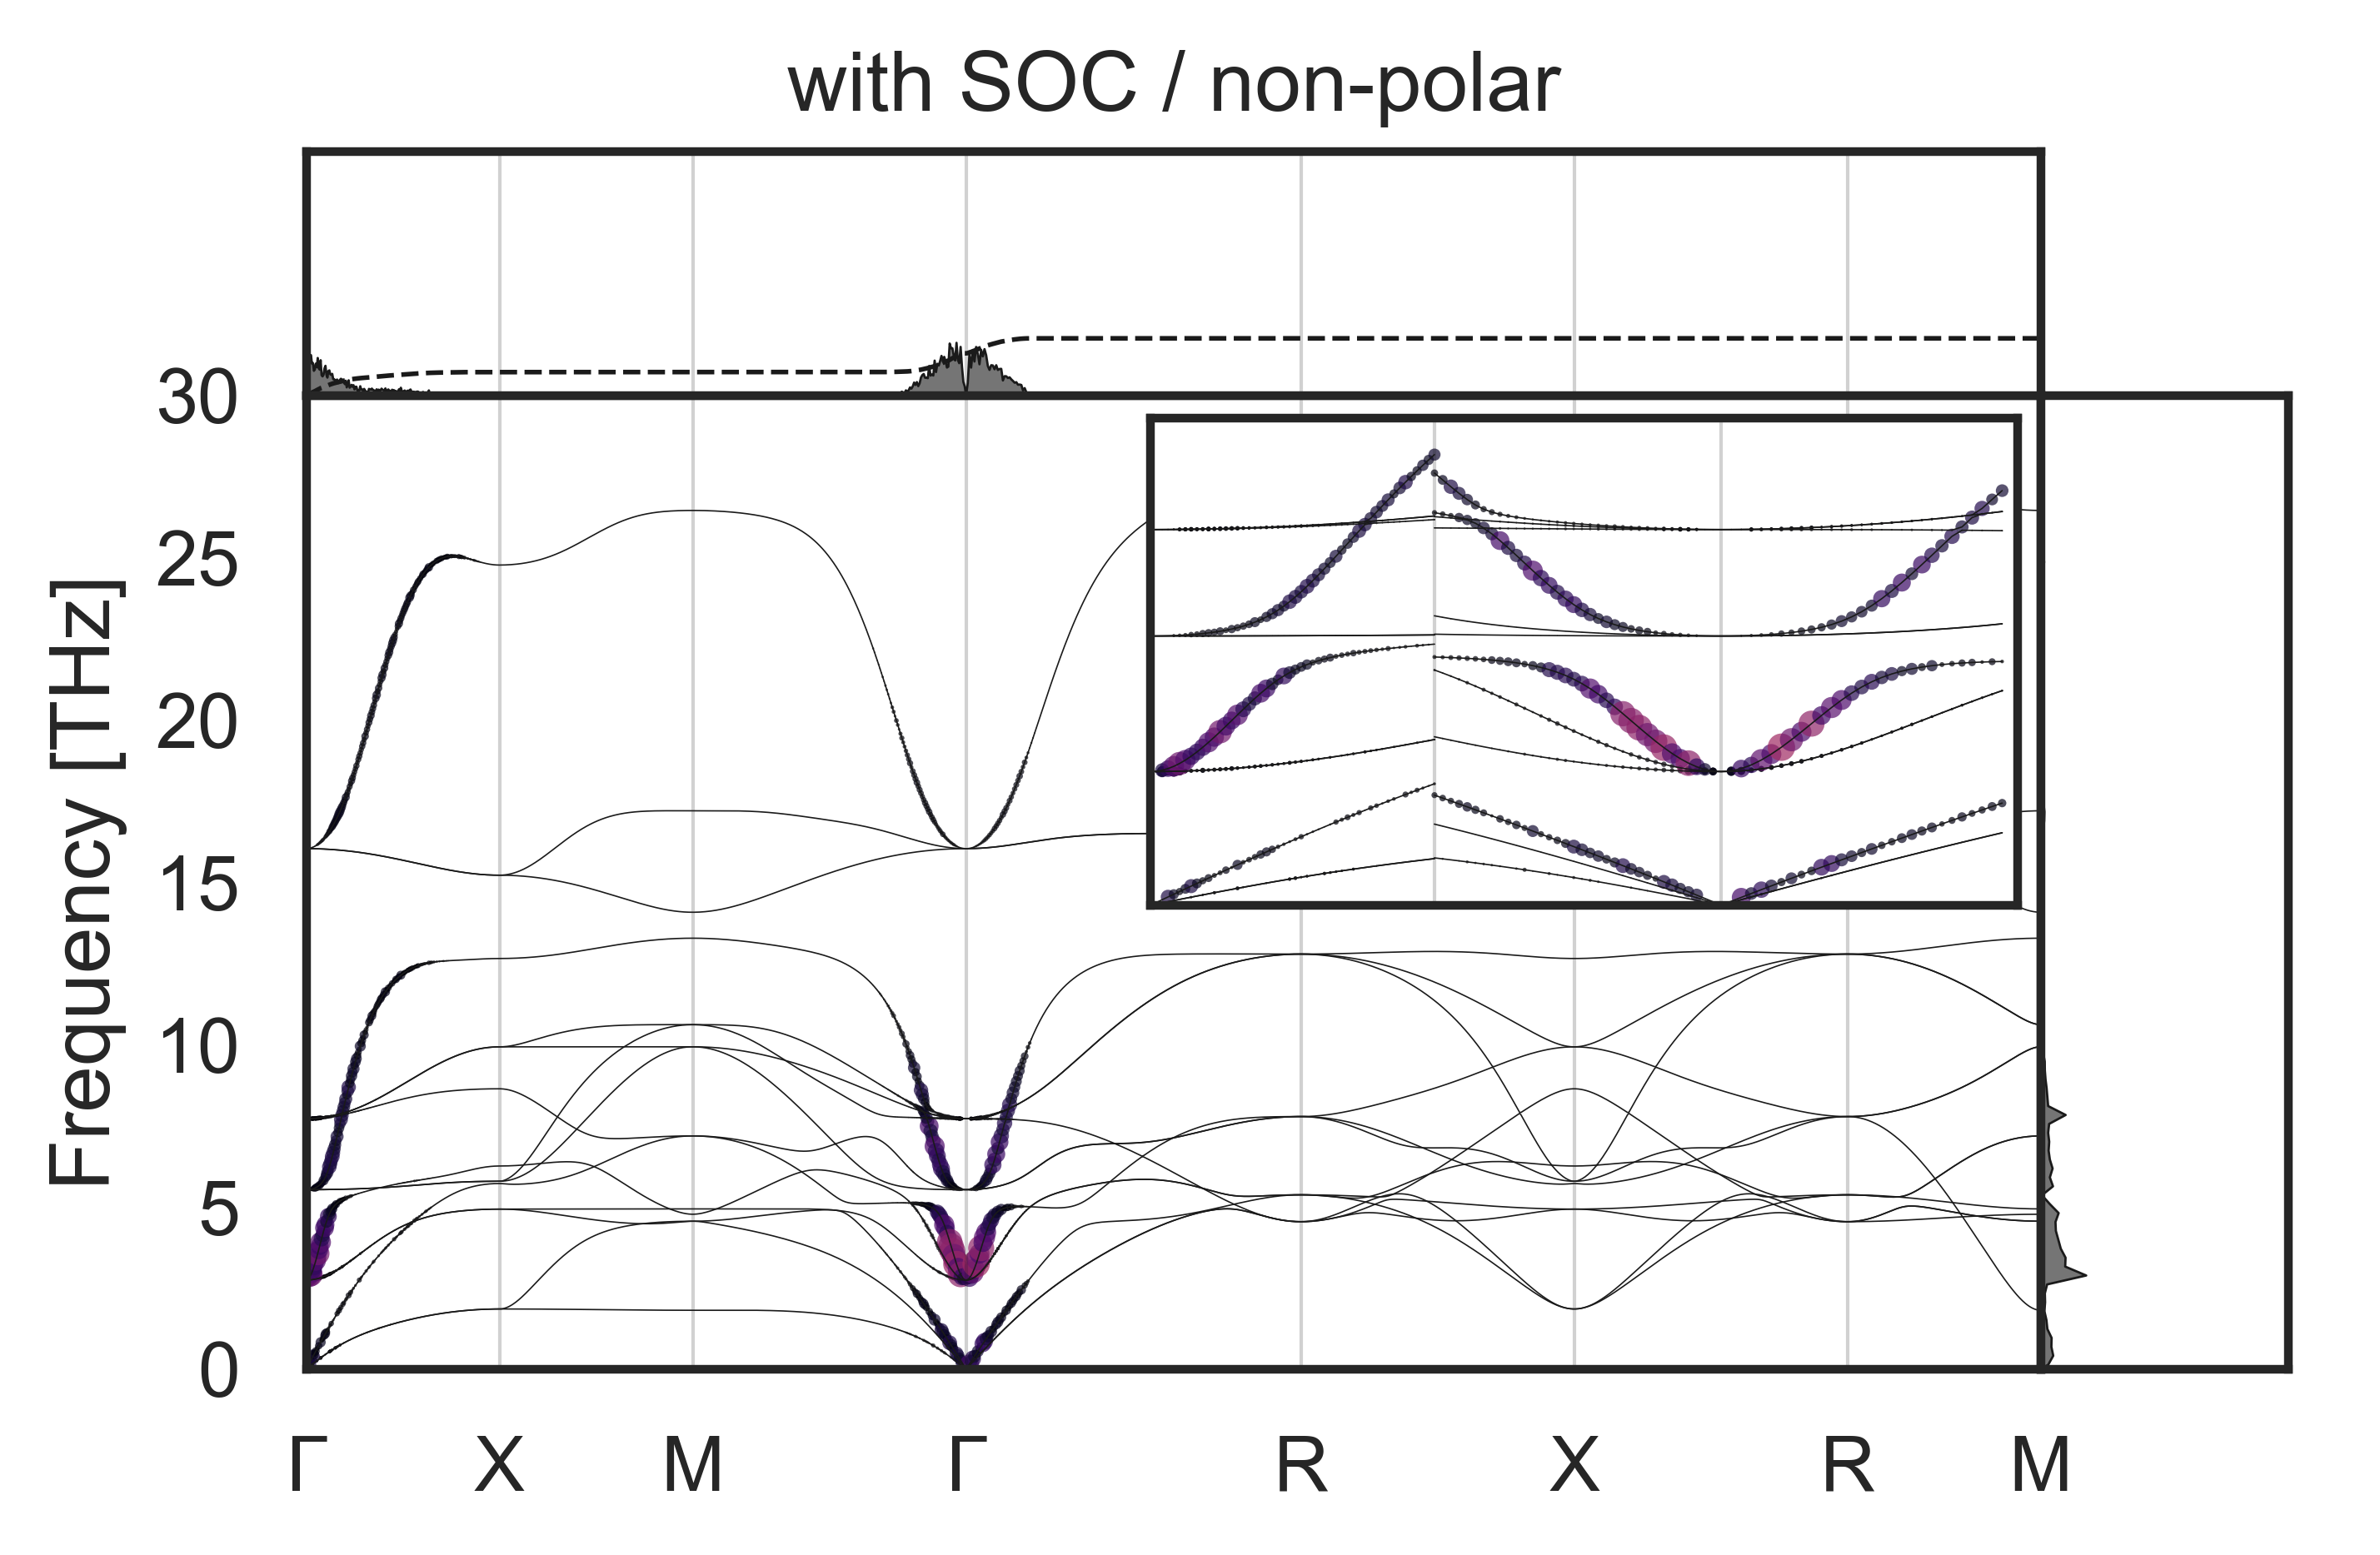
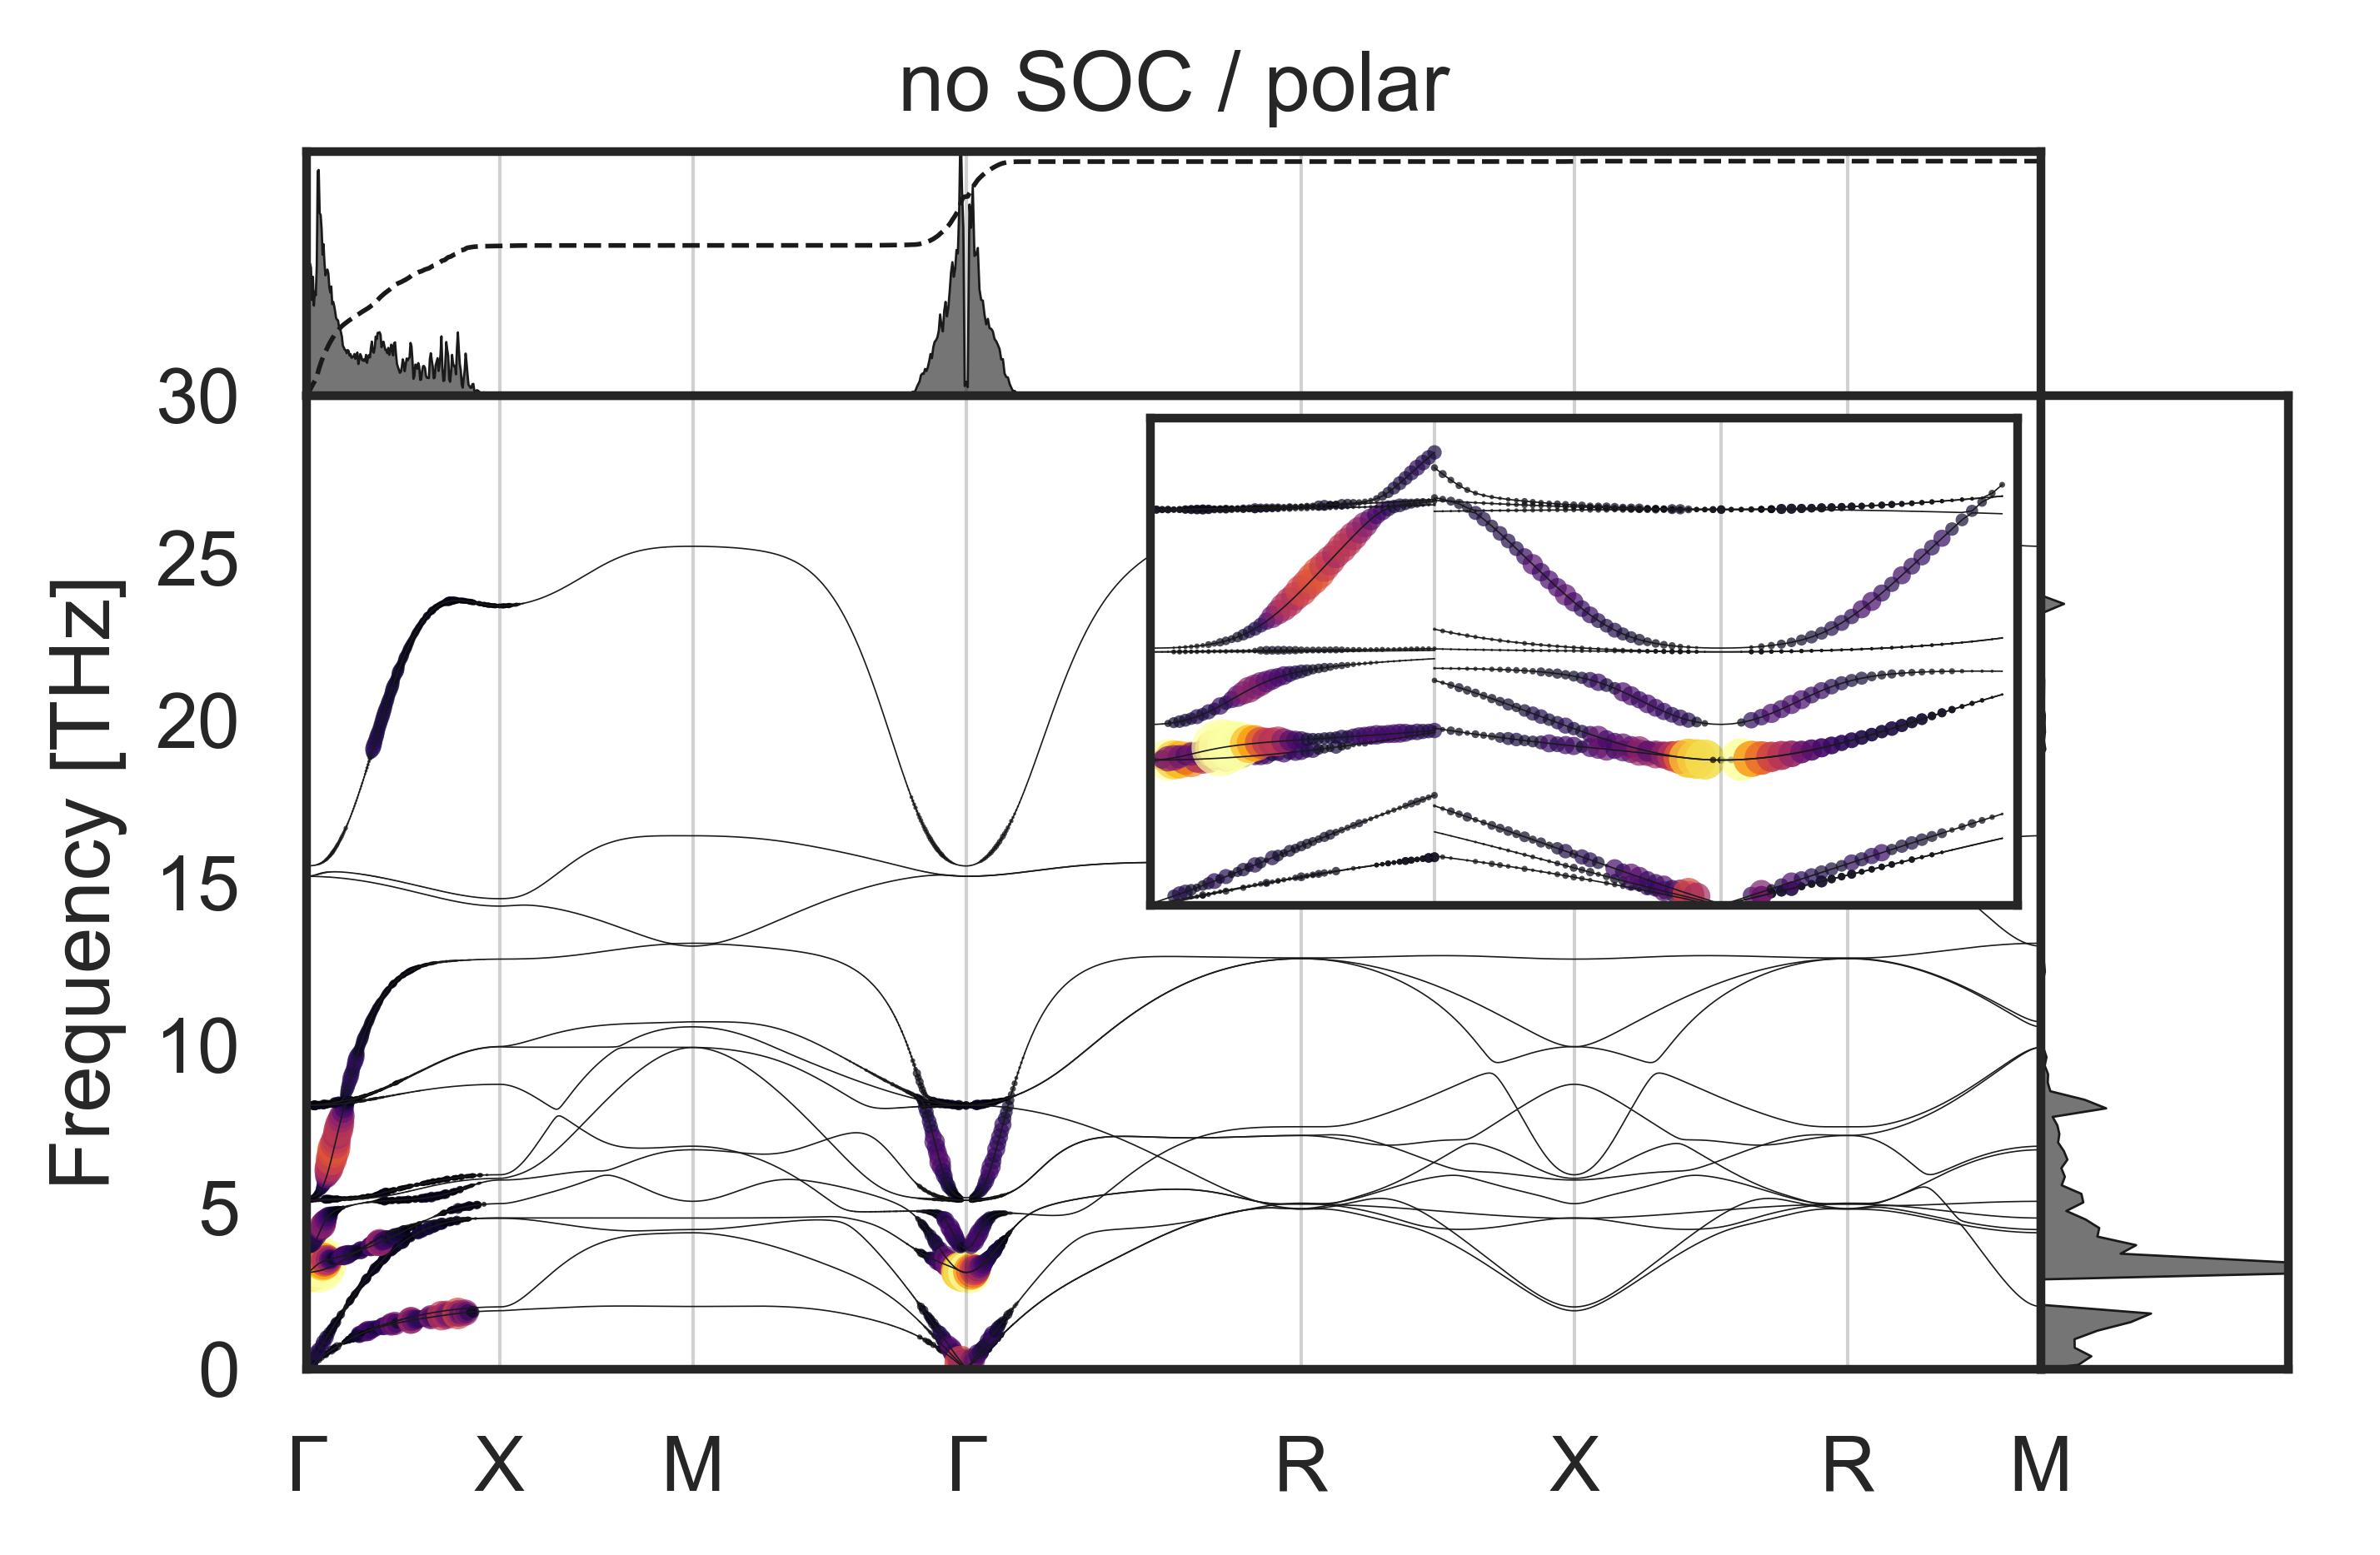
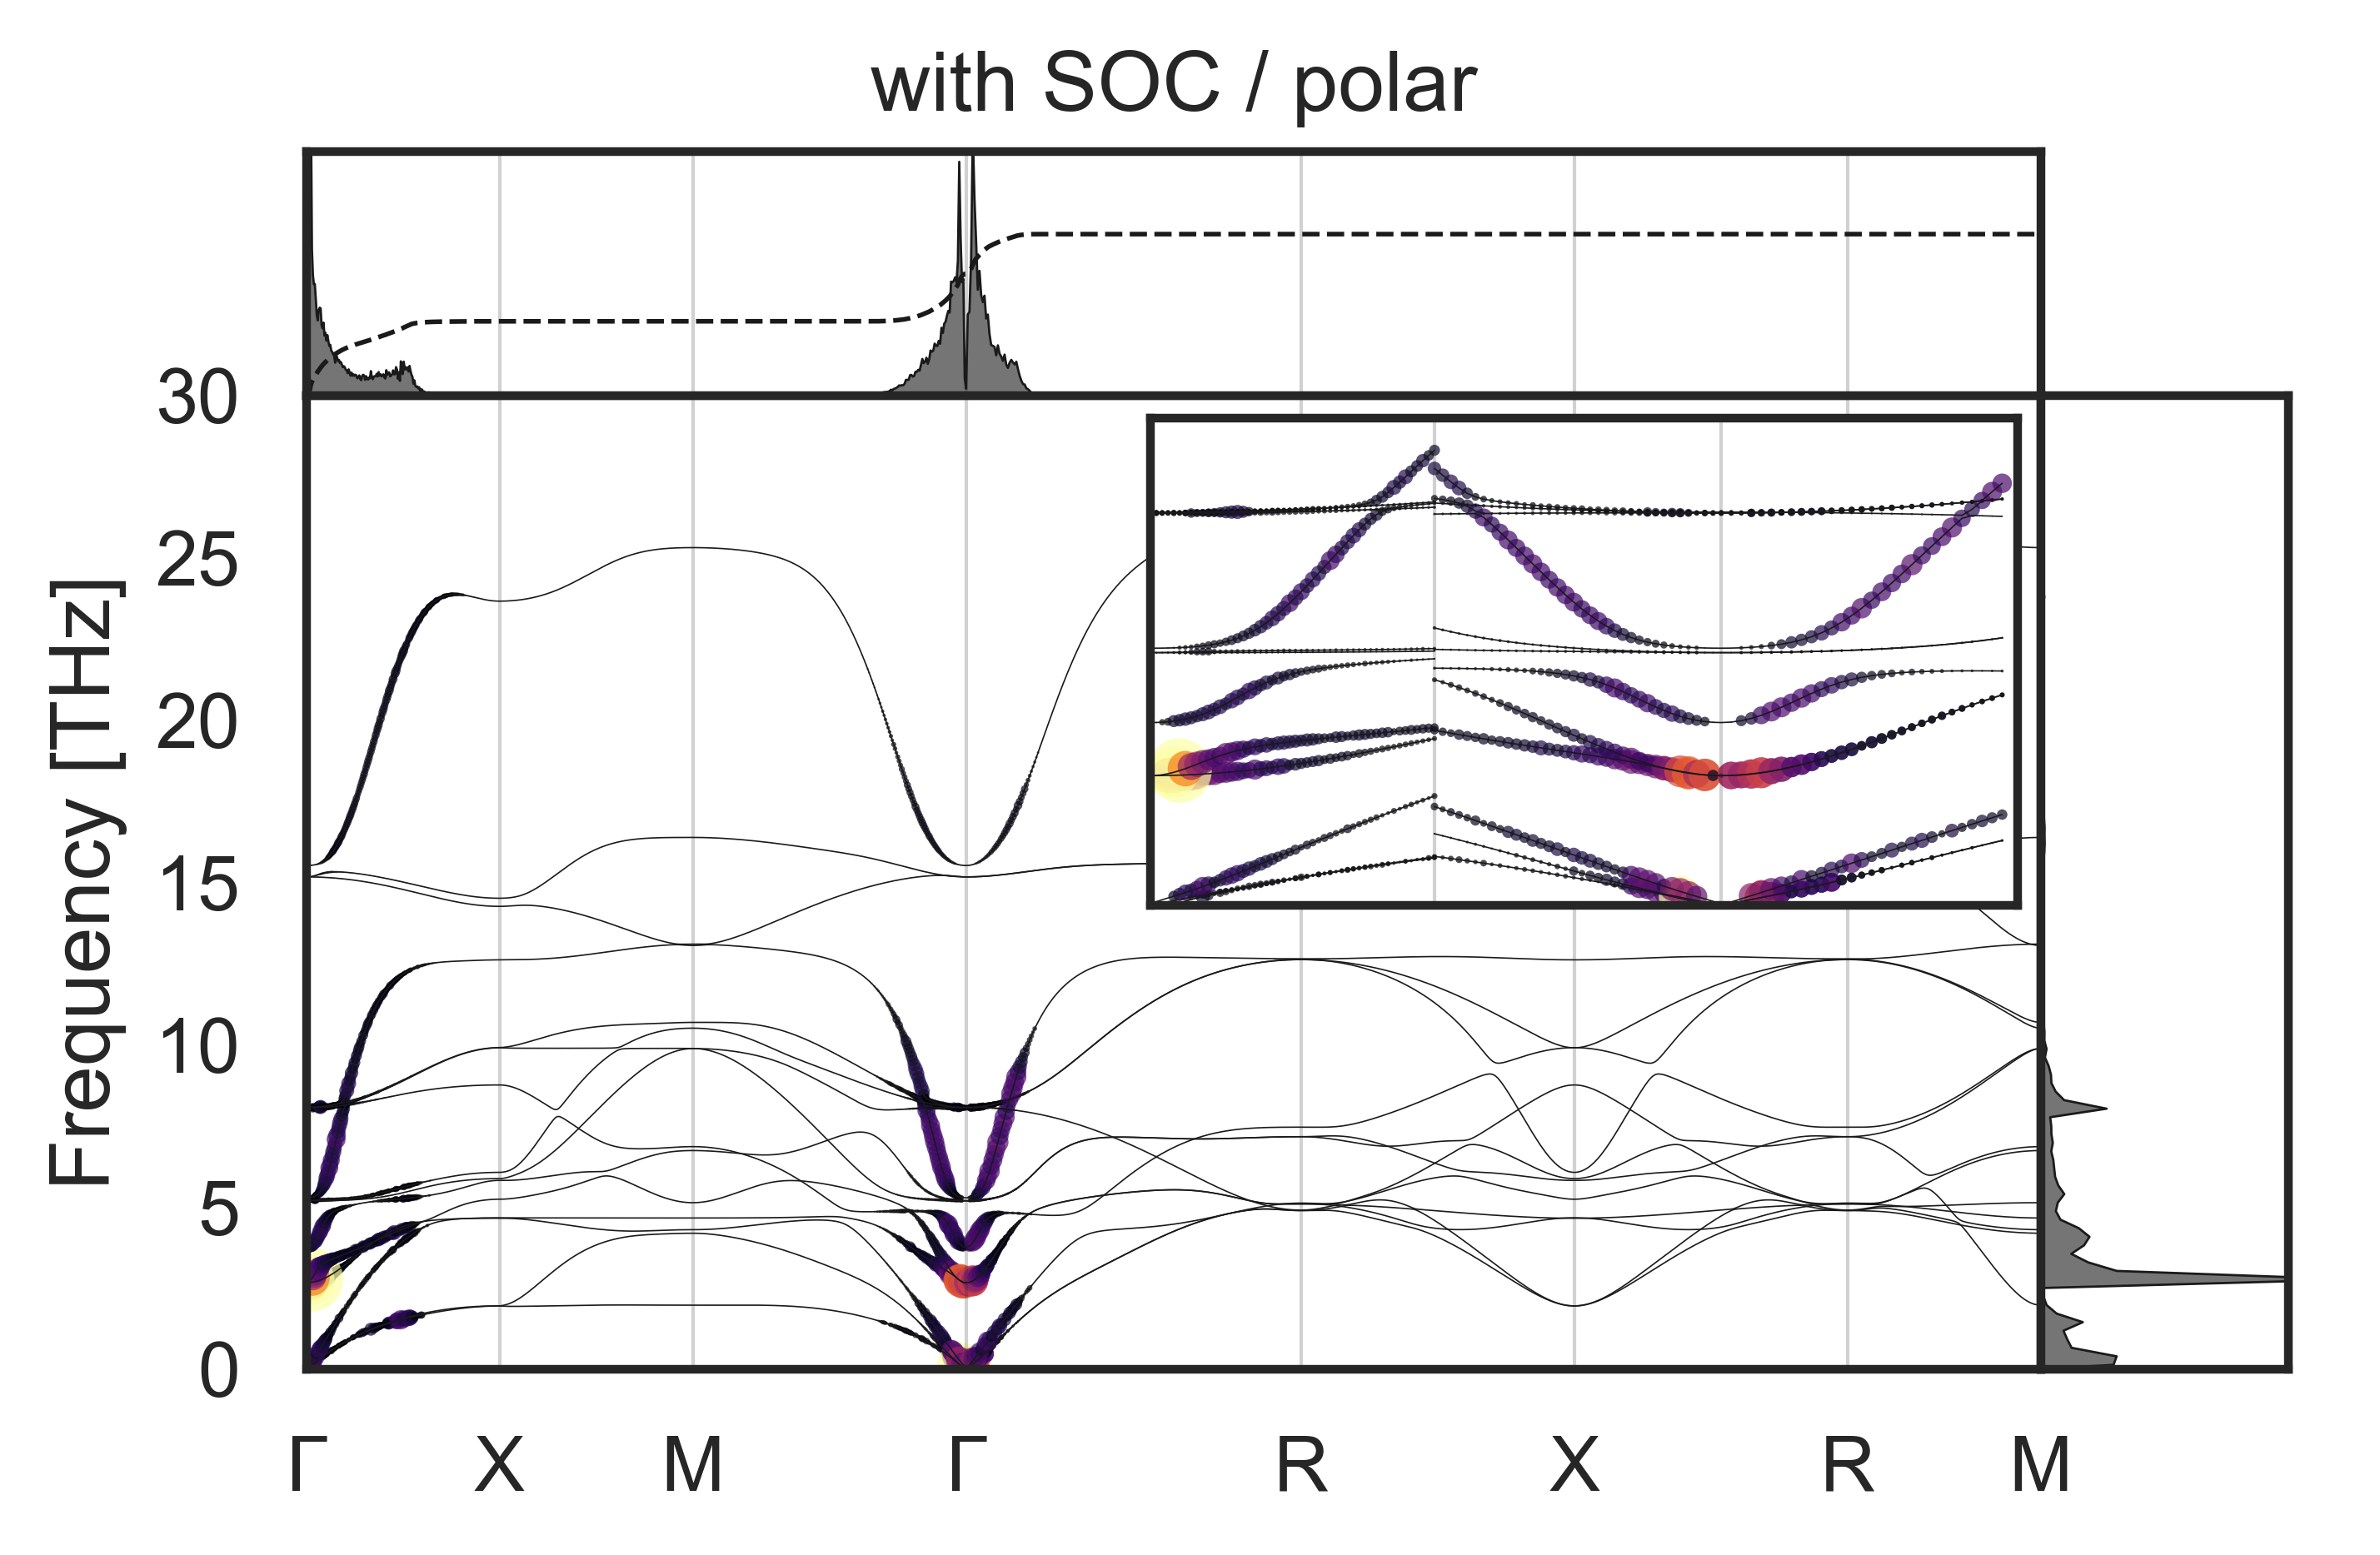
First we compare the results with and without SOC in the cubic structures (top row) 111Note the small difference between the ‘no SOC/non-polar’ panel of fig. 4 and the corresponding ‘ at 0.010 e/fu’ panel of fig. 2. The difference arises from the fact that for fig. 4 we calculated everything using scalar-relativistic pslibrary pseudopotentials to make it directly comparable to the SOC results which we obtained using fully-relativistic pslibrary pseudopotentials. and see that the differences are negligible. In contrast, the differences between the non-polar and polar structures (down the columns) are substantial. First, the integrated values of in the polar structures are larger by a factor of around five than the non-polar values. Second, the lowest energy branches of the soft TO modes around , which had negligible electron-phonon coupling in the cubic structures, are now among the main contributors to . Third, coupling along the -X direction is enhanced by the polar distortion, especially in the polar case without SOC. Note that in the polar case, spin-orbit coupling slightly reduces the values.
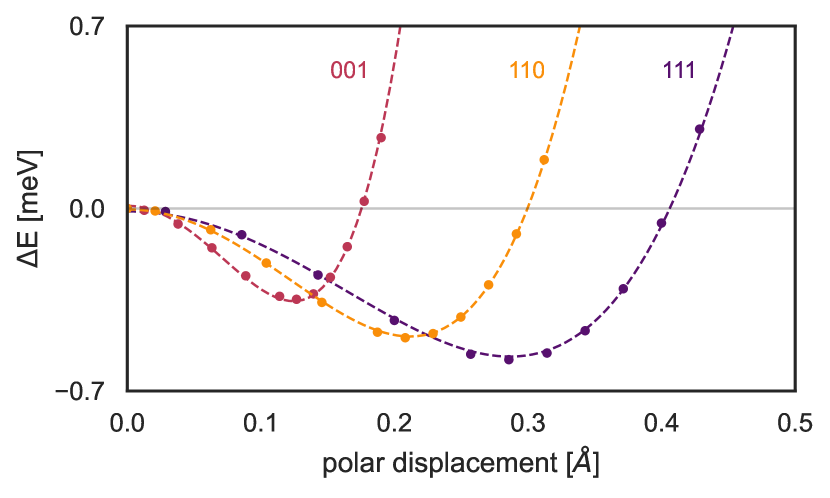
The fact that the polar symmetry breaking has such a large calculated effect on is consistent with recent reports of polar symmetry breaking coexisting with superconductivity in STO [56, 57, 57] and theories of coupling to polar modes in KTO [58]. Note that the tendency of KTO to become polar is strongest along the [111] direction, and weakest along the [001] direction, as shown in figure 5. This trend is consistent with that of the measured Tc, again pointing to a possible relevance of the ferroelectric soft mode.
IV Summary
In summary, we have calculated the electron-phonon coupling in KTaO3 for electron dopings between and and analyzed the results in light of the recently reported superconductivity and its surface dependence. Our calculations indicate that the measured trends in superconducting Tc are not reflected in the calculated electron-phonon coupling strengths along the corresponding reciprocal directions, confirming earlier suggestions that the superconductivity is not bulk BCS-like in nature [7, 17, 20, 59]. In this context, recent angle-resolved photoemission spectroscopy measurements implicating coupling of bulk-like electrons to Fuchs-Kliewer surface phonons are highly relevant [60]. The concentration of in the lowest frequency optical modes close to hints towards a mechanism in which the polar soft mode plays a role. A comparison of the mode-resolved values between non-polar and polar structures shows clearly that polarization strongly enhances the electron-phonon coupling. In contrast, a comparison of mode-resolved values between calculations without and with spin-orbit coupling shows negligible difference.
V Acknowledgments
The authors acknowledge helpful discussions with Jose Lorenzana, Manuel Bibes and Michael Fechner. This work was funded by the European Research Council under the European Union’s Horizon 2020 Research and Innovation Program, grant agreement no. 810451. Computational resources were provided by ETH Zurich and the Swiss National Supercomputing Center (CSCS) under project ID s1128.
VI Data availability
All input data are available on the materialscloud archive at DOI: 10.24435/materialscloud:sn-xs .
References
- Barrett [1952] J. H. Barrett, Phys. Rev. 86, 118 (1952).
- Uwe et al. [1980] H. Uwe, K. Oka, H. Unoki, and T. Sakudo, J. Phys. Soc. Jpn. 49, 577 (1980).
- Stengel [2011] M. Stengel, Phys. Rev. B 84, 205432 (2011).
- Mattheiss [1972] L. F. Mattheiss, Phys. Rev. B 6, 4718 (1972).
- Nakamura and Kimura [2009] H. Nakamura and T. Kimura, Phys. Rev. B 80, 121308 (2009).
- Gupta et al. [2022] A. Gupta, H. Silotia, A. Kumari, M. Dumen, S. Goyal, R. Tomar, N. Wadehra, P. Ayyub, and S. Chakraverty, Adv. Mater. 34, 2106481 (2022).
- Rowley et al. [2014] S. E. Rowley, L. J. Spalek, R. P. Smith, M. P. M. Dean, M. Itoh, J. F. Scott, G. G. Lonzarich, and S. S. Saxena, Nat. Phys. 10, 367 (2014).
- Müller and Burkard [1979] K. A. Müller and H. Burkard, Phys. Rev. B 19, 3593 (1979).
- Tao and Wang [2016] L. L. Tao and J. Wang, J. Appl. Phys. 120, 234101 (2016).
- Gastiasoro et al. [2022a] M. N. Gastiasoro, M. E. Temperini, P. Barone, and J. Lorenzana, Generalized Rashba Electron-Phonon Coupling and Superconductivity in Strontium Titanate (2022a), arXiv:2210.05753 [cond-mat] .
- Gattinoni and Spaldin [2022] C. Gattinoni and N. A. Spaldin, Phys. Rev. Research 4, L032020 (2022).
- King et al. [2012] P. D. C. King, R. H. He, T. Eknapakul, P. Buaphet, S.-K. Mo, Y. Kaneko, S. Harashima, Y. Hikita, M. S. Bahramy, C. Bell, Z. Hussain, Y. Tokura, Z.-X. Shen, H. Y. Hwang, F. Baumberger, and W. Meevasana, Phys. Rev. Lett. 108, 117602 (2012).
- Santander-Syro et al. [2012] A. F. Santander-Syro, C. Bareille, F. Fortuna, O. Copie, M. Gabay, F. Bertran, A. Taleb-Ibrahimi, P. Le Fèvre, G. Herranz, N. Reyren, M. Bibes, A. Barthélémy, P. Lecoeur, J. Guevara, and M. J. Rozenberg, Phys. Rev. B 86, 121107 (2012).
- Reticcioli et al. [2022] M. Reticcioli, Z. Wang, M. Schmid, D. Wrana, L. A. Boatner, U. Diebold, M. Setvin, and C. Franchini, Nat. Commun. 13, 4311 (2022).
- Setvin et al. [2018] M. Setvin, M. Reticcioli, F. Poelzleitner, J. Hulva, M. Schmid, L. A. Boatner, C. Franchini, and U. Diebold, Science 359, 572 (2018).
- Ueno et al. [2011] K. Ueno, S. Nakamura, H. Shimotani, H. T. Yuan, N. Kimura, T. Nojima, H. Aoki, Y. Iwasa, and M. Kawasaki, Nat. Nano. 6, 408 (2011).
- Ueno et al. [2014] K. Ueno, H. Shimotani, H. Yuan, J. Ye, M. Kawasaki, and Y. Iwasa, J. Phys. Soc. Jpn. 83, 032001 (2014).
- Sakai et al. [2009] A. Sakai, T. Kanno, S. Yotsuhashi, H. Adachi, and Y. Tokura, Jpn. J. Appl. Phys. 48, 097002 (2009).
- Chen et al. [2021] Z. Chen, Z. Liu, Y. Sun, X. Chen, Y. Liu, H. Zhang, H. Li, M. Zhang, S. Hong, T. Ren, C. Zhang, H. Tian, Y. Zhou, J. Sun, and Y. Xie, Phys. Rev. Lett. 126, 026802 (2021).
- Liu et al. [2021] C. Liu, X. Yan, D. Jin, Y. Ma, H.-W. Hsiao, Y. Lin, T. M. Bretz-Sullivan, X. Zhou, J. Pearson, B. Fisher, J. S. Jiang, W. Han, J.-M. Zuo, J. Wen, D. D. Fong, J. Sun, H. Zhou, and A. Bhattacharya, Science 371, 716 (2021).
- Ren et al. [2022] T. Ren, M. Li, X. Sun, L. Ju, Y. Liu, S. Hong, Y. Sun, Q. Tao, Y. Zhou, Z.-A. Xu, and Y. Xie, ArXiv220100990 Cond-Mat (2022), arXiv:2201.00990 [cond-mat] .
- Schooley et al. [1964] J. F. Schooley, W. R. Hosler, and M. L. Cohen, Phys. Rev. Lett. 12, 474 (1964).
- Schooley et al. [1965] J. F. Schooley, W. R. Hosler, E. Ambler, J. H. Becker, M. L. Cohen, and C. S. Koonce, Phys. Rev. Lett. 14, 305 (1965).
- Gastiasoro et al. [2020a] M. N. Gastiasoro, J. Ruhman, and R. M. Fernandes, Ann. Phys. (N. Y.) 417, 168107 (2020a).
- Stucky et al. [2016] A. Stucky, G. W. Scheerer, Z. Ren, D. Jaccard, J.-M. Poumirol, C. Barreteau, E. Giannini, and D. van der Marel, Sci. Rep. 6, 37582 (2016).
- Bardeen et al. [1957a] J. Bardeen, L. N. Cooper, and J. R. Schrieffer, Phys. Rev. 106, 162 (1957a).
- Bardeen et al. [1957b] J. Bardeen, L. N. Cooper, and J. R. Schrieffer, Phys. Rev. 108, 1175 (1957b).
- Edge et al. [2015] J. M. Edge, Y. Kedem, U. Aschauer, N. A. Spaldin, and A. V. Balatsky, Phys. Rev. Lett. 115, 247002 (2015).
- Ruhman and Lee [2016] J. Ruhman and P. A. Lee, Phys. Rev. B 94, 224515 (2016).
- Coak et al. [2019] M. J. Coak, C. R. S. Haines, C. Liu, G. G. Guzmán-Verri, and S. S. Saxena, Phys. Rev. B 100, 214111 (2019).
- van der Marel et al. [2019] D. van der Marel, F. Barantani, and C. W. Rischau, Phys. Rev. Research 1, 013003 (2019).
- Gastiasoro et al. [2020b] M. N. Gastiasoro, T. V. Trevisan, and R. M. Fernandes, Phys. Rev. B 101, 174501 (2020b).
- Gastiasoro et al. [2022b] M. N. Gastiasoro, M. E. Temperini, P. Barone, and J. Lorenzana, Phys. Rev. B 105, 224503 (2022b).
- Kozii and Fu [2015] V. Kozii and L. Fu, Phys. Rev. Lett. 115, 207002 (2015).
- Kanasugi and Yanase [2018] S. Kanasugi and Y. Yanase, Phys. Rev. B 98, 024521 (2018).
- Kanasugi and Yanase [2019] S. Kanasugi and Y. Yanase, Phys. Rev. B 100, 094504 (2019).
- Kozii et al. [2019] V. Kozii, Z. Bi, and J. Ruhman, Phys. Rev. X 9, 031046 (2019).
- Yu et al. [2022] Y. Yu, H. Y. Hwang, S. Raghu, and S. B. Chung, npj Quantum Mater. 7, 63 (2022).
- Liu et al. [2022] C. Liu, X. Zhou, D. Hong, B. Fisher, H. Zheng, J. Pearson, D. Jin, M. R. Norman, and A. Bhattacharya, Tunable superconductivity at the oxide-insulator/ktao3 interface and its origin (2022), arXiv:2203.05867 [cond-mat] .
- Mallik et al. [2022] S. Mallik, G. C. Ménard, G. Saïz, H. Witt, J. Lesueur, A. Gloter, L. Benfatto, M. Bibes, and N. Bergeal, Nat Commun 13, 4625 (2022).
- Zhou et al. [2018] J.-J. Zhou, O. Hellman, and M. Bernardi, Phys. Rev. Lett. 121, 226603 (2018).
- Giannozzi et al. [2009] P. Giannozzi, S. Baroni, N. Bonini, M. Calandra, R. Car, C. Cavazzoni, Davide Ceresoli, G. L. Chiarotti, M. Cococcioni, I. Dabo, A. D. Corso, S. de Gironcoli, S. Fabris, G. Fratesi, R. Gebauer, U. Gerstmann, C. Gougoussis, Anton Kokalj, M. Lazzeri, L. Martin-Samos, N. Marzari, F. Mauri, R. Mazzarello, Stefano Paolini, A. Pasquarello, L. Paulatto, C. Sbraccia, S. Scandolo, G. Sclauzero, A. P. Seitsonen, A. Smogunov, P. Umari, and R. M. Wentzcovitch, J. Phys. Condens. Matter 21, 395502 (2009).
- Giannozzi et al. [2017] P. Giannozzi, O. Andreussi, T. Brumme, O. Bunau, M. B. Nardelli, M. Calandra, R. Car, C. Cavazzoni, D. Ceresoli, M. Cococcioni, N. Colonna, I. Carnimeo, A. D. Corso, S. de Gironcoli, P. Delugas, R. A. DiStasio, A. Ferretti, A. Floris, G. Fratesi, G. Fugallo, R. Gebauer, U. Gerstmann, F. Giustino, T. Gorni, J. Jia, M. Kawamura, H.-Y. Ko, A. Kokalj, E. Küçükbenli, M. Lazzeri, M. Marsili, N. Marzari, F. Mauri, N. L. Nguyen, H.-V. Nguyen, A. Otero-de-la-Roza, L. Paulatto, S. Poncé, D. Rocca, R. Sabatini, B. Santra, M. Schlipf, A. P. Seitsonen, A. Smogunov, I. Timrov, T. Thonhauser, P. Umari, N. Vast, X. Wu, and S. Baroni, J. Phys. Condens. Matter 29, 465901 (2017).
- Giannozzi et al. [2020] P. Giannozzi, O. Baseggio, P. Bonfà, D. Brunato, R. Car, I. Carnimeo, C. Cavazzoni, S. de Gironcoli, P. Delugas, F. Ferrari Ruffino, A. Ferretti, N. Marzari, I. Timrov, A. Urru, and S. Baroni, J. Chem. Phys. 152, 154105 (2020).
- Perdew et al. [2008] J. P. Perdew, A. Ruzsinszky, G. I. Csonka, O. A. Vydrov, G. E. Scuseria, L. A. Constantin, X. Zhou, and K. Burke, Phys. Rev. Lett. 100, 136406 (2008).
- Garrity et al. [2014] K. F. Garrity, J. W. Bennett, K. M. Rabe, and D. Vanderbilt, Comput. Mater. Sci. 81, 446 (2014).
- Garrity et al. [2019] K. F. Garrity, J. W. Bennett, K. M. Rabe, and D. Vanderbilt, GBRV pseudopotentials, https://www.physics.rutgers.edu/gbrv/ (2019).
- Dal Corso [2014] A. Dal Corso, Computational Materials Science 95, 337 (2014).
- Wemple [1965] S. H. Wemple, Phys. Rev. 137, A1575 (1965).
- Meier et al. [2022] Q. N. Meier, N. Mingo, and A. van Roekeghem, Finite temperature dielectric properties of ktao3 from first principles and machine learning: Phonon spectra, barrett law, strain engineering and electrostriction (2022), arXiv:2206.08296 [cond-mat] .
- Giustino et al. [2007] F. Giustino, M. L. Cohen, and S. G. Louie, Phys. Rev. B 76, 165108 (2007).
- Poncé et al. [2016] S. Poncé, E. R. Margine, C. Verdi, and F. Giustino, Comput. Phys. Commun. 209, 116 (2016).
- Pizzi et al. [2020] G. Pizzi, V. Vitale, R. Arita, S. Blügel, F. Freimuth, G. Géranton, M. Gibertini, D. Gresch, C. Johnson, T. Koretsune, J. Ibañez-Azpiroz, H. Lee, J.-M. Lihm, D. Marchand, A. Marrazzo, Y. Mokrousov, J. I. Mustafa, Y. Nohara, Y. Nomura, L. Paulatto, S. Poncé, T. Ponweiser, J. Qiao, F. Thöle, S. S. Tsirkin, M. Wierzbowska, N. Marzari, D. Vanderbilt, I. Souza, A. A. Mostofi, and J. R. Yates, J. Phys. Condens. Matter 32, 165902 (2020).
- Esswein [2018] T. Esswein, Master Thesis 10.3929/ethz-b-000560845 (2018).
- Note [1] Note the small difference between the ‘no SOC/non-polar’ panel of fig. 4 and the corresponding ‘ at 0.010 e/fu’ panel of fig. 2. The difference arises from the fact that for fig. 4 we calculated everything using scalar-relativistic pslibrary pseudopotentials to make it directly comparable to the SOC results which we obtained using fully-relativistic pslibrary pseudopotentials.
- Salmani-Rezaie et al. [2020] S. Salmani-Rezaie, K. Ahadi, and S. Stemmer, Nano Lett. 20, 6542 (2020).
- Salmani-Rezaie et al. [2021] S. Salmani-Rezaie, H. Jeong, R. Russell, J. W. Harter, and S. Stemmer, Phys. Rev. Materials 5, 104801 (2021).
- Venditti et al. [2022] G. Venditti, M. E. Temperini, P. Barone, J. Lorenzana, and M. N. Gastiasoro, Anisotropic Rashba coupling to polar modes in KTaO3 (2022), arXiv:2211.05056 [cond-mat] .
- Klein et al. [2022] A. Klein, V. Kozii, J. Ruhman, and R. M. Fernandes, A theory of criticality for quantum ferroelectric metals (2022), arXiv:2209.02733 [cond-mat] .
- Chen et al. [2023] X. Chen, T. Yu, Y. Liu, Y. Sun, M. Lei, N. Guo, Y. Fan, X. Sun, M. Zhang, F. Alarab, V. N. Strokov, Y. Wang, T. Zhou, X. Liu, F. Lu, W. Liu, Y. Xie, R. Peng, H. Xu, and D. Feng, Orientation-dependent electron-phonon coupling in interfacial superconductors LaAlO3/KTaO3 (2023), arXiv:2301.13488 [cond-mat] .
- Noffsinger et al. [2010] J. Noffsinger, F. Giustino, B. D. Malone, C.-H. Park, S. G. Louie, and M. L. Cohen, Comput. Phys. Commun. 181, 2140 (2010).
Appendix
This section contains data and information on the 2D to 3D charge carrier conversion, electronic band structures and numerical convergence of the calculations presented in the main text.
VI.1 Conversion between 2D and 3D carrier densities
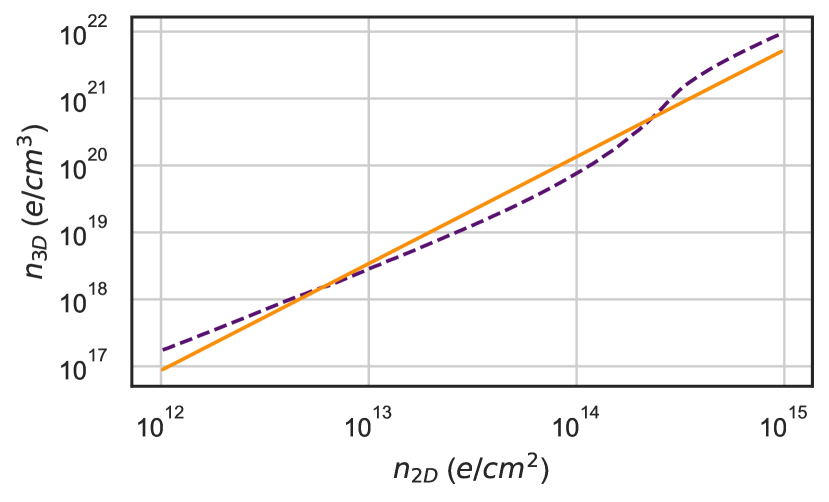
The interpolation used for conversion between and carrier densities is shown in figure A1. It is based on data from figure S6 of the supplementary information of Ref. 16.
The corresponding interpolation formula is
According to this conversion, a 3D carrier concentration of corresponds to , and to .
VI.2 Convergence with coarse q mesh
To test the convergence of our results, we calculate the phonons and the electron-phonon coupling strength along the same high-symmetry path using three different q meshes (q4 (), q6, and q8). Our results are shown in figure A2. The phonon frequencies at the high-symmetry points are well converged at q4, with only minor variations between q4 and q6 or q8. The colorscale is the same as that in fig. 2 of the main text. The actual values are about twice as large in the q6 and q8 cases compared to the q4 case.

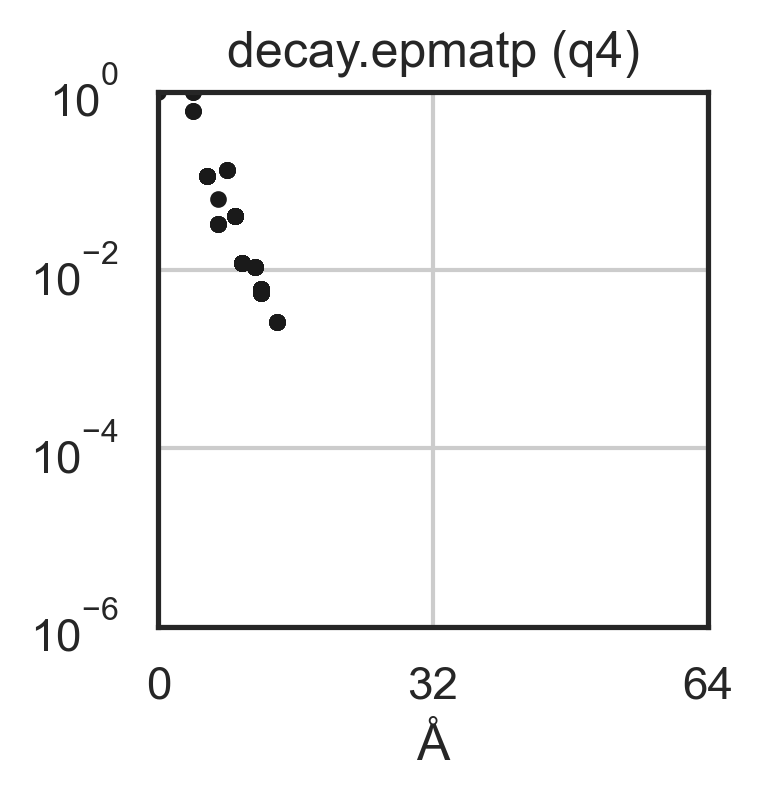
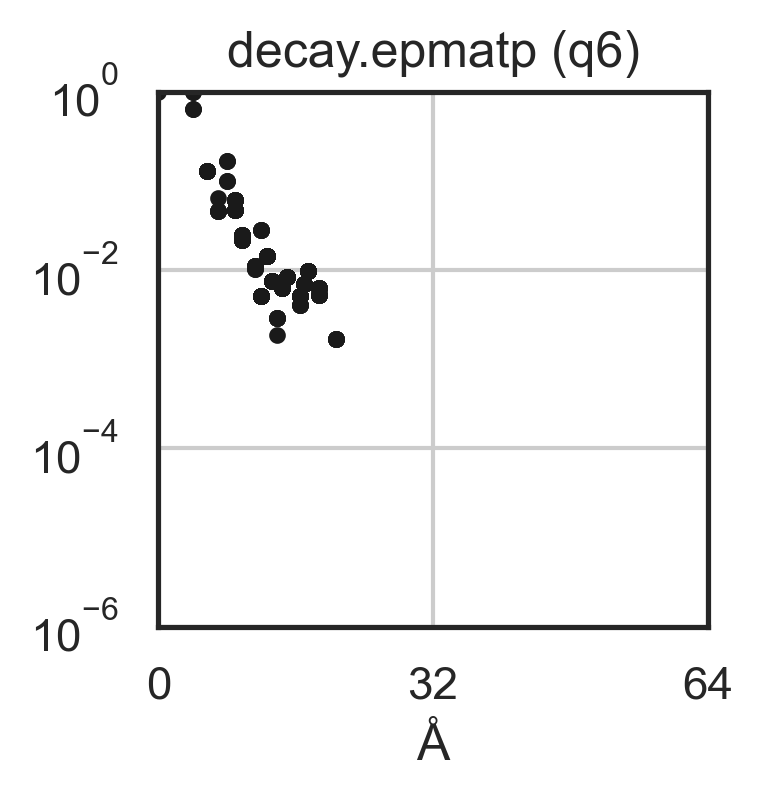
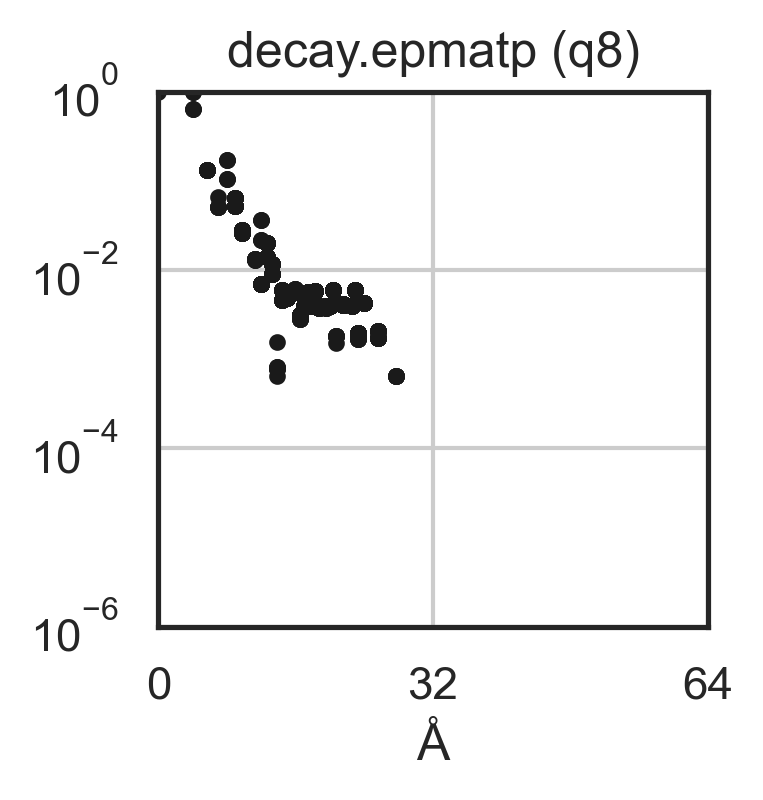
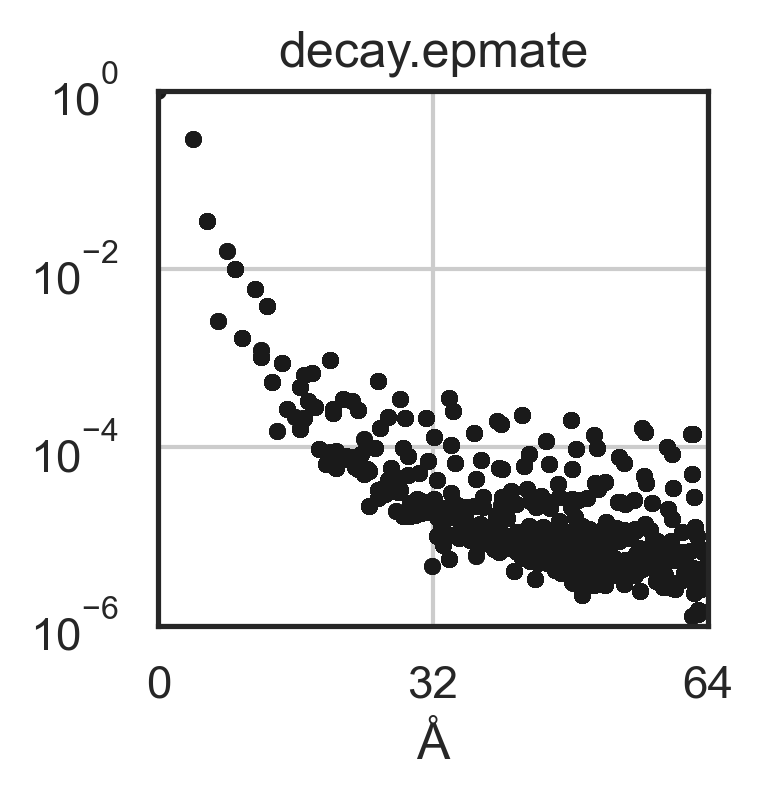
VI.3 Decay properties in real space
The spatial decay of the electron-phonon matrix elements in real space for the same three q meshes is shown in figure A3 (see Refs. 51 and 61 for more details). We observe a decay of the phonon perturbation of almost three orders of magnitude using all three meshes. The q6 and q8 meshes flatten after the decay, without further lowering the lowest value reached using the q4 mesh, indicating that the q4 mesh is accurate enough for the qualitative comparison we make. The decay of the electronic Wannier functions is well converged using the coarse k-point mesh, as can be seen from the bottom right panel of figure A3.
VI.4 Electronic band structure with and without spin-orbit coupling
Figure A4 shows our calculated electronic band structure of non-polar (upper panel) and polar (lower panel) KTO without and with spin-orbit coupling, corresponding to figure 4 in the main text.