Clustering of Threat Information to Mitigate Information Overload for Computer Emergency Response Teams
Abstract.
The constantly increasing number of threats and the existing diversity of information sources pose challenges for Computer Emergency Response Teams (CERTs). In order to respond to new threats, CERTs need to gather information in a timely and comprehensive manner. However, the volume of information and sources can lead to information overload. This paper answers the question of how to reduce information overload for CERTs with the help of clustering methods. Conditions for such a framework were established and subsequently tested. In order to perform an evaluation, different types of evaluation metrics were introduced and selected in relation to the framework conditions. Furthermore, different vectorizations and distance measures in combination with the clustering methods were evaluated and interpreted. Two different ground-truth datasets were used for the evaluation, one containing threat messages and a dataset with messages from different news categories. The work shows that the K-means clustering method along with TF-IDF vectorization and cosine distance provide the best results in the domain of threat messages.
- BoW
- Bag of Words
- BSI
- Bundesamt für Sicherheit in der Informationstechnologie
- CERT
- Computer Emergency Response Team
- CTI
- Cyber Threat Intelligence
- DBSCAN
- Density-Based Spatial Clustering of Applications with Noise
- DBSTREAM
- Density-Based Stream Clustering
- IoC
- Indicator of Compromise
- MC
- Micro-Cluster
- CVE
- common vulnerability and exposure
- NIST
- National Institute of Standards and Technology
- NLTK
- Natural Language Toolkit
- OPTICS
- Ordering Points To Identify the Clustering Structure
- OSINT
- Open Source Intelligence
- TF-IDF
- Term Frequency-Inverse Document Frequency
- TIP
- Threat Intelligence Platform
- t-SNE
- t-Distributed Stochastic Neighbor Embedding
- URL
- Uniform Resource Locator
- BERT
- Bidirectional Encoder Representations from Transformers
- SBERT
- Sentence-BERT
- CSA
- cyber situational awareness
- NN
- neural network
1. Introduction
Threats and malware for IT systems are continuously evolving, with the number of threats growing significantly each year (Lella et al., 2021). Attackers have steadily increased their resources and are using more sophisticated tactics and techniques (Abu et al., 2018). To counter the rising threat level and disseminate threat information, security professionals publish threat alerts through various channels on the Internet (Liao et al., 2016).
For those responsible for IT security, processing and classifying the volume of threat reports is a challenge (Wagner et al., 2019). Cyber Threat Intelligence (CTI) can be defined as the process of collecting and subsequently processing security-related data to derive recommendations for action within a given time frame (Abu et al., 2018). Threat information is disseminated through various channels, such as IT security blogs and social networks. Aggregating threat intelligence about threats can be done by Threat Intelligence Platforms. However, due to the wide range of information sources and the evolving threat landscape, the amount of threat information can lead to information overload (Abu et al., 2018).
Computer Emergency Response Teams are often points of contact for security incidents in organizations (Skopik et al., 2016). They coordinate counter-strategies and collect data on threats and security incidents. From the task description it can be concluded that current threat reports are of particular importance for CERTs in order to respond quickly to threats and provide information to affected organizations. In one study, of surveyed CERT staff indicated that all incoming threat reports were processed, but only the most critical reports were given attention (Gorzelak et al., 2011). The reason given for this was that there were not enough staff to process all incoming reports. Further, stated they did not have additional capacity to obtain new information and stated they could not even process all incoming threat reports. This suggests that a large proportion of respondents are not able to process the whole situation or fit all the threats into an overall picture, which is referred to as information overload.
Another study surveyed 500 IT security analysts about their day-to-day work and satisfaction (Hinchy, 2022). In the process, of the analysts said they felt burnt-out at work. In addition, responded that monitoring threats and alarms takes up the most amount of time. For of the analysts surveyed, enriching threat alerts is the most important task to automate in their daily work.
These surveys point out that approaches to reduce information overload are urgently needed.
Goal
This work aims to support CERTs in their daily work with threat information by evaluating the suitability of clustering algorithms to the domain of threat information. Data clusters allow CERTs to efficiently capture relevant details about threats and thus reduce the information overload that results from too much information and too many different sources. In this work, an evaluation of different combinations of distance measures, embeddings, and clustering techniques is provided. Requirements for the clustering procedures are deduced and reviewed. Subsequently, the results are evaluated and interpreted to validate procedures from the text clustering domain for the requirements in this paper. Here particular focus is placed on threat messages (advisories). Threat notifications are issued in part by vendors of commercial IT security products. Other sources of alerts can be security researchers who distribute information via blogs.
The following research question is derived from the objective of this paper: How can IT security threat information be clustered timely to reduce CERT staff’s information overload (RQ)?
Contributions
The present work provides two distinct contributions for current research. First, it provides requirements for automated techniques, which are suitable for CERTs using the insights of different surveys (C1). Second, it provides an overview and comparison of the performance of different clustering, embedding (existing and self-trained), and distance methods for reports in the IT security domain and articles in non-IT security related news article domains (C2).
Outline
After this introduction, related work as well as the research gap are presented (see §2). The methodology of this work is outlined in §3, followed by information about our implementation (see §4). Afterwards, an evaluation of all presented distance measures, embeddings, and clustering methods is performed (see §5). Our results are discussed and limitations are presented in §6, while §7 concludes our paper.
2. Related Work and Research Gap
This section introduces related work in the areas of IT security information gathering, clustering techniques, embedding methods, and evaluation metrics. Here, the works are presented in terms of their relevance to the present work. Based on the current state of this research, the research gap is identified.
Gathering IT Security Information
Several papers have been published in the past with the goal of capturing and processing sources of security-related information. Alves et al. (2021) designed a monitor to capture and process tweets with IT security content to generate cyber situational awareness (CSA). Liao et al. (2016) propose an approach to automatically extract Indicators of Compromise from technical articles and transfer them to OpenIOC format. IoCs are technical notes about attacks, which are used in the field of computer forensics. These can, e.g., be virus signatures or Uniform Resource Locators used by attackers. Azevedo et al. (2019) propose a platform, PURE, that allows aggregating and summarizing Open Source Intelligence (OSINT) information from TIPs.
Clustering Methods
Clustering methods organize data points into groups based on their similarity, e.g., cosine similarity. Hence, reducing the number of data points to be processed to as close as possible to one per group may be particularly important in the context of information overload.
In their paper, Zong et al. (2021) present different clustering methods from the field of text clustering. They describe and analyze the properties and limitations of different clustering methods. A comparison of the clustering methods is mapped exclusively by their properties. Mapped properties include, for example, the shape of clusters, the complexity of algorithms, or the effect of the size of the dataset on the algorithm. No evaluation of the procedures was performed using data and evaluation metrics.
Embeddings
Embedding methods generate vector representations of data, e.g., to find similarities in the data. The methods are of different nature, e.g., using the absolute frequency of words in a text similar to Bag of Words (BoW) (Qader et al., 2019), but also generated by language models which even encode the semantics of words (Reimers and Gurevych, 2019). In the present work, we need to encode the information of a whole document (e.g., a web page) in such an embedding, which is possible with the currently available techniques.
BoW stores the absolute term frequency of all terms in a document, based on a global vocabulary (Harris, 1954). Term Frequency-Inverse Document Frequency (TF-IDF), on the other hand, is a weighted measure to determine the frequency of terms in documents (Zong et al., 2021) in relation to the number of documents in which these terms are present. This way, rare terms are given more attention than common ones. Doc2vec (Le and Mikolov, 2014) is an extension of word2vec111Word2vec is a neural network used to create word embeddings. After being trained on a text corpus, these embeddings can be used to, e.g., detect similar words. (Mikolov et al., 2013), which learns a document representation, including its semantical information. More modern approaches use Bidirectional Encoder Representations from Transformers (BERT) (Devlin et al., 2018) as an underlying layer. Reimers and Gurevych (2019) propose Sentence-BERT (SBERT), a neural network (NN) especially used to embed larger units of language like sentences or even entire documents. SBERT limits the number of tokens (e.g., subwords) for an input to a maximum number of 512 tokens, though significantly fewer tokens are possible depending on the model. Several approaches exist for applying SBERT to texts despite the 512-word limitation Sun et al. (2019). The first variant, head-only (SBERT H), uses the first 510 words of a text and ignores the rest. The second variant tail-only (SBERT T) uses only the last 510 words. A combination of both, the head+tail variant (SBERT H+T), uses the first 128 words as well as the last 382 words. SBERT offers the possibility to train and optimize the models continuously.
Evaluation Metrics
In the domain of text clustering, internal and external evaluation metrics are used. Internal metrics aim to evaluate clusters based on their data points’ distance and cluster shape, thus, they make no statement about the correct allocation of the data to the clusters. They are usually implemented using the concepts of compactness and separability (Rendón et al., 2011). External metrics require the presence of labeled data (ground truth) (Amigó et al., 2009). They measure the consistency between the introduced labeling of the data and the result of the cluster analysis (Zong et al., 2021) and thereby enable the comparison of expected and calculated grouping. In the present work, we focus on external metrics222 Firstly, we compare different clustering methods, some of which might be optimized for one specific internal evaluation method (e.g., K-means is optimized on the silhouette coefficient), limiting the final evaluation results if done on internal methods. Secondly, it is mandatory that the resulting clusters contain similar data points based on their content. While the algorithms cluster, e.g., solely based on the shapes of clusters, resulting in potentially mismatched data points, this could lead to confusion and necessary correction steps on the human side of data point analysis, diminishing the purpose of such approaches. .
Rosenberg and Hirschberg (2007) propose two external evaluation metrics, homogeneity and completeness, which respectively evaluate whether a cluster contains only data points with the same label (homogeneity is rated high) or if all data points with the same label are contained in one cluster (completeness is rated high). With the help of these two metrics, it is possible to determine whether a cluster provides a correct solution, captured in the metric V-measure, a harmonic mean of homogeneity and completeness (Rosenberg and Hirschberg, 2007). Amigó et al. (2009) propose additional metrics, similar to homogeneity and completeness, which, however, are captured by the mentioned metrics.
Research Gap
Research on grouping IT security information focuses on capturing and generating IoCs in an automated manner. Work comparing clustering methods only considers the properties of the algorithms as well as the results, but does not compare clustering methods using evaluation metrics in the domain of IT security. The works on evaluation metrics show different ways to compare the results of clustering methods. However, none of these works pursue the goal of performing an evaluation of different distance measures, embeddings, and clustering methods in various combinations within the domain of IT security.
3. Methodology
This section provides the framework for this work. For this purpose, it describes which data are used in the course of this work and specifies the properties of the data. Subsequently, the requirements for the document embeddings, clustering algorithms, and evaluation metrics are presented.
3.1. Text Corpus
The acquisition of data is not part of the present work. Hence, we manually sourced a small corpus consisting of different threat reports. For the different steps in this work, we used different data.
The text corpus used to evaluate the clustering methods are from two different publicly available domains.
-
(1)
The threat reports used in this work were manually sourced and labeled to generate accurate and meaningful ground truth data for the evaluation. The threats reports reflect major events in the field of IT security, such as Stuxnet and EternalBlue (WannaCry) and were created by companies that have analyzed the threats and published them on their websites.
-
(2)
A Kaggle dataset (Habib Gültekin, 2020) offers another ground truth dataset, which includes labeled BBC news articles from 5 different categories. This dataset was created for text clustering tasks, among others, and does not contain any specific IT security content. Only 100 articles from each of the 5 categories are sampled from the dataset to keep the dataset relatively small in comparison to the threat report dataset. This second dataset is used to evaluate the generalization of the tested methods.
The second part of our corpus is exclusively used to train the document embedding models and is not used for evaluation purposes. This part consists of the following segments:
-
(1)
Wikipedia articles and arXiv scientific papers on computer science and IT security are collected by a web crawler.
-
(2)
Part of the common vulnerability and exposure (CVE) directory of National Institute of Standards and Technology (NIST) is used.
-
(3)
RSS channels with threat alerts by websites that specialize in distributing threat alerts as well as from manufacturers of commercial security products.
3.2. Requirements for Embedding, Clustering, and Evaluation Methods
This section provides requirements for our selection of embedding, clustering, and evaluation methods.
-
•
Reducing information overload for CERTs. Clustering is expected to perform precise groupings of threat reports.
- •
-
•
Continuous new terms. Threats and vulnerabilities are usually given creative names to ensure that they can be differentiated without using their CVE identifier. Work procedures must be able to process new terms and adapt to new situations independently.
-
•
Time requirements. The work of CERTs is time-critical, so procedures must be performant enough to reanalyze the threat situation several times a day.
-
•
Preserving data. Alerts should be processed even if they cannot be assigned to an existing cluster. This requires careful handling of outliers during cluster analysis so that outliers are preserved.
3.3. Embeddings, Clustering, and Evaluation
After the data collection, the data was cleaned and pre-processed. First, superfluous content, e.g., stop words 333https://www.nltk.org/book/ch02.html and punctuation, was removed. The outcome was transformed into a document embedding so that cluster analysis algorithms can be fed with the data. The different embedding models are TF-IDF (Zong et al., 2021), doc2vec (Le and Mikolov, 2014), and SBERT (Reimers and Gurevych, 2019).
The cleaned data continues to represent a large amount of information that is grouped into a cohesive set of information based on its similarity. Machine learning techniques were used to detect similarity structures in the data and identify them as similar information. Clustering methods typically have parameters that allow adaptation to the datasets and expectations of the results. For the cluster analysis in this work, widely used clustering algorithms were evaluated and adapted to the conditions in this work.
We selected three different clustering methods – two traditional clustering methods (Zong et al., 2021) and one stream clustering method (Suyal et al., 2014) – based on their popularity and type. K-means (MacQueen, 1967) is a traditional clustering method. It clusters the given information in clusters, based on its initialization parameter . An automatic method to determine the necessary number of clusters, based on the silhouette coefficient, is derived (Kodinariya and Makwana, 2013) based on the requirements given in §3.2. OPTICS (Ankerst et al., 1999) is another traditional clustering algorithm. It transforms the data into a density-based data structure, which can be used to cluster data points. The third clustering algorithm is a stream clustering algorithm named DBSTREAM (Hahsler and Bolaños, 2016). It builds clusters in two phases. In the offline phase, clusters are built based on randomly selected nodes and a given radius . A connectivity graph is built and used in the online-phase. In the online phase, new data points can be dynamically added to the current ones and clusters can be adjusted, or even created, based on these points and the given . As stated in §2, we focused on external evaluation metrics, specifically the homogeneity, completeness, and V-measure (Rosenberg and Hirschberg, 2007).
4. Implementation
The technical implementation of the evaluation of the different clustering methods was done in Python with the libraries Natural Language Toolkit (NLTK)444https://www.nltk.org/, River555https://github.com/online-ml/river, and scikit-learn666https://scikit-learn.org/. The entire process from raw data to final evaluation is described below.
For the evaluation, two datasets were used as ground truth: the threat intelligence dataset and the BBC News Kaggle dataset (Habib Gültekin, 2020). Data cleaning includes the following steps:
-
(1)
Removing stop words
-
(2)
Returning words to their root words (Stemming).
-
(3)
Removing words which do not contain at least one number or letter.
-
(4)
Removing words that do not exceed the length 1.
Due to the automated collection of unstructured data, crawlers and parsers may produce noisy data, which is the reason for the last two steps of data cleansing.
Embeddings
After cleaning the data, vectors were generated from the texts. For the first vectorization, the data was fed to a TF-IDF vectorizer. For this, the scikit-learn library in Python was used. This step is essential and must always be repeated when adding new data. The dictionary of TF-IDF is only formed during teach-in and remains unchanged even if further data is converted into vectors. Only relearning TF-IDF creates a new dictionary. This feature must be emphasized because threats and vulnerabilities in IT security often get their own identifiers, which would be missing in the dictionary and thus in the cluster analysis without relearning. \Actf-idf is trained with uni-, bi-, and trigrams (Broder et al., 1997).
The second vectorization was done using doc2vec. For this, a pre-trained doc2vec model was used. Wikipedia articles on IT security, arXiv paper in the field of IT security, and data from a CVE database were used for learning. The dimension of the vector was set to 150 in advance and it was trained over 40 epochs.
The third vectorization was performed by a SBERT model. The model was not trained itself, but the existing all-distilroberta-v1 model of SBERT was used. This model is described as a universal model with a maximum input length of 512 words. For evaluation purposes, all three presented approaches to text shortening were used and evaluated, namely head, tail, and head+tail (Sun et al., 2019).
For the evaluation of the clustering methods, the following metrics are used: (i) Euclidean distance, (ii) Cosine distance, and (iii) Manhattan distance.
Cluster Analysis
The cluster analysis was performed in Python using the libraries scikit-learn as well as River. For this purpose, the presented clustering methods K-Means, Ordering Points To Identify the Clustering Structure (OPTICS), and Density-Based Stream Clustering (DBSTREAM) were run with the different distance matrices. For each embedding (3 TF-IDF, 1 doc2Vec, 3 SBERT), three distance matrices (Cosine distance, Euclidean distance, Manhattan distance) were formed, resulting in combinations evaluated for each of our three selected clustering methods, resulting in different combinations. For the homogeneity, completeness, and V-measure metrics, we use the default implementation of scikit-learn777https://scikit-learn.org/stable/modules/generated/sklearn.metrics.homogeneity_completeness_v_measure.html#sklearn.metrics.homogeneity_completeness_v_measure.
5. Evaluation
The evaluation is divided into two parts. The first part evaluates the clustering procedures on the IT security threat reports, while the second part uses the same procedures and metrics, but applies them on the Kaggle dataset (Habib Gültekin, 2020). To illustrate spatial relationships, the embedded data points are reduced to two dimensions using t-Distributed Stochastic Neighbor Embedding (t-SNE) (Hinton and Roweis, 2002), allowing a visual representation.
The collected threat reports consist of seven different threats (i) EternalBlue (11 messages), (ii) Hafnium Exchange exploits (11 messages), (iii) Log4Shell (11 messages), (iv) Gameover ZeuS (1 message), (v) PrintNightmare (8 messages), (vi) Stuxnet (5 messages), and (vii) Sunburst (11 messages). The data is intentionally unbalanced and the single report for Gameover ZeuS is used to evaluate the treatment of outliers. It is important to note that manual clustering is subjective and might be created differently by different annotators. A methodology of our annotation strategy is given in §3.
The news article dataset (or Kaggle dataset) (Habib Gültekin, 2020) is used to evaluate whether the results identified on the threat report dataset (i) hold in other domains and (ii) scale to a larger dataset (e.g., performance-wise).
5.1. Results of Threat Report Evaluation
| # | Method | Embedding | Distance | Homogeneity | Completeness | V-Measure | #Cluster |
|---|---|---|---|---|---|---|---|
| K-means | TF-IDF | Cosine | |||||
| TF-IDF | Euclidean | ||||||
| OPTICS | TF-IDF | Cosine | |||||
| K-means | TF-IDF (bigram) | Cosine | |||||
| TF-IDF (bigram) | Euclidean | ||||||
| OPTICS | TF-IDF | Euclidean | |||||
| DBSTREAM | TF-IDF | Cosine | |||||
| K-means | TF-IDF (trigram) | Euclidean | |||||
| TF-IDF (trigram) | Cosine | ||||||
| DBSTREAM | SBERT H | Euclidean | |||||
| doc2vec | Cosine | ||||||
| SBERT H+T | Euclidean | ||||||
| SBERT T | Euclidean | ||||||
| TF-IDF (bigram) | Cosine | ||||||
| TF-IDF | Euclidean | ||||||
| TF-IDF | Manhattan | ||||||
| TF-IDF (bigram) | Euclidean | ||||||
| TF-IDF (bigram) | Manhattan | ||||||
| TF-IDF (trigram) | Cosine | ||||||
| TF-IDF (trigram) | Euclidean | ||||||
| TF-IDF (trigram) | Manhattan | ||||||
| doc2vec | Euclidean | ||||||
| doc2vec | Manhattan | ||||||
| SBERT H | Manhattan | ||||||
| SBERT T | Manhattan | ||||||
| SBERT H+T | Manhattan | ||||||
| K-means | doc2vec | Cosine | |||||
| OPTICS | SBERT H | Cosine |
Tab. 1 shows the evaluation of threat reports from IT security up to a threshold of with their global ranking (sorted by V-Measure).
Ground Truth
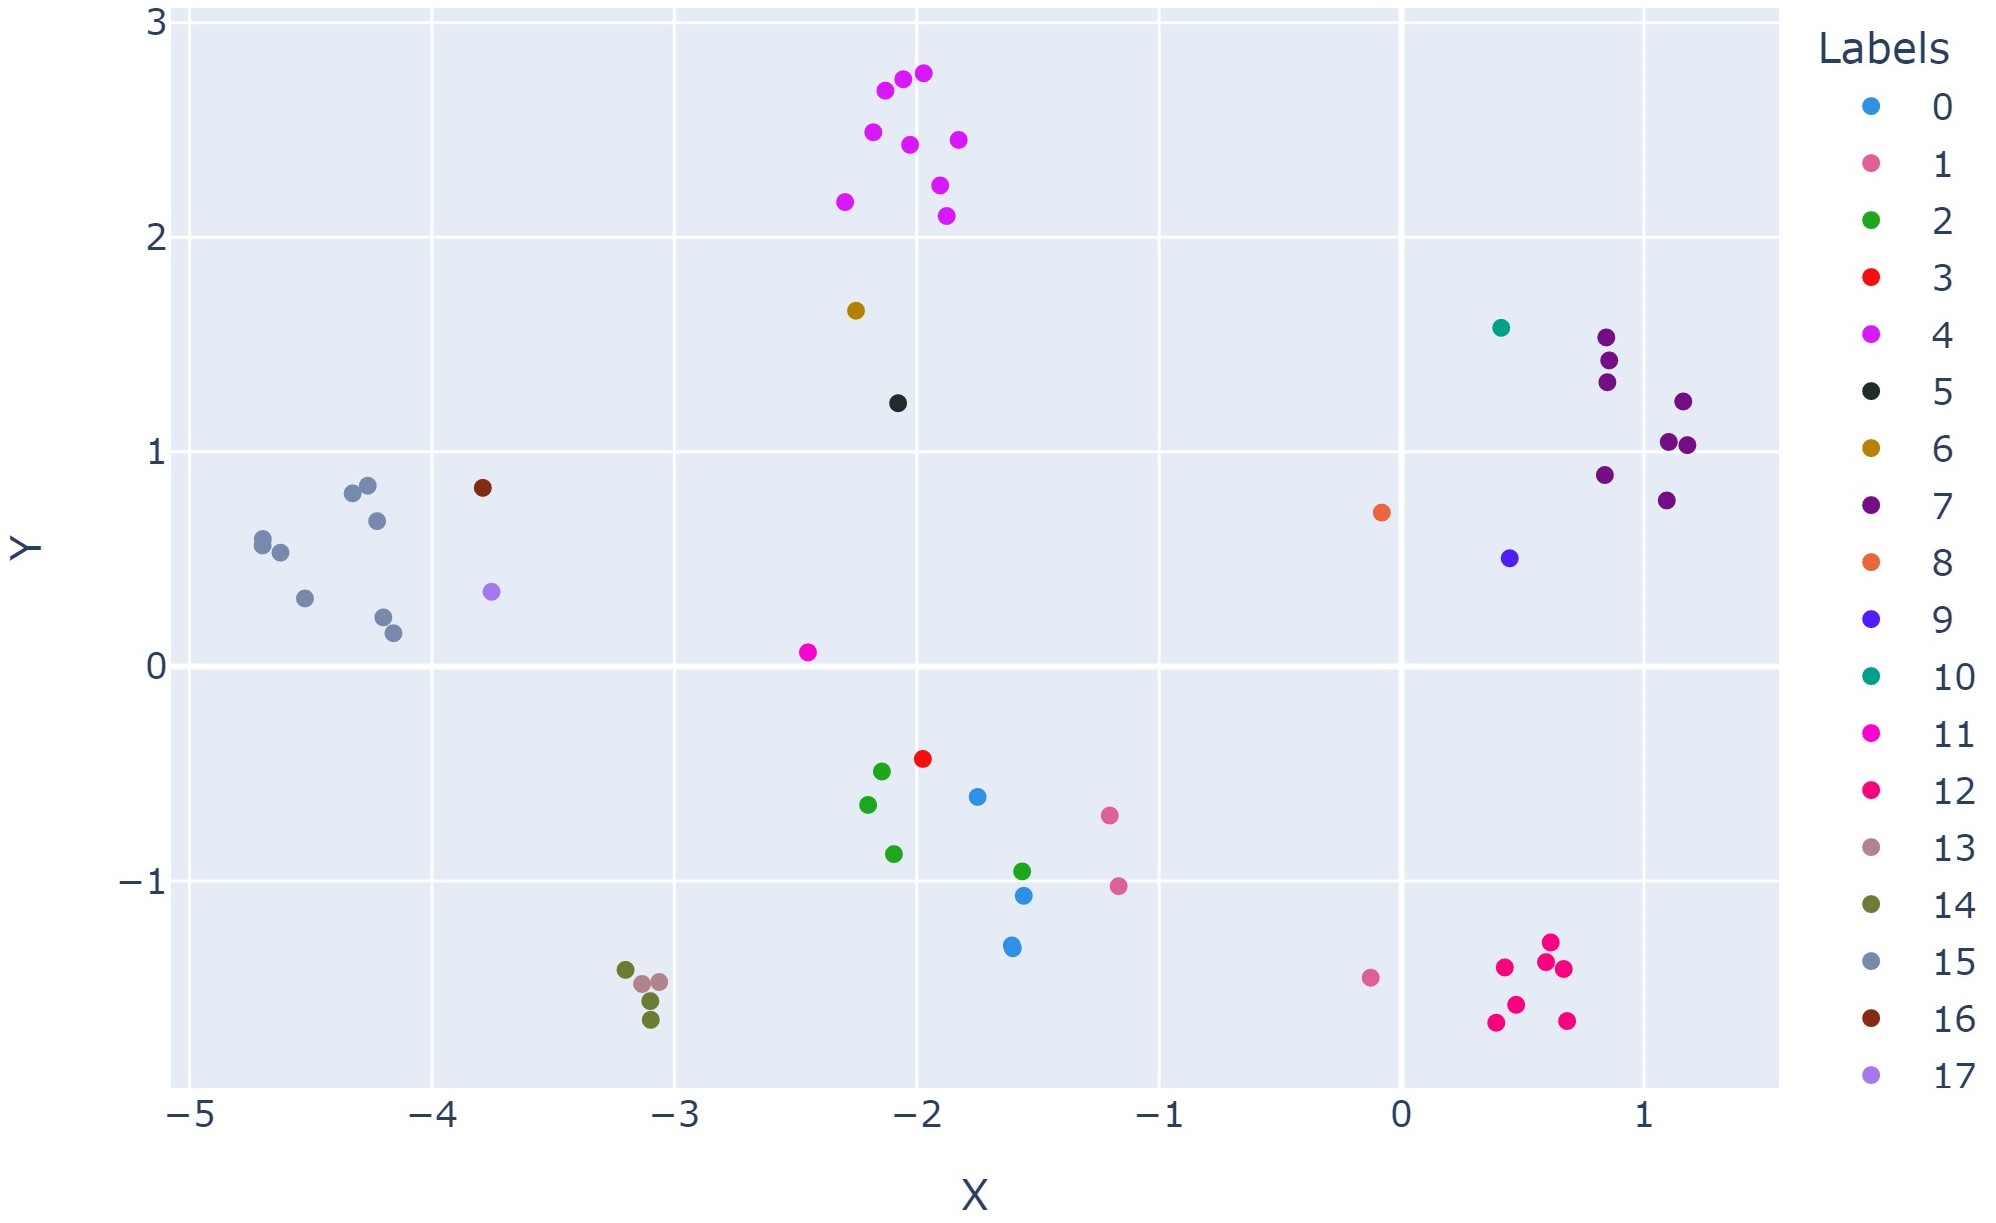
Fig. 1 shows a plot of the gold standard data points generated by t-SNE with TF-IDF. Each data point has dimensions. The cosine distance of the TF-IDF embedding is used as input for t-SNE. The clusters can be well separated from each other for good visualization. Stuxnet (label 5) has a much higher density than, for example, EternalBlue (label 0).
K-means Evaluation
K-means, with the automatic determination of the number of clusters (Kodinariya and Makwana, 2013), achieves the best result on the dataset with the cosine distance and the TF-IDF vectorization (cf. Tab. 1). The threat reports come from seven threats, but the search for the best number of clusters achieves the best result with six clusters. Completeness reaches the maximum value of , and homogeneity reaches a value of . The threat message to Gameover ZeuS is mismatched with both the cosine and Euclidean distance. In the case of the cosine distance, Gameover ZeuS is assigned to Stuxnet, and in the case of the Euclidean distance, it is assigned to EternalBlue. Fig. 2 shows the result of the labels by K-means with TF-IDF vectorization and cosine distance.
OPTICS Evaluation
OPTICS achieves clustering with a V-measure score of using cosine distance and TF-IDF vectorization and detects six clusters. A visualization of the results can be seen in Fig. 3.
Based on Fig. 3, it becomes clear that the results must be manually checked despite an evaluation with external evaluation metrics. OPTICS treats all data points from EternalBlue (marked 0 in Fig. 1) as well as one data point from Log4j and the data point from Gameover ZeuS as noisy data (marked -1). However, evaluation metrics consider all noisy data as a separate cluster. Since all threat messages from EternalBlue, with one message each from Log4j and Gameover ZeuS, are evaluated together as a cluster, OPTICS still achieves a V-measure score of . However, this result does not meet our expectations for the data. If a CERT is presented with the result as an outlier, a proportionally large group of threat reports may be misinterpreted.
Fig. 4 presents the associated reachability graph for the threat messages. The first eight data points belong to EternalBlue. Due to the missing valley in the set of points, OPTICS does not recognize the data points as clusters and marks them as outliers. OPTICS can be configured to flatten the necessary slope in the reachability graph. This allows the EternalBlue cluster to be flagged as a standalone cluster rather than an outlier cluster. However, no manual optimizations are made to the methods within the scope of this work (cf. §3.2).
DBSTREAM Evaluation
DBSTREAM achieves a V-measure of and distributes the data to homogeneous (homogeneity of ) clusters. As document embedding TF-IDF achieves the best result with the cosine distance. The number of clusters is higher for DBSTREAM than for the other methods. Fig. 5 presents the results of cluster analysis with DBSTREAM.
Comparison of Clustering Methods
All three tested methods achieve the highest V-measure with TF-IDF vectorization and cosine distance. The interpretation of the results of OPTICS show that the evaluation metrics alone are not sufficiently informative about the outcome. We have shown that cluster analyses, despite belonging to the group of unsupervised learning methods, have to be manually checked in order to obtain sound results. DBSTREAM achieves the worst V-measure of the three clustering methods, but achieves more homogeneous clusters than OPTICS ( for DBSTREAM to for OPTICS).
Runtime
| Method | Emb. | Dist. | Te [] | Tc [] | Ts [] |
|---|---|---|---|---|---|
| K-means | TF-IDF | cos | s | ||
| DBSTREAM | TF-IDF | cos | s | ||
| OPTICS | TF-IDF | cos | s |
Tab. 2 presents the runtimes of the clustering methods for the threat report dataset. OPTICS requires significantly less time for the cluster analysis than DBSTREAM and K-means. The measured time for K-means includes the calculation of the optimal number of clusters. The SBERT and doc2vec models are already trained and loaded before embedding the data points. Measuring the cosine distance is included in this time.
5.2. Results of the Kaggle Evaluation
To obtain comparability of the procedures on different datasets, the same procedure was used again on the Kaggle dataset. The TF-IDF vectors have dimensions on the Kaggle dataset (Habib Gültekin, 2020). Tab. 3 shows the evaluation of the clustering procedures, depicting only the best results of each clustering algorithm with their global ranking (sorted by V-measure).
| # | Method | Embedding | Distance | Homogeneity | Completeness | V-Measure | #Cluster |
|---|---|---|---|---|---|---|---|
| K-means | SBERT H+T | Cosine | |||||
| SBERT T | Cosine | ||||||
| SBERT H | Cosine | ||||||
| SBERT H+T | Manhattan | ||||||
| SBERT H+T | Euclidean | ||||||
| SBERT H | Euclidean | ||||||
| SBERT T | Euclidean | ||||||
| SBERT T | Manhattan | ||||||
| SBERT H | Manhattan | ||||||
| TF-IDF | Euclidean | ||||||
| DBSTREAM | TF-IDF | Cosine | |||||
| SBERT H+T | Cosine | ||||||
| SBERT H | Cosine | ||||||
| SBERT T | Cosine | ||||||
| SBERT H+T | Euclidean | ||||||
| SBERT H | Euclidean | ||||||
| SBERT T | Euclidean | ||||||
| TF-IDF (bigram) | Cosine | ||||||
| TF-IDF (trigram) | Cosine | ||||||
| TF-IDF | Euclidean | ||||||
| OPTICS | SBERT H+T | Cosine | |||||
| SBERT H | Cosine | ||||||
| SBERT T | Cosine | ||||||
| SBERT T | Manhattan | ||||||
| SBERT H+T | Euclidean | ||||||
| SBERT H+T | Manhattan | ||||||
| SBERT H | Euclidean | ||||||
| SBERT T | Euclidean | ||||||
| SBERT H | Manhattan | ||||||
| TF-IDF | Cosine |
The results on the Kaggle dataset differ from the result on the threat reports. K-means still leads, but no longer with TF-IDF vectorization, but with SBERT. Of particular importance is the position of SBERT over all methods on the Kaggle dataset. TF-IDF achieves the best result only with DBSTREAM. Furthermore, there is a large gap between the third and fourth place V-measure ( to ).
Ground Truth with Dimension Reduction
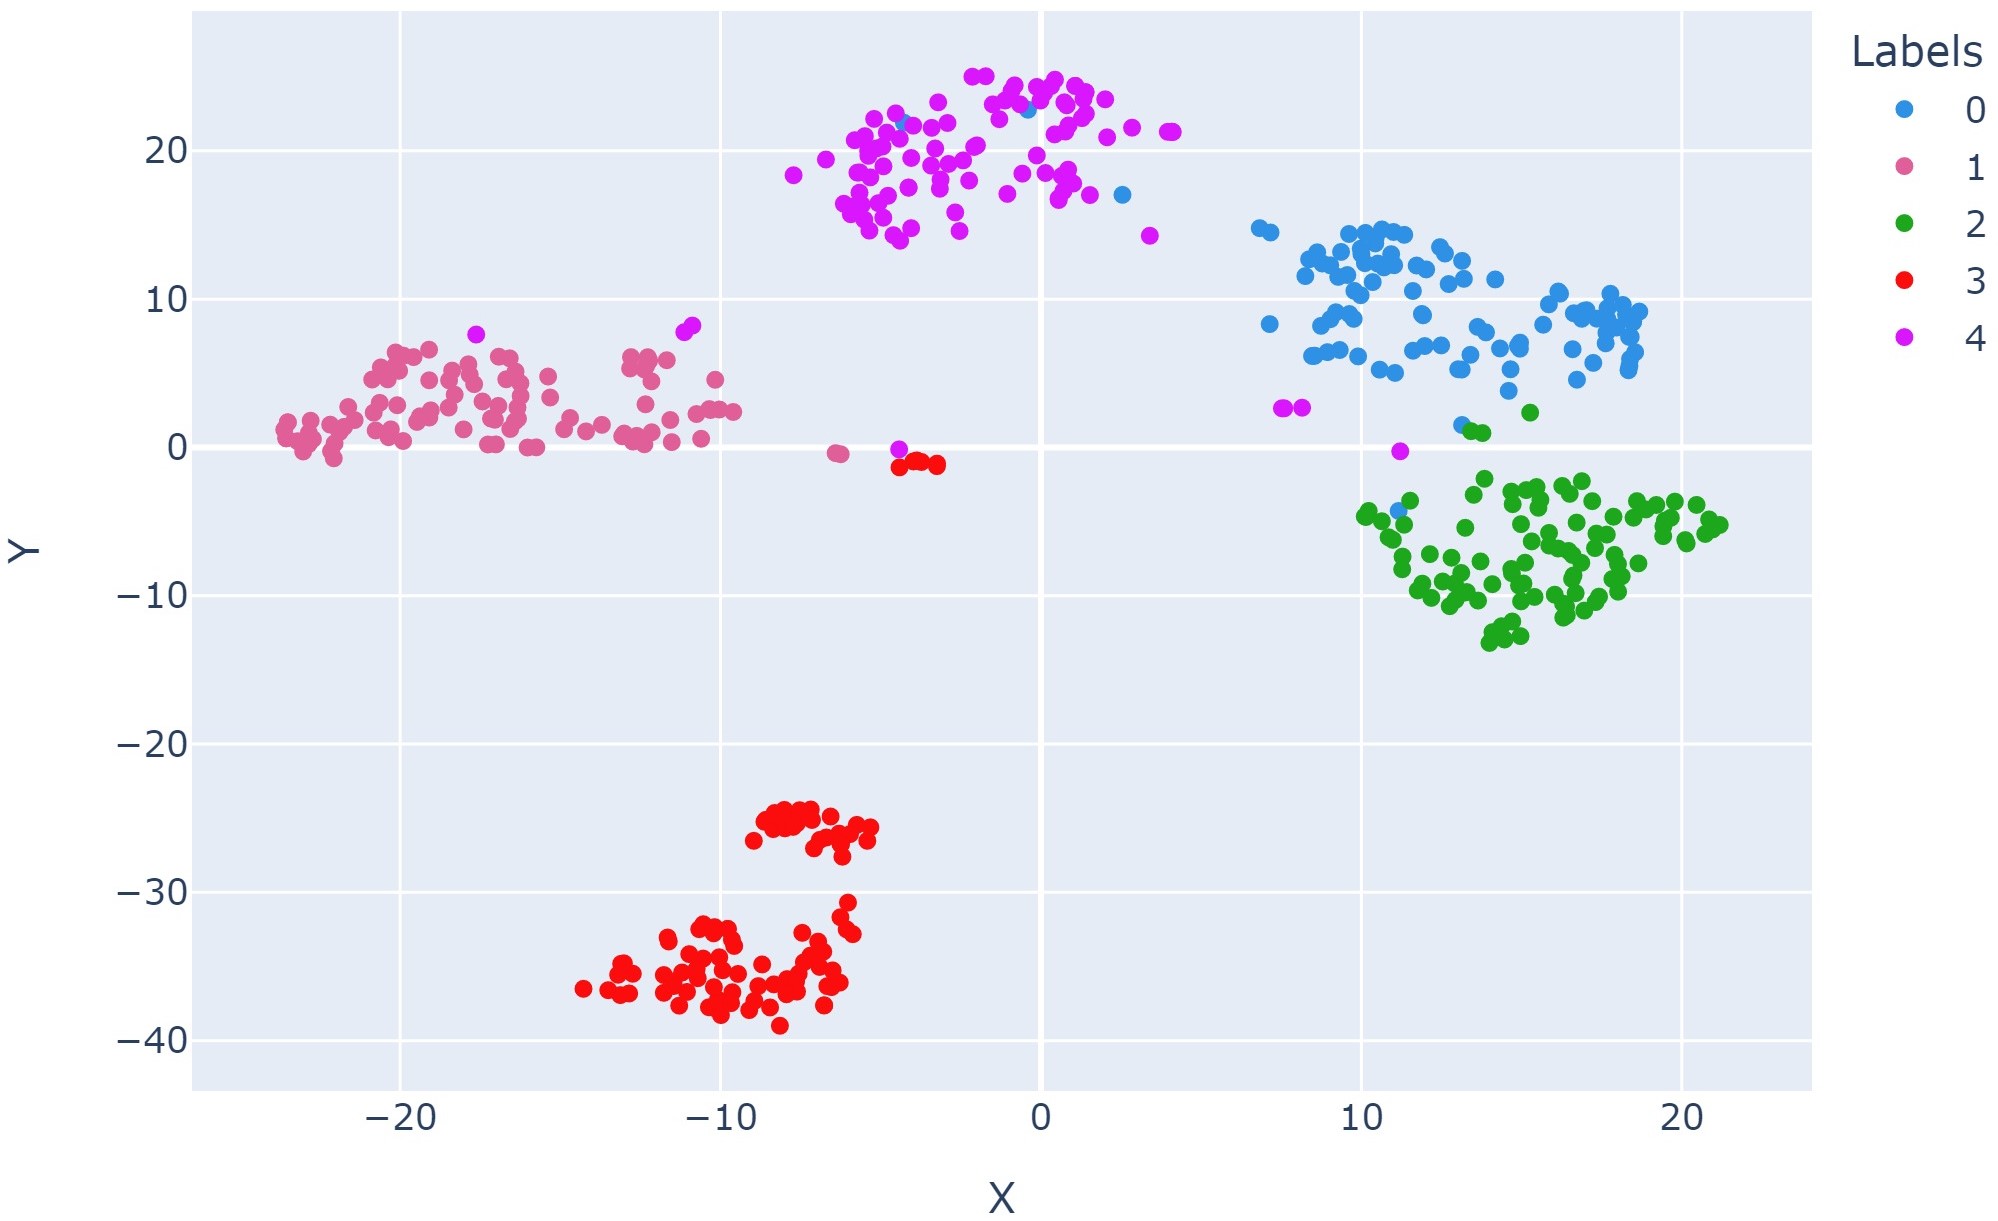
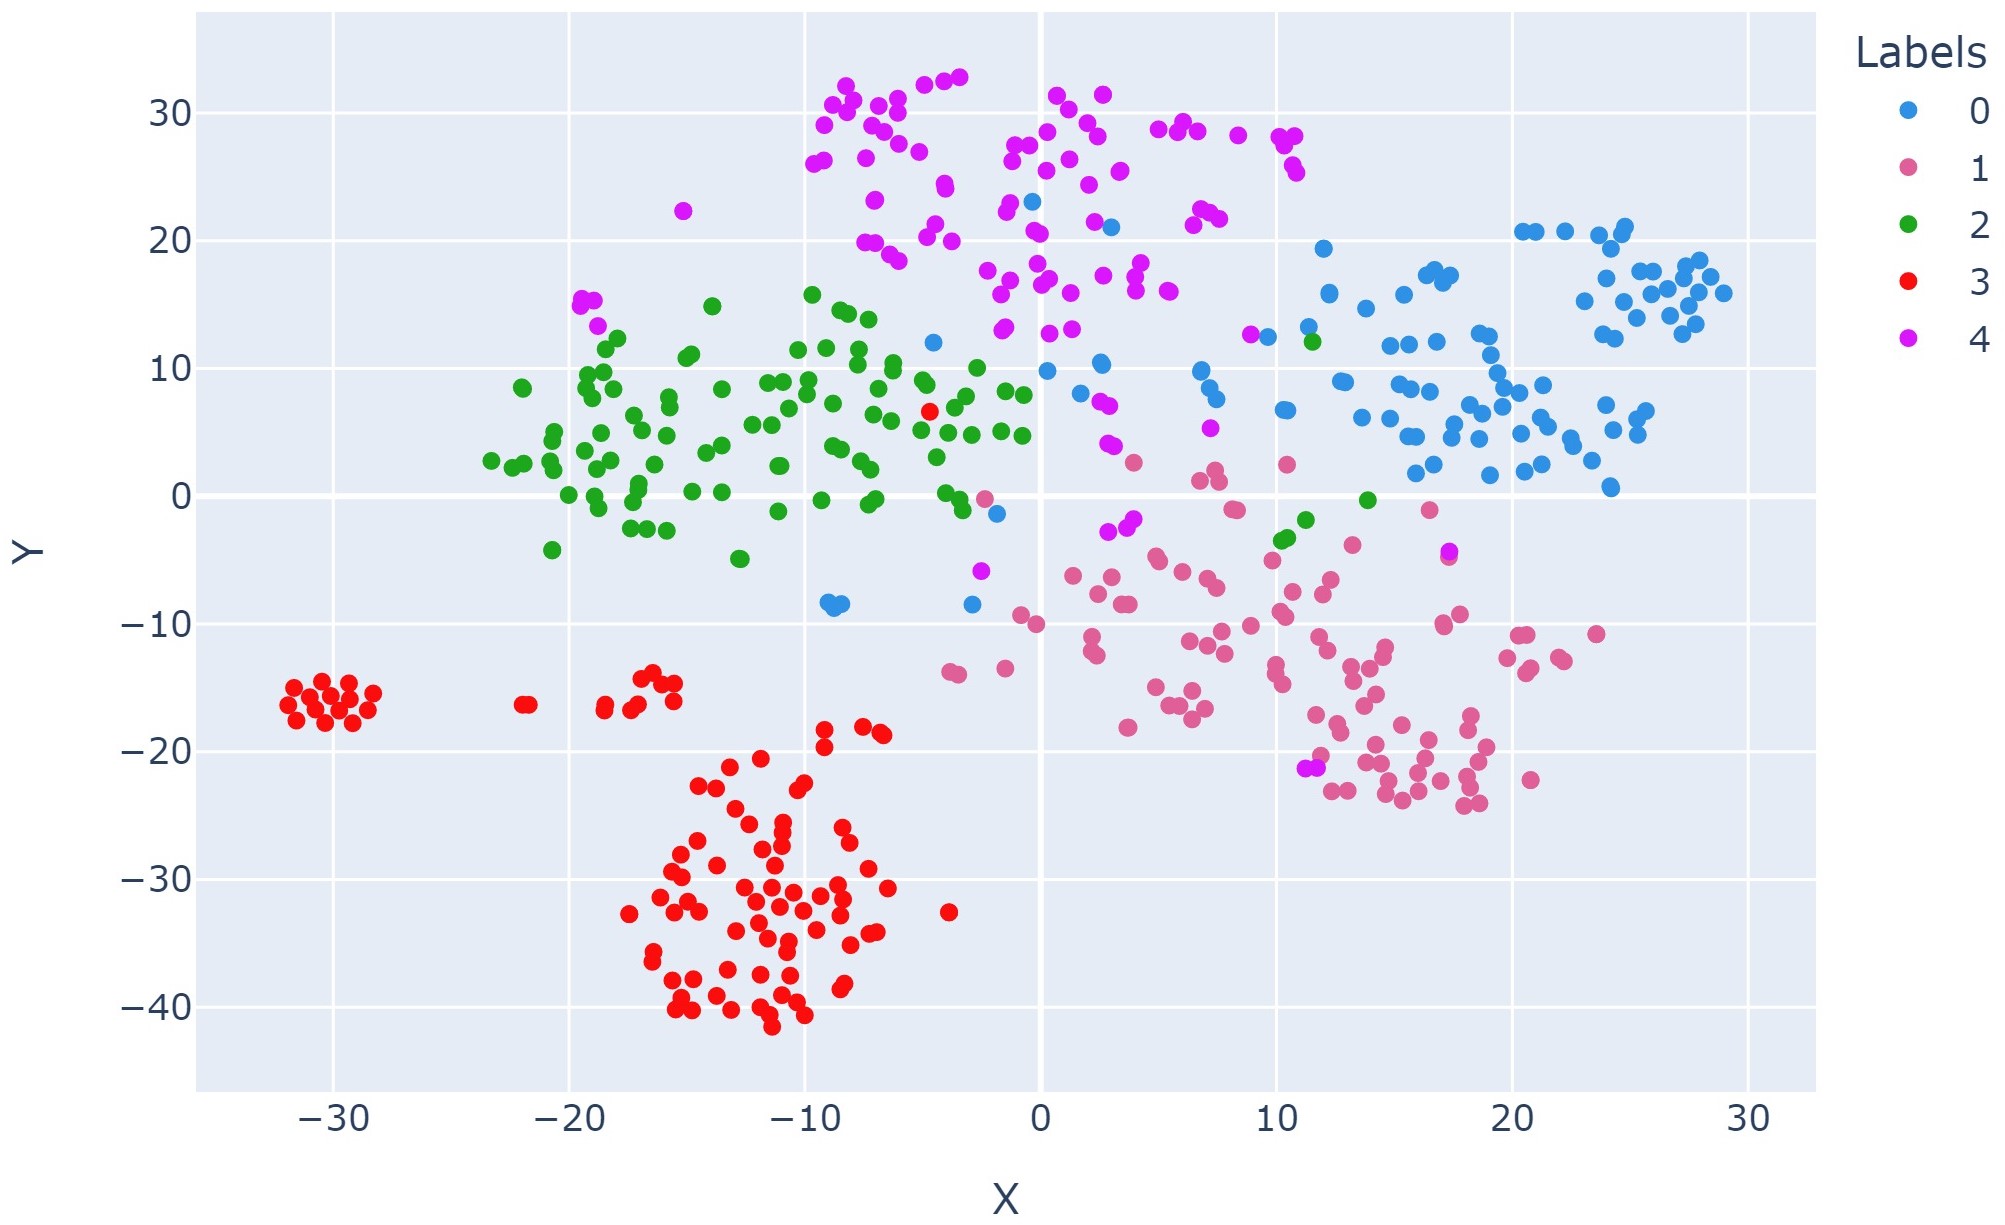
Fig. 6 shows the labeled data from the Kaggle dataset with the SBERT H+T and cosine distance, while Fig. 7 shows the dataset with TF-IDF and cosine distance.
Visual evaluation of the dimension reduction supports the evaluation results. With one exception, the clustering methods achieve better results when SBERT vectorization is used. Fig. 6 visualizes how the data can be separated much better by SBERT, except for a few points. In Fig. 7, however, they visually collapse with each other and cannot be cleanly separated.
Runtime
Tab. 4 shows the runtime of the clustering methods on the Kaggle dataset. Measuring the cosine distance is included in this time.
5.3. Interpretation of Results
This section evaluates the results in terms of minimum, maximum, and average values, and shows the strengths and weaknesses of the clustering methods with respect to homogeneity, completeness, and V-measure.
Results Threat Reports
The threat reports dataset shows a mixing of the methods (cf. Tab. 1), but DBSTREAM occupies ranks to as a block.
| Threat reports | K-means | DBSTREAM | OPTICS |
|---|---|---|---|
| Hommin | |||
| Hommax | |||
| Homavg | |||
| Compmin | |||
| Compmax | |||
| Compavg | |||
| V-M.min | |||
| V-M.max | |||
| V-M.avg | |||
| AvgCS |
For homogeneity, DBSTREAM occupies the best minimum, maximum, and average values (cf. Tab. 5). The high values of the homogeneity of DBSTREAM can be attributed to the strongly increased number of clusters, which DBSTREAM forms. OPTICS, on the other hand, has the lowest average number of clusters and, consequently, the lowest average homogeneity in comparison. The average number of clusters is closest to the correct number of clusters in the data for K-means.
In terms of completeness, OPTICS achieves a better average result than K-means and DBSTREAM (cf. Tab. 5). These result of OPTICS can also be attributed to the number of clusters. Since OPTICS generates fewer clusters, there are comparatively more similar data within the same cluster, increasing completeness and decreasing homogeneity. For DBSTREAM, the interval of completeness results is narrower than for K-means and OPTICS.
The average V-measure is higher for DBSTREAM than for K-means, although K-means achieves the absolute best result (cf. Tab. 5). Nevertheless, the interval of the V-measure results of K-means is very wide with , whereas DBSTREAM also shows the narrowest interval on the V-measure. Like K-means, OPTICS also achieves V-measure results that cover almost the entire spectrum of results.
Results Kaggle Dataset
On the Kaggle dataset, the results of the different vectorizations and distance measures are strongly related with the procedures (cf. Tab. 3). Evaluated by the V-measure, K-means ranks and DBSTREAM ranks .
| Threat reports | K-means | DBSTREAM | OPTICS |
|---|---|---|---|
| Hommin | |||
| Hommax | |||
| Homavg | |||
| Compmin | |||
| Compmax | |||
| Compavg | |||
| V-M.min | |||
| V-M.max | |||
| V-M.avg | |||
| AvgCS |
K-means has an average number of clusters of on the Kaggle dataset, where the ground truth of Kaggle contains only 5 categories. Thus, there is a significant difference between the ground truth and the clustering result on the Kaggle dataset.
DBSTREAM also has a greatly increased number of clusters, with an average of on the Kaggle dataset, but can also show the highest average homogeneity on this dataset (cf. Tab. 6). The interval in which homogeneity ranges is wider on the Kaggle dataset () than on the threat reporting dataset (), with a homogeneity of on both datasets. Completeness decreases under the aspect of high number of clusters, resulting in DBSTREAM achieving the lowest average completeness on the Kaggle dataset as well (cf. Tab. 6). Although K-means leads with places of the evaluation, DBSTREAM has a very similar average V-measure as K-means.
OPTICS achieves a precise approximation to the correct number with an average number of clusters of . Nevertheless, OPTICS achieves a maximum homogeneity of only , which is also the worst result with respect to this measure. The average completeness of the OPTICS clustering results is the highest of the tested methods, as for the threat reports. Also for the Kaggle dataset, the high average completeness as well as the low average homogeneity can be attributed to the formation of few clusters.
Comparing the Results of the Datasets
K-means achieves the highest V-measure with the automatic determination of the number of clusters and thus the best result across all clustering methods on both datasets. TF-IDF embeddings on the threat report dataset and the SBERT embeddings on the Kaggle dataset yield the best results. Determining the correct number of clusters by silhouette coefficient-based detection works accurately on the Kaggle dataset, with the best result. On the threat detection dataset, a deviation to the correct number has the best result, but it slightly impacts the V-measure. A drawback is the runtime of the whole procedure, which may limit the practical application in time-critical contexts. The cluster determination has received an initial optimization by using large step lengths in the first run and then searching for the local maximum around the best result with smaller step lengths. It cannot be guaranteed that the global maximum is reached in the process. On average, the cluster determination has significantly more accurate results on the threat report dataset across all distance measures and vectorizations (ground truth: clusters, average number by cluster determination: clusters) than on the Kaggle dataset (ground truth: Cluster, average number by cluster determination: clusters). Due to the property of K-means to start with random data, optimization potential arises in increasing the number of iterations K-means goes through until the best result is obtained. By default, scikit-learn implements K-means with iterations and random start data points. This can be increased at the expense of execution time. However, during the evaluation of this work, no differences were observed in the results by increasing the number of runs.
DBSTREAM achieves high homogeneity on both datasets with different vectorizations and distance measures, but shows weaknesses in completeness. It should be noted that the algorithm can be controlled by the parameters clustering_threshold and intersection_factor. The parameters can be used to control the cluster size as well as the merging of the Micro-Cluster (MC), which allows for manual optimization. The results of DBSTREAM show a conditional independence of vectorizations and distance measures, since a considerable part of the results appear as a block in the table.
The best clustering procedure of each evaluation metric is identical for both datasets, so properties can be formed based on the different datasets. K-means is ranked second on both datasets and all evaluation metrics except for the Kaggle dataset with the average V-measure. Thus, K-means achieves neither the best nor the worst average result on both datasets. On average, DBSTREAM achieves the best result on homogeneity and the worst average result on completeness on both datasets. OPTICS achieves the best average results on completeness and the worst average results on homogeneity and V-measure. It should be emphasized that different vectorizations dominate on the respective dataset, but the clustering methods still achieve the same average results when comparing homogeneity as well as completeness across the datasets. Only the best average V-measure differs on the two datasets, with very close results. Tab. 7 show the best and worst averages.
| Best average | Homogeneity | Completeness | V-Measure |
|---|---|---|---|
| Threat reports | DBSTREAM | OPTICS | DBSTREAM |
| Kaggle | DBSTREAM | OPTICS | K-means |
| Worst average | |||
| Threat reports | OPTICS | K-means | OPTICS |
| Kaggle | OPTICS | DBSTREAM | OPTICS |
It should be emphasized that DBSTREAM achieves very good average results on the V-measure due to its high homogeneity. The V-measure can thus be strengthened by forming many small homogeneous clusters, which, however, must be viewed critically from the perspective of information overload.
The TF-IDF vectorization with the cosine distance measure provides the best results on the threat report dataset with respect to the V-measure. However, the Euclidean distance also provides accurate results. On the Kaggle dataset, however, SBERT is superior, as seen by the fact that the best nine results are obtained by K-means with different SBERT configurations and different distance measures. Doc2vec is only found in the middle to back of the table on both datasets. The two datasets differ in that the data within the threat reporting dataset always writes about the same threat. As a result, the frequencies of words within a threat are similar, which favors the use of TF-IDF vectorization as well as the cosine distance measure. On the Kaggle dataset, messages are grouped into five categories. In most cases, the articles deal with different topics and thus have different word frequencies. This shows the strength of SBERT, which performs better grouping than TF-IDF or doc2vec based on semantic similarities of the texts. The good result of DBSTREAM with TF-IDF vectorization and cosine distance measure can be attributed to the fact that DBSTREAM forms many small and homogeneous clusters, so that the messages within these clusters concern the same topic.
In terms of execution time of the vectorizations, TF-IDF is superior to the other vectorizations doc2vec and SBERT. However, TF-IDF requires vectorizing all data, whereas SBERT and doc2vec are able to vectorize only single data points. This feature can be advantageous in a process where the data cannot be stored or the datasets become very large and stream clustering is used.
6. Discussion, Limitations, and Future Work
This section presents the discussion and limitations of the present work. Furthermore, possible future work is outlined.
Discussion
The present work evaluates whether clustering methods are suitable to overcome information overload for CERT staff. This is done by identifying requirements for clustering, embedding, and distance methods based on current surveys in this field of research (Hinchy, 2022; Gorzelak et al., 2011) (C1). Based on these requirements, suitable clustering methods, document embeddings, and distance metrics are selected, resulting in the clustering methods K-means, DBSTREAM, and OPTICS, the document embeddings TF-IDF, doc2vec, and SBERT, and the distance metrics Euclidean distance, cosine distance, and Manhatten distance. Further, we settled on external evaluation methods to measure the proportion of correct clustering using homogeneity, completeness, and V-measure (Rosenberg and Hirschberg, 2007), employing a manually labeled threat report dataset and an existing news article dataset (Habib Gültekin, 2020).
Our evaluation shows that different combinations of clustering perform differently on the two datasets (C2). On the threat report dataset, K-means with TF-IDF yielded the best results, while on the news article dataset, K-means with SBERT performed best. Our research question How can IT security threat information be efficiently clustered to reduce information overload for CERT staff (RQ)? can be answered with a combination of K-means and TF-IDF. Although TF-IDF seem to be outdated in a time with BERT derivates in nearly all domains, they offer distinct benefits over SBERT, e.g., performance boosts.
Limitations
The lack of large datasets poses a challenge for our evaluation. In the context of this work, only small datasets with a maximum of 500 data points were used. A performance test of K-means with optimization on very large datasets is missing. It could therefore be investigated whether a very dense vector space (due to large amounts of data) yields different results if a category takes up a larger area in the vector space.
All clustering methods were used and evaluated in their default configuration. Two separate datasets for optimization and evaluation in the IT security domain provide the opportunity to optimize the procedures with one dataset and to evaluate them with the evaluation dataset. This can yield better results. For K-means, an automatic determination of the “number of clusters” parameter was implemented so that the procedure satisfies the conditions of this work. For DBSTREAM and OPTICS the parameters are used in the default configuration by the River and scikit-learn libraries. The question arises whether automatic methods for optimizing the parameters can also provide better results than standard configurations. Optimizing the parameters of DBSTREAM should improve the results. DBSTREAM generates a lot of small clusters with high homogeneity in the default configuration compared to the other methods. By changing the cluster merging parameters, the number of clusters can be reduced. Here, it must be evaluated how the ratio of homogeneity and completeness, and thus the V-measure, changes by changing the parameters.
A custom-built training corpus was assembled to train the doc2vec model. Doc2vec was not optimized in the context of this work, possibly resulting in the fact that it did not reach a satisfactory result in any of the tested combination possibilities compared to other methods. In contrast, SBERT used an already trained model from the library’s publisher, for which it can be assumed that optimizations and tests have been performed. Further, we pre-processed our text corpus, e.g., by removing stop words, which is uncommon when using modern language models like SBERT due to the lost but potentially important information.
Only the external evaluation metrics homogeneity, completeness, and the V-measure were used in the work. Justifications for avoiding other external evaluation metrics are taken from other work and are not supported by calculations.
Future Work
To reduce information overload for CERTs, a variety of future work is possible. One approach is to continue the stream clustering approach with the inclusion of stream embeddings so that the entire data processing pipeline can process the data in real time. To do this, approaches must be found to retain the data point information so that CERT staff can access the clustered information. As an example, one CERT approach is a keyword extraction of the threat message, the result of which is stored in a database along with the URL of the threat message. Thus, the memory requirement remains low and the data points in the clusters can be reconstructed. A functional front end displays the clusters including the extracted keywords to the employees. If more information is needed, the URLs can be reloaded and viewed.
Another suggestion for further work is to introduce topic modeling (Topic Modeling). Topic Modeling extracts frequent words of a text and marks the corresponding data points with the words. Thus, each data point yields a set of words that can be used to describe that data point. Then, a clustering procedure can be applied to the result of topic modeling to potentially improve the results of text clustering (Xie and Xing, 2013).
In their work, Altuncu et al. (2018) present an algorithm that combines doc2vec and ideas from graph theory to create a clustering procedure based on graphs. The algorithm can be implemented and tested for the domain of IT security to test a clustering approach that has not yet found its way into standard clustering libraries.
In the context of this work, a pre-trained SBERT model was used as well as a custom trained doc2vec model. In this area, there are still possibilities to optimize the models to the problem mentioned in the present work. Especially doc2vec achieves below average results in the evaluation, which can possibly be improved and extended by manual optimization.
The results of the evaluation and the resulting best clustering method can be made operable via a frontend. An additional feature can be wordmaps of the displayed clusters, which enrich the clusters with additional information. Additional functions for filtering words facilitate the identification of relevant threats and allow easy navigation through large amounts of data. Furthermore, future work can use the presented evaluation metrics to evaluate larger datasets with different clustering techniques.
Another aspect concerns the possibility of a combined parameter setting of the human and computer clustering methods. How can a computer assist a human in finding the appropriate parameters for a clustering procedure? Adding the human component greatly increases the range of possible clustering procedures. Another angle is “semi-supervised clustering,” in which the human helps the computer to match the clustering result to the requirements.
In one case, it was shown that dimension reduction prior to applying the clustering procedure can give a much better result. Future work can systematically investigate and evaluate the effects of dimension reduction on all vectorizations, distance measures, and clustering procedures.
It could be shown that the V-measure does not deal with outliers separately. Outliers detected by the clustering procedure are evaluated by the V-measure as a separate cluster. Thus, it is possible that data marked as clusters according to the gold standard and marked as outliers by a clustering procedure may still achieve good results with respect to the V-measure. A future question might address how to construct an external evaluation metric for the requirements posed in this work, so that an assignment of data points is penalized as an outlier.
With IT security in mind, the opportunity arises to optimize the grouping of the data through a combination of classification and clustering. A trained classifier could divide data points in advance into defined categories, such as phishing or exploit. Within these categories, the data is then grouped by a clustering process. A combination of classification and topic modeling is also possible.
In the post-processing steps, i.e., after clustering the data, various security-specific steps can be implemented. One possibility is to extract software versions and software manufacturers if software is mentioned in a threat message. In addition, there is a possibility to summarize whole clusters of data using text summarization (Text Summarization).
7. Conclusion
IT security threats and corresponding information are flooding CERTs, resulting in information overload. As CERTs work with time-critical information, they cannot pursue every piece of incoming information, since the information must be gathered, clustered, and processed manually (Hinchy, 2022; Gorzelak et al., 2011). Automated methods to support CERT staff are therefore necessary and wanted (Hinchy, 2022).
The present work aims to evaluate how IT security threat information can be clustered efficiently to reduce information overload. It evaluates different combinations of clustering methods, embeddings, and distance metrics. In order to select the clustering methods, requirements were established which must be met based on current studies (C1). Two datasets were used for evaluation, one containing threat reports, reflecting data that can be used by CERTs to respond to current threats (C2). The second dataset consists of news articles from different categories unrelated to IT security and serves as an opposing reference. The evaluated clustering methods are K-Means (Kodinariya and Makwana, 2013), OPTICS (Ankerst et al., 1999), and DBSTREAM (Hahsler and Bolaños, 2016). TF-IDF (Zong et al., 2021), doc2vec (Le and Mikolov, 2014), and SBERT (Reimers and Gurevych, 2019) were used to embed the data. Euclidean distance, cosine distance, and Manhattan distance were used as distance measures to determine groups. The clustering methods were evaluated by the external evaluation metrics homogeneity, completeness, and the harmonic mean of both, the V-Measure (Rosenberg and Hirschberg, 2007). All clustering methods were evaluated in the default configuration.
K-Means yields the best results on both datasets. However, regardless of the vectorization and distance measure used, DBSTREAM achieved the best average homogeneity scores, creating a high number of homogeneous clusters. OPTICS performs very well on the threat message dataset, but achieves poor results on the news dataset. TF-IDF embeddings dominate the threat report datasets, due to the unique naming of threats common in IT security, which is reflected in the embeddings. On the news dataset, SBERT has the best results on out of clustering methods because SBERT embeddings encode semantic similarities between texts. Across all clustering methods and embeddings, cosine distance yields the best results.
Hence, information overload for CERTs can be reduced by the K-Means clustering method with TF-IDF vectorization and cosine distance measure. Messages about the same threat are reliably clustered and due to the automatic determination of the number of clusters, the whole procedure works configuration-free. The TF-IDF vectorization must be performed again for all data in case of new threat messages, which requires archiving all threat messages. Embedding the data is significantly faster with TF-IDF than with doc2vec or SBERT. The proposed optimization of the custom-developed cluster determination can significantly reduce the runtime of the cluster determination, with further improvements possible. Similarly, the evaluation showed improvements which should be further investigated in future work.
Acknowledgements.
This work was supported by the German Federal Ministry for Education and Research (BMBF) in the project CYWARN (13N15407) and German Federal Ministry of Education and Research and the Hessian Ministry of Higher Education, Research, Science and the Arts within their joint support of the National Research Center for Applied Cybersecurity ATHENE.References
- (1)
- Abu et al. (2018) Md Sahrom Abu, Siti Rahayu Selamat, Aswami Ariffin, and Robiah Yusof. 2018. Cyber threat intelligence–issue and challenges. IJEECS ’18 (2018).
- Altuncu et al. (2018) M Tarik Altuncu, Sophia N Yaliraki, and Mauricio Barahona. 2018. Content-driven, unsupervised clustering of news articles through multiscale graph partitioning. (2018).
- Alves et al. (2021) Fernando Alves, Aurélien Bettini, Pedro M. Ferreira, and Alysson Bessani. 2021. Processing tweets for cybersecurity threat awareness. Information Systems ’21 (2021).
- Amigó et al. (2009) Enrique Amigó, Julio Gonzalo, Javier Artiles, and Felisa Verdejo. 2009. A comparison of extrinsic clustering evaluation metrics based on formal constraints. Information Retrieval ’09 (2009).
- Ankerst et al. (1999) Mihael Ankerst, Markus M Breunig, Hans-Peter Kriegel, and Jörg Sander. 1999. OPTICS: Ordering points to identify the clustering structure. SIGMOD Record ’99 (1999).
- Azevedo et al. (2019) Rui Azevedo, Iberia Medeiros, and Alysson Bessani. 2019. PURE: Generating quality threat intelligence by clustering and correlating OSINT. In TrustCom/BigDataSE ’19.
- Broder et al. (1997) Andrei Z. Broder, Steven C. Glassman, Mark S. Manasse, and Geoffrey Zweig. 1997. Syntactic clustering of the Web. ComNet ’97 (1997).
- Devlin et al. (2018) Jacob Devlin, Ming-Wei Chang, Kenton Lee, and Kristina Toutanova. 2018. BERT: Pre-training of Deep Bidirectional Transformers for Language Understanding. NAACL N’19 (2018).
- Gorzelak et al. (2011) Katarzyna Gorzelak, Tomasz Grudziecki, Paweł Jacewicz, Przemysław Jaroszewski, Łukasz Juszczyk, and Piotr Kijews. 2011. Proactive Detection of Network Security Incidents. Technical Report.
- Habib Gültekin (2020) Habib Gültekin. 2020. Kaggle BBC News Archive. https://www.kaggle.com/datasets/hgultekin/bbcnewsarchive
- Hahsler and Bolaños (2016) Michael Hahsler and Matthew Bolaños. 2016. Clustering data streams based on shared density between micro-clusters. IEEE Transactions on Knowledge and Data Engineering (2016).
- Harris (1954) Zellig S. Harris. 1954. Distributional Structure. WORD ’54 (1954).
- Hinchy (2022) Eoin Hinchy. 2022. Voice of the SOC Analyst. Technical Report. https://www.tines.com/reports/voice-of-the-soc-analyst/
- Hinton and Roweis (2002) Geoffrey E Hinton and Sam Roweis. 2002. Stochastic Neighbor Embedding. In NIPS ’02.
- Kodinariya and Makwana (2013) Trupti M Kodinariya and Prashant R Makwana. 2013. Review on determining number of Cluster in K-Means Clustering. IJSRCSAMS ’13 (2013).
- Le and Mikolov (2014) Quoc Le and Tomas Mikolov. 2014. Distributed Representations of Sentences and Documents. In ICML ’14.
- Lella et al. (2021) Ifigeneia Lella, Marianthi Theocharidou, Eleni Tsekmezoglou, and Apostolos Malatras. 2021. ENISA Threat Landscape 2021. Technical Report.
- Liao et al. (2016) Xiaojing Liao, Kan Yuan, Xiaofeng Wang, Zhou Li, Luyi Xing, and Raheem Beyah. 2016. Acing the IOC game: Toward automatic discovery and analysis of open-source cyber threat intelligence. In CCS ’16.
- MacQueen (1967) J. MacQueen. 1967. Some methods for classification and analysis of multivariate observations. Berkeley Symp. on Math. Statist. and Prob. ’67 (1967).
- Mikolov et al. (2013) Tomas Mikolov, Kai Chen, Greg Corrado, and Jeffrey Dean. 2013. Efficient Estimation of Word Representations in Vector Space. In ICLR ’13.
- Qader et al. (2019) Wisam A. Qader, Musa M. Ameen, and Bilal I. Ahmed. 2019. An Overview of Bag of Words;Importance, Implementation, Applications, and Challenges. In IEC ’19.
- Reimers and Gurevych (2019) Nils Reimers and Iryna Gurevych. 2019. Sentence-BERT: Sentence Embeddings using Siamese BERT-Networks. (2019).
- Rendón et al. (2011) Eréndira Rendón, Itzel Abundez, Alejandra Arizmendi, and Elvia M Quiroz. 2011. Internal versus external cluster validation indexes. IJCCC ’11 (2011).
- Rosenberg and Hirschberg (2007) Andrew Rosenberg and Julia Hirschberg. 2007. V-Measure: A Conditional Entropy-Based External Cluster Evaluation Measure. In EMNLP-CoNLL ’07.
- Skopik et al. (2016) Florian Skopik, Giuseppe Settanni, and Roman Fiedler. 2016. A problem shared is a problem halved: A survey on the dimensions of collective cyber defense through security information sharing. C&S ’16 (2016).
- Sun et al. (2019) Chi Sun, Xipeng Qiu, Yige Xu, and Xuanjing Huang. 2019. How to fine-tune bert for text classification?. In CCCL ’19.
- Suyal et al. (2014) Himanshu Suyal, Amit Panwar, and Ajit Singh Negi. 2014. Text Clustering Algorithms: A Review. IJCA ’14 (2014).
- Wagner et al. (2019) Thomas D. Wagner, Khaled Mahbub, Esther Palomar, and Ali E. Abdallah. 2019. Cyber threat intelligence sharing: Survey and research directions. C&S ’19 (2019).
- Xie and Xing (2013) Pengtao Xie and Eric P Xing. 2013. Integrating document clustering and topic modeling. (2013).
- Zong et al. (2021) Chengqing Zong, Rui Xia, and Jiajun Zhang. 2021. Text Data Mining. Springer.