Semantic Image Segmentation with Deep Learning for Vine Leaf Phenotyping
Abstract
Plant phenotyping refers to a quantitative description of the plant’s properties, however in image-based phenotyping analysis, our focus is primarily on the plant’s anatomical, ontogenetical and physiological properties. This technique reinforced by the success of Deep Learning in the field of image based analysis is applicable to a wide range of research areas making high-throughput screens of plants possible, reducing the time and effort needed for phenotypic characterization. In this study, we use Deep Learning methods (supervised and unsupervised learning based approaches) to semantically segment grapevine leaves images in order to develop an automated object detection (through segmentation) system for leaf phenotyping which will yield information regarding their structure and function. In these directions we studied several deep learning approaches with promising results as well as we reported some future challenging tasks in the area of precision agriculture. Our work contributes to plant lifecycle monitoring through which dynamic traits such as growth and development can be captured and quantified, targeted intervention and selective application of agrochemicals and grapevine variety identification which are key prerequisites in sustainable agriculture.
keywords:
Semantic segmentation, Grapevines, Phenotyping, Pattern recognition1 INTRODUCTION
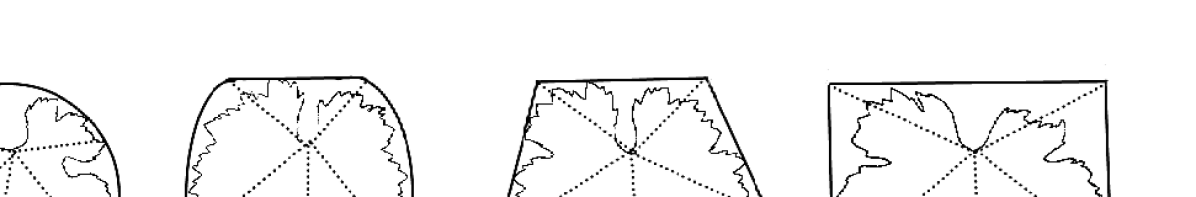
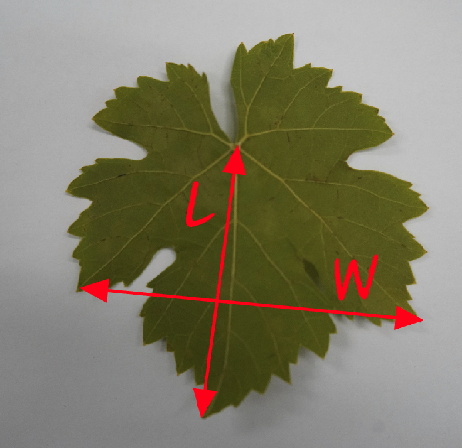
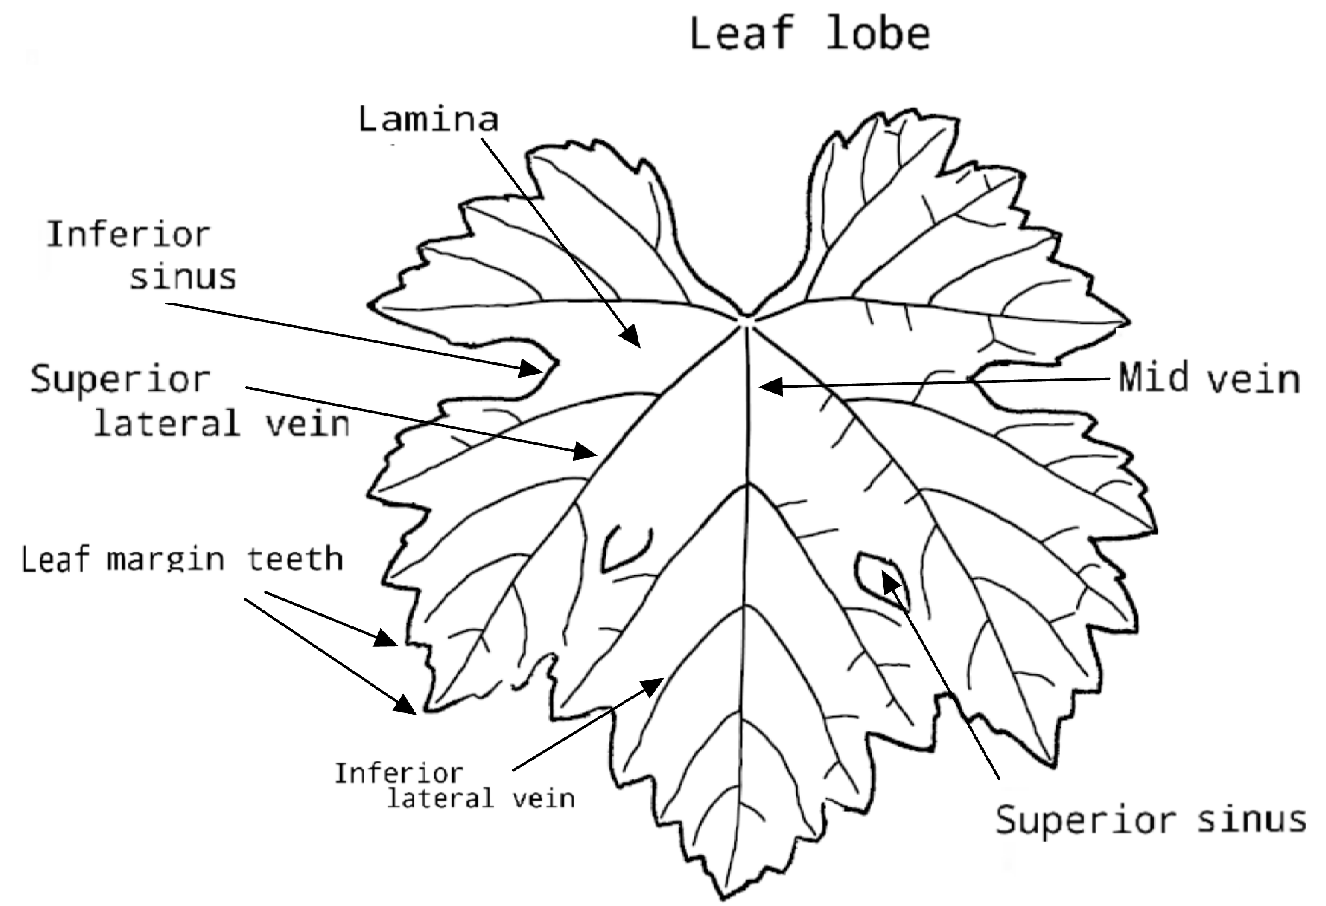
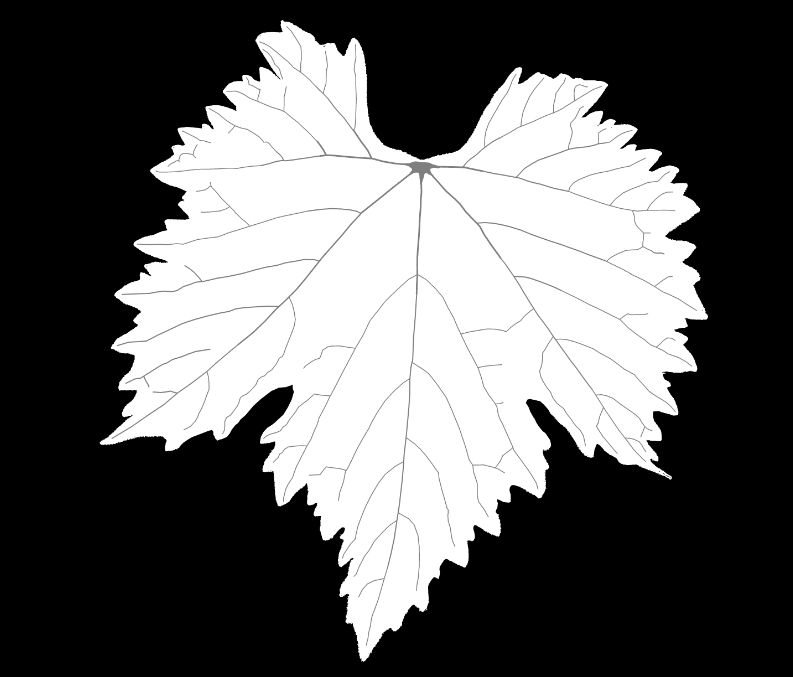
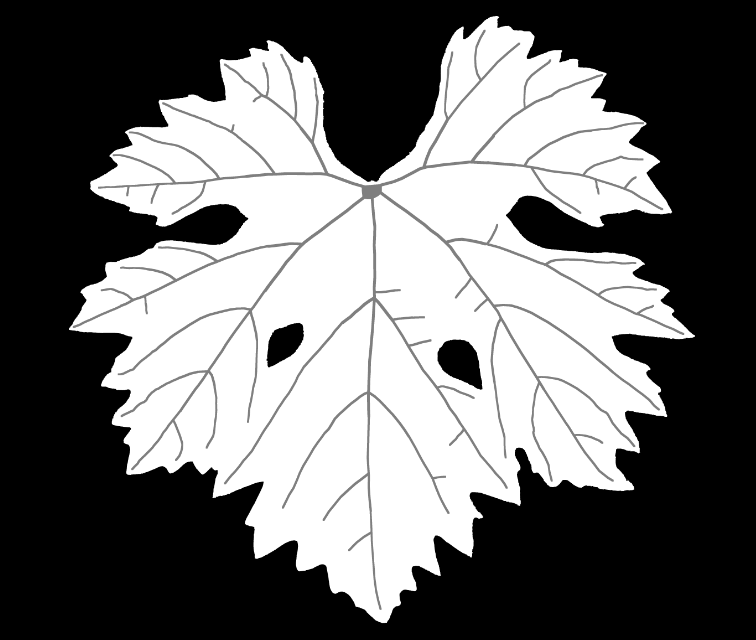
Recently, in the wine industry, there is growing interest in exploring the role and effect that grapevine varieties play in adaptation strategies against global warming (Gutiérrez-Gamboa et al., 2021b). In light of this, there is a need to ensure the genuiness of the plants in order to avoid planting the wrong material, which can result in considerable losses to viticulturists. The field of ampelography is concerned with identifying and classifying grapevine varieties using several parameters or descriptors (Soldavini et al., 2009; Garcia-Muñoz et al., 2011). It provides relevant morphological and agronomical information for varietal characterization studies, breeding programs and conservation purposes (Khalil et al., 2017). It is possible to distinguish grapevine varieties by the phenotypic features of their leaves, which are unique to each variety (Galet, 1998). More specifically, the features of the leaves are the following: geometrical shape of the leaf surface, perimeter of the leaf surface (Gutiérrez-Gamboa et al., 2021a), number of lobes, size of teeth, length of teeth, ratio length/width of teeth, shape of blade (Fig. 1), leaf length (L) and width (W) measurement (Fig. 2(a)) (Eftekhari and Kamkar, 2011), color of the upper side of blade, undulation of blade between main and lateral veins, general shape of petiole sinus, tooth at petiole sinus, petiole sinus limited by veins, shape of upper lateral sinus, depth of upper lateral sinus, shape of base, length of petiole compared to middle vein (IPGRI et al., 1997). Grapevine mature leaf’s parts are illustrated in Fig. 2(b).
Quantifying the dimensions of leaf veins and their structure has primarily relied on optical observation and empirical experience of domain experts i.e. agronomists, agriculturists, botanologists etc. However, due to the significantly high degree of complexity of vein networks, their intense color similarity with the overall leaf and the large number of various cultivated plants and their problems, even well trained experts of the area often fail to annotate successfully the over structure of the lead and are consequently led to mistaken conclusions.
Unfortunately, there exists no suitable empirical method to quantify physical vein network geometry with sufficient scope and resolution which makes the evaluation of the predicted vein network structure nearly impossible (Price, 2012). The development of an automated computational system that detects leaf vein network structure, in real-time, would offer a valuable tool in the hands of the agronomist who wishes to analyze such networks and formulate/evaluate hypotheses regarding their structure and function. Furthermore it can aid agricultural robots: unmanned ground and aerial vehicles will identify genetic traits, crop growth and plant diseases. Agribots equipped with such systems will observe and measure crop growth and inform on the fly about a plant’s performance against its predicted growth plan. In addition, the process of the automated leaf samples collection, plant harvesting and pruning through soft robotic arms (fingers), will be strengthened with more accurate and targeted actions.
This need spurred the development of a number of theoretical Machine Learning (ML) models that predict optimal vein network structures across a broad array of taxonomic groups, from mammals to plants. In particular, a number of empirical methods to quantify the vein network structure of plants, from roots, to xylem networks in shoots and within leaves have been developed.
Advances in automated plant handling and digital imaging along with the recent increases in computational power and the expansion of system memory capabilities now make it possible to use image-based analysis for plant phenotyping that allows for high-throughput characterization of the extracted plant traits and improved understanding of the adaptive and ecological significance of vessel bundle (veins) network structure.
2 RELATED WORK
The introduction of Deep Learning (DL) techniques into agriculture (Carranza-Rojas et al., 2017) began to take place in the context of precision agriculture. Traditional ML approaches that have been extensively adopted in the agricultural field, such as plant disease investigation and pest detection are gradually being replaced by more sophisticated techniques.The majority of which rely on some kind of image recognition/classification i.e. DL image processing, image-based phenotyping, including weed detection (Milioto et al., 2017), crop disease diagnosis (Mohanty et al., 2016; Bresilla et al., 2019), fruit detection (Ghosal et al., 2018), and many other applications as listed in the recent review (Kamilaris and Prenafeta-Boldú, 2018).
The notion that leaves are a major hydraulic bottleneck in plants (Sack and Holbrook, 2006), motivated attempts to model patterns of conductance (Cochard et al., 2004; Price et al., 2011) by measuring the geometry of veins. Vein network structure can influence photosynthesis via hydraulic efficiency, with recent work implicating vein density as a good predictor of photosynthetic rates (Brodribb et al., 2007; Sack and Frole, 2006). Leaf vein patterning is also associated with leaf shape in general, suggesting shared developmental pathways (Dengler and Kang, 2001). In Price et al. (2010), the authors developed a tool which produces descriptive statistics about the dimensions and positions of leaf veins and areoles by utilizing a series of thresholding, cleaning, and segmentation algorithms applied to images of leaf veins. An all‐inclusive software tool for mathematical and statistical calculations in plant growth analysis that calculates up to six of the most fundamental growth parameters according to a purely classical approach across one harvest‐interval was developed in (Hunt et al., 2002). Today the field has broadened its range from the initial characterization of single-plant traits in controlled conditions towards real-life applications of robust field techniques in plant plots and canopies (Walter et al., 2015).
Convolutional Neural Networks (CNN) (LeCun, 1989) have been used in image recognition with remarkable success and constitute one of the most powerful DL techniques for modeling complex processes such as pattern recognition in image based applications. Naturally, the majority of image-based approaches in precision agriculture are based on popular CNN architectures. In (Lee et al., 2015) the authors developed CNN architectures for automatic leaf-based plant recognition. Pawara et al. (2017) compared the performance of some conventional pattern recognition techniques with that of CNN models, in plant identification, using three different image-databases of either entire plants and fruits, or plant leaves, concluding that CNNs drastically outperform conventional methods. Grinblat et al. (2016) presented a simple, yet powerful Neural Network (NN) for the successful identification of three different legume species based on the morphological patterns of leave nerves. In their work, Dyrmann et al. (2016) presented a method that can recognize weeds and plant species using colored images. They used CNNs and tested a total 10.413 images of 22 weeds and crop species. Their model was able to achieve a classification accuracy of 86.2%. Mohanty et al. (2016) developed a smartphone-assisted disease diagnosis system by employing two state-of-the-art architectures: AlexNet (Krizhevsky et al., 2012) and GoogLeNet (Szegedy et al., 2015) and trained their model to identify 14 crop species and 26 diseases.
3 METHOD
Semantic image segmentation (Ronneberger et al., 2015; He et al., 2020; Long et al., 2015) is a popular image analyzing technique where each pixel is assigned to one from a set of predefined classes. It is a complex method that entails the description, categorization, and visualization of the regions of interest in an image contributing to complete scene understanding. Semantic segmentation models first determine the presence or not of the objects of interest in the picture and then classify object’s pixels to their corresponding class.
3.1 Dataset
At this part it should be highlighted that the data acquisition and dataset organization approach is targeted on small number of images. Our dataset consists of 24 images with dimensions 7,952x5,304 pixels of vine leaves that belong to cabernet chauvignon, mavroudi and merlot varieties, collected from an organic farm located in Alexandroupoli in Thrace, a region in northeastern Greece. Pictures of the collected leaves were taken by a Sony III camera model in a controlled environment, in laboratory under artificial lighting conditions. Collecting multiple unique and good quality images in organic vineyards is difficult, because they present multiple leaf damages. Natural lighting, variation in illumination, camera viewpoint, leaf clustering and wind conditions impede photo shooting even more. In addition to these reasons, for the Supervised Learning (SL) part of this study, dataset size was kept significantly small by design mainly because manual annotation of images is tedious and time consuming. Another, key objective was to examine the efficacy of a U-Net (Ronneberger et al., 2015) CNN architecture with as low available data as possible. For this reason, a small number of synthetic photos were acquired from the original ones by the use of image augmentation techniques (random rotation and random zoom) and repeated runs of increasing training/validation/test dataset size were examined (Table 2). It is a well known fact that most DL-based image segmentation studies suffer from the lack of annotated data. Training a NN on a small dataset has downsides such as reduced generalizing capabilities, but on the other hand, the low level of scene complexity and the controlled conditions under which the pictures were collected, produces a high degree of feature similarity which compensates for the lack of dataset size.
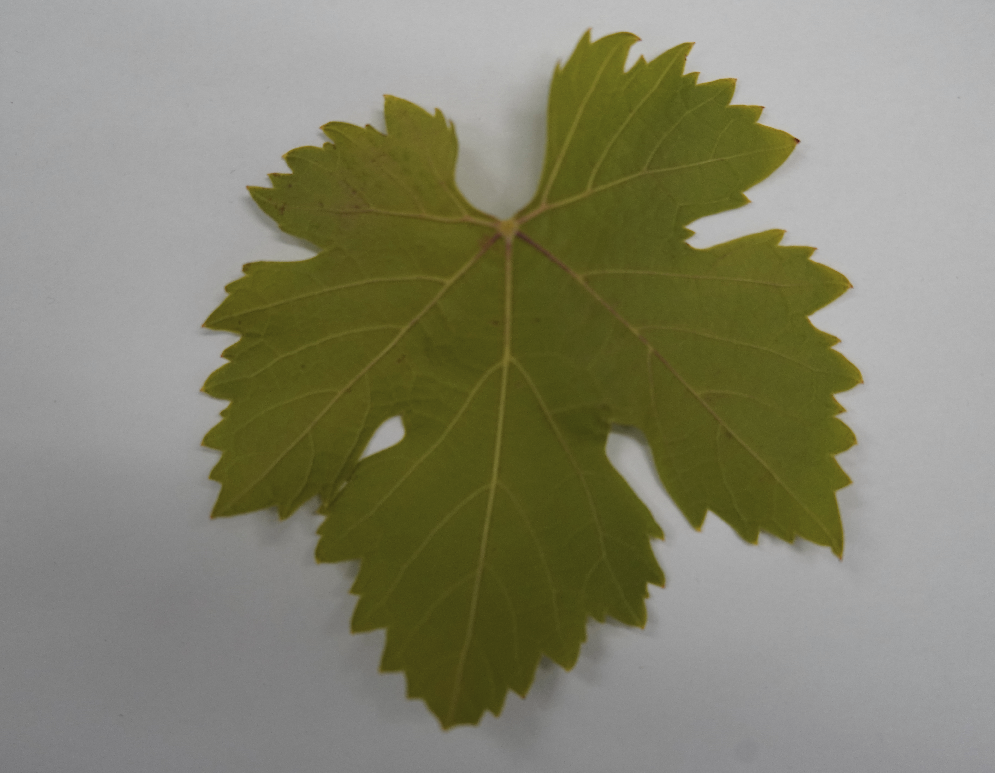

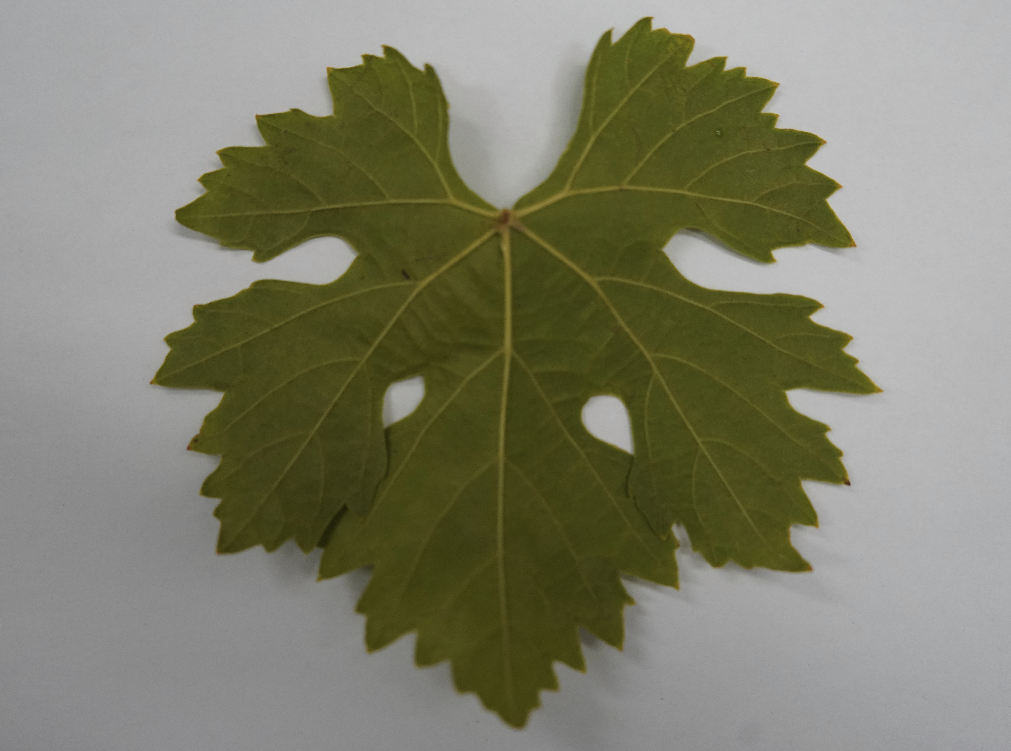
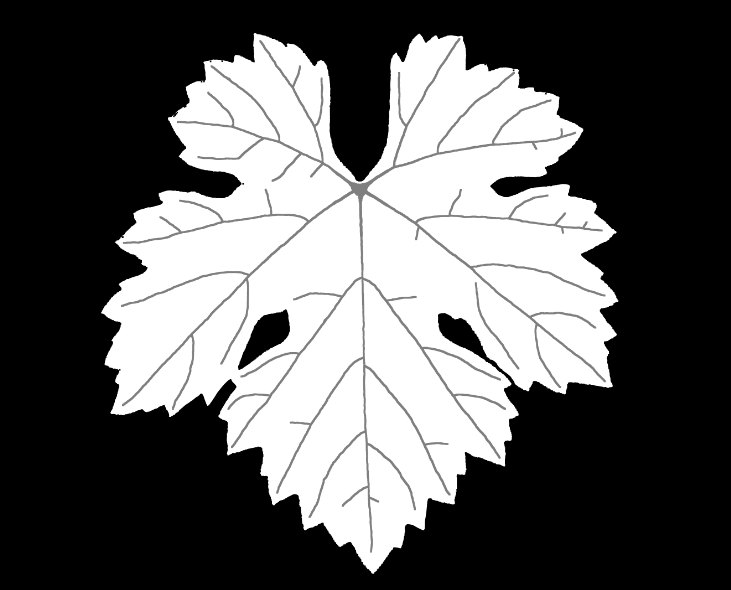
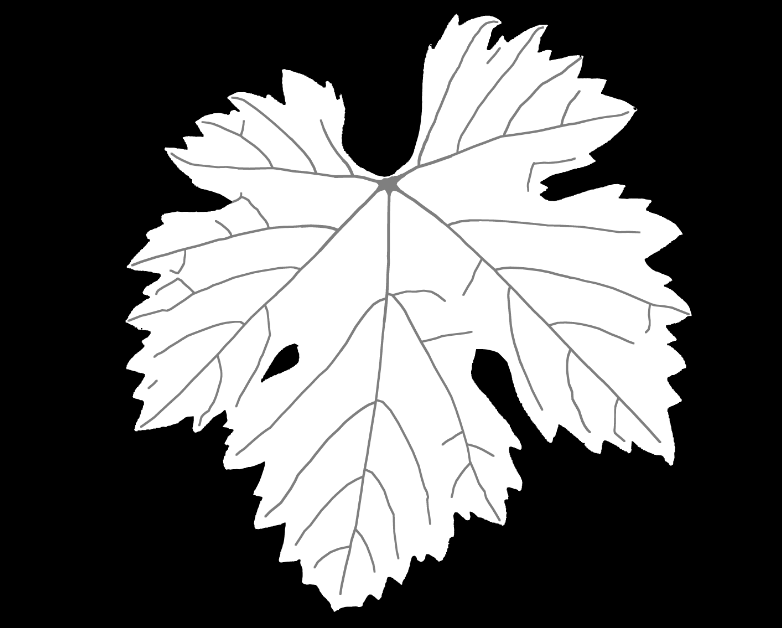
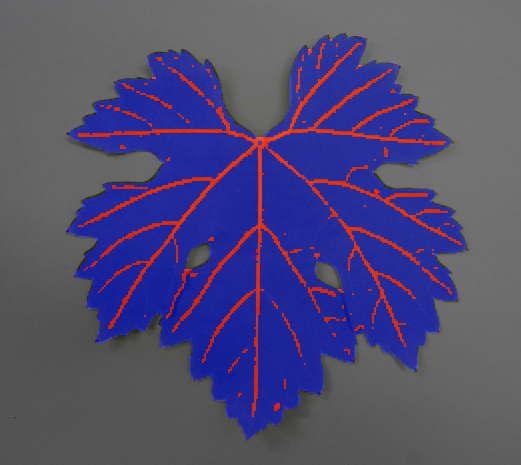
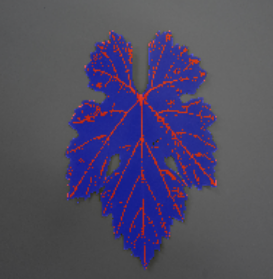
This research focused on two phenotypic characteristics: leaf veins and leaf blade, each one representing a different class. Our models’ task was to segment the images, singling out the aforementioned characteristics from the background. The dataset was annotated manually by the use of machine vision libraries such as OpenCV v4.5(Bradski, 2000) and GIMP v2.10 (The GIMP Development Team, 2019) which is an open source image manipulation software, following field expert’s guidelines and instructions, creating in this way for each image its corresponding trimap (Fig.3). An automated annotation pipeline through computer vision approaches (noise removal, morphological transformations, binary thresholding and edge detection) was also developed but the resulting images lacked the level of precision of the manually annotated ones.
3.2 Supervised learning based semantic segmentation
In this section we describe the adopted U-Net like, three different approaches, based on SL, which are:
-
•
design and train from scratch,
-
•
transfer learning and
-
•
parameterization of a popular architecture.
In our approaches the NN architectures are inspired and based on the typical U-Net architecture, each one with minor variations.
For the approach images are downsized to 544x800 pixels. The network implements the skipped connections between the downsampling and upsampling layer stacks and consists of double 32, 64, 128, 256, and 512-filtered Convolutional layer blocks. We used the Adam optimizer (Kingma and Ba, 2014) with a fixed learning rate of . The decoder part on the other hand is symmetrical to its contracting counterpart (Fig.4).
The same NN architecture through the transfer learning approach was tested in an attempt to examine if the use of pre-trained weights will yield better results ( approach). We exploited the MobileNetV2 (Sandler et al., 2018) as the encoder backbone which was pre-trained on ImageNet (Deng et al., 2009). The two models ( and approaches) differ in the input dimensions: for the second approach the original input (images sizes) are downsized to 224x224 pixels so as to fit the pre-trained weights.
The last approach () includes, also, a U-Net like architecture with skipped connections inspired from the X-ception (Chollet, 2017) architecture (Fig.5). This time the encoder/decoder consist of blocks of double Separable Convolutional layers of 32, 64 and 128 filters. In a typical U-Net model used for such tasks, an encoder’s layer residual is added to the input of its symmetric decoder layer whereas in this case each layer’s output is added to the next layer’s output.
3.3 Unsupervised learning based semantic segmentation
For Unsupervised Learning (UL) based image segmentation the model is not provided with the ground truth labels but instead learns by its self the distribution of pixel intensity levels in order to segment the image and group together pixels that share similar intensity values. This time the model is trained on a larger unlabeled dataset of 240 pictures without corresponding trimaps. The dataset is acquired from the original one (Section 3.1) by the use of image augmentation techniques (random rotation, random zoom etc.). The goal is to develop an UL based image segmentation architecture that will undertake segment labeling and relieve experts from the difficult and time-consuming process of annotation. The NN architecture is kept the same as before (UNet) but due to the lack of labeled targets, a different loss function is applied such as the one for the Fuzzy C-Means (FCM) (Bezdek, 1981; Bezdek et al., 1993) method:
where is a membership function for the pixel in the cluster, is the distance of pixel value at location from the class centroid , is the number of clusters and is the spatial domain of the image. The parameter is a weighting exponent on each fuzzy membership. Unlike K-Means clustering method where each pixel is assigned or not to a cluster, in FCM a pixel is assigned a membeship value for each cluster that can take any value in as long as: . By assigning the softmax output of our model to the membership functions, as is done in Chen et al. (2021), we obtain a differentiable loss function that depends only on the statistics of pixel intensity values. It also has to be mentioned that the number of clusters is predefined and set before training.
4 Results
To the best of our knowledge, up till now there exists no other study that addresses semantic segmentation of vine leaf phenotypic characteristics so there were no references available in the literature regarding optimum network architectures for the specific task or any results regarding accuracy and performance.
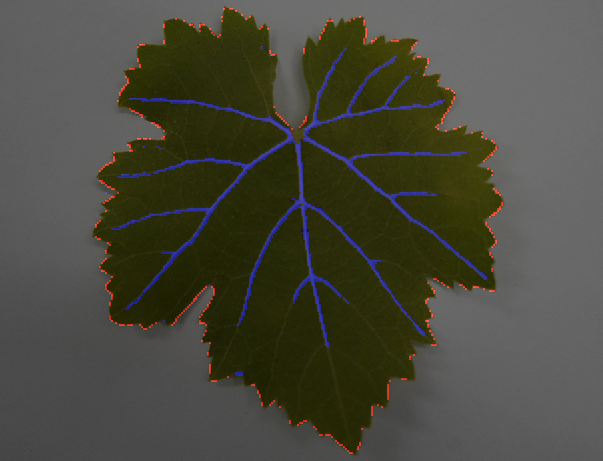
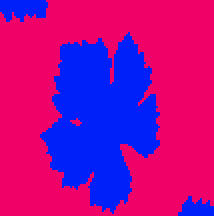
Since this is a pixel-wise classification problem, class representation has to be taken into account. It is clear that the classes are imbalanced (indicatively: vein max width 7px for a 544x800 photo) which poses a challenge for developing unbiased, accurate predictive models. This was obvious in models’ predictions: the models tend to predict well the blade leaf whereas fail to perform the same for leaf veins. In the majority of cases, veins were misclassified as part of the blade or as background (Fig. 6). For more downsized images (UNet-MobilNetV2) an opposite effect was observed were leaf blade pixels were misclassified as veins but in general image size had no major effect to results. To alleviate the problem, class weights inversely proportional to class size were introduced.
| Apr. | Model | PA | MeanIoU |
|---|---|---|---|
| 1 | UNet | 0.94 | 0.74 |
| 2 | UNet(MobileNetV2-weights) | 0.95 | 0.75 |
| 3 | UNet(Xception-like) | 0.92 | 0.58 |
Our SL based models’s performance reaches a plateau quite quickly showing satisfactory levels of Pixel Accuracy (PA) especially for the leaf veins, in contrast to other popular techniques like edge detection or thresholding which in addition require setting threshold values. For every model, we performed repeated runs experimenting on the hyperparameters and we concluded that validation set accuracy starts to rise around the epoch for training dataset sizes over 50 photos and 50 epochs were usually enough to yield satisfactory results. As an additional metric Intersection Over Union (IoU) was also used due to the fact that pixel accuracy can be misleading for imbalanced classification problems. Table 1 sum-ups the best training outcomes for all three approaches.
| Apr. | Dataset size | PA | IoU | ||
|---|---|---|---|---|---|
| (train/valid/test) | Bkgr | Veins | Blade | ||
| 1 | 12/4/4 | 0.73 | 0.62 | 0.012 | 0.0 |
| 2 | 24/4/4 | 0.58 | 0.75 | 0.03 | 0.0 |
| 3 | 36/5/4 | 0.72 | 0.62 | 0.0 | 0.0 |
| 4 | 48/6/6 | 0.72 | 0.76 | 0.0 | 0.0 |
| 5 | 60/8/8 | 0.96 | 0.98 | 0.28 | 0.88 |
| 6 | 72/12/10 | 0.97 | 0.98 | 0.31 | 0.93 |
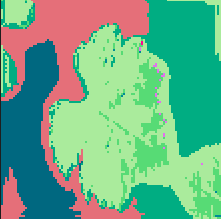
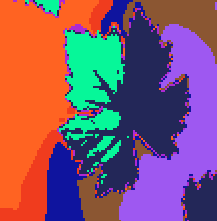
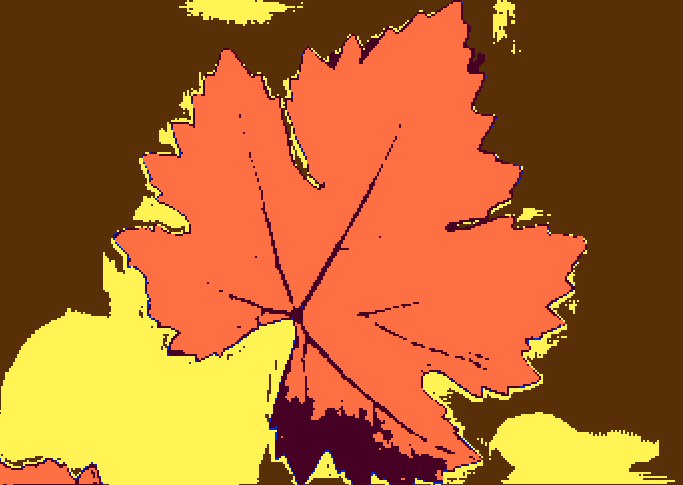
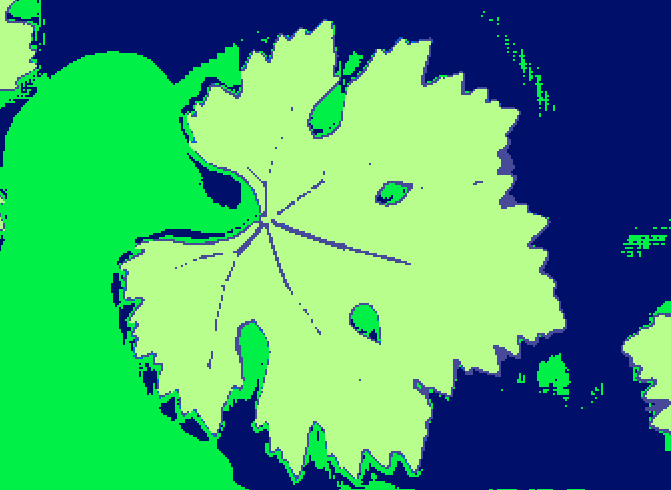
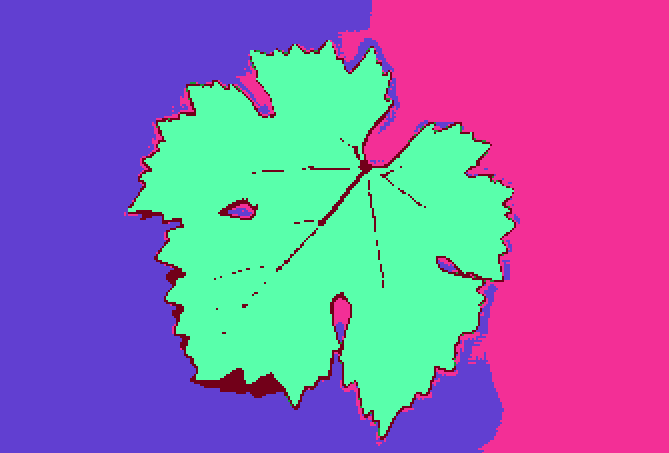
Group accuracy of the UL based approach is low especially in cases where there is no intense color shade difference between objects. As can be seen in Fig.7 the model manages to separate quite accurately the leaf blade from the background but fails to do the same for the leaf veins. This is clearly depicted in the metrics: experimenting for 3 classes (blade, leaf, background) the model achieves a very high IoU for leaf blade but underperforms for the veins (Table 3). Increasing the number of classes forces the model to segment the image into more groups and for classes 5 the veins start to stand out but are still inseparable from leaf blade regions (Fig.7).

| Region of interest | IoU | MeanIoU | |
|---|---|---|---|
| 1 | Leaf blade | 0.87 | 0.50 |
| 2 | Leaf veins | 0.001 | |
| 3 | Background | 0.57 |
Low contrast areas e.g. leaf blade and vein endings pose a problem because they share similar pixel value intensities to the point that inferior lateral veins are indistinguishable from the blade. The lack of feature richness is a common problem to image quality which can be mitigated by the application of image enhancement techniques (Hung et al., 2021). In an effort to improve performance we applied sigmoid correction to the images in the preprocessing stage which seems to slightly improve overall performance (Fig.8).
5 Conclusion
In this study we introduced a new computer vision and ML challenging task, the vine leaf segmentation for precision agriculture purposes: insitu needs, laboratory analysis and robotics. We developed a vine leaf semantic segmentation framework that detects two basic phenotypic characteristics: leaf veins and leaf blade. In this direction we provided some indicative preliminary solutions. Our NN trained on images taken under controlled conditions, performed adequately and achieved promising levels of prediction accuracy even with a very small training dataset. It has to be stressed that this study is still ongoing and towards these directions we are developing a service that will automatically detect the leaf’s characteristics and calculate quantities such as leaf width and length, number of superior lateral veins, blade area surface and vein to area ratio. The sparsity of well annotated data dictates the use of UL based semantic segmentation techniques and this is the direction our research interest is turning to. As a future work, apart from feature enhancement, we plan to tackle the low contrast regions problem by incorporating spatial and continuity constraints and asymmetric loss function variants e.g. focal loss. Furthermore, our interest focuses on developing a merging algorithm for over-segmented picture partitions that will improve segmentation accuracy.
Acknowledgements
We acknowledge support of this work by the project “AGRO4+” - Holistic approach to Agriculture 4.0 for new farmers” (MIS 5046239) which is implemented under the Action “Reinforcement of the Research and Innovation Infrastructure”, funded by the Operational Programme ”Competitiveness, Entrepreneurship and Innovation” (NSRF 2014-2020) and co-financed by Greece and the European Union (European Regional Development Fund).
References
- Bezdek (1981) Bezdek, J. (1981). Pattern Recognition With Fuzzy Objective Function Algorithms. Springer. 10.1007/978-1-4757-0450-1.
- Bezdek et al. (1993) Bezdek, J.C., Hall, L.O., and Clarke, L.P. (1993). Review of mr image segmentation techniques using pattern recognition. Medical physics, 20, 1033–48.
- Bradski (2000) Bradski, G. (2000). The OpenCV Library. Dr. Dobb’s Journal of Software Tools.
- Bresilla et al. (2019) Bresilla, K., Perulli, G., Boini, A., Morandi, B., Grappadelli, L., and Manfrini, L. (2019). Single-shot convolution neural networks for real-time fruit detection within the tree. Frontiers in Plant Science, 10. 10.3389/fpls.2019.00611.
- Brodribb et al. (2007) Brodribb, T., Feild, T., and Jordan, G. (2007). Leaf maximum photosynthetic rate and venation are linked by hydraulics. Plant physiology, 144, 1890–8. 10.1104/pp.107.101352.
- Carranza-Rojas et al. (2017) Carranza-Rojas, J., Goëau, H., Bonnet, P., Mata-Montero, E., and Joly, A. (2017). Going deeper in the automated identification of herbarium specimens. BMC Evolutionary Biology, 17. 10.1186/s12862-017-1014-z.
- Chen et al. (2021) Chen, J., Li, Y., Luna, L.P., Chung, H.W., Rowe, S.P., Du, Y., Solnes, L.B., and Frey, E.C. (2021). Learning fuzzy clustering for spect/ct segmentation via convolutional neural networks. Medical physics. 10.1002/mp.14903.
- Chollet (2017) Chollet, F. (2017). Xception: Deep learning with depthwise separable convolutions. 2017 IEEE Conference on Computer Vision and Pattern Recognition (CVPR), 1800–1807.
- Cochard et al. (2004) Cochard, H., Nardini, A., and Coll, L. (2004). Hydraulic architecture of leaf blades: Where is the main resistance? Plant, Cell and Environment, 27, 1257 – 1267. 10.1111/j.1365-3040.2004.01233.x.
- Deng et al. (2009) Deng, J., Dong, W., Socher, R., Li, L.J., Li, K., and Fei-Fei, L. (2009). Imagenet: A large-scale hierarchical image database. In 2009 IEEE Conference on Computer Vision and Pattern Recognition, 248–255. 10.1109/CVPR.2009.5206848.
- Dengler and Kang (2001) Dengler, N. and Kang, J. (2001). Vascular patterning and leaf shape. Current Opinion in Plant Biology, 4(1), 50–56. 10.1016/S1369-5266(00)00135-7.
- Dyrmann et al. (2016) Dyrmann, M., Karstoft, H., and Midtiby, H.S. (2016). Plant species classification using deep convolutional neural network. Biosystems Engineering, 151, 72–80. 10.1016/j.biosystemseng.2016.08.024.
- Eftekhari and Kamkar (2011) Eftekhari, M. and Kamkar, B. (2011). Prediction of leaf area in some iranian table grape (vitis vinifera l.) cutting by a non-destructive and simple method. Science Research Reporter, 1, 115–121.
- Galet (1998) Galet, P. (1998). Précis d’ampélographie pratique 7th ed. Galet,Pierre.
- Garcia-Muñoz et al. (2011) Garcia-Muñoz, S., Muñoz-Organero, G., de Andrés, M., and Cabello, F. (2011). Ampelography - an old technique with future uses: the case of minor varieties of vitis vinifera l. from the balearic islands. Journal International des Sciences de la Vigne et du Vin, 45, 125–137. 10.20870/oeno-one.2011.45.3.1497.
- Ghosal et al. (2018) Ghosal, S., Blystone, D., Singh, A., Ganapathysubramanian, B., Singh, A., and Sarkar, S. (2018). An explainable deep machine vision framework for plant stress phenotyping. Proceedings of the National Academy of Sciences, 115. 10.1073/pnas.1716999115.
- Grinblat et al. (2016) Grinblat, G.L., Uzal, L.C., Larese, M.G., and Granitto, P.M. (2016). Deep learning for plant identification using vein morphological patterns. Computers and Electronics in Agriculture, 127, 418–424. 10.1016/j.compag.2016.07.003.
- Gutiérrez-Gamboa et al. (2021a) Gutiérrez-Gamboa, G., Torres-Huerta, N., Araya-Alman, M., Verdugo-Vásquez, N., Moreno-Simunovic, Y., Valdés-Gómez, H., and Acevedo-Opazo, C. (2021a). Leaf morpho-colorimetric characterization of different grapevine varieties through changes on plant water status. Horticulturae, 7(9). 10.3390/horticulturae7090315.
- Gutiérrez-Gamboa et al. (2021b) Gutiérrez-Gamboa, G., Zheng, W., and Martínez de Toda, F. (2021b). Current viticultural techniques to mitigate the effects of global warming on grape and wine quality: A comprehensive review. Food Research International, 139, 109946. 10.1016/j.foodres.2020.109946.
- He et al. (2020) He, K., Gkioxari, G., Dollar, P., and Girshick, R. (2020). Mask r-cnn. IEEE Transactions on Pattern Analysis & Machine Intelligence, 42(02), 386–397. 10.1109/TPAMI.2018.2844175.
- Hung et al. (2021) Hung, S.C., Wu, H.C., and Tseng, M.H. (2021). Integrating image quality enhancement methods and deep learning techniques for remote sensing scene classification. Applied Sciences, 11(24). 10.3390/app112411659. URL https://www.mdpi.com/2076-3417/11/24/11659.
- Hunt et al. (2002) Hunt, R., Causton, D.R., Shipley, B., and Askew, A.P. (2002). A modern tool for classical plant growth analysis. Annals of Botany, 90(4), 485–488. 10.1093/aob/mcf214.
- IPGRI et al. (1997) IPGRI, UPOV, and OIV (1997). Descriptors for Grapevine (Vitis spp.). IPGRI and UPOV and OIV. URL http://www.cgiar.org/ipgri/.
- Kamilaris and Prenafeta-Boldú (2018) Kamilaris, A. and Prenafeta-Boldú, F.X. (2018). Deep learning in agriculture: A survey. Computers and Electronics in Agriculture, 147, 70–90. https://doi.org/10.1016/j.compag.2018.02.016.
- Khalil et al. (2017) Khalil, S., Tello, J., Hamed, F., and Forneck, A. (2017). A multivariate approach for the ampelographic discrimination of grapevine (vitis vinifera) cultivars: application to local syrian genetic resources. Genetic Resources and Crop Evolution. 10.1007/s10722-017-0561-x.
- Kingma and Ba (2014) Kingma, D. and Ba, J. (2014). Adam: A method for stochastic optimization. International Conference on Learning Representations.
- Krizhevsky et al. (2012) Krizhevsky, A., Sutskever, I., and Hinton, G. (2012). Imagenet classification with deep convolutional neural networks. Neural Information Processing Systems, 25. 10.1145/3065386.
- LeCun (1989) LeCun, Y. (1989). Generalization and network design strategies. In R. Pfeifer, Z. Schreter, F. Fogelman, and L. Steels (eds.), Connectionism in Perspective. Elsevier, Zurich, Switzerland.
- Lee et al. (2015) Lee, S.H., Chan, C.S., Wilkin, P., and Remagnino, P. (2015). Deep-plant: Plant identification with convolutional neural networks. In 2015 IEEE International Conference on Image Processing (ICIP), 452–456. 10.1109/ICIP.2015.7350839.
- Long et al. (2015) Long, J., Shelhamer, E., and Darrell, T. (2015). Fully convolutional networks for semantic segmentation. In 2015 IEEE Conference on Computer Vision and Pattern Recognition (CVPR), 3431–3440. IEEE Computer Society, Los Alamitos, CA, USA. 10.1109/CVPR.2015.7298965.
- Milioto et al. (2017) Milioto, A., Lottes, P., and Stachniss, C. (2017). Real time blob wise sugar beets vs weeds classification for monitoring fields using convolutional neural networks. ISPRS Annals of Photogrammetry, Remote Sensing and Spatial Information Sciences, IV-2/W3, 41–48. 10.5194/isprs-annals-IV-2-W3-41-2017.
- Mohanty et al. (2016) Mohanty, S.P., Hughes, D.P., and Salathé, M. (2016). Using deep learning for image-based plant disease detection. Frontiers in Plant Science, 7, 1419. 10.3389/fpls.2016.01419.
- Pawara et al. (2017) Pawara, P., Okafor, E., Surinta, O., Schomaker, L., and Wiering, M. (2017). Comparing local descriptors and bags of visual words to deep convolutional neural networks for plant recognition. In ICPRAM. 10.5220/0006196204790486.
- Price et al. (2011) Price, C., Wing, S., and Weitz, J. (2011). Scaling and structure of dicotyledonous leaf venation networks. Ecology letters, 15, 87–95. 10.1111/j.1461-0248.2011.01712.x.
- Price (2012) Price, C.A. (2012). LEAF GUI: Analyzing the Geometry of Veins and Areoles Using Image Segmentation Algorithms, 41–49. Humana Press, Totowa, NJ. 10.1007/978-1-61779-995-2_4.
- Price et al. (2010) Price, C.A., Symonova, O., Mileyko, Y., Hilley, T., and Weitz, J.S. (2010). Leaf extraction and analysis framework graphical user interface: Segmenting and analyzing the structure of leaf veins and areoles. Plant Physiology, 155(1), 236–245. 10.1104/pp.110.162834.
- Ronneberger et al. (2015) Ronneberger, O., Fischer, P., and Brox, T. (2015). U-net: Convolutional networks for biomedical image segmentation. In N. Navab, J. Hornegger, W.M. Wells, and A.F. Frangi (eds.), Medical Image Computing and Computer-Assisted Intervention – MICCAI 2015, 234–241. Springer International Publishing, Cham. 10.1007/978-3-319-24574-4_28.
- Sack and Frole (2006) Sack, L. and Frole, K. (2006). Leaf structural diversity is related to hydraulic capacity in tropical rain forest trees. Ecology, 87, 483–91. 10.1890/05-0710.
- Sack and Holbrook (2006) Sack, L. and Holbrook, N.M. (2006). Leaf hydraulics. Annual Review of Plant Biology, 57(1), 361–381. 10.1146/annurev.arplant.56.032604.144141.
- Sandler et al. (2018) Sandler, M., Howard, A., Zhu, M., Zhmoginov, A., and Chen, L.C. (2018). The ieee conference on computer vision and pattern recognition (cvpr). In 2009 IEEE Conference on Computer Vision and Pattern Recognition, 4510–4520. 10.1109/CVPR.2018.00474.
- Soldavini et al. (2009) Soldavini, C., Stefanini, M., Dallaserra, M., Policarpo, M., and Schneider, A. (2009). Super ampelo, a software for ampelometric and ampelographic descriptions in vitis. In Super ampelo, a software for ampelometric and ampelographic descriptions in vitis, volume 827, 253–258. 10.17660/ActaHortic.2009.827.43.
- Szegedy et al. (2015) Szegedy, C., Vanhoucke, V., Ioffe, S., Shlens, J., and Wojna, Z. (2015). Rethinking the inception architecture for computer vision. CoRR, abs/1512.00567. URL http://arxiv.org/abs/1512.00567.
- The GIMP Development Team (2019) The GIMP Development Team (2019). Gimp. URL https://www.gimp.org.
- Walter et al. (2015) Walter, A., Liebisch, F., and Hund, A. (2015). Plant phenotyping: from bean weighing to image analysis. Plant Methods, 11. 10.1186/s13007-015-0056-8.