Electrochemical Shot Noise of a Redox Monolayer
Abstract
Redox monolayers are the base for a wide variety of devices including high-frequency molecular diodes or biomolecular sensors. We introduce a formalism to describe the electrochemical shot noise of such monolayer, confirmed experimentally at room temperature in liquid. The proposed method, carried out at equilibrium, avoids parasitic capacitance, increases the sensitivity and allows to obtain quantitative information such as the electronic coupling (or standard electron transfer rates), its dispersion and the number of molecules. Unlike in solid-state physics, the homogeneity in energy levels and transfer rates in the monolayer yields a Lorentzian spectrum. This first step for shot noise studies in molecular electrochemical systems opens perspectives for quantum transport studies in liquid environment at room temperature as well as highly sensitive measurements for bioelectrochemical sensors.
Self-assembled monolayers (SAM) composed of nanometric-long redox molecules are building blocks for molecular electronics and electrochemistry. They can behave as molecular diodes operating at ultra-high-frequency (potentially as rectenna in the visible spectrum) [1, 2], with on-off ratio breaking the Landauer limit [3, 4], and show interesting features such as signatures of collective quantum interference effects at room temperature [5, 6, 7]. In addition, their operation in liquid offers a direct link between quantum transport and electrochemistry [8, 9, 10] that provides unique opportunities. For example, the nanoscale measurements of electrochemical signals remains extremely challenging while key to the development of nanobiosensors [11]. Several approaches have been explored to tackle the challenge, using redox cycling [12], high frequency measurements [13] and fluorescence [14]. The underlying challenges rise from the presence of parasitic capacitances and from the fact that under typical measurements conditions, the current scales with the sensor area, leading to difficulties in retrieving the signal with micro- and nanoscale electrodes. Simultaneously, these systems offer unique properties as quantum devices. Probably the most intriguing aspect for the solid-state physics community is the potential for millions of single-energy level quantum dots simultaneously operating at room temperature, with extremely small dispersion, tunable electronic coupling [15] and Frank Condon effect [16].
We propose here to exploit and formalize the shot noise induced by reversible single electron transfers of electroactive molecules attached to an electrode as a new, very sensitive electrochemical technique and as a way to characterize the homogeneity in the electronic properties of these assembled molecular quantum dots. shot noise has been extensively studied in solid-state physics [17] and more recently in molecular electronics [18, 19], but not in electrochemistry, except for the shot noise due to a variation of the number of molecules in a nanogap [20, 21, 22, 23]. Such measurements are usually challenging because of the ubiquitous noise (e.g. in solid-state physics [24], quantum transport [25], molecular electronics [26] or in liquid [27]) which is typically circumvented by low-temperature measurements and by measurements at higher relative frequencies.
The noise is here not dominant thanks to the well-defined energy level and electron transfer rates of the redox molecules of the monolayer, allowing to study its low-frequency shot noise arising from the sum of single-electrons trapping/detrapping events to each molecule with a narrow distribution in time constants. A simple and straight-forward equation of the shot noise is proposed, giving direct access to the distribution of the charge transfer rates and the number of charge carriers. This approach provides clearly readable signals even when faradaic currents become unmeasurable, avoids the parasitic capacitance issue and allows for measurements without extra excitation other than the thermal noise.
Electroactive redox molecules can be seen as single-electron quantum dots with extremely small energy dispersion, even in liquid and at ambient temperature [5]. The equilibrium reaction of an ideally reversible redox couple M+/M attached to a metallic electrode and held at a distance from the electrode (insets Figure 1 (a)) can be written as:
M ¡=¿[k_ox][k_red] M^+ + e^-
Using the Marcus-Hush formalism to describe the electron transfer rates gives [28]:
| (1) |
with the oxidation rate, the reduction rate, the density of state in the metallic electrode, the electronic coupling, the reduced Planck constant, the reorganization energy (Frank Condon effect due to water molecules reorganizing after charging the redox molecule), the temperature, the Boltzmann constant and with the potential at the electrode, the standard potential of the molecule and the elementary charge. Eq.1 is analogue to the Landauer formalism in solid-state physics [8]. The specificity of the redox molecules is their energy level broadening due to the large reorganization energy. Eq.1 can be simplified to Eq. 2 3 (Buttler-Volmer model) when which is often the case. It will be used here initially for its simplicity.
| (2) | ||||
| (3) |
with the tunneling decay coefficient (1 Å-1), the charge transfer coefficient and the standard electron transfer rate at a distance = 0 (in s-1). The exponential decay part is formally contained in the electronic coupling term in Eq. 1 but is usually extracted for convenience to be included in the Butler-Volmer model [28].
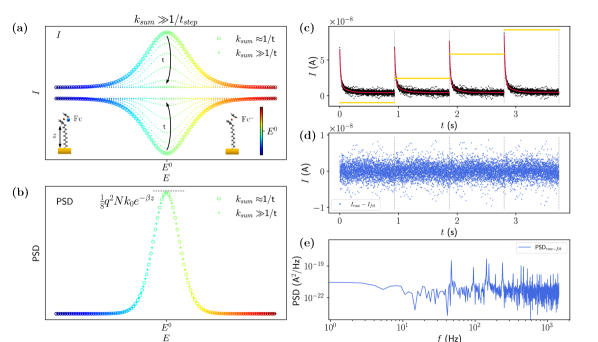
Sampled current staircase voltammetry (SCV) is the electrochemical technique used to interrogate the surface-attached redox species [29], analogue to the charge pumping technique in semiconductors [30]. The electrode potential is raised in small steps of height , and the current is recorded as a function of time, up to a time , corresponding to the steps duration (Figure 1 (c)).
The current , in the case of slow scan rate and long sampling time (i.e. ), can be expressed as (details in SM):
| (4) |
with the total number of molecules and the voltage scan rate.
Note that such current represents the transition of the charges at a certain scan rate, and not an equilibrium value of the current at a given potential. Figure 1 (a) shows versus applied voltage at a given scan rate and at different times after the voltage step, exhibiting a quick decrease of amplitude.
One way to consider the noise of the current versus time (Figure 1 (b)) is to look at its power spectrum density (PSD, noted in equations). The PSD (Figure 1 (b) and (e)) can be seen as a description of how the variance of the measured signal is spread in the frequency domain. The system under study has two-states related to the oxidized/reduced states of the molecules, here attached to a single electrode. Each molecule is expected to lead to the so-called Random Telegraph Signal (RTS) which is a shot noise due to individual transfer of electrons in and out of the single-electron boxes. To avoid confusion, in such a single-electrode system, the shot noise is not expected to be compared to because at equilibrium, where both oxidation and reduction reactions compensate each other, while (discussion in SM) [31]. In general, RTS is typically associated with noise due to the wide range of energy levels and electron transfer rates[32, 33]. However, an ensemble of reversible redox couples, like those found in a redox SAM in liquid, can be thought of as an ensemble of quantum dots with very similar energy levels because the molecules that make up the SAM have strictly identical atomic structures and may differ only in their orientation relative to the surface[5]. Assuming first that all molecules have identical energy levels and charge transfer rates / for oxidation/reduction, respectively, the PSD can be expressed as [32]:
| (5) |
with the frequency and the current corresponding to the oxidation (or reduction) of one molecule. If we consider as the transfer of one electron of charge per the average time taken for transferring one electron (i.e., ), can be rewritten as:
| (6) |
which becomes at low frequency (assuming ):
| (7) | ||||
| (8) |
This equation expresses the dependence of the low frequency electrochemical shot noise of the redox SAM versus the electrode potential. The corresponding curve is plotted in Figure 1 (b). Similarly to current SCV signals, it presents a peak at , but narrower than that of the SCV peak, with a full width at half-maximum (FWHM):
| (9) |
Note that unlike the current, does not depend on as the PSD is considered for a system at equilibrium. is also independent of the potential scan direction. Interestingly, the limiting cases of and give access to the electron transfer rate and the total number of molecules .
| (10) |
with the corner frequency :
| (11) |
The main result of the present work is Eq. 11, linking directly and simply and to the noise measured at low frequency for . Provided the corner frequency of the PSD can be measured (Figure LABEL:SM_FFT (b)), the individual values of and are obtained from Eq. 10 and Eq. 11. Alternatively, if is known independently, can be straightforwardly derived from at (Eq. 11).
To demonstrate the validity of the previous analysis, an experiment is set using ferrocene undecanethiol Fc(CH2)11SH self-assembled on a gold microelectrode. A two-electrode electrochemical cell setup is used in a Faraday cage, using a [NaClO4]=0.5 M aqueous electrolyte and a Ag/AgCl electrode (3 M NaCl) acting as both reference and counter electrode. Details about the sample preparation and the measurement setup can be found in Supplementary Materials (Figure LABEL:map_electrodes and LABEL:SM_measurement_setup). The system is interrogated using staircase voltammetry (Figure 1 (c)), which is equivalent to linear cyclic voltammetry (CV) at slow scan rates [34]. Our motivation is to offer a comparison of the well-known technique of cyclic voltammetry with the results obtained looking at the shot noise of the system.
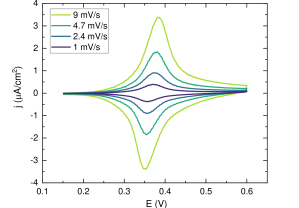
The Figure 2 shows an example of current CVs at different (low) scan rates . The signal is centered around a potential value of V vs Ag/AgCl, which corresponds to the expected standard potential for such surface-attached Fc molecules [35, 36, 37]. The density is estimated here at 4.2 mol/cm2, close to the values reported in the literature for packed SAMs ( mol/cm2) [38, 1]. The peak current of the CV exhibit the usual behavior for a surface-confined reversible couple, with a linear dependency of the current versus (example data Figure LABEL:SM_sweeprates).
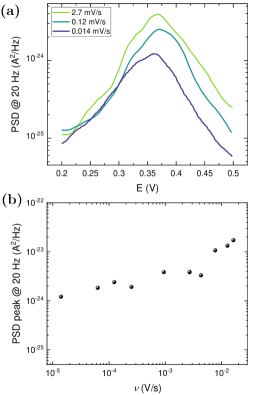
PSD signals were measured at several scan rates (see details in SM), their magnitude at 20 Hz versus (called “voltnoisogram” for concision) shown in Figure 3 (a), (full set Figure LABEL:SM_sweeprates_PSD). Similar data without the Fc molecules can be found in Figure LABEL:SM_C11. The PSD voltnoisograms behave as expected with a peak-shaped curve centered around V, close to the standard potential of Fc. As predicted from Eq. 8, the peak value of the PSD voltnoisograms (Figure 3 (b)) remains quasi-constant for mV/s (see details in SM Figure 3).
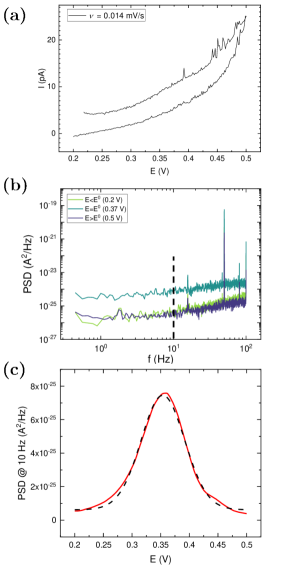
Figure 4 (a) shows a cyclic voltammetry (CV) scan at mV/s where no faradaic current signal can be identified. Figure 4 (b) shows power spectral density (PSD) values at , and on the forward scan. Figure 4 (c) shows the variation of PSD at 10 Hz as a function of the voltage, showing a clear peak. These results demonstrate the ability to detect an electrochemical reaction at an electrode through shot noise measurements, even when the average current signal from the CV does not show any reaction. The number of molecules is calculated from the CV data at higher scan rates (Figure LABEL:SM_sweeprates), and using this value and Eq. 11, the peak amplitude of PSD data shown in Figure 3 yields s-1 ( nm) is in good agreement with literature values for this molecule[15, 20].
The FWHM of the PSD peaks on Figure 4 is mV, broader than the 56 mV predicted by Eq. 9. Taking in the Eq. 1 gives an expression for , notably showing dependencies with and [28]. Previous work [15] showed that variation of lambda within physically reasonable limits do not significantly impact the electron transfer rates. However, the electronic coupling term typically varies following lognormal distributions [5] and can impact significantly the resulting value of with variations of just a few percent of its average value (see Figure LABEL:k0_dist & LABEL:PSD_dist). If a lognormal distribution of the fluctuation of (and thus, of as well) is assumed, a standard deviation of , comparable to what was reported in ref [5] (), can explain the broadening observed in PSD (Figure 4 (c) dashed line).
There is a significant difference between molecular monolayers in liquid and solid-state devices in terms of electrostatic forces. In the first case, the electrostatic interactions between neighboring molecules are greatly reduced thanks to the high permittivity of water. Previous research on coulomb repulsion (Eq. 12) within similar Fc SAMs showed negligible impact on current CV [5, 39].
| (12) |
with the intermolecular distance, the distance to counter ions, the permittivity of the vacuum and the permittivity of the medium under consideration. Taking the same formalism and distribution of as in [5] for but changing to results in variations of from 1% to 45% respectively (see Figure LABEL:phi_H2O & LABEL:phi_SiO2). As a result the screening of electrostatic interaction by water avoids a dispersion of the energy levels, such as the one observed in nanotransistors [33], and thus, avoids the domination of a noise resulting from the sum of multiple Lorentzian spectra with different amplitude/corner frequencies.
In conclusion, we demonstrated the measurement of the shot noise generated by an ensemble of surface-attached Fc redox molecules, which can be seen as identical single-electron boxes, in liquid and in ambient conditions. A formalism is proposed to understand it and exhibit dependencies between such noise and electronic coupling. This constitutes a further step toward nanoelectrochemistry and single molecule measurements, which could be practically achieved using our technique combined with a transducer such as a nanotransistor and be extended to other systems such as quantum dots monolayer [40].
Our technique allows for the measurement of electron transfer rates at low frequencies without the need for highly time-resolved instrumentation. Although we compared our technique with traditional voltammetry techniques, exhibiting a clear signal in PSD when tended to zero, the very concept of “potential scan” is actually not required to perform noise measurements. As few as two points at potentials far from and one at can suffice to resolve the eventual background noise of the experiment and the noise due to the attached molecule, yielding and provided the knowledge of and . Concurrently, since the measurements is carried out at equilibrium, capacitive contributions are altogether avoided, improving the signal and simplifying drastically the interpretation of the data. This opens perspectives in the field of biosensors [11], where the limit of detection of existing techniques could be further extended by shot noise analysis, and in high-frequency molecular diodes, where the electron transfer rate can be estimated through the low-frequency noise.
I Acknowledgments
Acknowledgements.
This work has been supported by the EU-ATTRACT project (Unicorn-Dx), the French “Agence Nationale de la Recherche”(ANR) through the “SIBI” project (ANR-19-CE42-0011-01) and the JSPS Core-to-Core Program (JPJSCCA20190006).S.G designed the acquisition system, conducted the experiments and data analysis and developed the theory, S.L. fabricated the devices, L.J. designed the acquisition system, SH. K. and A.C. contributed to the scientific interactions on electrochemistry, C.D. and N.C. conceived and supervised the whole project. All authors actively contributed to the discussions and the writing of the paper.
References
- Trasobares et al. [2016] J. Trasobares, D. Vuillaume, D. Théron, and N. Clément, Nature Communications 7, 12850 (2016).
- Reynaud et al. [2020] C. Reynaud, D. Duché, J.-J. Simon, E. Sanchez-Adaime, O. Margeat, J. Ackermann, V. Jangid, C. Lebouin, D. Brunel, F. Dumur, D. Gigmes, G. Berginc, C. Nijhuis, and L. Escoubas, Progress in Quantum Electronics 72, 100265 (2020).
- Clement and Fujiwara [2017] N. Clement and A. Fujiwara, Nature Nanotechnology 12, 725 (2017).
- Chen et al. [2017] X. Chen, M. Roemer, L. Yuan, W. Du, D. Thompson, E. del Barco, and C. A. Nijhuis, Nature Nanotechnology 12, 797 (2017), number: 8 ZSCC: NoCitationData[s0].
- Trasobares et al. [2017] J. Trasobares, J. Rech, T. Jonckheere, T. Martin, O. Aleveque, E. Levillain, V. Diez-Cabanes, Y. Olivier, J. Cornil, J. P. Nys, R. Sivakumarasamy, K. Smaali, P. Leclere, A. Fujiwara, D. Théron, D. Vuillaume, and N. Clément, Nano Letters 17, 3215 (2017).
- Li et al. [2022a] Y. Li, D. Wang, W. Peng, L. Jiang, X. Yu, D. Thompson, and C. A. Nijhuis, Nano Today 44, 101497 (2022a).
- Gehring et al. [2019] P. Gehring, J. M. Thijssen, and H. S. J. van der Zant, Nature Reviews Physics 1, 381 (2019).
- Bevan et al. [2016] K. H. Bevan, M. S. Hossain, A. Iqbal, and Z. Wang, The Journal of Physical Chemistry C 120, 179 (2016).
- Nitzan and Ratner [2003] A. Nitzan and M. A. Ratner, Science 300, 1384 (2003).
- Marcus [1956] R. A. Marcus, The Journal of Chemical Physics 24, 966 (1956).
- Li et al. [2022b] S. Li, Y. Coffinier, C. Lagadec, F. Cleri, K. Nishiguchi, A. Fujiwara, T. Fujii, S.-H. Kim, and N. Clément, Biosensors and Bioelectronics 216, 114643 (2022b).
- Fan et al. [1996] F.-R. F. Fan, J. Kwak, and A. J. Bard, Journal of the American Chemical Society , 7 (1996).
- Grall et al. [2021] S. Grall, I. Alić, E. Pavoni, M. Awadein, T. Fujii, S. Müllegger, M. Farina, N. Clément, and G. Gramse, Small 17, 2101253 (2021).
- Huang et al. [2015] S. Huang, M. Romero-Ruiz, O. K. Castell, H. Bayley, and M. I. Wallace, Nature Nanotechnology 10, 986 (2015).
- Chidsey [1991] C. E. D. Chidsey, Science 251, 919 (1991).
- Demaille et al. [2022] C. Demaille, N. Clément, A. Chovin, S. H. Kim, and Z. Zheng, ChemXiv 10.26434/chemrxiv-2022-212hs (2022), preprint.
- Blanter and Büttiker [2000] Y. Blanter and M. Büttiker, Physics Reports 336, 1 (2000).
- Djukic and van Ruitenbeek [2006] D. Djukic and J. M. van Ruitenbeek, Nano Letters 6, 789 (2006).
- Lumbroso et al. [2018] O. S. Lumbroso, L. Simine, A. Nitzan, D. Segal, and O. Tal, Nature 562, 240 (2018).
- Zevenbergen et al. [2009] M. A. G. Zevenbergen, B. L. Wolfrum, E. D. Goluch, P. S. Singh, and S. G. Lemay, Journal of the American Chemical Society 131, 11471 (2009).
- Mathwig et al. [2012] K. Mathwig, D. Mampallil, S. Kang, and S. G. Lemay, Physical Review Letters 109, 118302 (2012).
- Kätelhön et al. [2013] E. Kätelhön, K. J. Krause, P. S. Singh, S. G. Lemay, and B. Wolfrum, Journal of the American Chemical Society 135, 8874 (2013).
- Singh and Lemay [2016] P. S. Singh and S. G. Lemay, Analytical Chemistry 88, 5017 (2016).
- Karnatak et al. [2017] P. Karnatak, T. Paul, S. Islam, and A. Ghosh, Advances in Physics: X 2, 428 (2017).
- Paladino et al. [2014] E. Paladino, Y. Galperin, G. Falci, and B. Altshuler, Reviews of Modern Physics 86, 361 (2014).
- Clément et al. [2007] N. Clément, S. Pleutin, O. Seitz, S. Lenfant, and D. Vuillaume, Physical Review B 76, 205407 (2007).
- Fragasso et al. [2020] A. Fragasso, S. Schmid, and C. Dekker, ACS Nano 14, 1338 (2020).
- Smalley et al. [1995] J. F. Smalley, S. W. Feldberg, C. E. D. Chidsey, M. R. Linford, M. D. Newton, and Y.-P. Liu, The Journal of Physical Chemistry 99, 13141 (1995).
- Heering et al. [1999] H. A. Heering, M. S. Mondal, and F. A. Armstrong, Analytical Chemistry 71, 174 (1999).
- Fujiwara et al. [2008] A. Fujiwara, K. Nishiguchi, and Y. Ono, Applied Physics Letters 92, 042102 (2008).
- Sarpeshkar et al. [1993] R. Sarpeshkar, T. Delbruck, and C. Mead, IEEE Circuits and Devices Magazine 9, 23 (1993), number: 6.
- Machlup [1954] S. Machlup, Journal of Applied Physics 25, 341 (1954).
- Clément et al. [2010] N. Clément, K. Nishiguchi, A. Fujiwara, and D. Vuillaume, Nature Communications 1, 92 (2010).
- Christie and Lingane [1965] J. H. Christie and P. J. Lingane, Journal of Electroanalytical Chemistry (1959) 10, 176 (1965).
- Tian et al. [2013] H. Tian, Y. Dai, H. Shao, and H.-Z. Yu, The Journal of Physical Chemistry C 117, 1006 (2013).
- Nerngchamnong et al. [2015] N. Nerngchamnong, D. Thompson, L. Cao, L. Yuan, L. Jiang, M. Roemer, and C. A. Nijhuis, The Journal of Physical Chemistry C 119, 21978 (2015).
- Gupta et al. [2021] N. K. Gupta, E. A. Wilkinson, S. K. Karuppannan, L. Bailey, A. Vilan, Z. Zhang, D.-C. Qi, A. Tadich, E. M. Tuite, A. R. Pike, J. H. R. Tucker, and C. A. Nijhuis, Journal of the American Chemical Society 143, 20309 (2021).
- Nijhuis et al. [2009] C. A. Nijhuis, W. F. Reus, and G. M. Whitesides, Journal of the American Chemical Society 131, 17814 (2009).
- Reuter et al. [2012] M. G. Reuter, M. C. Hersam, T. Seideman, and M. A. Ratner, Nano Letters 12, 2243 (2012).
- Fruhman et al. [2021] J. M. Fruhman, H. P. Astier, B. Ehrler, M. L. Böhm, L. F. L. Eyre, P. R. Kidambi, U. Sassi, D. De Fazio, J. P. Griffiths, A. J. Robson, B. J. Robinson, S. Hofmann, A. C. Ferrari, and C. J. B. Ford, Nature Communications 12, 4307 (2021).